designing medicaid delivery system reform incentive ... · january 2018 designing medicaid delivery...
TRANSCRIPT
January 2018
Designing Medicaid Delivery System Reform Incentive Payment Demonstrations to Reward Better PerformanceJessica Heeringa, Debra Lipson, Rachel Machta, Keanan Lane, and Rachel Vogt
1
Executive Summary
In the quest to improve care outcomes and manage cost growth, state Medicaid programs are pursuing Delivery System Reform Incentive Payment (DSRIP) demonstrations, operating under federal Medicaid section 1115 waiver authority. States differ in how they structure their DSRIP incentive designs with regard to: which types of providers or accountable entities are eligible; the size of the incentive payments; the way in which total funds are distributed among eligible providers; how different reform activities are valued; and the mix of performance requirements and measures over the course of the demonstration (that is, pay-for-activities, pay-for-reporting, or pay-for-performance).
This brief describes differences in incentive design features of six DSRIP demonstrations and assesses their strengths and limitations in promoting provider participation in delivery system reform and value-based payment (VBP) arrangements. While the effects of DSRIP incentive designs on outcomes are not yet known,thisstudyfindsthatdifferencesinkeydesignfeaturesinfluencethestrengthoftheincentivesforproviderstopartici-pate in delivery reform projects and their motivation to prepare for or engage in VBP arrangements.
Early DSRIP demonstrations, which tied the majority of funding to infrastructure development and pay-for-reporting, focused on building capacity among safety net providers while introducing them to pay-for-performance. Current DSRIP demonstrations have ramped up performance expectations – particularly for later years of the demonstration periods – and place a portion of state DSRIP funding at risk based on aggregate performance. Several lessons and insights can be drawn from state experi-ences to date:
• Themorecomplexthefinancialincentivedesign,theharder it is for providers to understand the link between their performance and expected earnings, which can dampen the overall strength of the incentives.
• Performance measure targets need to strike a careful balance between being ambitious and achievable, so they donotpenalizefinanciallyvulnerablesafetynetproviderswhich face greater challenges than other providers in meet-ing high performance targets.
• Alignmentoffinancialincentivesandperformancemetricsfor DSRIP eligible entities and Medicaid managed care organizations strengthens the impetus for these entities to prepare for and engage in value-based payment and alternative payment models.
THE MEDICAID CONTEXT
Medicaid is a health insurance program that serves low-income children, adults, individuals with disabilities, and seniors. Medicaid is administered by states and is jointly funded by states and the federal government. Within a framework established by federal statutes, regulationsandguidance,statescanchoosehowtodesignaspectsoftheirMedicaidprograms,suchasbenefitpackagesandpro-viderreimbursement.Althoughfederalguidelinesmayimposesomeuniformityacrossstates,federallawalsospecificallyauthorizesexperimentation by state Medicaid programs through section 1115 of the Social Security Act. Under section 1115 provisions, states may apply for federal permission to implement and test new approaches to administering Medicaid programs that depart from existing federal rules yet are consistent with the overall goals of the program and are budget neutral to the federal government.
Some states have used section 1115 waiver authority to implement delivery system reform incentive payment (DSRIP) demonstra-tions.SincethefirstDSRIPprogramwasapprovedin2010,thebreadthandspecificgoalsofthesedemonstrationshaveevolved,buteach aims to advance delivery system transformation among safety net hospitals and other Medicaid providers through infrastructure development, service innovation and redesign, and population health improvements. More recent DSRIP demonstrations have also emphasized increasing provider participation in alternative payment models, which intend to reward improved outcomes over volume.
2
• Progress towards reducing the use of high-cost, hospital-based care – a key aim of delivery system reform – may be hindered if most DSRIP funding is allocated to large health systems and hospitals, rather than community-based primary care providers and organizations.
Introduction
Through Medicaid Section 1115 Delivery System Reform Incentive Payment (DSRIP) demonstrations, the Centers for Medicare & Medicaid Services (CMS) and states seek to create incentives to motivate health care providers to engage in delivery system transformation and reward them for improving quality, efficiency,andhealthoutcomes.EarlyDSRIPdemonstrations,whichbeganin2010,soughttoconverttheuseofMedicaidsupplemental funds from direct hospital payments to cover uncompensated care costs to performance-based incentive models that make payments contingent on demonstrating betteroutcomesforMedicaidbeneficiaries,andtosomeextent,uninsured individuals. More recent DSRIP demonstrations, startingin2014,focusonpromotingdeliverysystemtransformation along the care continuum by linking a portion of DSRIP incentive funding to support, and motivate participation in, value-based payment (VBP) and alternative payment models (APMs), which tie payment to quality or other performance metrics. Each state’s DSRIP demonstration is designed to addressthespecificneedsofstateandlocaldeliverysystemsand pressing population health issues. However, all DSRIP demonstrations tie DSRIP funding to infrastructure development and capacity building and ultimately to performance on clinical quality, cost, and population health outcomes.
This issue brief is the fourth in a series that focuses on DSRIP implementation topics.1 The aims of this study are to understand thefactorsinfluencingthedesignoftheincentiveprogramindifferentstates,howfinancialandnonfinancialincentivesmotivateproviders to participate in delivery system transformation and VBP arrangements, implementation successes and challenges, and potential improvements to the design of incentives that can maximize the attainment of program goals. We examine DSRIP demonstrationsinsixstates,spanning2011through2017––California, Massachusetts, New Hampshire, New York, Texas, and Washington. For California and Massachusetts, we examine the previous and current DSRIP demonstrations. DSRIP demon-strations now in progress in Massachusetts, New Hampshire, and Washingtonareintheirfirstorsecondyearsofimplementation;thus,thedatapresentedforthesestatesreflectdemonstrationdesigns and early implementation experiences. Findings are based on information from three sources: key informant interviews, state demonstration special terms and conditions (STCs) and related attachments, and program documents available on state Medicaid websites (see Methods box).
This brief presents a conceptual framework for DSRIP incen-tive design, drawing on relevant literature, and describes the similarities and differences across states’ DSRIP designs. It thendiscussesthefactorsthatinfluenceincentivedesignwithinand across states and summarizes stakeholder views on the strengths and limitations of DSRIP incentive design features in promoting provider participation and improving outcomes. This brief concludes with lessons from states’ experiences to date in implementing incentive designs, synthesizing feedback from key informant interviews, which may be useful to other states planning similar programs.
DSRIP incentive designs in theory and in practice
State DSRIP demonstrations include multiple components that togetherinfluencetheincentivesforprovidersandmanagedcare organizations (MCOs) to engage in delivery system transformation and payment reform. For the purposes of this brief, we examined:
• Eligibility for DSRIP participation and incentive funding
• Financial incentives, including incentive amounts, payment models, the degree of provider risk-sharing, criteria for allo-cating funding across providers, and valuation of projects and methods
• Performance criteria and assessment, including targeted activities and outcomes and required performance levels
• Intersection between DSRIP and Medicaid managed care payment policy in advancing VBP arrangements
Most DSRIP demonstrations tie incentive funding to infrastruc-ture development, project implementation,2 measure reporting, and performance outcomes. The Health Care Payment Learning and Action Network (HCP LAN), a multistakeholder collabora-tive that tracks national progress toward the implementation of APMs,definesfourcategoriesofprogressivelysophisticatedpaymentmodels,withthefirstbeingfee-for-service(FFS).Category2modelsuseFFSreimbursement,buthavealinktoqualityandvalue.MoreadvancedAPMs(Categories3and4)tie a portion of provider reimbursement for health care services to performance quality metrics as well as costs, so that pro-viders can share any savings, and in some models, assume financialriskforincurredcoststhatexceedexpectedspending.3 MostDSRIPdemonstrationsgenerallyfallintoCategory2modelsin that they tie bonus payments to infrastructure development, implementation of delivery system projects, reporting of outcome measures, and ultimately performance on outcome measures.
3
Indeed, DSRIP demonstrations share features of other pay-for-performance(P4P)programs,suchastheMedicareValue-Based Purchasing Program, and Medicaid accountable care organizations (ACOs).4 Like these models, all DSRIP demonstrations tie a percentage of DSRIP incentive funding to performance on outcome measures. Further, like ACOs, some DSRIP demonstrations require multiple providers to work together as one entity and hold them jointly accountable for their performance. However, DSRIP demonstrations have several unique features. First, states often ascribe different values or “points” to various projects, implementation milestones, and out-comes, rather than valuing all activities, milestones, or metrics equally. Second, in addition to required projects and metrics, states allow providers to select optional projects and metrics from a menu, giving providers some discretion over which types of reforms to pursue. Third, most states allocate substantial pro-portions of DSRIP incentive funds to infrastructure and capacity building and project implementation in the initial years of the demonstration periods, rather than directly incentivizing perfor-mance outcomes at the outset. Thus, it is important to assess how the incentives unique to DSRIP motivate participation by different types of providers, and provider entities, in delivery system reform and VBP arrangements.
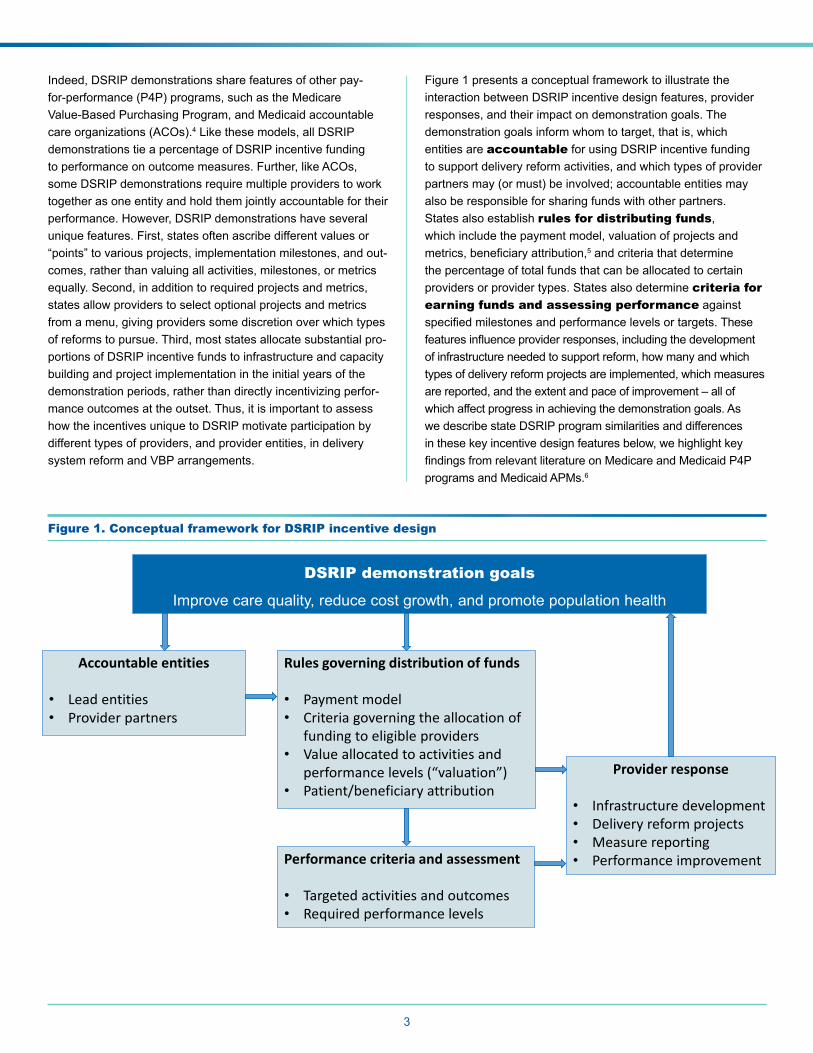
Figure 1 presents a conceptual framework to illustrate the interaction between DSRIP incentive design features, provider responses, and their impact on demonstration goals. The demonstration goals inform whom to target, that is, which entities are accountable for using DSRIP incentive funding to support delivery reform activities, and which types of provider partners may (or must) be involved; accountable entities may also be responsible for sharing funds with other partners. States also establish rules for distributing funds, which include the payment model, valuation of projects and metrics,beneficiaryattribution,5 and criteria that determine the percentage of total funds that can be allocated to certain providers or provider types. States also determine criteria for earning funds and assessing performance against specifiedmilestonesandperformancelevelsortargets.Thesefeaturesinfluenceproviderresponses,includingthedevelopmentof infrastructure needed to support reform, how many and which types of delivery reform projects are implemented, which measures are reported, and the extent and pace of improvement – all of which affect progress in achieving the demonstration goals. As we describe state DSRIP program similarities and differences in these key incentive design features below, we highlight key findingsfromrelevantliteratureonMedicareandMedicaidP4Pprograms and Medicaid APMs.6
Figure 1. Conceptual framework for DSRIP incentive design
DSRIP demonstration goals
Improve care quality, reduce cost growth, and promote population health
Accountable entities
• Lead entities• Provider partners
Rules governing distribution of funds
• Payment model • Criteria governing the allocation of
funding to eligible providers• Value allocated to activities and
performance levels (“valuation”)• Patient/beneficiary attribution
Performance criteria and assessment
• Targeted activities and outcomes• Required performance levels
Provider response
• Infrastructure development • Delivery reform projects• Measure reporting• Performance improvement
4
Eligibility for DSRIP participation and incentive funding
Eligible entity. AcriticalissueindesigningeffectiveP4Pprograms is determining whom to target and establishing accountability for outcomes. For example, certain measures, such as avoidable hospital readmissions, may require shared account-ability among multiple providers along the care continuum, while other metrics may be more directly under the control of individual clinicians(Greenwald2011).Thus,programsneedtodeterminewhich entities are accountable for achieving program goals and measures and design their programs accordingly (Miller and Marks2015).
StatesvaryinhowtheydefineeligibilityrequirementsforDSRIPparticipation and receipt of incentive funds. Certain states limit eligibility to hospitals or health systems, while others require regional collaborations that include multiple providers and organizations within a region that participate in DSRIP under the aegis of a lead organization.7 For example, New Hampshire and Washington require regional collaborations withrepresentationfromspecificprovidertypes,suchasfederallyqualifiedhealthcenters(FQHCs)andprimarycarephysicians, in addition to hospitals and health systems. The goals of the regional collaboration approach are to create shared accountability and promote partnerships across relevant stakeholders. Alternatively, California targets public health systems and district municipal hospitals through its current DSRIP demonstration (called Public Hospital Redesign and Incentives inMedi-Cal,orPRIME),andMassachusetts’firstDSRIPdemonstration, the Delivery System Transformation Initiatives (DSTI)whichendedinJune2017,targetedacutecarehospitals.
Regional collaborations take on different organizational forms. Texas’ Regional Healthcare Partnerships (RHPs) are regional consortia “anchored” by a lead organization that coordinates activities for performing providers in their regions. However, performing providers are evaluated as individual providers andearnDSRIPfinancialincentivesdirectly.Inotherstates,the regional collaborations are evaluated as a whole, serve as theaccountableentities,andassumesomeleveloffiduciaryresponsibility for the distribution of incentive funds to partnering providers. For example, New York’s Performing Provider Systems’ (PPSs’) performance is calculated across all participating providers, and PPSs earn incentive funding that is then disbursed among participating providers. Similarly, Integrated Delivery Networks (IDNs) in New Hampshire, Accountable Communities of Health (ACHs) in Washington, and ACOs in Massachusetts are assessed as single entities.
STATES’ DSRIP DEMONSTRATIONS GOALS
California’s DSRIP, Massachusetts’ Delivery System Transformation Initiatives, and Texas’ DSRIP demonstration sought to improve quality of care, enhance access, and build capacity among safety net hospitals and, in the case of Texas, other providers. Alternatively, more recent demonstrations emphasize delivery system transformation in the ambulatory setting and along the care continuum. In addition, all states seek to promote provider payment through VBP/APMs through DSRIP or other initiatives.
Eligibility requirements for lead entities within regional collaborations can also vary. Usually one organization (sometimes a hospital) acts as the lead, provides administrative and educational support, and functions as a convener of stakeholders. However, the scope of the lead’s role varies across, and sometimes within, states. In Texas, RHPs must be anchored by a public hospital or local governmental entity. In Washington and New York, regional collaboration requirements have resulted in the creation or strengthening of new entities that operate as independentnonprofitentitiessuchasACHsandPPSs.
Partnering providers. Underlying these regional collaborations are partnerships with providers and organizations that participate in DSRIP. New Hampshire, New York, and Washington include a variety of provider types, including primary care providers, behavioral health providers, and social service agencies. New Hampshire and Washington explicitly require representation from a broad range of providers and organizations. Unique among DSRIP states, Washington also includes tribes, Indian Health Service (IHS) providers, and Urban Indian Health Program (UIHP) providers in their ACHs.8
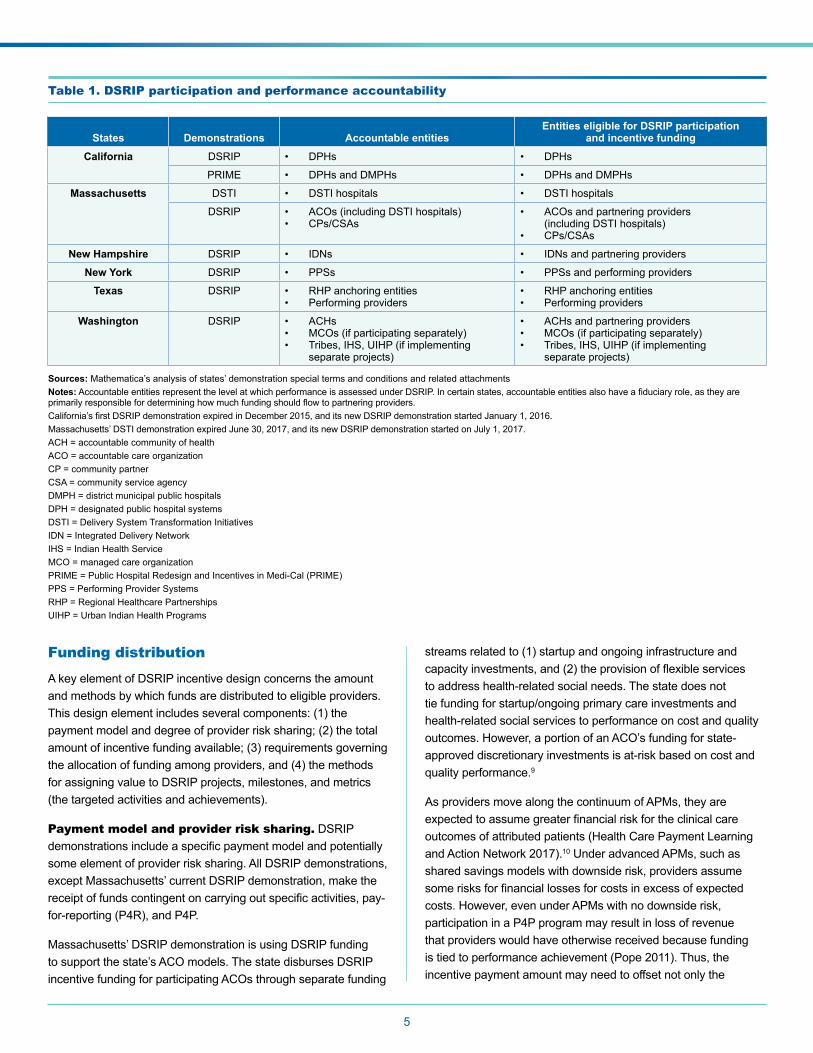
Other eligible entities. Other entities – outside of regional collaborations – may be eligible to participate and earn DSRIP incentive funding. Washington directly makes DSRIP incentive funding available to MCOs to encourage VBP/APM advancement. Washington also allows for tribes, IHS, and UIHP providers to receivefundingdirectlyfromthestateforeligibletribal-specificprojects. Massachusetts is making incentive funding available to community partners (CPs) in behavioral health (BH) and long-term services and supports (LTSS) and community service agencies (CSAs) to strengthen their ability to participate in ACOs. Table 1 presents an overview of the entities that are eligible for DSRIP participation and are held accountable for performance.
5
Table 1. DSRIP participation and performance accountability
States Demonstrations Accountable entitiesEntities eligible for DSRIP participation
and incentive funding
California DSRIP • DPHs • DPHs
PRIME • DPHs and DMPHs • DPHs and DMPHs
Massachusetts DSTI • DSTI hospitals • DSTI hospitals
DSRIP • ACOs (including DSTI hospitals)• CPs/CSAs
• ACOs and partnering providers (including DSTI hospitals)
• CPs/CSAs
New Hampshire DSRIP • IDNs • IDNs and partnering providers
New York DSRIP • PPSs • PPSs and performing providers
Texas DSRIP • RHP anchoring entities• Performing providers
• RHP anchoring entities• Performing providers
Washington DSRIP • ACHs• MCOs (if participating separately)• Tribes, IHS, UIHP (if implementing
separate projects)
• ACHs and partnering providers• MCOs (if participating separately)• Tribes, IHS, UIHP (if implementing
separate projects)
Sources: Mathematica’s analysis of states’ demonstration special terms and conditions and related attachments Notes:AccountableentitiesrepresentthelevelatwhichperformanceisassessedunderDSRIP.Incertainstates,accountableentitiesalsohaveafiduciaryrole,astheyareprimarilyresponsiblefordetermininghowmuchfundingshouldflowtopartneringproviders.California’sfirstDSRIPdemonstrationexpiredinDecember2015,anditsnewDSRIPdemonstrationstartedJanuary1,2016.Massachusetts’DSTIdemonstrationexpiredJune30,2017,anditsnewDSRIPdemonstrationstartedonJuly1,2017.ACH = accountable community of healthACO = accountable care organizationCP = community partnerCSA = community service agencyDMPH = district municipal public hospitalsDPH = designated public hospital systemsDSTI = Delivery System Transformation InitiativesIDN = Integrated Delivery NetworkIHS = Indian Health ServiceMCO = managed care organizationPRIME = Public Hospital Redesign and Incentives in Medi-Cal (PRIME)PPS = Performing Provider SystemsRHP = Regional Healthcare PartnershipsUIHP = Urban Indian Health Programs
Funding distribution A key element of DSRIP incentive design concerns the amount and methods by which funds are distributed to eligible providers. This design element includes several components: (1) the paymentmodelanddegreeofproviderrisksharing;(2)thetotalamount of incentive funding available; (3) requirements governing theallocationoffundingamongproviders,and(4)themethodsfor assigning value to DSRIP projects, milestones, and metrics (the targeted activities and achievements).
Payment model and provider risk sharing. DSRIP demonstrationsincludeaspecificpaymentmodelandpotentiallysome element of provider risk sharing. All DSRIP demonstrations, except Massachusetts’ current DSRIP demonstration, make the receiptoffundscontingentoncarryingoutspecificactivities,pay-for-reporting(P4R),andP4P.
Massachusetts’ DSRIP demonstration is using DSRIP funding to support the state’s ACO models. The state disburses DSRIP incentive funding for participating ACOs through separate funding
streams related to (1) startup and ongoing infrastructure and capacityinvestments,and(2)theprovisionofflexibleservicesto address health-related social needs. The state does not tie funding for startup/ongoing primary care investments and health-related social services to performance on cost and quality outcomes. However, a portion of an ACO’s funding for state-approved discretionary investments is at-risk based on cost and quality performance.9
As providers move along the continuum of APMs, they are expectedtoassumegreaterfinancialriskfortheclinicalcareoutcomes of attributed patients (Health Care Payment Learning andActionNetwork2017).10 Under advanced APMs, such as shared savings models with downside risk, providers assume somerisksforfinanciallossesforcostsinexcessofexpectedcosts. However, even under APMs with no downside risk, participationinaP4Pprogrammayresultinlossofrevenuethat providers would have otherwise received because funding istiedtoperformanceachievement(Pope2011).Thus,theincentive payment amount may need to offset not only the
costs of participation but also potential revenue losses (Pope 2011;Christiansonetal.2008).Further,providersmaytakeon “business risk” if they need to make upfront infrastructure investmentstoparticipateintheP4Pprogram(Pope2011).Indeed, a key barrier to participation in APMs among safety net providersisthefinancialreservesandresourcesneededtoinvest in data systems necessary to coordinate care and manage populationhealth(GovernmentAccountabilityOffice2016;BurnsandBailit2015;BailitandWaldman2016).Ingeneral,the uncertainty of whether these investments will be rewarded in terms of the incentive payment creates a perception of risk; the greater the perceived risk, the less likely providers may be to participate(Pope2011).
All current DSRIP demonstrations included in this study tie some portion of funding to performance, and all six states—except
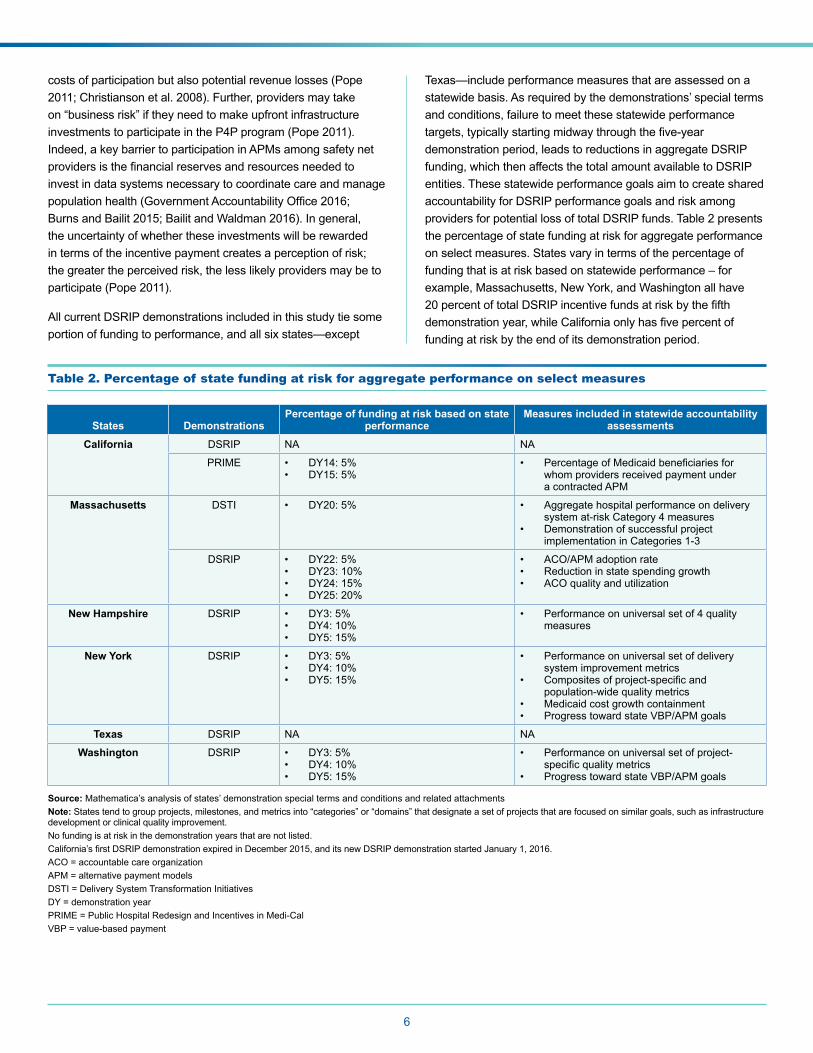
Texas—include performance measures that are assessed on a statewide basis. As required by the demonstrations’ special terms and conditions, failure to meet these statewide performance targets,typicallystartingmidwaythroughthefive-yeardemonstration period, leads to reductions in aggregate DSRIP funding, which then affects the total amount available to DSRIP entities. These statewide performance goals aim to create shared accountability for DSRIP performance goals and risk among providersforpotentiallossoftotalDSRIPfunds.Table2presentsthe percentage of state funding at risk for aggregate performance on select measures. States vary in terms of the percentage of funding that is at risk based on statewide performance – for example, Massachusetts, New York, and Washington all have 20percentoftotalDSRIPincentivefundsatriskbythefifthdemonstrationyear,whileCaliforniaonlyhasfivepercentoffunding at risk by the end of its demonstration period.
Table 2. Percentage of state funding at risk for aggregate performance on select measures
States DemonstrationsPercentage of funding at risk based on state
performanceMeasures included in statewide accountability
assessments
California DSRIP NA NA
PRIME • DY14:5%• DY15:5%
• PercentageofMedicaidbeneficiariesforwhom providers received payment under a contracted APM
Massachusetts DSTI • DY20:5% • Aggregate hospital performance on delivery systemat-riskCategory4measures
• Demonstration of successful project implementation in Categories 1-3
DSRIP • DY22:5%• DY23:10%• DY24:15%• DY25:20%
• ACO/APM adoption rate• Reduction in state spending growth• ACO quality and utilization
New Hampshire DSRIP • DY3:5%• DY4:10%• DY5:15%
• Performanceonuniversalsetof4qualitymeasures
New York DSRIP • DY3:5%• DY4:10%• DY5:15%
• Performance on universal set of delivery system improvement metrics
• Compositesofproject-specificandpopulation-wide quality metrics
• Medicaid cost growth containment • Progress toward state VBP/APM goals
Texas DSRIP NA NA
Washington DSRIP • DY3:5%• DY4:10%• DY5:15%
• Performance on universal set of project-specificqualitymetrics
• Progress toward state VBP/APM goals
6
Source: Mathematica’s analysis of states’ demonstration special terms and conditions and related attachments Note: States tend to group projects, milestones, and metrics into “categories” or “domains” that designate a set of projects that are focused on similar goals, such as infrastructure development or clinical quality improvement. No funding is at risk in the demonstration years that are not listed.California’sfirstDSRIPdemonstrationexpiredinDecember2015,anditsnewDSRIPdemonstrationstartedJanuary1,2016.ACO = accountable care organizationAPM = alternative payment modelsDSTI = Delivery System Transformation InitiativesDY = demonstration yearPRIME = Public Hospital Redesign and Incentives in Medi-CalVBP = value-based payment
7
Total incentive funding available. A foundational component of DSRIP incentive design is the amount of incentive funding available. The total amount of funding available in DSRIPdemonstrationsreflectsseveralfactors,includingstatenegotiations with CMS, historical funding streams that were repurposed for DSRIP, how the nonfederal share of Medicaid fundingisfinanced,theamountoffundingneededtostabilizesafety net providers, and the amount of funding needed to cover the costs of changing provider practice to participate in DSRIP.Thestrengthofthefinancialincentivesinpromotingchanges in provider practice in part depends on its relative size vis-à-vis providers’ current revenues and is therefore variable attheproviderlevel(Christiansonetal.2008;Eijkenaar2013).Further,thefinancialincentivesshouldbesufficientlylargetocover the costs of making the necessary changes to participate (Christiansonetal.2008;Pope2011).IndesigningtheirDSRIPdemonstrations, some states took such costs into account when calculating the total DSRIP funding amount.
Methods for funding disbursement
States specify various criteria that (a) govern the allocation of incentive funding among accountable entities and performing providersand(b)determinethefinancialvalueofDSRIPactivi-ties and performance criteria. These criteria are described below. Appendix Table A.1 provides more detail regarding the rules governing the allocation of funding and valuation methods.
Rules governing the allocation of funding among providers. All states attempt to target more funding to enti-ties with higher Medicaid (and sometimes uninsured) patient volumes and/or costs by incorporating this factor in the incen-tive funding allocation formulas that determine the percentage of total DSRIP funding available to participating providers. For example, California and Massachusetts’ DSTI demonstrations specifiedprovider-specific“proportionalallotmentfactors,”11 which are based on hospitals’ Medicaid patient volume, and in the case of California, uninsured patient volume as well. In New Hampshire, New York and Washington, accountable entities withthelargestnumberofattributedMedicaidbeneficiariesareeligible for a greater share of total DSRIP funding.12
State rules differ, however, regarding the allocation of DSRIP incentivefundingtospecifictypesofproviders.Statesinwhichtheaccountableentityisaregionalcollaborationleavethefundflowmethodology for distributing funding to participating providers to the discretion of the lead organization, subject to certain limitations. For example, the New York demonstration special terms and conditions set a cap of 5 percent of total PPS funds that can be allocated to providers that do not qualify as safety net providers. Among the stateswithregionalcollaborations,Texasrequiresthat75percentof each RHP’s annual DSRIP funding is allocated to hospitals, while the balance is allocated to nonhospital provider types, which
STATES’ APPROACHES TO FINANCING DSRIP DEMONSTRATIONS
SomestatesfinanceDSRIPincentivepaymentsusingrepurposed Medicaid supplemental streams, while others use new funding. California, Massachusetts’ DSTI, and Texas redirected prior supplemental funding to fund DSRIP incentive payments. Massachusetts’ DSRIP uses a combination of repurposed supplemental and new funding. Alternatively, New Hampshire, New York, and Washington use new sources offundingtofinanceDSRIPincentivepayments,suchasDesignated State Health Program funding.
ensures that hospitals receive a minimum share of repurposed supplemental funding.
Project and milestone/metric valuation. States calculate the value of DSRIP activities and achievements using similar methods. First, they specify the percentage of funding that can be allocated to each DSRIP activity or performance domain in each demonstration year (DY). Second, states assign weights, index scores, or base dollar values to activities, projects, and metrics based on various factors to signal the relative importance of these projects. In assigning these values, states often consider the anticipatedbenefitsofprojectstodeliverysystemtransformation,thenumberofbeneficiariesofaffected,andtheintensityofeffortrequired to achieve project milestones or metrics, among other factors. These scores and values are combined with each entity’s numberorpercentageofattributedMedicaidbeneficiariestodeterminethefinalmaximumvaluationortotalDSRIPincentivefunding that each DSRIP entity is eligible to earn.
Performance assessment
In all DSRIP demonstrations, the receipt of DSRIP funds is contingent on accountable entities’ performance relative to speci-fiedmilestonesandmetrics,whichcorrespondtodeliverysystemreform goals and objectives. Milestones are the activities that providersmustcompletewithinaspecifiedtimeframetoreceivethe incentive payment. Metrics are quantitative measures with definednumeratorsanddenominatorsthatprovidersmusteitherreport(P4R)orachieveorimproverelativetoaspecifiedtarget(P4P)toreceiveincentivefunding.Definingandmeasuringthesetypes of activities and the mix of these measures that qualify for DSRIP funds determines which delivery system reforms are incentivized, as well as the level and pace of those reforms.
Activity milestones. In the initial year of the DSRIP demonstrations, most states allowed their funds to be used for planning and organizational activities. In California, New Hampshire, New York and Texas, nearly all DSRIP funds could be spent in the initial year on planning and organizational setup, as long as certain milestones, such as submitting community
needs assessments and board member composition, were met. Washington’sdemonstrationsetsacapof25percentofDSRIPfundsforACHdesignactivities.Acrossstates,inthefirstseveralyears of the demonstrations, the majority of funding is also contingent on implementing delivery reform projects and meeting milestones associated with those projects. Projects generally fall into one of three types: (1) infrastructure and workforce development, such as setting up new primary care clinics and hiringcommunityoutreachworkers;(2)serviceinnovationandredesign, such as integrating primary care and behavioral health services, and (3) population health, such as promoting early prenatal care.
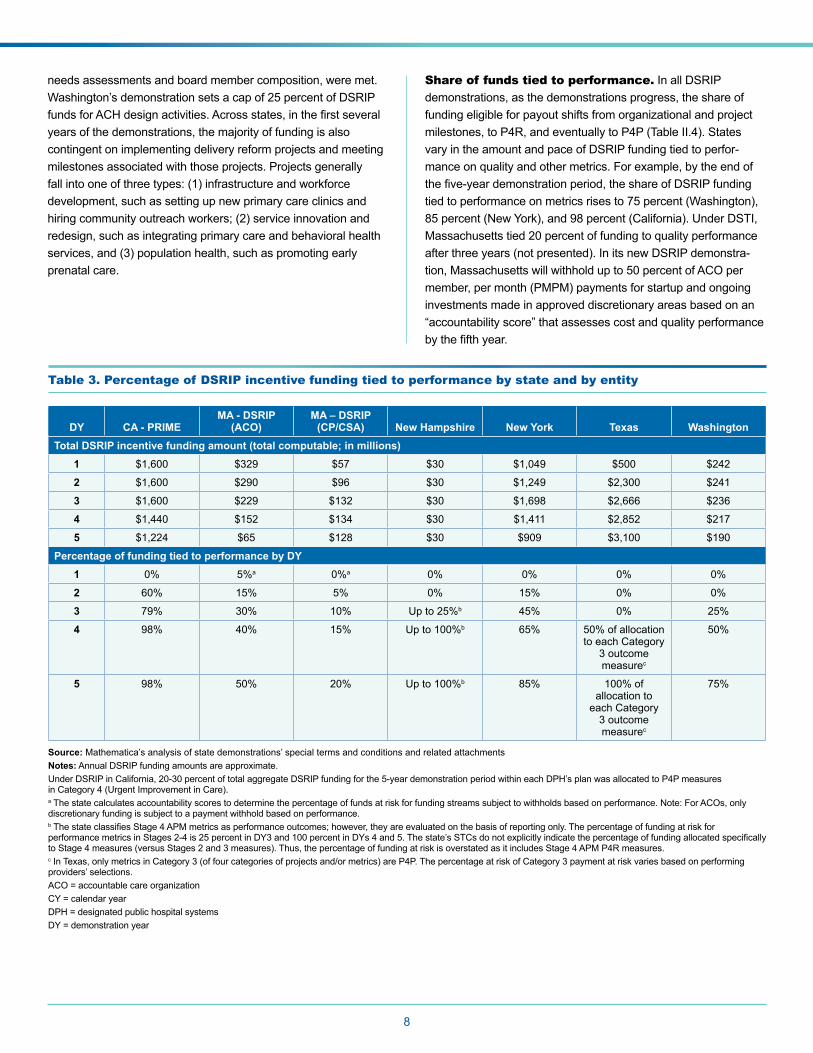
Share of funds tied to performance. In all DSRIP demonstrations, as the demonstrations progress, the share of funding eligible for payout shifts from organizational and project milestones,toP4R,andeventuallytoP4P(TableII.4).Statesvary in the amount and pace of DSRIP funding tied to perfor-mance on quality and other metrics. For example, by the end of thefive-yeardemonstrationperiod,theshareofDSRIPfundingtiedtoperformanceonmetricsrisesto75percent(Washington),85 percent (New York), and 98 percent (California). Under DSTI, Massachusettstied20percentoffundingtoqualityperformanceafter three years (not presented). In its new DSRIP demonstra-tion,Massachusettswillwithholdupto50percentofACOpermember, per month (PMPM) payments for startup and ongoing investments made in approved discretionary areas based on an “accountability score” that assesses cost and quality performance bythefifthyear.
Table 3. Percentage of DSRIP incentive funding tied to performance by state and by entity
DY CA - PRIMEMA - DSRIP
(ACO)MA – DSRIP
(CP/CSA) New Hampshire New York Texas Washington Total DSRIP incentive funding amount (total computable; in millions)
1 $1,600 $329 $57 $30 $1,049 $500 $242
2 $1,600 $290 $96 $30 $1,249 $2,300 $241
3 $1,600 $229 $132 $30 $1,698 $2,666 $236
4 $1,440 $152 $134 $30 $1,411 $2,852 $217
5 $1,224 $65 $128 $30 $909 $3,100 $190
Percentage of funding tied to performance by DY1 0% 5%a 0%a 0% 0% 0% 0%
2 60% 15% 5% 0% 15% 0% 0%
3 79% 30% 10% Upto25%b 45% 0% 25%
4 98% 40% 15% Upto100%b 65% 50%ofallocationto each Category
3 outcome measurec
50%
5 98% 50% 20% Upto100%b 85% 100%ofallocation to
each Category 3 outcome measurec
75%
8
Source: Mathematica’s analysis of state demonstrations’ special terms and conditions and related attachments Notes: Annual DSRIP funding amounts are approximate. UnderDSRIPinCalifornia,20-30percentoftotalaggregateDSRIPfundingforthe5-yeardemonstrationperiodwithineachDPH’splanwasallocatedtoP4Pmeasures inCategory4(UrgentImprovementinCare).a The state calculates accountability scores to determine the percentage of funds at risk for funding streams subject to withholds based on performance. Note: For ACOs, only discretionary funding is subject to a payment withhold based on performance.bThestateclassifiesStage4APMmetricsasperformanceoutcomes;however,theyareevaluatedonthebasisofreportingonly.ThepercentageoffundingatriskforperformancemetricsinStages2-4is25percentinDY3and100percentinDYs4and5.Thestate’sSTCsdonotexplicitlyindicatethepercentageoffundingallocatedspecificallytoStage4measures(versusStages2and3measures).Thus,thepercentageoffundingatriskisoverstatedasitincludesStage4APMP4Rmeasures.cInTexas,onlymetricsinCategory3(offourcategoriesofprojectsand/ormetrics)areP4P.ThepercentageatriskofCategory3paymentatriskvariesbasedonperformingproviders’ selections.ACO = accountable care organizationCY = calendar yearDPH = designated public hospital systemsDY = demonstration year
9
Type and mix of metrics. SeveralfactorsinfluencewhichmeasuresareusedinP4Pprograms.Tomotivateproviderstoparticipate,P4Pprogramsshouldincludemeasuresinwhichcurrent performance scores indicate room for improvement by mostproviders(Dambergetal.2014b;RyanandDamberg2013).Further,outcomemeasuresshouldhaveaclearevidencebase and be viewed by providers as being clinically important (Kondoetal.2016).Processmeasuresshouldbeclearlylinkedtotargeted outcome measures – serving as guideposts to help pro-viders improve on the targeted outcomes – and should measure processes that are within the accountable entities’ control (Pope 2011’Kondoetal.2016).P4Pprogramsshouldalsoincentivizea balanced mix of structure, process, and outcome measures (Dambergetal.2014b).Further,itisimportanttoincludeabroadset of measures to avoid narrowing providers’ focus to a few measures that may affect large numbers of people, while ignoring those that affect fewer people but are large cost drivers (Damberg etal.2014b).However,alargemeasuresetcandiffuseprovid-ers’ attention across too many areas and create a large reporting burden. Thus, programs need to select a set of measures that allows providers to focus on targeted behaviors and outcomes (Dambergetal.2014b;Eijkenaar2013).
For reporting and performance metrics, states typically include some measures from the CMS Core Sets of Adult and Child HealthCareQualityMeasuresforMedicaidandtheChildren’sHealth Insurance Program (CHIP).13 Most of the measures in these sets are nationally standardized measures, such as those endorsedbytheNationalQualityForum,NationalCommitteeforQualityAssurance’sHealthcareEffectivenessDataandInforma-tion Set© (HEDIS) measures for assessing health plan perfor-mance,14 and Consumer Assessment of Healthcare Providers and Systems® (CAHPS) experience of care measures, devel-opedbyAgencyforHealthcareResearchandQuality(AHRQ).For example, HEDIS measures include cancer screening rates, control of high blood pressure, and follow-up care after a hospi-talization. Utilization rates for hospital admissions, readmissions, andemergencyroomvisitsareoftenincludedinP4RandP4Pmeasure sets, since one of the major goals of DSRIP demonstra-tions is to substitute costly hospital-based care with primary and ambulatory care. Potentially avoidable hospitalizations, measured byAHRQPreventionQualityIndicators(PQI)andPediatricQual-ity Indicators (PDI), which may or may not be risk-adjusted, are also frequently included in state DSRIP program measure sets.
The prevalence of mental health and substance use disorders in the Medicaid and uninsured populations has led to a focus in some states, including New Hampshire, on standardized measures that focus on behavioral health (BH). These include such measures as (1) all-cause hospital readmissions for the BH population;(2)standardizedassessmenttoscreenforsubstanceuse and depression; (3) potentially preventable emergency department visits for the BH population and total population; and
(4)initiationofalcoholandotherdrugdependencetreatmentwithin14days.
Because most nationally standardized measures are clinically oriented,ornotspecifiedforuseamongMedicaidpopulations,manystatesaddstate-specific“home-grown”metrics,particularlyfor population health and innovative projects. For example, in Cal-ifornia, if standardized metrics are not available, or ad¬equately assess success, a set of “innovative metrics” is used, comprising about20percentofPRIMEmetrics.Examplesincludeevidenceof technology-based visits, targeted care coordination for high risk patients, and specialty care consultation.15 In Washington, population health metrics include the percentage of patients who are homeless or arrested.
When DSRIP-eligible providers, rather than MCOs, are respon-sible for meeting VBP goals, VBP metrics that measure progress toward VBP/APM adoption may also count towards DSRIP funding requirements. For example, in Massachusetts, eligible hospitals that participated in DSTI were expected to build capac-itytoparticipateinAPMsbydevelopingdataandriskstratifica-tion systems. In Massachusetts’s new DSRIP demonstration, participating entities earn incentive funds for infrastructure and capacity investments, as well as the provision of health-related social services, to develop ACOs which are paid via APMs.16 In Washington,ACHsareexpectedtosharefinancialriskforVBPprogresswithMedicaidMCOs.InCalifornia,byJanuary2018,all designated public hospital systems (DPHs) must contract with at least one Medicaid managed care plan in their service area throughanAPM.Inaddition,50percentofthestate’sMedicaidmanaged care enrollees assigned (or attributed) to one of the DPHs must receive all or a portion of their care under a con-tractedAPM,whichincreasesto55percentbyJanuary2019and60percentbytheendofthewaiverperiodin2020.In2019and2020,5percentoftheannualstatewideallocationPRIMEpoolamount for all public health care systems will depend on meeting these goals.
Performance targets. Performance targets in incentive programs should be set in relation to program goals and baseline performance, and ideally should encourage providers to improve regardless of where they stand along the performance continuum. Because providers are more responsive to targets that are within reach, programs need to set targets that are viewed as ambitious butstillfeasibletoattain(Ryanetal.2012;RyanandDamberg2013;Eijkenaar2013;Eijkenaaretal.2013).Onemethodisrewarding both performance attainment (that is, achievement of a high-performance benchmark) and improvement (that is, perfor-mancegainsoverpastperformance)(RyanandDamberg2013;Dambergetal.2014a).
InsettingthethresholdthatqualifiesforachievingP4Pmea-sures, state DSRIP demonstrations generally adopt one of three following benchmarks, to which provider performance levels are
10
compared. Benchmarks vary depending on whether the measure is established, and therefore has the necessary historical data to calculate a national or state benchmark, or newly created. Table A.2intheappendixprovidesmoredetailsonthestates’perfor-mancetargetsforP4Pmeasures.
1. A national or statewide mean, or a specified percentile. California, for example, assesses DPH performanceagainstthe25thand90thpercentilesofthestateperformancedistributionforeachmeasure.InDYs2-5,DPHsmustmeetaminimumperformancethreshold(25thpercentile of the established benchmark) to receive funding.
2. Degree of improvement in the provider’s previous performance. When there are no national or state bench-marks, states often allow eligible providers to receive funds if they meet minimum levels of improvement over a prior year. Texas, for example, requires improvement by 5 percent inDY4and10percentinDY5formeasuresforwhichnonational or state benchmarks were available.
3. Degree of improvement or progress towards a specified performance level. This benchmarking approachisahybridofthefirsttwo,commonlyknownasclosing the “gap-to-goal,” and requires eligible providers to close, or narrow, the gap from their baseline or annual perfor-mancebyacertainpercentagerelativetoaspecifiedperfor-mance target (for example, a state benchmark) to reach an “achievement value.” In California, for example, in addition to performing above the minimum threshold, providers must close the gap between their current performance and the topperformancethreshold(90thpercentile)byatleast10percent each year to receive funds. Systems that are already atthe90thpercentileoraboveonametricmustmaintainthat level of performance to receive funding. New York set a minimum10percentgap-to-goalclosureforeachmeasuretoearnfunds.Washingtonsetahigherbar––25percentgap-to-goal closure––but allows providers to earn a portion of the achievement value for making partial progress.
Tying DSRIP incentives to VBP progress
Like DSRIP demonstrations, VBP initiatives and APMs are designed to hold providers accountable for cost and quality outcomes, as well as population health management. As part of Medicaid DSRIP demonstrations,statesoftensetspecificgoalsandrequirementsfor DSRIP providers and/or Medicaid MCOs to participate in VBP and APM arrangements. State policymakers view VBP/APM demonstration goals as the major strategy for sustaining delivery reforms after the demonstrations end. By shifting the source of the payment from the state to Medicaid MCOs, they believe that DSRIP-eligible safety net providers will face continued incentives to transform care delivery in ways that produces better outcomes at lower cost, or reduced rates of cost growth.
All six of the states examined in this study have set VBP or APM goals, although they differ in several respects, including (1) the accountableentity,(2)theVBPtargetsandAPMcategories(financialrisklevels)thatmustbeachievedbyendofdemonstra-tion,(3)penaltiesandenforcementmechanisms,and(4)theservices, populations, or types of MCOs that are included or excluded from the VBP/APM goals. In addition, Massachusetts, New York and Washington allocate a portion of DSRIP funds to help providers and/or MCOs prepare for and meet VBP goals and have sought to align concurrent incentives to achieve their VBP goals.Forexample,NewYorkestablishedtheQualityIncentiveProgram, which administers funding through MCOs to support financiallydistressedhospitalsandrewardthemforrapidcon-tracting via VBP, to support its DSRIP demonstration.17
Accountable entities for VBP/APM progress. Four of the six states – New Hampshire, New York, Texas, and Wash-ington – place primary responsibility with Medicaid MCOs for achieving VBP/APM goals and sometimes specify managed care requirements related to VBP/APM advancement outside of their DSRIP demonstrations. In these states, the requirement is expressed as a percentage of Medicaid payments made by each plan to all contracted providers through VBP/APM arrangements, including safety net providers that receive DSRIP funds. Under California’s PRIME demonstration, DPHs are responsible for meeting VBP/APM goals, expressed as the percentage of their attributed patients whose care (in whole or in part) is paid through APMs. Under Massachusetts’ DSRIP demonstration, the state is responsible for meeting a statewide ACO/APM adoption rate, definedasthepercentageofACO-eligiblemembersenrolledin or attributed to ACOs or who receive services from providers paid under APM. Although not explicitly part of its DSRIP dem-onstration,TexasisrequiringitsMCOstodisburse25percentof provider payments through any type of VBP in calendar year 2018,increasingto50percentby2021.18 Washington will set aside up to 15 percent of DSRIP incentive payments to reward VBP progress among both ACHs and MCOs.
VBP/APM goals and targets. As with the share of DSRIP funds tied to achieving performance targets, states gradually increase the share of Medicaid managed care payments to providers that must made through an APM arrangement, or the servicesprovidedtobeneficiariesattributedtoanACOorAPM.Bythefifthyearofthedemonstration,thetargetrangesfrom50percentofpaymentsinVBPofanytypeinNewHampshireto90percent in Washington. The share of VBP/APM payments that must be risk-based, that is, those that fall into Categories 3 or 4oftheHCP-LANframework,19 are generally lower––by half or more––than the overall VBP/APM target level. For example, the fifth-yeargoalinNewYorkisthatMCOpaymentstoprovidersthroughAPMswillbe35percentforLevel2orhigher(corre-spondingtoHCP-LANcategory3Band4)comparedtoitsoverallgoalof80to90percentofallMCOpayments.Washington
11
makes further allowances by counting payments in HCP-LAN Category 3A (shared savings with upside risk only) as risk-based, andspecifyingthefifthyeartargetas50percentofMedicaidpay-ments made at that level or higher.
Key findings regarding DSRIP incentive design in practice
Based on the perspectives and experiences of key informants involved in each state’s DSRIP demonstration, and our analysis ofprogramdocuments,weidentifiedseveralthemesregardingfactorsthatinfluencedincentivedesign,whethertheyfacilitateor impede provider participation, and how stakeholders view their potential impact on progress towards delivery reform goals.
Eligibility for DSRIP participation and incentive funding
Some states allow regional accountable entities to decide how to allocate DSRIP funds to community-based providers, while others make such payments directly to community-based providers. However, it is not yet clear whether one model will be more effective in reducing avoidable hospital care and increas-ingcarequalityandefficiency.InMassachusetts,onepolicy-maker noted that allocating incentive funding to CPs directly is important “because we believe medical care alone does not lead to better health status, so we are using DSRIP funding to support community-based organizations that are providing care coordination supports to people with behavioral health and long-term services and supports [needs].” Noting that CPs delivering such services must contract with an ACO to receive DSRIP incentive funding, the state representative added, “By using this significantcarrot,wecreatedanincentivestructuretotrytogetthe ball moving in the direction of further integration.”
At the same time, some regional collaborations are using DSRIP funds to forge strong partnerships with community-basedproviders. As one lead in Washington noted, “because of the DSRIPdollars,allofourFQHCsarenowactivelyinvolved.Ithink our engagement with tribal and Native American health partnersissignificantlymorerobustthan[itwasbefore]....”
Facilitators of provider participation. Even if they are eligible to receive funds, other factors affect providers’ decisions to participate in DSRIP, including (1) alignment between DSRIP goalsandorganizationalgoals;(2)interestinbeingatthetableto shape the direction of the DSRIP demonstration given its scale; and (3) preexisting relationships. For example, in New Hampshire, a lead provider noted that their organization wanted to participate because it aligned with, and supported, their transformation goals, explaining: “We’ve been pushing integra-tion since I’ve been here. … DSRIP began to expand these efforts throughout our community....” Other lead organizations
noted that they wanted to participate to “shape the direction” of the DSRIP demonstration. Stakeholder observed that the representation of community-based organizations on govern-ingboardshelpedtoensureequitablefundflowdecisions.Inaddition, providers who built their regional collaborations on preexisting relationships found that it gave them a head start. For example, some ACHs in Washington and PPSs in New York were able to build accountable entities on historic relationships. As one state policymaker in Washington described, “I feel like webenefitedgreatlybyhavinga5-yearinnovationplan[throughthe State Innovation Model Award], strong buy-in across sectors and startup activity related to value-based purchasing efforts…which all pre-dates our Medicaid demonstration.”
Challenges related to eligibility requirements. While statepolicymakersandleadentitiesespousedthebenefitsofregional collaborations, certain state rules sometimes created challenges. In states that allowed overlapping regions, such as New York, large health systems were motivated to participate in multiple collaborations, increasing resource demands. In addition, the boundaries of the PPSs in New York and RHPs in Texas did not always align with patient care delivery patterns, which made it hard to predict how delivery reform projects would translate into performance metrics and ultimately receipt of incentive funds.
Funding distribution
Size of financial incentives in DSRIP. Overall, provid-ers participating in DSRIP demonstrations view the amount of fundsavailablethroughDSRIPtobesubstantialandsufficienttomotivate their involvement. In mature demonstrations, provid-ers believed the incentive funding helped safety net providers make critical investments. As one provider in Massachusetts noted, “We used some DSTI funding for ACO development . . . community-basedcarecoordination,andsolidifiedourrelation-ship with community health centers….. [DSTI dollars also] have been helpful in supporting our evolution [to prepare for VBP].” For newer demonstrations, the amount of incentive funding appeared to motivate provider engagement in working towards the goals of DSRIP, but the effects are not yet clear. As one policymaker noted, “The structure of [the demonstration] does create a motivation for these [providers] to meet challenging performance milestones and [gives them] the opportunity to earnintheaggregatemorethan$3billionoverfiveyears.”How-ever, some providers caution that the available incentive funding may be too small relative to the needed changes.
Performance-based payment and the perceptions of risk. Even though most DSRIP demonstrations do not formally involve provider risk sharing, providers say that achieving the targeted outcomes requires considerable changes and effort. Therefore, providers tend to perceive DSRIP payment as being at risk, even though they are not liable for actual losses as they
12
would be in advanced APMs.20 As one Texas provider noted, “At the outset of DSRIP, the perceived risks were really about pay for performance and the idea that an organization had to invest in a new program without any insurance that they would achieve metrics and get paid.” They perceive a tension between want-ing to make the upfront investments to participate in DSRIP and achieve the targeted outcomes, while at the same time relying on the funds to cover the cost of healthcare services to low-income populations. Nonetheless, some providers have accepted the realityofP4P.AsoneproviderinCalifornianoted,“…thebot-tom line is that we need the [DSRIP] money to be able to make improvements in infrastructure, staff, training, and in systems, but we should have the money at risk. Even with earn-backs and over-performanceopportunities,we’regoingtomake90to95percent, maybe, of the metrics. Some are just hard, the bar is set high, and the money is truly at risk, and I think that’s fair.”
Rules governing the allocation of funding among providers. Stakeholders in California believe that proportional allotment factors were necessary to fairly allocate funding to safety net providers based on the relative size of their Medicaid and uninsured populations. One policymaker noted that it might have been preferable to set up a simpler process, but: “we’re talkingaboutsignificantdollarsforthesesystemsand[wedid] not want to destabilize [them] by giving them less money [than they received before].” In Texas, stakeholders viewed the higher percentage allocations to hospitals as being fair given that DSRIP repurposed historic hospital supplemental funding streams.
Project and metrics valuation. Overall, valuation methodsdesignedbythestatesreflectspecificgoalsofthedemonstrations. For example, New York deliberately incentiv-ized speed and scale of delivery system transformation activities in its valuation method. However, understanding the merits or drawbacks of states’ valuation methods is challenging for stakeholders given the breadth of projects and metrics that are included in DSRIP. In Texas, a key consequence of the state’s approach to valuation was that some providers did not place enough value on their work when they valued project milestones and metrics at the start of the demonstration. Small and rural providers were particularly affected by this issue.
Balance of state and regional control over fund flow mechanics. In states that designate regional collaborations asaccountableentities,leadorganizationssetthefundflowmethods. Washington and New Hampshire state policymakers viewed their role as establishing network composition require-mentsandaframeworkforgovernanceandfundflow.Statepolicymakers recognized the challenge of these discussions and believethatdeferringdecisionsregardingfundflowtotheleadorganizations and their partnering providers “…forced the net-workstohavethesedifficultconversationswithoneanother…”to build the foundation for their collaborative work.
“That’s the nature of this work, trying to balance state ownership and responsibility for the Medicaid program with local direction and needs determined locally. It would be an error to try to infuse ourselves into every one of these programmatic decisions, which need to be owned locally.”
–State policymaker
Leadentitiesindicatedthattheystructuretheirfundflowmethods with particular goals in mind. For example, a lead provider in New Hampshire offered a bonus incentive payment to incentivize primary care providers to participate in its network. In Washington, a lead entity indicated that its ACH planned to focus on equitable payment for equal achievement across small and big providers. In Texas, an RHP anchor indicated that they sought to ensure consistency in valuation among performing providers based on the number of projects they implemented.
However, some providers in states with regional collaborations felt that hospitals often dominate the governing boards and receiveamajorityofDSRIPfundsflowingthroughthem.Inaddition, one provider representative in New York noted a lack of meaningful engagement of community health centers within some PPSs.
Facilitators of DSRIP incentives. Several factors strengthenedDSRIPfinancialincentivesandpotentiallyincrease the ability of states to achieve overall DSRIP goals. First,manystakeholdersnotedthepowerfulnonfinancialincen-tivesthataugmentedthefinancialincentivesofDSRIP.InNewHampshire and Washington, stakeholders noted the widespread recognition of impending delivery and payment reforms by pay-ers other than Medicaid as motivating participation. Second, the need to contain Medicaid cost growth is an important motivator. As one Massachusetts provider representative acknowledged, “[If we do not reduce cost growth], Medicaid will have to reduce eligibility,benefits,orpaymentstous,allofwhichcompromiseour ability to take care of people. We saw the writing on the wall, so were concerned about sustainability of Medicaid, and we knew we needed to move away from fee for service.” Third, some providers noted the value of the opportunities in their DSRIP demonstrations to earn incentive funding for high perfor-mance, which might improve their bottom lines.
Challenges affecting the strength of the financial incentives. A number of factors weaken the perceived strengthofDSRIPfinancialincentivestopromotedeliverysystem reform. First, in states that used repurposed supplemen-tal funding streams, safety net hospitals continue to depend on DSRIP funds to support operating costs. As one provider noted, “[DSRIP] dollars really were needed to make up for Medicaid paymentdeficienciesanduncompensatedcare,sotheywentinto the hospital operating budget.” Second, relying on hospitals
13
tofinancepartofthenonfederalshareofDSRIPfundseffec-tively reduces the amount of incentive funding they earn for DSRIP achievements. As one provider representative said about the adequacy of incentive funds to support delivery reforms, “The whole concept of ‘adequate’ is a tough one for us, for lots ofreasons,oneofwhichbeingthatweself-financetheprogram,the nonfederal share comes from [us], so putting up a dollar and getting50centsback,you’reout50cents.”
Performance assessment
Mix of activities incentivized through DSRIP. Provid-ers generally view DSRIP milestones as targeting meaningful delivery reform activities. As one IDN lead in New Hampshire noted, “When it comes to clients, we’re improving our transitions of care, which is what DSRIP is about. … as we’ve built these systems,we’veseenthebenefits.”Othersbelievedtheprojectsand outcomes are motivating system-wide change. One Cali-fornia stakeholder thought that the structure of the new PRIME demonstration requires providers to “look across systems to think about how they are integrating their interventions, data analytics capacities, clinical improvement.” One ACH lead in Washington echoed this view: “we’re trying to move away from thinking of these as [individual] projects.” Instead, providers view the activities as building a coordinated system of care.
Length of time to transition to P4P.Stateofficialsandprovider organizations agree that most hospitals needed a period of time to transition from supplemental payments to a P4Pmodel.Thismodelrequiresproviderstoassesstheircur-rent performance against a set of metrics, develop and imple-ment strategies to improve performance relative to goals and targets, and develop systems to collect data and report mea-sures. In some cases, several years were needed to specify and test new measures and determine the appropriate benchmarks based on statewide averages.
For example, according to a New York policymaker, “We agreed you couldn’t just stand up a [new entity] and expect it to be able to perform overnight. So we developed a 6-year timeframe. The firstyeargave[theentities]timetocoalesce,figureouthowtogovern themselves, conduct a community needs assessment, and bring together an advisory group made up of providers and Medicaid members. Then, they needed to build the capacity to report process-type measures, and eventually move to outcome measures.”Manyintervieweessawotherbenefitstorequiringproviderstoreportprojectmilestonesandprocessmetricsfirst.While some providers viewed the initial milestones as “check the box” measures and believed that there were too many process measures, it forced them to track their performance and comply with reporting requirements. Others said the milestones and processmetricswerenecessaryprerequisitestoP4Pmea-sures in later years. For instance, progress in development of a multidisciplinary palliative care team builds the foundation for
subsequent metrics that gauge the provision of palliative care for patients with certain diagnoses.
HowsoonthetransitiontoP4Pshouldoccurremainsamat-ter of debate. Several provider representatives pointed to the importance of DSRIP funds to build the infrastructure to sup-port delivery reform, noting that “…some changes take 3 to 5 years to mature” and moving from project activities to system widemetricstiedtoP4Ptakestime–“…morethanthestateallowed.”
Mix of national and state-specific measures. All stakeholders agreed that the selection of nationally standard-ized or endorsed measures was important to obtain buy-in from providers and to create improvement targets pegged to national or state performance benchmarks. However, the lack of stan-dardized measures for several areas critical to Medicaid, such as complex care management, opioid use, and social deter-minants of health required states to develop new measures. Such “innovative measures” need to be tested, and in some casesentailasignificantreportingburden.Asoneproviderrepresentative noted, “We’re always in support of using nationally standardized measures, for example, HEDIS measures, but the state came up with some customized measures, which are more difficulttoreport.”Whenstandardizedmeasuresdidnotexistforcertainareas,somestatesomittedthementirely,makingitdifficultfor providers to demonstrate progress towards delivery system reform goals.
Performance targets. Many interviewees agreed that basing DSRIP fund awards on providers’ ability to close the gap from current performance to a goal offers a strong incentive to improve, no matter where they start. Several also believe it is important to reward partial credit for narrowing the gap, especially for measures that are harder to improve, and for providerswithfewerresourcestomakesignificantprogress.As a Washington policymaker noted, the state established the DSRIPperformancetargetatthe90percentileformostmetrics,withthegaptogoalfittingunderneathit.Partialachievementinthe gap-to-goal target incentivizes continuous improvement by allproviders,eveniftheydonothitthe90thpercentile,accord-ing to the policymaker. Another state policymaker shared the concern that only awarding full achievement of the gap-to-goal target may inadvertently narrow providers’ attention to those measures for which full achievement is possible. A provider representative cautioned that “Each hospital has the same goal – reducing readmissions – but they vary in their ability to control what happens in post discharge settings, and in the resources they have to address the full continuum of care. Those are real factors affecting in how much you can actually improve.” Another provider noted that some measure targets did not take into account differences in hospital characteristics and patient populations that affect performance.
14
Facilitators of achieving performance targets. Several factors other than DSRIP incentives have created “tailwinds” increasing the speed with which hospitals or provider entities are able to achieve certain performance targets. For example, even before the start of some states’ DSRIP demon-strations, the rate of hospital readmissions was declining due to penalties imposed by the Medicare Hospital Readmissions ReductionProgram(CareyandLin2016;Zuckermanetal.2016),increaseduseofoutpatientsurgery,andothertrends,which helped most providers meet measure targets. In addition, most performance targets were easier to achieve than some had predicted. According to one interviewee in New York: “There wasconcernthatsomehospitalswouldparticipateforthefirst2–3years,anddropoutafterthatbecausetheycouldn’tachievethepay-for-performancetargetsinlateryears.However,Year2goalswereloweronallthemeasures,soclosingthe10percentgap-to-goal [target] was pretty easy on almost every measure.”
If some of the performance targets are relatively easy to achieve, it may be because the bar was intentionally set at what most stakeholders viewed as achievable. For example, New York’s demonstration terms and conditions require the state to improve on the majority of delivery system metrics––not all of them. In California, where the measures and targets were set through an iterative process involving the state, CMS and hospitals, the performance measures selected were based on attempting to strike a balance between what was achievable and ambitious performance goals to enhance outpatient care among participating health systems and hospitals. Not every provider is expected to achieve all targets, especially in later years when performance expectations ramp up and closing the gap to goal gets harder.
Challenges to achieving performance targets. Certainmeasuretargetshavebeendifficulttoachieve,albeitfor different reasons. First, some measures were selected before knowing how providers performed at baseline; when actual performance scores were examined, it became clear that theydidnotfitwellwitha“gap-to-goal”achievementstandard.For example, the distribution of CAHPS experience of care measures across providers is typically quite small and perfor-mance scores are relatively high. When a providers’ score is 96 percent and the goal is 98 percent, the difference is negligible. According to one provider representative: “If you’re really doing relatively well in a measure, you don’t have much more room to improve.Wedidn’tknowthatfiveyearsago.”Anotherprovidernoted the regression to the mean problem: “It is not easy to maintain high levels of performance. If you have to close the gap each year, you can’t rest on your laurels. Next year you have to do it all over again when there is no “low-hanging fruit.”21
Second, some states allowed providers to select among dozens or even hundreds of projects, each with their own metrics. Doing so created a large reporting burden, took time away from project
“[The gap-to-goal performance assessment is] a relatively rigorous methodology for someone like me who is each and every year trying to come up with ways to maintain our current performance and then adding to that. It feels very rigorous.”
–California PRIME participant
activities, and detracted from providers’ ability to perform well in a limited number of areas. In some instances, state policymak-ers were surprised that hospitals selected numerous projects, when they were only required to select a few. However, some providers thought they needed to undertake more projects than required to increase the likelihood of meeting targets that would earn DSRIP funds.
Thethird,andmostsignificantchallengetoachievingperfor-mance measures, is the lack of timely data. Most providers and states do not have data to monitor their progress toward the performance goals––they face challenges in building data systems that give them needed information to manage attributed patients’ use of services that affect performance. According to one provider: “We don’t have baseline data on the metrics we’re going to be measured against to know how far we have to go.” Several providers expressed frustration that they did not have information about their patients’ use of services other than at their own hospital or clinic. For example, in many states, hospitals must report on readmissions, but rely on the state to provide data on readmissions to all hospitals, regardless of the hospital from which patients were initially discharged. A hospital manager com-plained,“Wedidn’treceivethefirstreport(withthatdata)untilthebeginning of the measurement period, so we couldn’t establish a valid baseline and design strategies to address it. If the state or federal government establishes a target, they should do so based on information they already have.” In addition, projects that are trying to improve the capacity of primary care practices depend ondatafromtheNationalCommitteeforQualityAssurance(NCQA)regardingcertificationforeachlevel.Smallprovidersareespecially disadvantaged if they do not have electronic medical records (EMRs) that capture what they need for DSRIP reporting, and need to collect it manually.
Tying DSRIP incentives to VBP progress
Whentheyinitiallyestablishedfive-yeargoalsandtargetsinVBP “roadmaps” and other planning documents, no state knew the share of total spending, or Medicaid patients, that was paid through VBP or APM models; nor did they know which cat-egoriesofAPMwereinuse.Thisfindingsuggeststhatstatesset ambitious goals to drive the pace of reform as quickly as possible, rather than basing them on current or expected trends. Forexample,NewYorkestablisheditsgoalofhaving80to90percent of managed care payments to providers being through VBParrangementsbyMarch2020withouthavingbaseline
15
data. By the time it conducted a baseline survey of MCOs for CY2015,coveringninemonthsofthefirstdemonstrationyear,roughly34percentoftheirpaymentsweremadethroughAPMmodels in Levels 1-3,22 indicating a sizable gap between base-lineandthetargetedperformancelevelof80to90percent.
In addition, in many states, DSRIP program staff did not consult with Medicaid managed care program staff, or with Medicaid MCOs when setting VBP targets, deciding which services are covered or excluded, and whether or how much money to distribute to MCOs to support safety net providers. One state Medicaid managed care officialsaid:“TheDSRIPstaffmetwithacoupleofplanstodiscusscontract language, clarify outcomes, and clarify how success will be measured, but did not coordinate with us (state managed care staff), and didn’t appear to understand implications for actuarial rate setting.” In another state, several respondents said it would have been helpful to involve Medicaid MCOs at the beginning of DSRIP tothinkthroughpartnershipsandfundflowmethodologies.
At the time of this study, little was known about the effectiveness of setting ambitious VBP targets, progress towards such goals, andwhetherthegoalsarelikelytobeachievedinthespecifiedtimeframes.InNewYork,whichwasthefirststatetoincludeVBP goals as part of its DSRIP demonstration, the initial VBP target—10percentofMCOspendinginVBPLevel1orabovebyMarch2018––isrelativelymodest.Consequently,theMCOrepresentatives we spoke to believe that next year’s target can beeasilymet.However,thetargetsincreasesignificantlyin2019and2020,andmostsaythesetargetswillbemuchmoredifficulttoachieve.Ifprogressdoesnotkeeppacewithannualtargets, penalties will be applied, or the goals may change in response to objections by MCOs and providers.
Facilitators to implementing VBP. Several factors are helping DSRIP providers and MCOs make progress towards VBP contracting goals. First, Medicaid MCOs have already begun to contract with providers of all types, including safety net providers, using VBP/APM arrangements, giving them experi-enceandlessonsonhowbesttodoso.Second,thefinancialbenefitsofVBPtoMCOsaresignificantbecausetheyshiftriskoff their “balance sheet” onto those of providers. Finally, DSRIP fundsarehelpingtobuildcapacityamongfinanciallyvulnerablesafety net providers to prepare for APM and partner with MCOs.
Challenges to meeting VBP targets. Despite the opti-mism about pursuing VBP, several stumbling blocks remain to achieving the VBP targets, either statewide or among certain types of providers and services. These include: (1) inability or insufficientexperienceamongmanyproviderstoacceptandmanagethefinancialriskinherentinhigher-levelAPMcategories,particularlysmallproviders,thoseinruralareas,financiallydis-tressed hospitals, and community-based providers of behavioral healthservicesandLTSS;(2)concernsabouthowcostsavingswill be shared among the state, MCOs, and providers and how
the cost savings will be factored into managed care capitation rates; and (3) mismatches between the VBP goals and the services that are the focus of DSRIP delivery reforms.
Lessons learned from implementing DSRIP incentive designs
DSRIP demonstrations are fostering greater collaboration among providers,andDSRIPfinancialincentivesandperformancecriteriaappear to be driving hospitals and health systems to reform the way they deliver care by expanding access to outpatient services, partnering with community-based providers, and preparing to con-tract using VBP models. While the extent to which these changes are affecting outcomes remains unknown, it is clear that the pace and types of delivery reforms, and the effects on different types of providers, varies based on how DSRIP incentives are structured. Early DSRIP demonstrations tied the majority of funding to process milestones, including infrastructure development and capacity building,andP4Randdidnotsignificantlyalterexistingfinancialincentives. However, these demonstrations introduced safety net hospitalstoP4Pandencouragedcollaborationwithotherprovid-ers. Current DSRIP demonstrations have ramped up performance expectations – particularly for later years of the demonstration periods – and place state DSRIP funding at risk based on aggre-gate performance. Thus, DSRIP policy continues to evolve and the role of DSRIP funding in changing performance expectations has grown. Several lessons and insights can be drawn from states’ experiences to date in implementing incentive designs, which may be useful to other states planning similar programs.
Progress towards delivery system goals may be hindered if DSRIP incentives give too much funding and power to large health systems and hospitals. In regional collaboration models, where the majority of DSRIP funding goes to a particular provider type, such as hospitals, other types of providers such as primary care providers and community-based organizations that deliver behavioral health and social services face greater challenges, and weaker incentives, to achieve delivery systemgoals.Whileprovidersneedsomeflexibilitytostructuretheiralliances,governance,andfundflowdecisions,statepolicy-makers believe it is important to hold the entities jointly account-able for achieving delivery reform performance goals and metrics. Consequently, if DSRIP demonstrations seek to strengthen the role of community-based providers in improving quality, lowering costs and promoting population health, the incentives need to be struc-tured so that hospitals clearly understand the value of partnering with community providers, and for community-based providers to receive adequate funding to participate in meaningful ways. Thus, CMS and the states may consider ways to create more account-abilityforfundflowtodownstreamproviders.
16
Incentive program goals and measures need to strike a careful balance between being ambitious and achievable, due in part to the financial vulner-ability of safety net providers. In more recent DSRIP demonstrations, state policymakers and CMS have set rela-tively ambitious performance goals for improving the value of health care delivery under DSRIP. For their part, most provid-ers recognize the imperative to improve their performance on key outcomes and move toward performance-based payment. However, some of the goals and expectations for improve-mentmaybetooambitious,ornotachievableinthespecifiedtimeframe,ifsafetynetprovidersremainfinanciallydependenton the Medicaid supplemental funding streams that preceded (and were repurposed for) DSRIP in some states. Stakehold-ersraisedconcernsaboutthefinancialviabilityoflargehealthsystem safety net providers as well as small, community-based providers. Providers with high uninsured patient populations raised doubts about their ability to sustain DSRIP-funded programs after the demonstration ends, due to a lack of funding. In addition, the complex needs of many Medicaid and uninsured people also create challenges in achieving ambitious popula-tion health improvement goals as quickly as they would like. Consequently, states could create dedicated funding pools targetedtofinanciallyvulnerableproviderswithspecifiedcriteriafor eligibility and parameters for how funds could be used.
The more complex the incentive design, the harder it is for providers to understand the link between their performance and expected earnings. Several stakeholders cited the large number of projects and metrics, complex methods of valuation, and complicated mechanics offundflow,aschallengesthatmakeithardforproviderstodiscern which reforms are most important, and how they will be rewarded for their efforts. It would be helpful to providers if the incentive designs were simpler and easier to understand, by making a direct link between the DSRIP projects eligible for funding and the performance metrics on which providers are judged and to which incentive funding is tied. States should also develop a project menu that is limited to activities with strong evidence regarding their effectiveness in closing the gap between the current and desired performance goals. If states need to reconcile competing priorities and stakeholder inter-ests, they should be transparent about the trade-offs and help providers understand why earnings may not be based entirely on performance.
Alignment of financial incentives and performance metrics for DSRIP eligible entities and Medicaid MCOs strengthens the impetus for providers to reform. State policymakers are intentionally seeking to align DSRIP with Medicaid managed care payment policy, either
as part of the DSRIP demonstration or as a complement to it. Among the stakeholders we interviewed, there is widespread agreement that the performance metrics for holding both sets of organizations should be aligned. In Massachusetts’ new DSRIP demonstration, the provider entities eligible for DSRIP funds are ACOs, which may be either MCO-administered or verti-cally integrated with managed care plans, so the providers that becomepartoftheACOswill,bydefinition,alreadybesubjectto VBP model.
However, in other states, MCOs are concerned that they will be financiallypenalizedforfailuretomeetVBP/APMcontractinggoals, while providers do not face the same incentives to meet these goals. Furthermore, although regional DSRIP collabora-tions in New York and Washington are expected to facilitate VBP/APM participation among partnering providers, they are not accountable for achieving their state accountability goals, which may reduce the priority they give to this area. Consequently, states should consider how the VBP incentives created for each set of actors will interact during the design of such incentives.
Conclusion. Understanding how the design of DSRIP incen-tive programs varies by state provides important context for the evaluation of the effects on care quality, cost growth, and healthoutcomesforMedicaidbeneficiaries.Forexample,ifoutcomes vary across states, it will be useful to know whether certain design features distinguish states with strong outcomes fromthosewithweakerones.Untiltheresultsofafinalimpactevaluationareavailable,thefindingsfromthisstudyindicatethatdifferencesinhowstatesdesignDSRIPfinancialincentivescan affect the following: (1) which providers, and how many, participateindeliveryreforminitiatives;(2)howmuchmoneyis earned to reward providers for improving performance; (3) which activities and performance metrics qualify for incentive payments,andinturninfluencethefocusofproviderpracticechanges;and(4)thedegreetowhichDSRIP-eligibleproviders,and Medicaid managed care plans, are required or motivated to adopt VBP/APM arrangements.
Thefindingsofthisstudyalsounderscorethesignificantchallenges in designing effective incentive programs for providers treating Medicaid and uninsured patient populations. Historical MedicaidfinancingstrategiescontinuetoaffecttheperceivedvalueofDSRIPfinancialincentivesandhowfundsareallocated.Ensuring that the delivery reforms continue and are sustained beyond the demonstration period is also challenging. CMS and the states are trying to create synergies between DSRIP and Medicaid managed care to promote VBP and APMs to sustain such changes. Their success in doing so will be examined in a future study that will take an in-depth look at the intersection between Medicaid managed care and DSRIP demonstrations.
17
METHODS AND DATA SOURCES
This issue brief summarizes qualitative data obtained from key informant interviews and review of the states demonstrations’ special terms and conditions (STCs) and related attachments and program documents available on state Medicaid websites.
BetweenJuneandAugust2017,MathematicaPolicyResearchconducted26semi-structuredtelephoneinterviewswithstatepolicy-makers, lead provider entities, state provider and health plan associations, and managed care plan representatives in six states: Califor-nia, Massachusetts, New Hampshire, New York, Texas, and Washington. In California and Massachusetts, which have implemented two rounds of DSRIP demonstrations, we asked questions about both demonstration periods. Interview questions focused on different aspects of incentive design, including eligible entities, incentive amounts and payment models, performance criteria, and the intersec-tion between DSRIP and Medicaid managed care plan payment policy. The team recorded interviews with the respondents’ consent, and analyzed themes across states based on a standardized set of topics.
References
Au, Melanie, Carey Appold, Ryan Stringer, and Patrick Balke. “Attribution in DSRIP Demonstration Programs: A Spotlight on New Jersey and New York.” Washington, D.C.: Mathematica PolicyResearch,June2017.
Bailit, Michael, and Beth Waldman. “Safety-Net Provider ACOs: Considerations for State Medicaid Purchasers.” Princeton: NJ: RobertWoodJohnsonFoundation,January2016.
Burns, M., and M. Bailit. “Alternative Payment Models and the Case of Safety Net Providers in Massachusetts.” Boston, MA: Blue CrossBlueShieldofMassachusettsFoundation,March2015.
Carey, Kathleen, and Meng-Yun Lin. “Hospital Readmissions Reduction Program: Safety-Net Hospitals Show Improvement, ModificationsToPenaltyFormulaStillNeeded.”Health Affairs vol.35,no.10,October2016,pp.1918-1923.
Centers for Medicare & Medicaid Services. “California Medi-Cal 2020Demonstration(No.11-W-00193/9).”Demonstrationapprovalperiod:December30,2015,throughDecember31,2020.
Centers for Medicare & Medicaid Services. “MassHealth MedicaidSection1115Demonstration(No.11-W-00030/1).”Demonstrationapprovalperiod:October30,2014throughJune30,2019.Technicalcorrections:January20,2015.
Centers for Medicare & Medicaid Services. “MassHealth MedicaidSection1115Demonstration(No.11-W-00030/1).”Demonstrationapprovalperiod:October30,2014,throughJune30,2019.AmendedNovember4,2016.
Centers for Medicare & Medicaid Services. “Medicaid Redesign TeamSection1115(No.11-W-00114/2.”Demonstrationapprovalperiodextension:December7,2016throughMarch30,2021.ApprovedJanuary19,2017.
Centers for Medicare & Medicaid Services. “New Hampshire BuildingCapacityforTransformation(No.11-W-00301/1.”
Demonstrationapprovalperiod:January5,2016throughDecember31,2020.Technicalcorrections:February22,2017.
Centers for Medicare & Medicaid Services. “Texas Healthcare TransformationandQualityImprovementProgram(No.11-W-00278/6).”Demonstrationapprovalperiod:December12,2011throughDecember31,2017.AmendedDecember22,2016.
Centers for Medicare & Medicaid Services. “Washington StateMedicaidTransformationProject(No.11-W-00304/0.”Demonstrationapprovalperiod:January9,2017throughDecember31,2021.
Christianson, J.B., S. Leatherman, and K. Sutherland. “Lessons from Evaluations of Purchaser Pay-for-Performance Programs: A Review of the Evidence.” Medical Care Research and Review, vol.65,no.6,2008,pp.5S–35S.
Custers, T., J. Hurley, N.S. Klazinga, and A.D. Brown. “Selecting Effective Incentive Structures in Health Care: A Decision Framework to Support Health Care Purchasers in Finding the Right Incentives to Drive Performance.” BMC Health Services Research,vol.8,no.66,2008,pp.1–14.
Damberg, C.L., M.E. Sorbero, S.L. Lovejoy, G. Martsolf, L. Raaen, and D. Mandel. “Measuring Success in Health Care Value-Based Purchasing Programs: Findings from an Environmental Scan, Literature Review, and Expert Panel Discussions.”SantaMonica,CA:RANDCorporation,2014(a).
Damberg, C.L., M.E. Sorbero, S.L. Lovejoy, G. Martsolf, L. Raaen, and D. Mandel. “Measuring Success in Health Care Value-Based Purchasing Programs: Summary and Recommendations.” Washington,DC:RANDCorporation,2014(b).
Eijkenaar, F. “Key Issues in the Design of Pay for Performance Programs.” European Journal of Health Economics,vol.14,no.1,2013,pp.117–131.
Eijkenaar, F., M. Emmert, M. Scheppach, and O. Schoffski. “Effects of Pay for Performance in Health Care: A Systematic Review of Systematic Reviews.” Health Policy,vol.110,no.2-3,2013,pp.115-130.
18
Gates, Alexandra, Robin Rudowitz, and Jocelyn Guyer. “An Overview of Delivery System Reform Incentive Payment (DSRIP) Waivers.” Washington, DC: Kaiser Family Foundation, September2014.
GovernmentAccountabilityOffice.“MedicareValue-BasedPayment Models: Participation Challenges and Available Assistance for Small and Rural Practices.” Washington, DC: GAO:December2016.
Greenwald, Leslie M. “Who Gets the Payment Under Pay for Performance?” In Pay for Performance in Health Care: Methods and Approaches, edited by Jerry Cromwell, Michael G. Trisolini, Gregory C. Pope, Janet B. Mitchell, and Leslie M. Greenwald. ResearchTrianglePark,NC:ResearchTriangleInstitute,2011.
Gusmano, M.K. and F.J. Thompson. “An Examination of Medicaid Delivery System Reform Incentive Payment Initiatives Under Way in Six States.” Health Affairs,vol.34,no.7,July2015,pp.1162-1169.
Health Care Payment Learning & Action Network. Alternative PaymentModel:APMFramework:Refreshedfor2017.McLean,VA:MITRECorporation,2017.
Heeringa, Jessica, Carey Appold, Julia Baller, Keanan Lane, Ryan Stringer, and James Woerheide. “Achieving Coordination of Care to Improve Population Health: Provider Collaboration in Delivery System Reform Incentive Payment Programs.” Washington,D.C.:MathematicaPolicyResearch,June2017.
Heeringa, Jessica, Laurie Felland, Keanan Lane, Thomas Grannemann, and Carol V. Irvin. “Alternative Payment Models in Medicaid: Findings from a Literature Review and Policy Considerations.” Report submitted to the Centers for Medicare & Medicaid Services. Cambridge, MA: Mathematica Policy Research,March9,2017.
Kocot, S.L., C. Dang-Vu, R. White, and M. McClellan. “Early Experiences with Accountable Care in Medicaid: Special Challenges, Big Opportunities.” Population Health Management, vol.16,suppl.1,2013,pp.4-11.
Kondo, K.K., C.L. Damberg, A. Mendelson, M. Motu’apuaka, M. Freeman, M. O’Neil, R. Relevo, A. Low, and D. Kansagara. “Implementation Processes and Pay for Performance in Healthcare: A Systematic Review.” Journal of General Internal Medicine,vol.31,suppl.1,2016,pp.S61–S69.
Medicaid and CHIP Payment and Access Commission. “Medicaid UPL Supplemental Payments.” Washington, D.C.: MedicaidandCHIPPaymentandAccessCommission,2012.
Miller, H.D., and S.S. Marks. “A Guide to Physician-Focused Alternative Payment Models.” Pittsburgh, PA: Center for
HealthcareQuality&PaymentReformandChicago,IL:AmericanMedicalAssociation,November2015.
Pope, Gregory. “Overview of Pay for Performance Models and Issues.” In Pay for Performance in Health Care: Methods and Approaches, edited by Jerry Cromwell, Michael G. Trisolini, Gregory C. Pope, Janet B. Mitchell, and Leslie M. Greenwald. ResearchTrianglePark,NC:ResearchTriangleInstitute,2011.
Ryan, A.M., J. Blustein, and L.P. Casalino. “Medicare’s Flagship Test of Pay-for-Performance Did Not Spur More Rapid Improve-ment among Low-Performing Hospitals.” Health Affairs, vol. 31, no.4,2012,pp.797–805.
Ryan, A.M., and C.I. Damberg. “What Can the Past of Pay-for-Performance Tell Us about the Future of Value-Based Purchas-ing in Medicare?” Healthcare,vol.1,no.1–2,2013,pp.42–49.
Schoenberg, M., F. Heider, J. Rosenthal, C. Schwartz, and N. Kaye. “Implementing Medicaid Delivery System Reform Incentive Payment (DSRIP) Pools.” Washington, D.C.: National AcademyofStateHealthPolicy,March2015.
Volk, Gwyn, and James Pettersson. “Global and Episodic Bun-dling: An Overview and Considerations for Medicaid.” Washing-ton,DC:AcademyHealth,April2011.
Zuckerman,R.B.,S.H.Sheingold,E.J.Orav,J.Ruhter,andA.M. Epstein. “Readmissions, Observation, and the Hospital Readmissions Reduction Program.” New England Journal of Medicine,vol.374,April21,2016,pp.1543–1551.
Endnotes
1 Previous DSRIP-focused issue briefs addressed (1) coordination and collaboration across providers and care settings;(2)performancemeasuresandthewayinwhichtheyinfluencethefocusofdeliveryreforms;and(3)attributionmethods used to assign patients to providers and networks accountable for their care.
2Most DSRIP demonstrations include projects that include specificactivities,andsometimesassociatedmilestonesandmetrics, addressing clinical care and population health goals.
3TheHCP-LANidentifiesthefollowingcategoriesofproviderpayment: Category 1 (Fee-for-service [FFS] with no link to qualityorpayment),Category2(Fee-for-servicelinkedtoqualityand value), Category 3 (APMs built on FFS infrastructure), and Category4(Population-BasedPayment).
4 Accountable care organizations (ACOs) are a type of delivery system model that is made up of local groups of providers who are contractually accountable to a payer for the quality and cost ofcarefordefinedpatientpopulations.
19
5ThisbriefdoesnotaddressMedicaidbeneficiaryattribution,because a prior DSRIP issue brief examined the topic in-depth. SeeAuetal.2017.
6 Drawn largely from a previous literature review: Heeringa et al. “Alternative Payment Models in Medicaid: Findings from a Literature Review and Policy Considerations. Report submitted to the Centers for Medicare & Medicaid Services. Cambridge, MA:MathematicaPolicyResearch,March9,2017.
7 In the issue brief on coordination and collaboration in DSRIP (seeHeeringaetal.2017),wereferredtothesemodelsasregionalnetworks,borrowingatermfirstputforthbyGusmanoandThompson(2015).However,stateofficialsinWashingtondo not view Accountable Communities of Health as “networks” because the term connotes an attribution scheme for assigning providers (as with managed care plans and ACOs) whereas collaborationsaredefinedexclusivelybyregion.Thus,weuseabroader term for the purposes of this brief.
8 Washington requires ACHs to include representatives from tribes, Indian Health Service providers, or Urban Indian Health Program providers on their boards and either adopt the state’s Tribal Collaboration and Communication Policy or develop their own policy, which is agreed to by every tribe and Indian Healthcare Provider in the ACHs’ regions.
9 Examples of discretionary investments include health information technology investments, care coordination/management investments, and workforce capacity development. ACOs must submit a plan and budget for these investments, and upon state approval of the plan, are subject to a withhold of at-risk payments on the basis of cost and quality performance. In addition to making funding available for ACOs, Massachusetts’ DSRIP demonstration makes incentive funding available to Community Partners (CPs) and Community Service Agencies (CSAs) for capacity building, the provision of care coordination services, and the achievement of high levels of performance on certain quality and utilization measures.
10 Value-based payment (VBP) arrangements tie payment to certainquality,efficiency,andotherperformancerequirementsand are intended to promote high-value (rather than high-volume) care. These arrangements can be used with, or a replacement to, fee-for-service (FFS) reimbursement. Alternative payment models (APMs) are payment models are intended to replace FFS reimbursement and tie reimbursement to providers’ cost and quality performance, shifting increased risk for population health management to providers (Health Care PaymentLearningandActionNetwork2017).Thus,APMsareatype of VBP arrangement.
11 Proportional allotment factors essentially designate the share of DSRIP incentive funding that can be apportioned to each provider based on criteria such as Medicaid patient volume.
12 These approaches require formal attribution of Medicaid beneficiariestoaccountableentitiesusingthestates’attributionmethodologies.SeeAuetal.2017.
13 A list of measures in these two sets can be found at: https://www.medicaid.gov/medicaid/quality-of-care/performance-measurement/child-core-set/index.html and https://www.medicaid.gov/medicaid/quality-of-care/performance-measurement/adult-core-set/index.html.
14Althoughspecifiedforusebyhealthplans,HEDISmeasuresare often used for other entities such as ACOs or regional provider groups in New York and Texas, using patients attributed to such entities as the measure denominator rather than health plan members.
15 For example, specialty care consultation measures include specialtycaretouches,definedasspecialtyexpertiserequestsmanaged via non-face-to-face encounters and the referral reply turnaroundrate,definedasthepercentageofrequestsforspecialty care expertise replied to within four calendar days.
16 Outside of its DSRIP demonstration, Massachusetts’ contracts with all ACOs have both upside and downside risk starting in the firstyear;thestateoffersthreedifferentmodelsandrisktracksfor a total of six options of varying levels of insurance risk and performance risk.
17FormoreinformationonNewYork’sVBPQualityIncentiveProgram, see https://www.health.ny.gov/health_care/Medicaid/redesign/dsrip/vbp_initiatives/index.htm.
18 In Texas, the requirement to increase the share of Medicaid MCO payments made through APMs is not part of the DSRIP demonstration.Instead,startingwithFY2015contracts,MCOswere required to develop plans to expand VBP contracting with providers, and show a measurable increase in the percent of business (providers, dollars, or other) being incentivized from the previousyear(§8.1.7.8.2oftheUniformManagedCareContractTermsandConditions,version2.22,March2017).StartinginFY2018,thecontractwillformallyestablishMCOVBPtargets.In addition, at least one MCO performance improvement project (PIP) must be conducted in collaboration with other MCOs, dental contractors, or participants in DSRIP projects.
19 According to the latest HCP-LAN APM Framework: Category 3 includes APMs built on FFS architecture and covers HCP-LAN 3A (APMs with shared savings and upside risk only) and 3B(APMswithsharedsavingsanddownsiderisk).Category4includespopulation-basedpaymentandcovers4A(condition-specificPMPMpayments),4B(comprehensivePMPMpayments or global budgets covering all or most services), and4C(integratedfinanceanddeliverysystemsoperatingonglobal budgets). See also http://hcp-lan.org/workproducts/apm-framework-onepager.pdf.
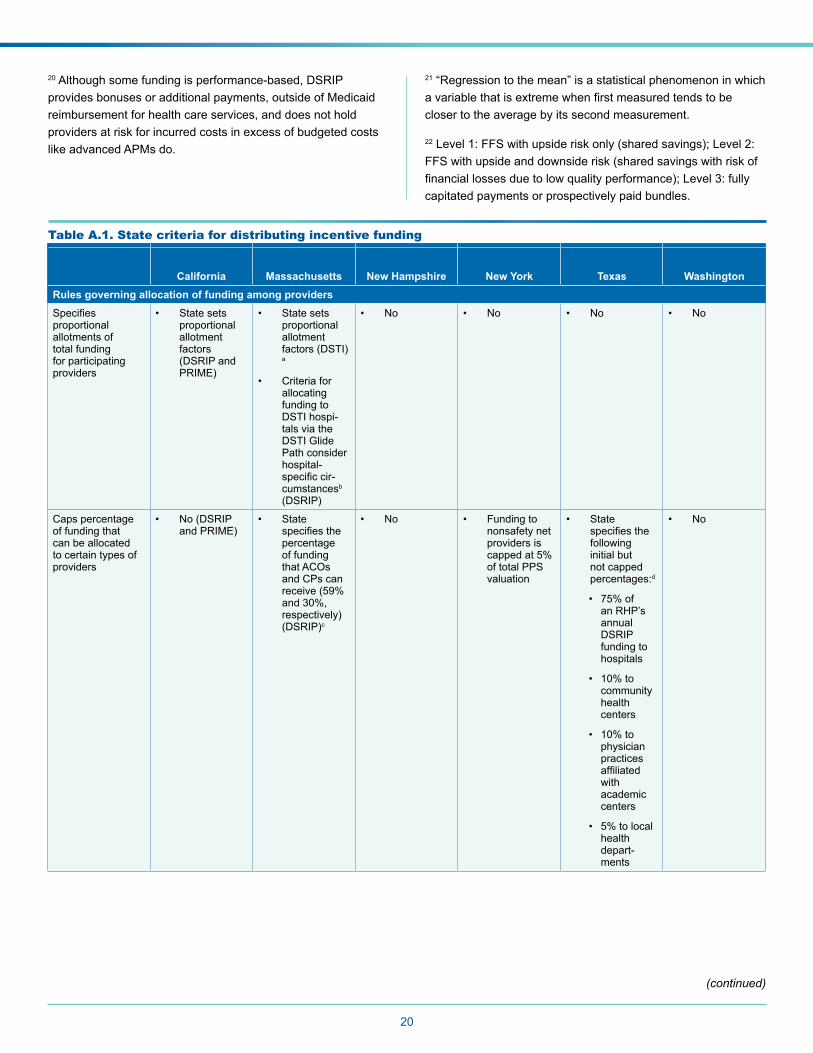
20
20 Although some funding is performance-based, DSRIP provides bonuses or additional payments, outside of Medicaid reimbursement for health care services, and does not hold providers at risk for incurred costs in excess of budgeted costs like advanced APMs do.
21 “Regression to the mean” is a statistical phenomenon in which avariablethatisextremewhenfirstmeasuredtendstobecloser to the average by its second measurement.
22Level1:FFSwithupsideriskonly(sharedsavings);Level2:FFS with upside and downside risk (shared savings with risk of financiallossesduetolowqualityperformance);Level3:fullycapitated payments or prospectively paid bundles.
Table A.1. State criteria for distributing incentive funding
California Massachusetts New Hampshire New York Texas WashingtonRules governing allocation of funding among providersSpecifiesproportional allotments of total funding for participating providers
• State sets proportional allotment factors (DSRIP and PRIME)
• State sets proportional allotment factors (DSTI)a
• Criteria for allocating funding to DSTI hospi-tals via the DSTI Glide Path consider hospital-specificcir-cumstancesb (DSRIP)
• No • No • No • No
Caps percentage of funding that can be allocated to certain types of providers
• No (DSRIP and PRIME)
• State specifiesthepercentage of funding that ACOs and CPs can receive(59%and30%,respectively) (DSRIP)c
• No • Funding to nonsafety net providers is cappedat5%of total PPS valuation
• State specifiesthefollowing initial but not capped percentages:d
• 75%ofan RHP’s annual DSRIP funding to hospitals
• 10%tocommunity health centers
• 10%tophysician practices affiliatedwith academic centers
• 5%tolocalhealth depart-ments
• No
(continued)
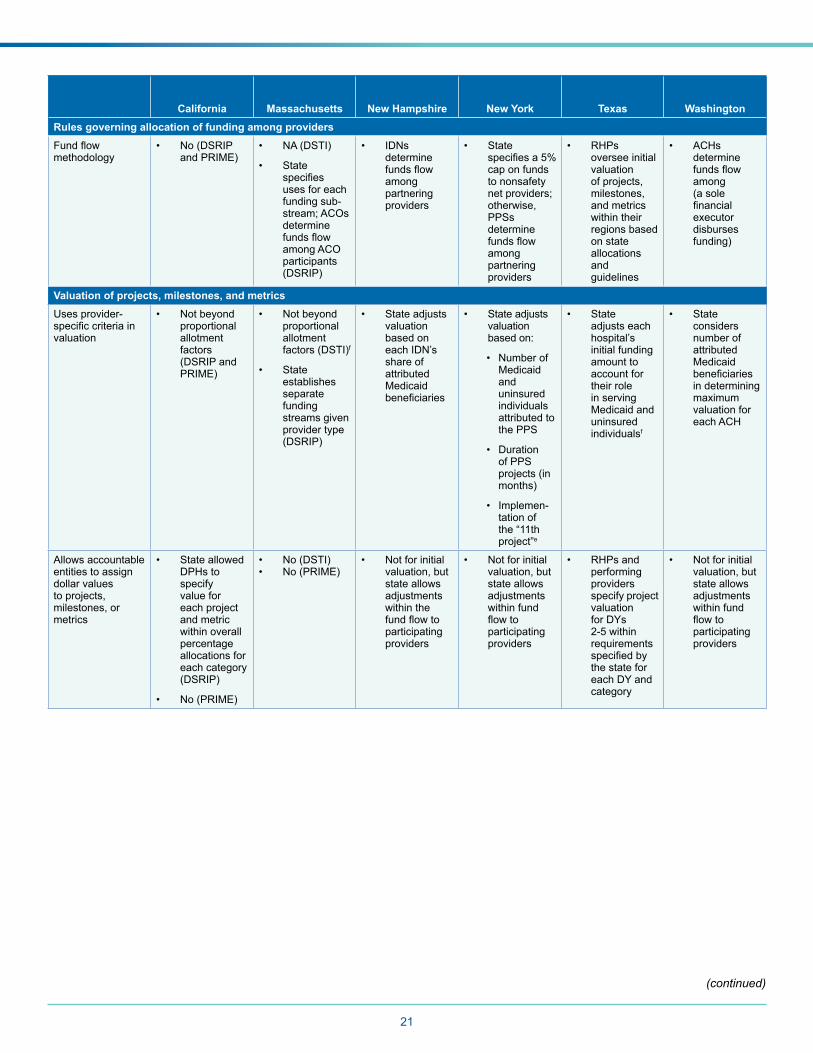
21
California Massachusetts New Hampshire New York Texas WashingtonRules governing allocation of funding among providersFundflowmethodology
• No (DSRIP and PRIME)
• NA (DSTI)
• State specifiesuses for each funding sub-stream; ACOs determine fundsflowamong ACO participants (DSRIP)
• IDNs determine fundsflowamong partnering providers
• State specifiesa5%cap on funds to nonsafety net providers; otherwise, PPSs determine fundsflowamong partnering providers
• RHPs oversee initial valuation of projects, milestones, and metrics within their regions based on state allocations and guidelines
• ACHs determine fundsflowamong (a sole financialexecutor disburses funding)
Valuation of projects, milestones, and metricsUses provider-specificcriteriainvaluation
• Not beyond proportional allotment factors (DSRIP and PRIME)
• Not beyond proportional allotment factors (DSTI)f
• State establishes separate funding streams given provider type (DSRIP)
• State adjusts valuation based on each IDN’s share of attributed Medicaid beneficiaries
• State adjusts valuation based on:
• Number of Medicaid and uninsured individuals attributed to the PPS
• Duration of PPS projects (in months)
• Implemen-tation of the “11th project”e
• State adjusts each hospital’s initial funding amount to account for their role in serving Medicaid and uninsured individualsf
• State considers number of attributed Medicaid beneficiariesin determining maximum valuation for each ACH
Allows accountable entities to assign dollar values to projects, milestones, or metrics
• State allowed DPHs to specify value for each project and metric within overall percentage allocations for each category (DSRIP)
• No (PRIME)
• No (DSTI)• No (PRIME)
• Not for initial valuation, but state allows adjustments within the fundflowtoparticipating providers
• Not for initial valuation, but state allows adjustments within fund flowtoparticipating providers
• RHPs and performing providers specify project valuation for DYs 2-5withinrequirements specifiedbythe state for each DY and category
• Not for initial valuation, but state allows adjustments within fund flowtoparticipating providers
(continued)
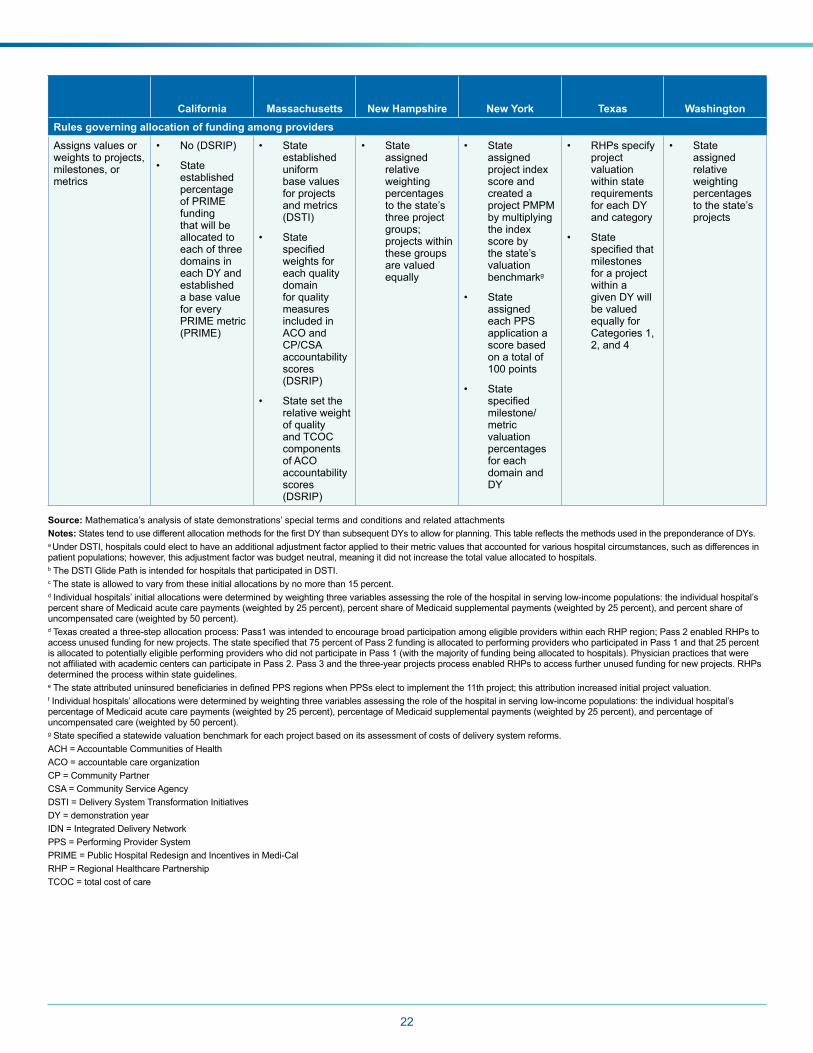
22
California Massachusetts New Hampshire New York Texas WashingtonRules governing allocation of funding among providersAssigns values or weights to projects, milestones, or metrics
• No (DSRIP)
• State established percentage of PRIME funding that will be allocated to each of three domains in each DY and established a base value for every PRIME metric (PRIME)
• State established uniform base values for projects and metrics (DSTI)
• State specifiedweights for each quality domain for quality measures included in ACO and CP/CSA accountability scores (DSRIP)
• State set the relative weight of quality and TCOC components of ACO accountability scores (DSRIP)
• State assigned relative weighting percentages to the state’s three project groups; projects within these groups are valued equally
• State assigned project index score and created a project PMPM by multiplying the index score by the state’s valuation benchmarkg
• State assigned each PPS application a score based on a total of 100points
• State specifiedmilestone/ metric valuation percentages for each domain and DY
• RHPs specify project valuation within state requirements for each DY and category
• State specifiedthatmilestones for a project within a given DY will be valued equally for Categories 1, 2,and4
• State assigned relative weighting percentages to the state’s projects
Source: Mathematica’s analysis of state demonstrations’ special terms and conditions and related attachments Notes:StatestendtousedifferentallocationmethodsforthefirstDYthansubsequentDYstoallowforplanning.ThistablereflectsthemethodsusedinthepreponderanceofDYs.a Under DSTI, hospitals could elect to have an additional adjustment factor applied to their metric values that accounted for various hospital circumstances, such as differences in patient populations; however, this adjustment factor was budget neutral, meaning it did not increase the total value allocated to hospitals.b The DSTI Glide Path is intended for hospitals that participated in DSTI. c The state is allowed to vary from these initial allocations by no more than 15 percent.d Individual hospitals’ initial allocations were determined by weighting three variables assessing the role of the hospital in serving low-income populations: the individual hospital’s percentshareofMedicaidacutecarepayments(weightedby25percent),percentshareofMedicaidsupplementalpayments(weightedby25percent),andpercentshareofuncompensatedcare(weightedby50percent).dTexascreatedathree-stepallocationprocess:Pass1wasintendedtoencouragebroadparticipationamongeligibleproviderswithineachRHPregion;Pass2enabledRHPstoaccessunusedfundingfornewprojects.Thestatespecifiedthat75percentofPass2fundingisallocatedtoperformingproviderswhoparticipatedinPass1andthat25percentis allocated to potentially eligible performing providers who did not participate in Pass 1 (with the majority of funding being allocated to hospitals). Physician practices that were notaffiliatedwithacademiccenterscanparticipateinPass2.Pass3andthethree-yearprojectsprocessenabledRHPstoaccessfurtherunusedfundingfornewprojects.RHPsdetermined the process within state guidelines.eThestateattributeduninsuredbeneficiariesindefinedPPSregionswhenPPSselecttoimplementthe11thproject;thisattributionincreasedinitialprojectvaluation.f Individual hospitals’ allocations were determined by weighting three variables assessing the role of the hospital in serving low-income populations: the individual hospital’s percentageofMedicaidacutecarepayments(weightedby25percent),percentageofMedicaidsupplementalpayments(weightedby25percent),andpercentageofuncompensatedcare(weightedby50percent).gStatespecifiedastatewidevaluationbenchmarkforeachprojectbasedonitsassessmentofcostsofdeliverysystemreforms.ACH = Accountable Communities of Health ACO = accountable care organizationCP = Community PartnerCSA = Community Service Agency DSTI = Delivery System Transformation Initiatives DY = demonstration year IDN = Integrated Delivery NetworkPPS = Performing Provider SystemPRIME = Public Hospital Redesign and Incentives in Medi-CalRHP = Regional Healthcare Partnership TCOC = total cost of care
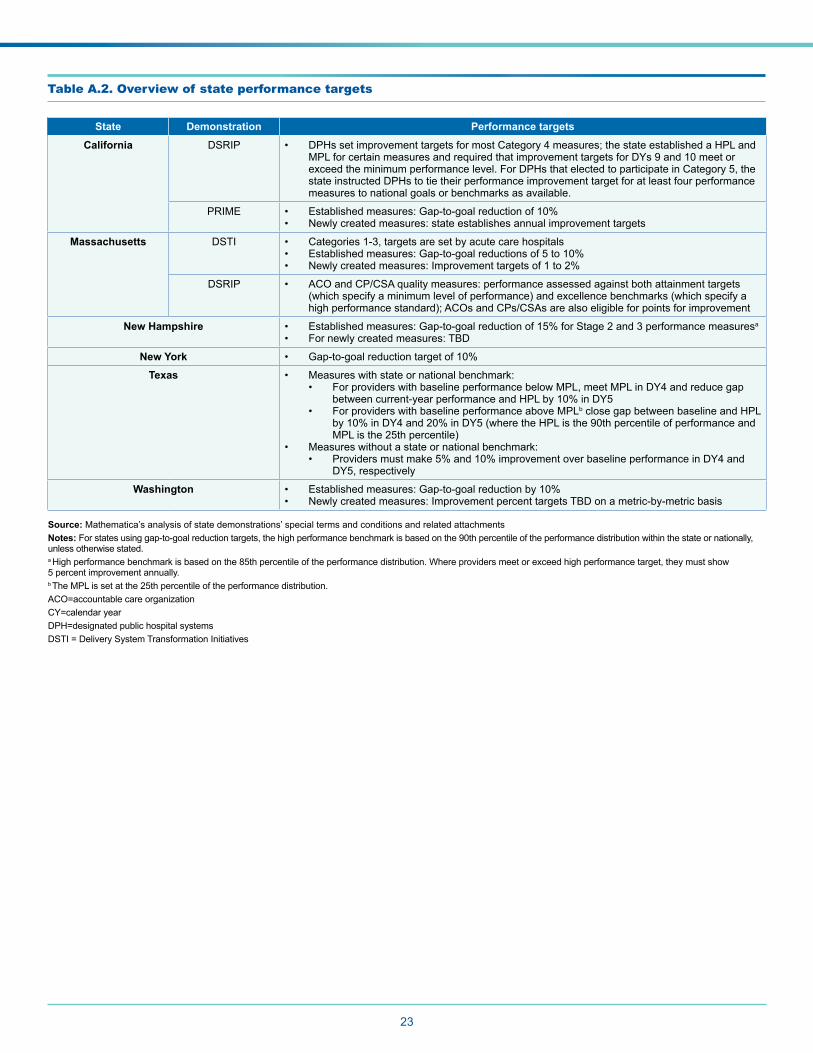
23
Table A.2. Overview of state performance targets
State Demonstration Performance targets
California DSRIP • DPHssetimprovementtargetsformostCategory4measures;thestateestablishedaHPLandMPLforcertainmeasuresandrequiredthatimprovementtargetsforDYs9and10meetorexceed the minimum performance level. For DPHs that elected to participate in Category 5, the state instructed DPHs to tie their performance improvement target for at least four performance measures to national goals or benchmarks as available.
PRIME • Establishedmeasures:Gap-to-goalreductionof10%• Newly created measures: state establishes annual improvement targets
Massachusetts DSTI • Categories 1-3, targets are set by acute care hospitals • Establishedmeasures:Gap-to-goalreductionsof5to10%• Newlycreatedmeasures:Improvementtargetsof1to2%
DSRIP • ACO and CP/CSA quality measures: performance assessed against both attainment targets (which specify a minimum level of performance) and excellence benchmarks (which specify a high performance standard); ACOs and CPs/CSAs are also eligible for points for improvement
New Hampshire • Establishedmeasures:Gap-to-goalreductionof15%forStage2and3performancemeasuresa
• For newly created measures: TBD
New York • Gap-to-goalreductiontargetof10%
Texas • Measures with state or national benchmark:• ForproviderswithbaselineperformancebelowMPL,meetMPLinDY4andreducegap
betweencurrent-yearperformanceandHPLby10%inDY5• For providers with baseline performance above MPLb close gap between baseline and HPL
by10%inDY4and20%inDY5(wheretheHPListhe90thpercentileofperformanceandMPListhe25thpercentile)
• Measures without a state or national benchmark: • Providersmustmake5%and10%improvementoverbaselineperformanceinDY4and
DY5, respectively
Washington • Establishedmeasures:Gap-to-goalreductionby10%• Newly created measures: Improvement percent targets TBD on a metric-by-metric basis
Source: Mathematica’s analysis of state demonstrations’ special terms and conditions and related attachments Notes:Forstatesusinggap-to-goalreductiontargets,thehighperformancebenchmarkisbasedonthe90thpercentileoftheperformancedistributionwithinthestateornationally,unless otherwise stated.a High performance benchmark is based on the 85th percentile of the performance distribution. Where providers meet or exceed high performance target, they must show 5 percent improvement annually.b TheMPLissetatthe25thpercentileoftheperformancedistribution.ACO=accountable care organizationCY=calendar yearDPH=designated public hospital systemsDSTI = Delivery System Transformation Initiatives