designing controlled pillar failure – crush pillar support · • mining height and pillar size...
TRANSCRIPT
DESIGNING CONTROLLED PILLAR FAILURE – CRUSH PILLAR SUPPORT 339
IntroductionSafe mining practices are aimed at maximizing theextraction of a particular orebody. Mine stability is a keyconsideration and the type of layout (i.e. pillar type andspans) must be suitable for the prevailing rock massconditions. Crush pillar mining appears to be a methodunique to South African hard rock mines, with the pillarsystem being applied to shallow and intermediate-depthgold and platinum orebodies. It allows for a higherextraction than what can typically be achieved with aconventional rigid/elastic non-yield pillar system. The pillarsystem must, however, be used in conjunction with a barrierpillar system. The crush pillar dimensions are generallyselected to give a width-to-height ratio (w:h) ofapproximately two, (Ryder and Jager, 2002). This w:h ratiois selected to ensure that the pillars fail as they are being cutat the mining face. Once the pillar has failed in a stablemanner, the residual strength of the pillar contributes to therequired panel support by carrying the deadweight load tothe height of the uppermost parting on which separation isexpected to occur. Closely spaced support elements aretypically used between adjacent rows of pillars to provideadditional in-panel support.
Ozbay and Roberts (1988) suggested that crush pillarsshould be implemented at a depth greater than 400 m belowsurface. This is based on the assumption that the averageface stress at this depth is large enough to enable crushingof the pillars.
In contrast to stable pillar layouts, failure of crush pillarsis in fact desired as long as it occurs in a controlled manner.Pillar failure and the resulting load-shedding should ideallybe continuous to prevent accumulation of elastic strainenergy.
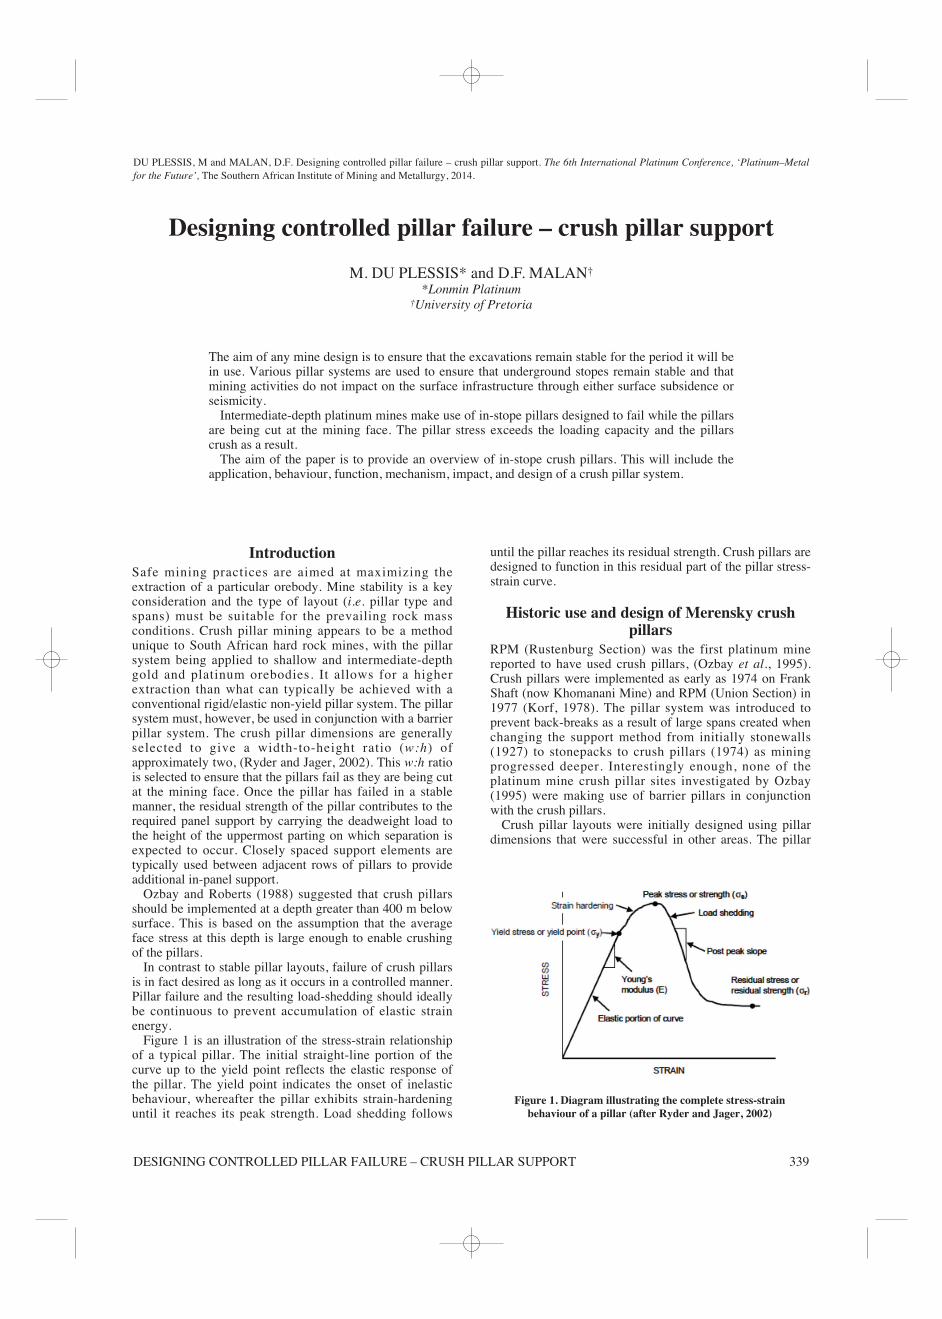
Figure 1 is an illustration of the stress-strain relationshipof a typical pillar. The initial straight-line portion of thecurve up to the yield point reflects the elastic response ofthe pillar. The yield point indicates the onset of inelasticbehaviour, whereafter the pillar exhibits strain-hardeninguntil it reaches its peak strength. Load shedding follows
until the pillar reaches its residual strength. Crush pillars aredesigned to function in this residual part of the pillar stress-strain curve.
Historic use and design of Merensky crushpillars
RPM (Rustenburg Section) was the first platinum minereported to have used crush pillars, (Ozbay et al., 1995).Crush pillars were implemented as early as 1974 on FrankShaft (now Khomanani Mine) and RPM (Union Section) in1977 (Korf, 1978). The pillar system was introduced toprevent back-breaks as a result of large spans created whenchanging the support method from initially stonewalls(1927) to stonepacks to crush pillars (1974) as miningprogressed deeper. Interestingly enough, none of theplatinum mine crush pillar sites investigated by Ozbay(1995) were making use of barrier pillars in conjunctionwith the crush pillars.
Crush pillar layouts were initially designed using pillardimensions that were successful in other areas. The pillar
DU PLESSIS, M and MALAN, D.F. Designing controlled pillar failure – crush pillar support. The 6th International Platinum Conference, ‘Platinum–Metalfor the Future’, The Southern African Institute of Mining and Metallurgy, 2014.
Designing controlled pillar failure – crush pillar support
M. DU PLESSIS* and D.F. MALAN†
*Lonmin Platinum†University of Pretoria
The aim of any mine design is to ensure that the excavations remain stable for the period it will bein use. Various pillar systems are used to ensure that underground stopes remain stable and thatmining activities do not impact on the surface infrastructure through either surface subsidence orseismicity.
Intermediate-depth platinum mines make use of in-stope pillars designed to fail while the pillarsare being cut at the mining face. The pillar stress exceeds the loading capacity and the pillarscrush as a result.
The aim of the paper is to provide an overview of in-stope crush pillars. This will include theapplication, behaviour, function, mechanism, impact, and design of a crush pillar system.
Figure 1. Diagram illustrating the complete stress-strainbehaviour of a pillar (after Ryder and Jager, 2002)
‘PLATINUM METAL FOR THE FUTURE’340
dimensions and spacings were then adjusted until the pillarsexhibited the required behaviour (Ozbay et al., 1995). Thetypical range of w:h ratios of the crush pillars variedbetween 1.5–2.5. This accommodated the varying stopingwidths (0.9–2 m), the weak footwall rock in some areas,and structural weaknesses in the rock. An alternative designapproach was to cut the pillar at a w:h ratio of 2 and thenincrease or decrease the pillar width until crushing wasachieved.
Ozbay et al. (1995) stated that the main purpose of thecrush pillars was to provide enough resistance to supportthe rock up to the highest known parting plane (i.e.Merensky Bastard reef contact at a height of 5 m to 45 m),and not to support the full overburden rock mass to surface.The load requirement of a crush pillar to function as localsupport can be established by determining the supportresistance required, which is dictated by the height of theprominent parting. Support resistance in the order of 1 MPais quoted (Roberts et al., 2005a) based on the back-analysisof backbreaks that occurred at Randfontein Estates andNortham, where the failures took place at 40 m and 30 minto the hangingwall respectively. Parting heights of 10 mand 20 m would result in a support resistance requirementof approximately 0.3 MPa and 0.6 MPa respectively.
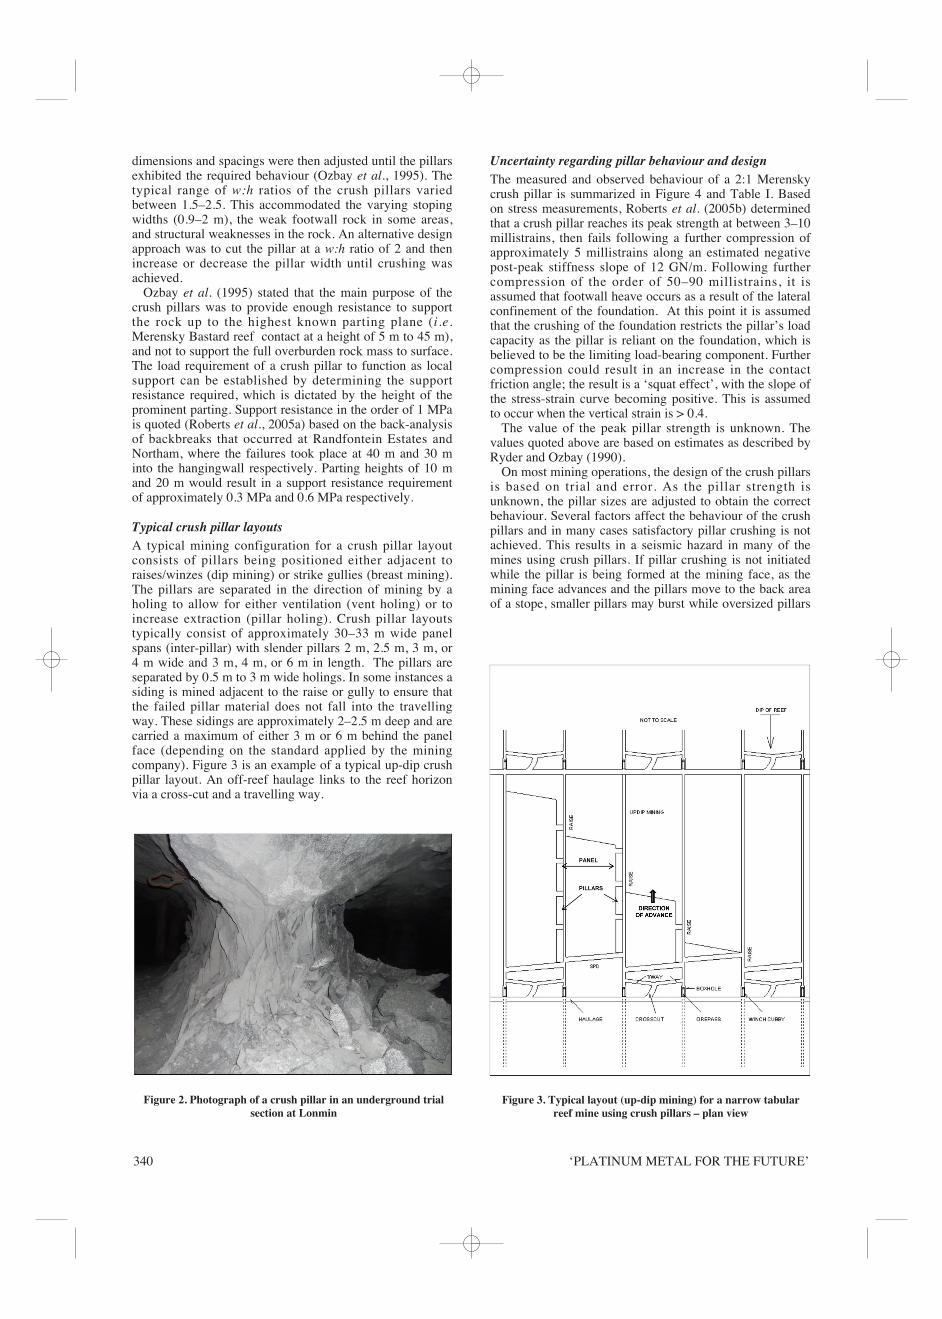
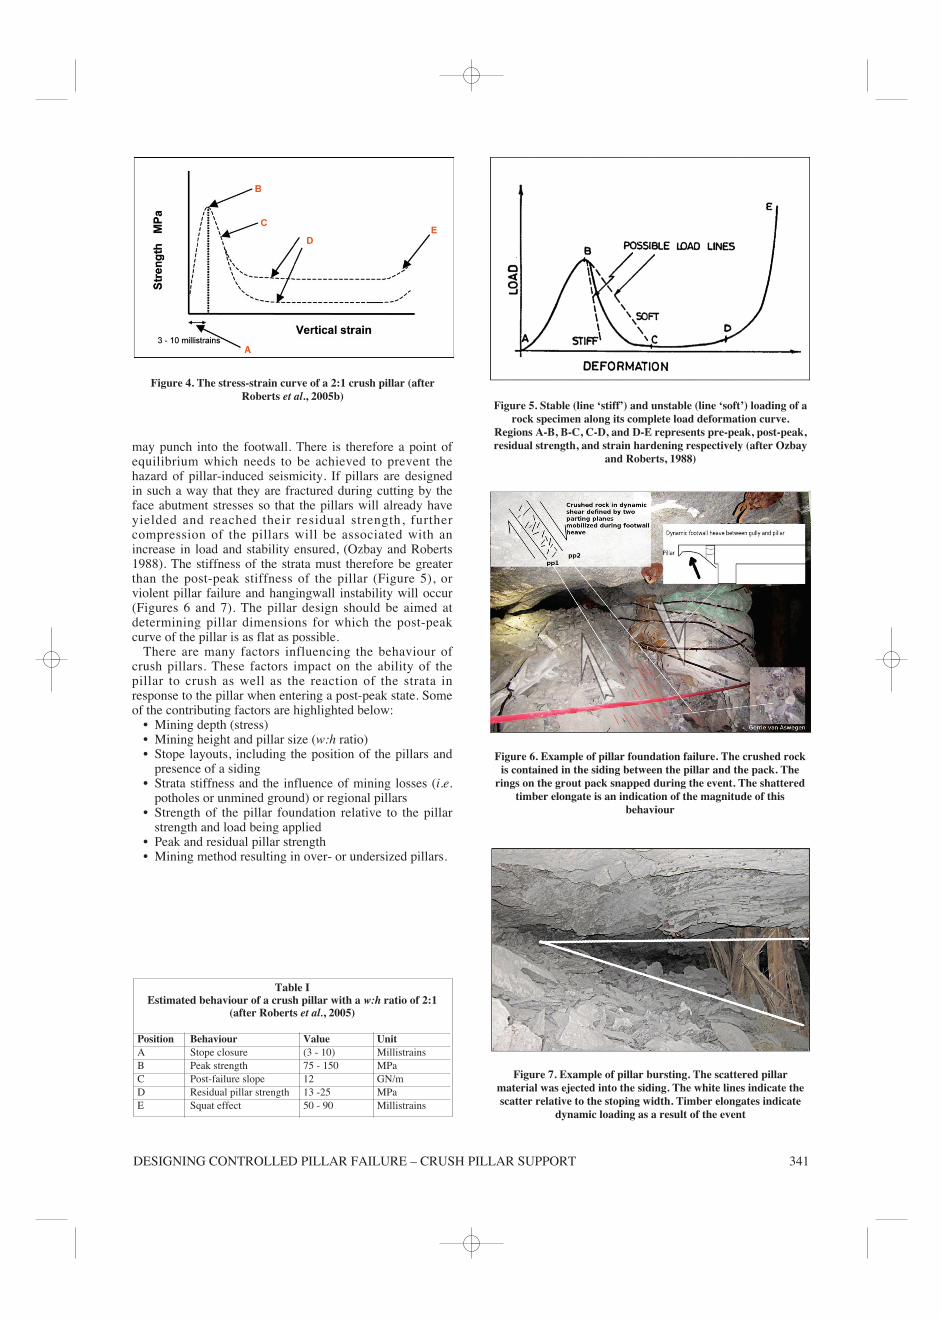
Typical crush pillar layoutsA typical mining configuration for a crush pillar layoutconsists of pillars being positioned either adjacent toraises/winzes (dip mining) or strike gullies (breast mining).The pillars are separated in the direction of mining by aholing to allow for either ventilation (vent holing) or toincrease extraction (pillar holing). Crush pillar layoutstypically consist of approximately 30–33 m wide panelspans (inter-pillar) with slender pillars 2 m, 2.5 m, 3 m, or4 m wide and 3 m, 4 m, or 6 m in length. The pillars areseparated by 0.5 m to 3 m wide holings. In some instances asiding is mined adjacent to the raise or gully to ensure thatthe failed pillar material does not fall into the travellingway. These sidings are approximately 2–2.5 m deep and arecarried a maximum of either 3 m or 6 m behind the panelface (depending on the standard applied by the miningcompany). Figure 3 is an example of a typical up-dip crushpillar layout. An off-reef haulage links to the reef horizonvia a cross-cut and a travelling way.
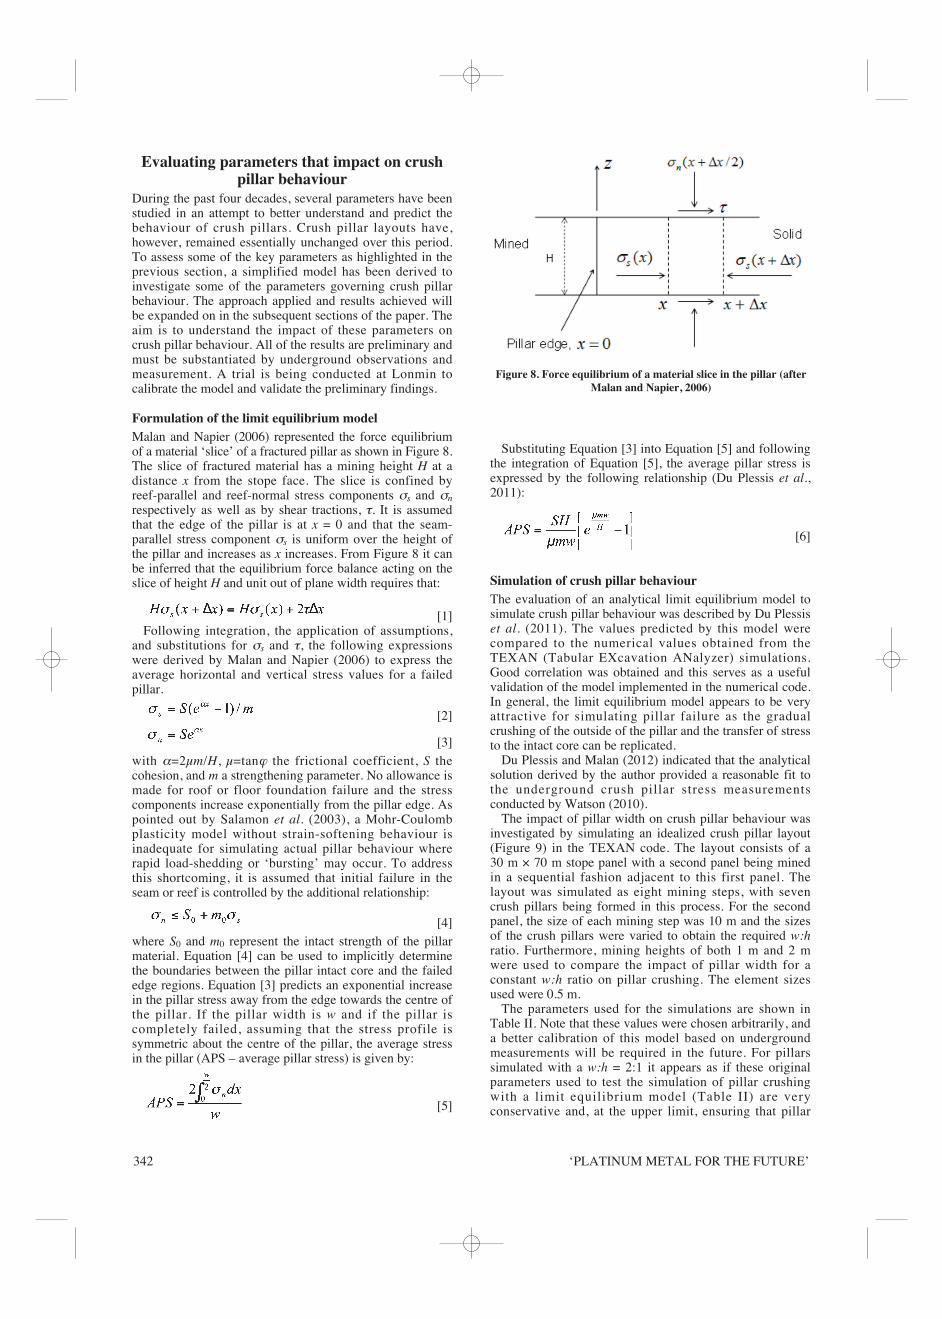
Uncertainty regarding pillar behaviour and design The measured and observed behaviour of a 2:1 Merenskycrush pillar is summarized in Figure 4 and Table I. Basedon stress measurements, Roberts et al. (2005b) determinedthat a crush pillar reaches its peak strength at between 3–10millistrains, then fails following a further compression ofapproximately 5 millistrains along an estimated negativepost-peak stiffness slope of 12 GN/m. Following furthercompression of the order of 50–90 millistrains, it isassumed that footwall heave occurs as a result of the lateralconfinement of the foundation. At this point it is assumedthat the crushing of the foundation restricts the pillar’s loadcapacity as the pillar is reliant on the foundation, which isbelieved to be the limiting load-bearing component. Furthercompression could result in an increase in the contactfriction angle; the result is a ‘squat effect’, with the slope ofthe stress-strain curve becoming positive. This is assumedto occur when the vertical strain is > 0.4.
The value of the peak pillar strength is unknown. Thevalues quoted above are based on estimates as described byRyder and Ozbay (1990).
On most mining operations, the design of the crush pillarsis based on trial and error. As the pillar strength isunknown, the pillar sizes are adjusted to obtain the correctbehaviour. Several factors affect the behaviour of the crushpillars and in many cases satisfactory pillar crushing is notachieved. This results in a seismic hazard in many of themines using crush pillars. If pillar crushing is not initiatedwhile the pillar is being formed at the mining face, as themining face advances and the pillars move to the back areaof a stope, smaller pillars may burst while oversized pillars
Figure 3. Typical layout (up-dip mining) for a narrow tabularreef mine using crush pillars – plan view
Figure 2. Photograph of a crush pillar in an underground trialsection at Lonmin
may punch into the footwall. There is therefore a point ofequilibrium which needs to be achieved to prevent thehazard of pillar-induced seismicity. If pillars are designedin such a way that they are fractured during cutting by theface abutment stresses so that the pillars will already haveyielded and reached their residual strength, furthercompression of the pillars will be associated with anincrease in load and stability ensured, (Ozbay and Roberts1988). The stiffness of the strata must therefore be greaterthan the post-peak stiffness of the pillar (Figure 5), orviolent pillar failure and hangingwall instability will occur(Figures 6 and 7). The pillar design should be aimed atdetermining pillar dimensions for which the post-peakcurve of the pillar is as flat as possible.
There are many factors influencing the behaviour ofcrush pillars. These factors impact on the ability of thepillar to crush as well as the reaction of the strata inresponse to the pillar when entering a post-peak state. Someof the contributing factors are highlighted below:
• Mining depth (stress)• Mining height and pillar size (w:h ratio)• Stope layouts, including the position of the pillars and
presence of a siding • Strata stiffness and the influence of mining losses (i.e.
potholes or unmined ground) or regional pillars• Strength of the pillar foundation relative to the pillar
strength and load being applied• Peak and residual pillar strength• Mining method resulting in over- or undersized pillars.
DESIGNING CONTROLLED PILLAR FAILURE – CRUSH PILLAR SUPPORT 341
Figure 4. The stress-strain curve of a 2:1 crush pillar (afterRoberts et al., 2005b)
Table IEstimated behaviour of a crush pillar with a w:h ratio of 2:1
(after Roberts et al., 2005)
Position Behaviour Value UnitA Stope closure (3 - 10) MillistrainsB Peak strength 75 - 150 MPaC Post-failure slope 12 GN/mD Residual pillar strength 13 -25 MPa E Squat effect 50 - 90 Millistrains
Figure 5. Stable (line ‘stiff’) and unstable (line ‘soft’) loading of arock specimen along its complete load deformation curve.
Regions A-B, B-C, C-D, and D-E represents pre-peak, post-peak,residual strength, and strain hardening respectively (after Ozbay
and Roberts, 1988)
Figure 6. Example of pillar foundation failure. The crushed rockis contained in the siding between the pillar and the pack. The
rings on the grout pack snapped during the event. The shatteredtimber elongate is an indication of the magnitude of this
behaviour
Figure 7. Example of pillar bursting. The scattered pillarmaterial was ejected into the siding. The white lines indicate thescatter relative to the stoping width. Timber elongates indicate
dynamic loading as a result of the event
‘PLATINUM METAL FOR THE FUTURE’342
Evaluating parameters that impact on crushpillar behaviour
During the past four decades, several parameters have beenstudied in an attempt to better understand and predict thebehaviour of crush pillars. Crush pillar layouts have,however, remained essentially unchanged over this period.To assess some of the key parameters as highlighted in theprevious section, a simplified model has been derived toinvestigate some of the parameters governing crush pillarbehaviour. The approach applied and results achieved willbe expanded on in the subsequent sections of the paper. Theaim is to understand the impact of these parameters oncrush pillar behaviour. All of the results are preliminary andmust be substantiated by underground observations andmeasurement. A trial is being conducted at Lonmin tocalibrate the model and validate the preliminary findings.
Formulation of the limit equilibrium modelMalan and Napier (2006) represented the force equilibriumof a material ‘slice’ of a fractured pillar as shown in Figure 8.The slice of fractured material has a mining height H at adistance x from the stope face. The slice is confined byreef-parallel and reef-normal stress components σs and σn
respectively as well as by shear tractions, τ. It is assumedthat the edge of the pillar is at x = 0 and that the seam-parallel stress component σs is uniform over the height ofthe pillar and increases as x increases. From Figure 8 it canbe inferred that the equilibrium force balance acting on theslice of height H and unit out of plane width requires that:
[1]Following integration, the application of assumptions,
and substitutions for σs and τ, the following expressionswere derived by Malan and Napier (2006) to express theaverage horizontal and vertical stress values for a failedpillar.
[2]
[3]with α=2μm/H, μ=tanϕ the frictional coefficient, S thecohesion, and m a strengthening parameter. No allowance ismade for roof or floor foundation failure and the stresscomponents increase exponentially from the pillar edge. Aspointed out by Salamon et al. (2003), a Mohr-Coulombplasticity model without strain-softening behaviour isinadequate for simulating actual pillar behaviour whererapid load-shedding or ‘bursting’ may occur. To addressthis shortcoming, it is assumed that initial failure in theseam or reef is controlled by the additional relationship:
[4]where S0 and m0 represent the intact strength of the pillarmaterial. Equation [4] can be used to implicitly determinethe boundaries between the pillar intact core and the failededge regions. Equation [3] predicts an exponential increasein the pillar stress away from the edge towards the centre ofthe pillar. If the pillar width is w and if the pillar iscompletely failed, assuming that the stress profile issymmetric about the centre of the pillar, the average stressin the pillar (APS – average pillar stress) is given by:
[5]
Substituting Equation [3] into Equation [5] and followingthe integration of Equation [5], the average pillar stress isexpressed by the following relationship (Du Plessis et al.,2011):
[6]
Simulation of crush pillar behaviourThe evaluation of an analytical limit equilibrium model tosimulate crush pillar behaviour was described by Du Plessiset al. (2011). The values predicted by this model werecompared to the numerical values obtained from theTEXAN (Tabular EXcavation ANalyzer) simulations.Good correlation was obtained and this serves as a usefulvalidation of the model implemented in the numerical code.In general, the limit equilibrium model appears to be veryattractive for simulating pillar failure as the gradualcrushing of the outside of the pillar and the transfer of stressto the intact core can be replicated.
Du Plessis and Malan (2012) indicated that the analyticalsolution derived by the author provided a reasonable fit tothe underground crush pillar stress measurementsconducted by Watson (2010).
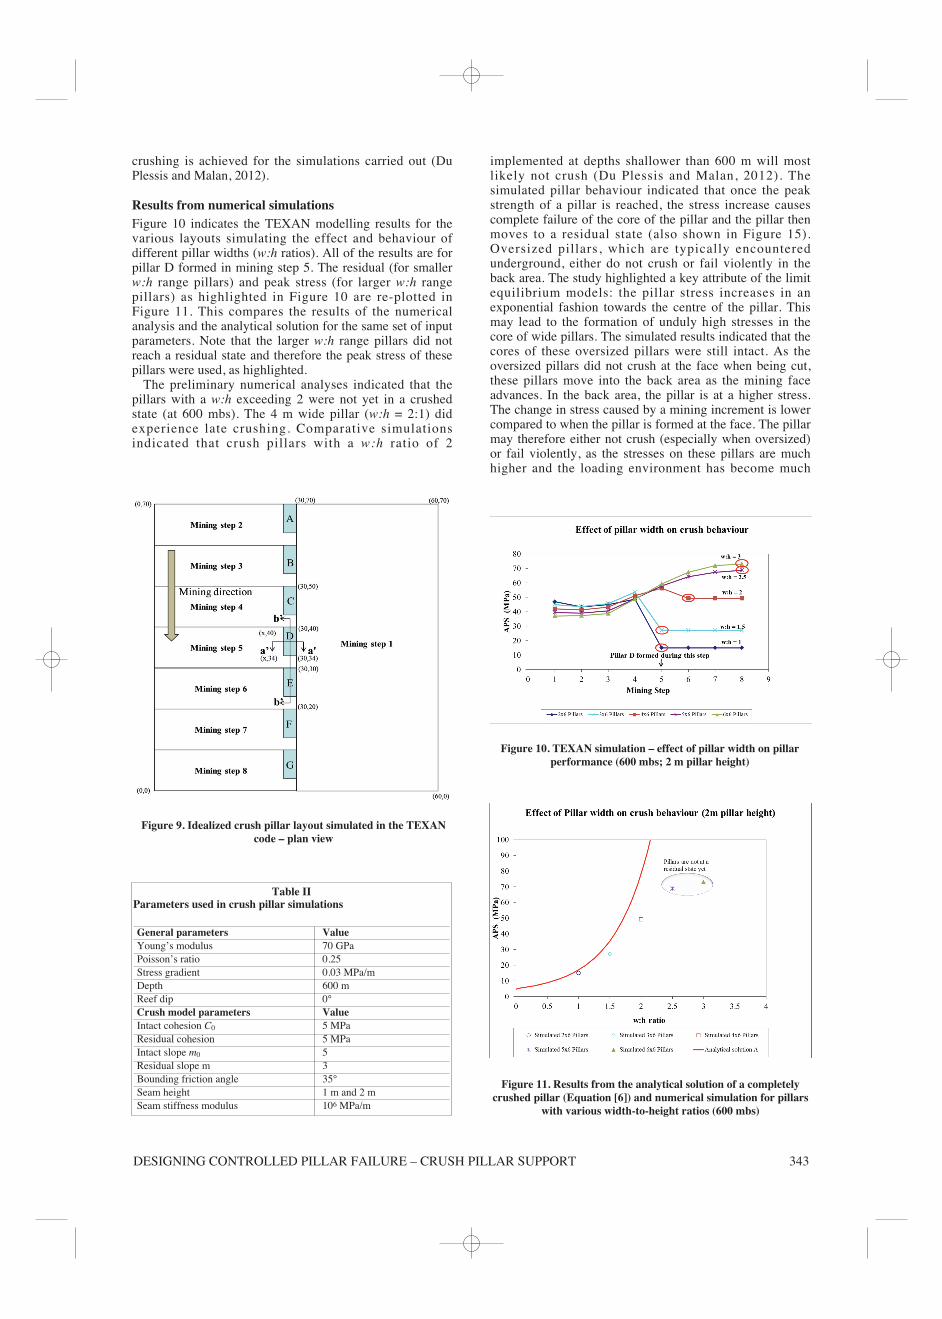
The impact of pillar width on crush pillar behaviour wasinvestigated by simulating an idealized crush pillar layout(Figure 9) in the TEXAN code. The layout consists of a30 m × 70 m stope panel with a second panel being minedin a sequential fashion adjacent to this first panel. Thelayout was simulated as eight mining steps, with sevencrush pillars being formed in this process. For the secondpanel, the size of each mining step was 10 m and the sizesof the crush pillars were varied to obtain the required w:hratio. Furthermore, mining heights of both 1 m and 2 mwere used to compare the impact of pillar width for aconstant w:h ratio on pillar crushing. The element sizesused were 0.5 m.
The parameters used for the simulations are shown inTable II. Note that these values were chosen arbitrarily, anda better calibration of this model based on undergroundmeasurements will be required in the future. For pillarssimulated with a w:h = 2:1 it appears as if these originalparameters used to test the simulation of pillar crushingwith a limit equilibrium model (Table II) are veryconservative and, at the upper limit, ensuring that pillar
Figure 8. Force equilibrium of a material slice in the pillar (afterMalan and Napier, 2006)
DESIGNING CONTROLLED PILLAR FAILURE – CRUSH PILLAR SUPPORT 343
crushing is achieved for the simulations carried out (DuPlessis and Malan, 2012).
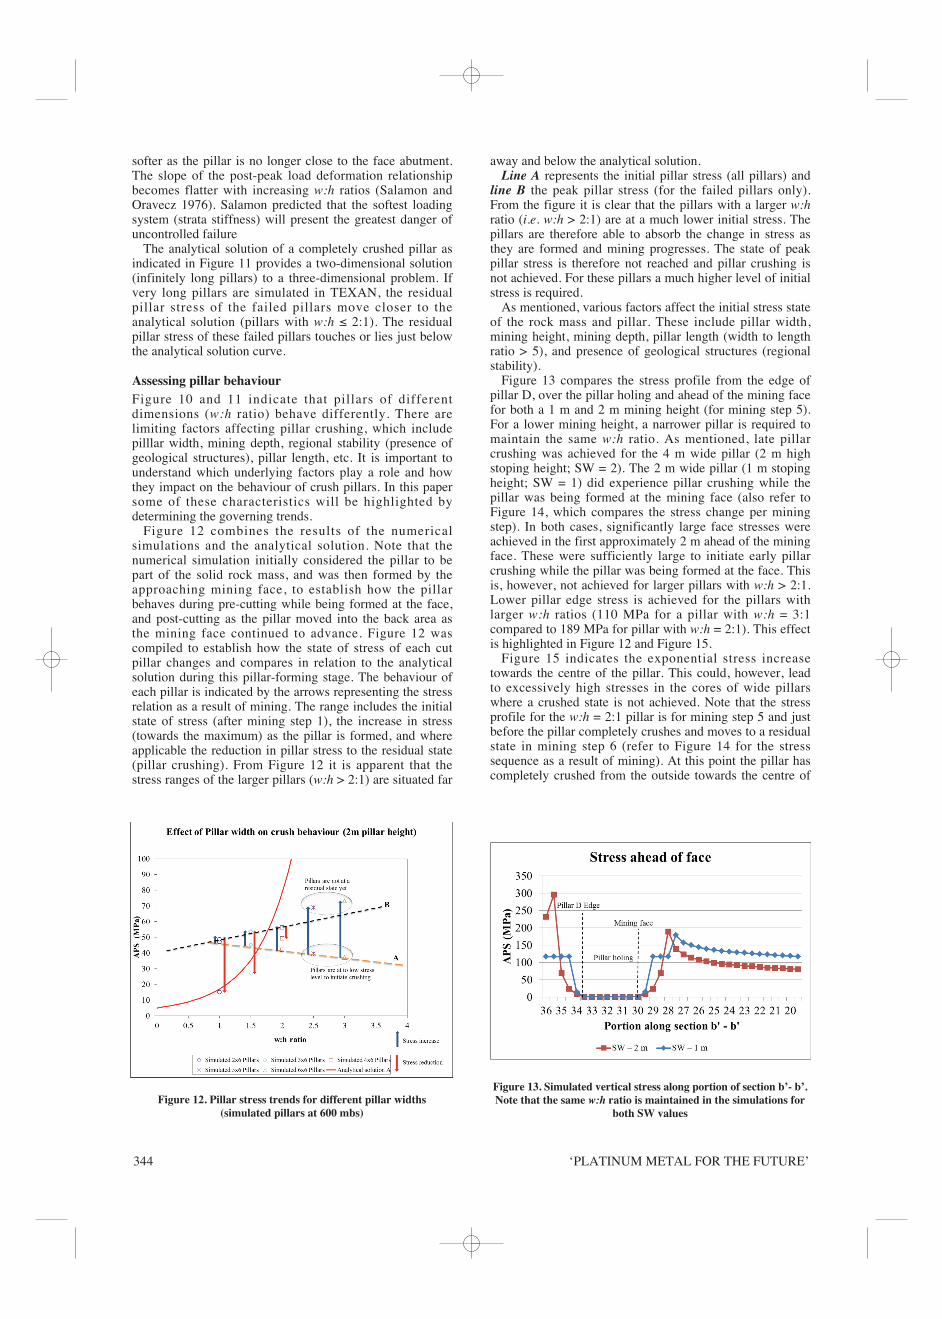
Results from numerical simulationsFigure 10 indicates the TEXAN modelling results for thevarious layouts simulating the effect and behaviour ofdifferent pillar widths (w:h ratios). All of the results are forpillar D formed in mining step 5. The residual (for smallerw:h range pillars) and peak stress (for larger w:h rangepillars) as highlighted in Figure 10 are re-plotted inFigure 11. This compares the results of the numericalanalysis and the analytical solution for the same set of inputparameters. Note that the larger w:h range pillars did notreach a residual state and therefore the peak stress of thesepillars were used, as highlighted.
The preliminary numerical analyses indicated that thepillars with a w:h exceeding 2 were not yet in a crushedstate (at 600 mbs). The 4 m wide pillar (w:h = 2:1) didexperience late crushing. Comparative simulationsindicated that crush pillars with a w:h ratio of 2
implemented at depths shallower than 600 m will mostlikely not crush (Du Plessis and Malan, 2012). Thesimulated pillar behaviour indicated that once the peakstrength of a pillar is reached, the stress increase causescomplete failure of the core of the pillar and the pillar thenmoves to a residual state (also shown in Figure 15).Oversized pillars, which are typically encounteredunderground, either do not crush or fail violently in theback area. The study highlighted a key attribute of the limitequilibrium models: the pillar stress increases in anexponential fashion towards the centre of the pillar. Thismay lead to the formation of unduly high stresses in thecore of wide pillars. The simulated results indicated that thecores of these oversized pillars were still intact. As theoversized pillars did not crush at the face when being cut,these pillars move into the back area as the mining faceadvances. In the back area, the pillar is at a higher stress.The change in stress caused by a mining increment is lowercompared to when the pillar is formed at the face. The pillarmay therefore either not crush (especially when oversized)or fail violently, as the stresses on these pillars are muchhigher and the loading environment has become much
Table IIParameters used in crush pillar simulations
General parameters ValueYoung’s modulus 70 GPaPoisson’s ratio 0.25Stress gradient 0.03 MPa/mDepth 600 mReef dip 0°Crush model parameters ValueIntact cohesion C0 5 MPaResidual cohesion 5 MPaIntact slope m0 5Residual slope m 3Bounding friction angle 35°Seam height 1 m and 2 mSeam stiffness modulus 106 MPa/m
Figure 11. Results from the analytical solution of a completelycrushed pillar (Equation [6]) and numerical simulation for pillars
with various width-to-height ratios (600 mbs)
Figure 10. TEXAN simulation – effect of pillar width on pillarperformance (600 mbs; 2 m pillar height)
Figure 9. Idealized crush pillar layout simulated in the TEXANcode – plan view
‘PLATINUM METAL FOR THE FUTURE’344
softer as the pillar is no longer close to the face abutment.The slope of the post-peak load deformation relationshipbecomes flatter with increasing w:h ratios (Salamon andOravecz 1976). Salamon predicted that the softest loadingsystem (strata stiffness) will present the greatest danger ofuncontrolled failure
The analytical solution of a completely crushed pillar asindicated in Figure 11 provides a two-dimensional solution(infinitely long pillars) to a three-dimensional problem. Ifvery long pillars are simulated in TEXAN, the residualpillar stress of the failed pillars move closer to theanalytical solution (pillars with w:h ≤ 2:1). The residualpillar stress of these failed pillars touches or lies just belowthe analytical solution curve.
Assessing pillar behaviourFigure 10 and 11 indicate that pillars of differentdimensions (w:h ratio) behave differently. There arelimiting factors affecting pillar crushing, which includepilllar width, mining depth, regional stability (presence ofgeological structures), pillar length, etc. It is important tounderstand which underlying factors play a role and howthey impact on the behaviour of crush pillars. In this papersome of these characteristics will be highlighted bydetermining the governing trends.
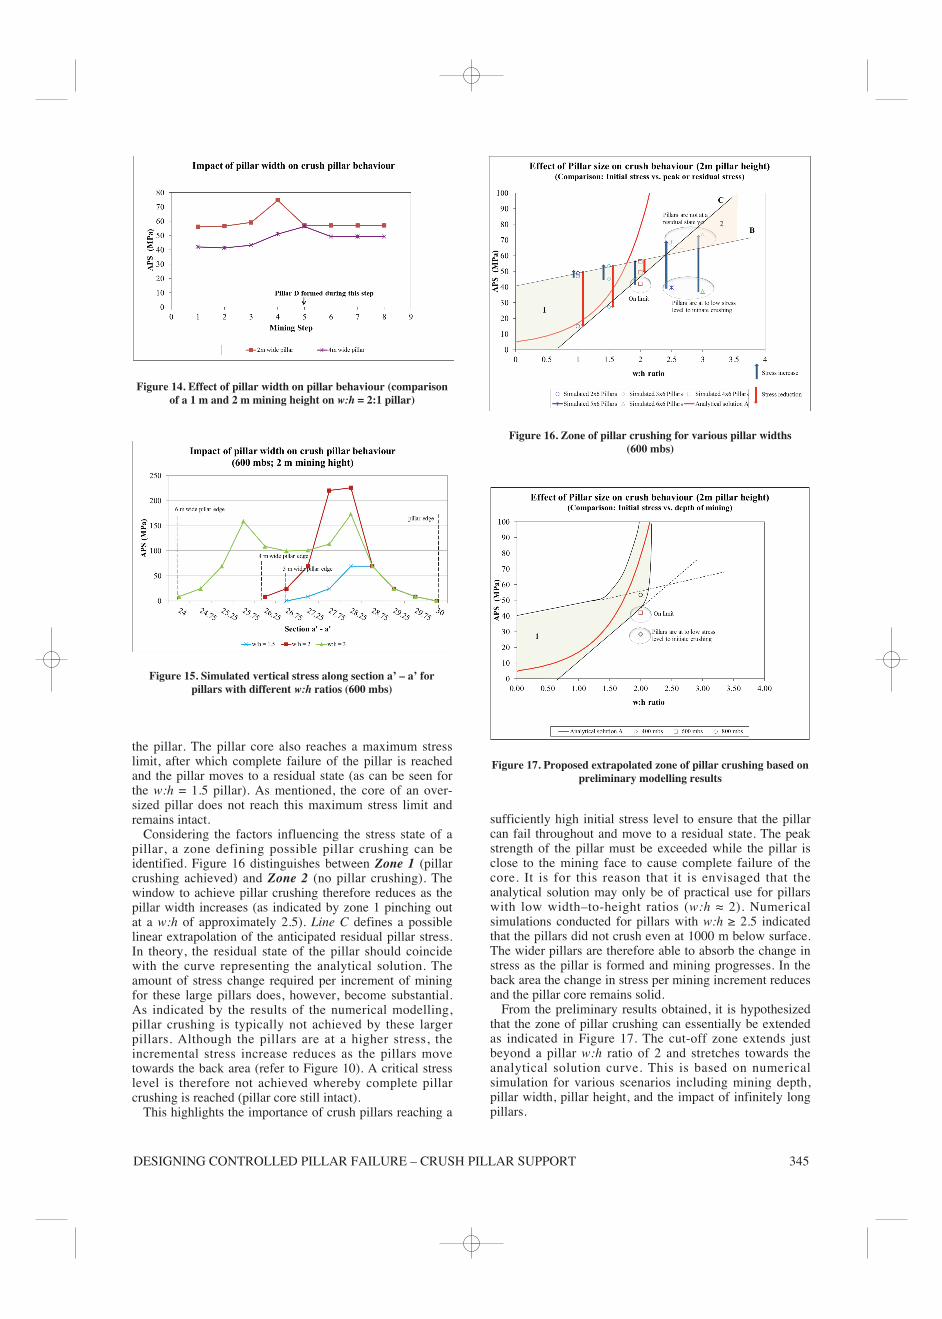
Figure 12 combines the results of the numericalsimulations and the analytical solution. Note that thenumerical simulation initially considered the pillar to bepart of the solid rock mass, and was then formed by theapproaching mining face, to establish how the pillarbehaves during pre-cutting while being formed at the face,and post-cutting as the pillar moved into the back area asthe mining face continued to advance. Figure 12 wascompiled to establish how the state of stress of each cutpillar changes and compares in relation to the analyticalsolution during this pillar-forming stage. The behaviour ofeach pillar is indicated by the arrows representing the stressrelation as a result of mining. The range includes the initialstate of stress (after mining step 1), the increase in stress(towards the maximum) as the pillar is formed, and whereapplicable the reduction in pillar stress to the residual state(pillar crushing). From Figure 12 it is apparent that thestress ranges of the larger pillars (w:h > 2:1) are situated far
away and below the analytical solution.Line A represents the initial pillar stress (all pillars) and
line B the peak pillar stress (for the failed pillars only).From the figure it is clear that the pillars with a larger w:hratio (i.e. w:h > 2:1) are at a much lower initial stress. Thepillars are therefore able to absorb the change in stress asthey are formed and mining progresses. The state of peakpillar stress is therefore not reached and pillar crushing isnot achieved. For these pillars a much higher level of initialstress is required.
As mentioned, various factors affect the initial stress stateof the rock mass and pillar. These include pillar width,mining height, mining depth, pillar length (width to lengthratio > 5), and presence of geological structures (regionalstability).
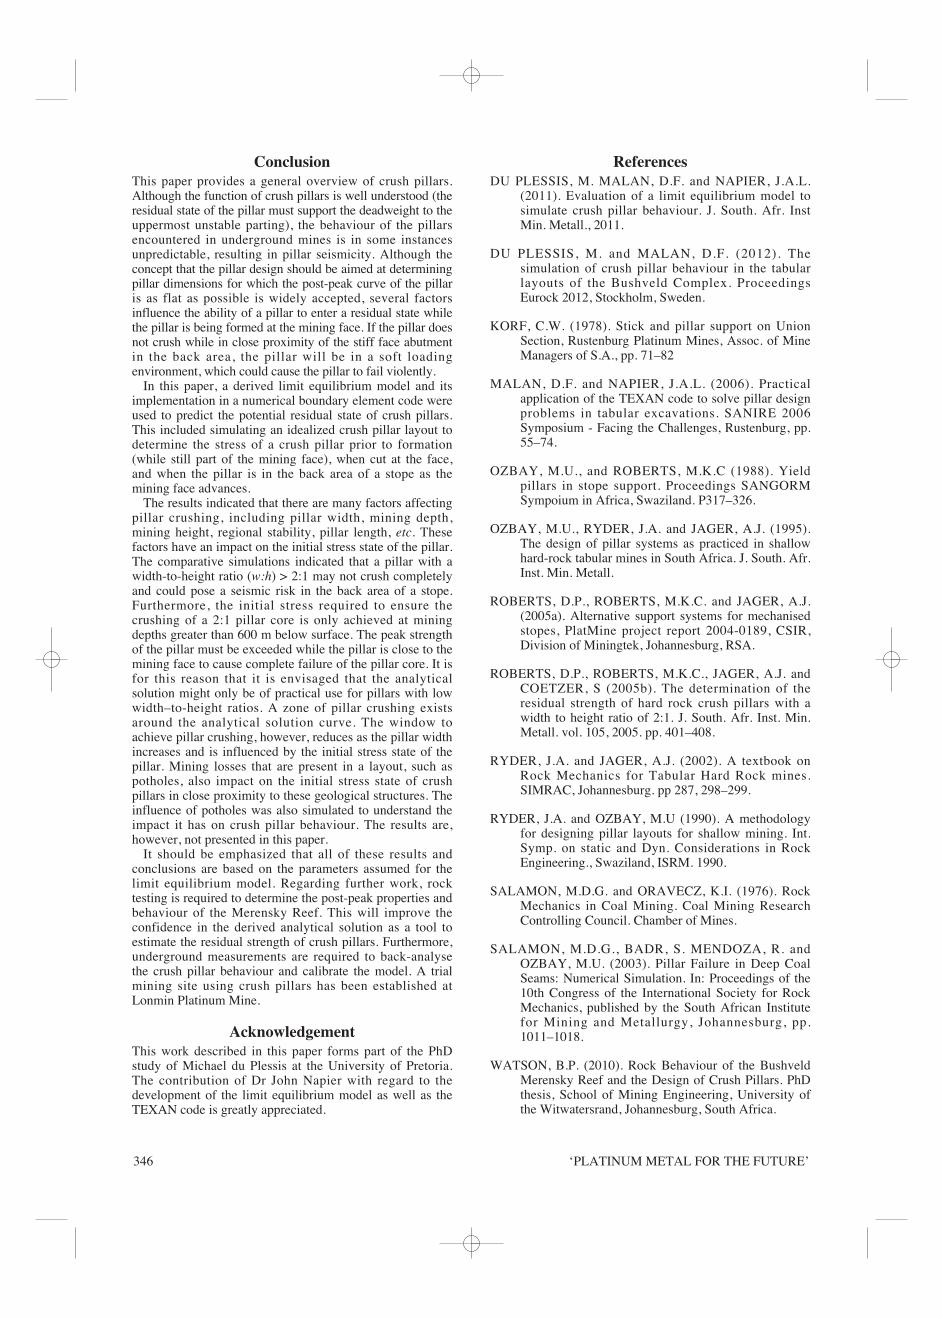
Figure 13 compares the stress profile from the edge ofpillar D, over the pillar holing and ahead of the mining facefor both a 1 m and 2 m mining height (for mining step 5).For a lower mining height, a narrower pillar is required tomaintain the same w:h ratio. As mentioned, late pillarcrushing was achieved for the 4 m wide pillar (2 m highstoping height; SW = 2). The 2 m wide pillar (1 m stopingheight; SW = 1) did experience pillar crushing while thepillar was being formed at the mining face (also refer toFigure 14, which compares the stress change per miningstep). In both cases, significantly large face stresses wereachieved in the first approximately 2 m ahead of the miningface. These were sufficiently large to initiate early pillarcrushing while the pillar was being formed at the face. Thisis, however, not achieved for larger pillars with w:h > 2:1.Lower pillar edge stress is achieved for the pillars withlarger w:h ratios (110 MPa for a pillar with w:h = 3:1compared to 189 MPa for pillar with w:h = 2:1). This effectis highlighted in Figure 12 and Figure 15.
Figure 15 indicates the exponential stress increasetowards the centre of the pillar. This could, however, leadto excessively high stresses in the cores of wide pillarswhere a crushed state is not achieved. Note that the stressprofile for the w:h = 2:1 pillar is for mining step 5 and justbefore the pillar completely crushes and moves to a residualstate in mining step 6 (refer to Figure 14 for the stresssequence as a result of mining). At this point the pillar hascompletely crushed from the outside towards the centre of
Figure 12. Pillar stress trends for different pillar widths(simulated pillars at 600 mbs)
Figure 13. Simulated vertical stress along portion of section b’- b’.Note that the same w:h ratio is maintained in the simulations for
both SW values
DESIGNING CONTROLLED PILLAR FAILURE – CRUSH PILLAR SUPPORT 345
the pillar. The pillar core also reaches a maximum stresslimit, after which complete failure of the pillar is reachedand the pillar moves to a residual state (as can be seen forthe w:h = 1.5 pillar). As mentioned, the core of an over-sized pillar does not reach this maximum stress limit andremains intact.
Considering the factors influencing the stress state of apillar, a zone defining possible pillar crushing can beidentified. Figure 16 distinguishes between Zone 1 (pillarcrushing achieved) and Zone 2 (no pillar crushing). Thewindow to achieve pillar crushing therefore reduces as thepillar width increases (as indicated by zone 1 pinching outat a w:h of approximately 2.5). Line C defines a possiblelinear extrapolation of the anticipated residual pillar stress.In theory, the residual state of the pillar should coincidewith the curve representing the analytical solution. Theamount of stress change required per increment of miningfor these large pillars does, however, become substantial.As indicated by the results of the numerical modelling,pillar crushing is typically not achieved by these largerpillars. Although the pillars are at a higher stress, theincremental stress increase reduces as the pillars movetowards the back area (refer to Figure 10). A critical stresslevel is therefore not achieved whereby complete pillarcrushing is reached (pillar core still intact).
This highlights the importance of crush pillars reaching a
sufficiently high initial stress level to ensure that the pillarcan fail throughout and move to a residual state. The peakstrength of the pillar must be exceeded while the pillar isclose to the mining face to cause complete failure of thecore. It is for this reason that it is envisaged that theanalytical solution may only be of practical use for pillarswith low width–to-height ratios (w:h ≈ 2). Numericalsimulations conducted for pillars with w:h ≥ 2.5 indicatedthat the pillars did not crush even at 1000 m below surface.The wider pillars are therefore able to absorb the change instress as the pillar is formed and mining progresses. In theback area the change in stress per mining increment reducesand the pillar core remains solid.
From the preliminary results obtained, it is hypothesizedthat the zone of pillar crushing can essentially be extendedas indicated in Figure 17. The cut-off zone extends justbeyond a pillar w:h ratio of 2 and stretches towards theanalytical solution curve. This is based on numericalsimulation for various scenarios including mining depth,pillar width, pillar height, and the impact of infinitely longpillars.
Figure 14. Effect of pillar width on pillar behaviour (comparisonof a 1 m and 2 m mining height on w:h = 2:1 pillar)
Figure 15. Simulated vertical stress along section a’ – a’ forpillars with different w:h ratios (600 mbs)
Figure 16. Zone of pillar crushing for various pillar widths(600 mbs)
Figure 17. Proposed extrapolated zone of pillar crushing based onpreliminary modelling results
‘PLATINUM METAL FOR THE FUTURE’346
ConclusionThis paper provides a general overview of crush pillars.Although the function of crush pillars is well understood (theresidual state of the pillar must support the deadweight to theuppermost unstable parting), the behaviour of the pillarsencountered in underground mines is in some instancesunpredictable, resulting in pillar seismicity. Although theconcept that the pillar design should be aimed at determiningpillar dimensions for which the post-peak curve of the pillaris as flat as possible is widely accepted, several factorsinfluence the ability of a pillar to enter a residual state whilethe pillar is being formed at the mining face. If the pillar doesnot crush while in close proximity of the stiff face abutmentin the back area, the pillar will be in a soft loadingenvironment, which could cause the pillar to fail violently.
In this paper, a derived limit equilibrium model and itsimplementation in a numerical boundary element code wereused to predict the potential residual state of crush pillars.This included simulating an idealized crush pillar layout todetermine the stress of a crush pillar prior to formation(while still part of the mining face), when cut at the face,and when the pillar is in the back area of a stope as themining face advances.
The results indicated that there are many factors affectingpillar crushing, including pillar width, mining depth,mining height, regional stability, pillar length, etc. Thesefactors have an impact on the initial stress state of the pillar.The comparative simulations indicated that a pillar with awidth-to-height ratio (w:h) > 2:1 may not crush completelyand could pose a seismic risk in the back area of a stope.Furthermore, the initial stress required to ensure thecrushing of a 2:1 pillar core is only achieved at miningdepths greater than 600 m below surface. The peak strengthof the pillar must be exceeded while the pillar is close to themining face to cause complete failure of the pillar core. It isfor this reason that it is envisaged that the analyticalsolution might only be of practical use for pillars with lowwidth–to-height ratios. A zone of pillar crushing existsaround the analytical solution curve. The window toachieve pillar crushing, however, reduces as the pillar widthincreases and is influenced by the initial stress state of thepillar. Mining losses that are present in a layout, such aspotholes, also impact on the initial stress state of crushpillars in close proximity to these geological structures. Theinfluence of potholes was also simulated to understand theimpact it has on crush pillar behaviour. The results are,however, not presented in this paper.
It should be emphasized that all of these results andconclusions are based on the parameters assumed for thelimit equilibrium model. Regarding further work, rocktesting is required to determine the post-peak properties andbehaviour of the Merensky Reef. This will improve theconfidence in the derived analytical solution as a tool toestimate the residual strength of crush pillars. Furthermore,underground measurements are required to back-analysethe crush pillar behaviour and calibrate the model. A trialmining site using crush pillars has been established atLonmin Platinum Mine.
AcknowledgementThis work described in this paper forms part of the PhDstudy of Michael du Plessis at the University of Pretoria.The contribution of Dr John Napier with regard to thedevelopment of the limit equilibrium model as well as theTEXAN code is greatly appreciated.
ReferencesDU PLESSIS, M. MALAN, D.F. and NAPIER, J.A.L.
(2011). Evaluation of a limit equilibrium model tosimulate crush pillar behaviour. J. South. Afr. InstMin. Metall., 2011.
DU PLESSIS, M. and MALAN, D.F. (2012). Thesimulation of crush pillar behaviour in the tabularlayouts of the Bushveld Complex. ProceedingsEurock 2012, Stockholm, Sweden.
KORF, C.W. (1978). Stick and pillar support on UnionSection, Rustenburg Platinum Mines, Assoc. of MineManagers of S.A., pp. 71–82
MALAN, D.F. and NAPIER, J.A.L. (2006). Practicalapplication of the TEXAN code to solve pillar designproblems in tabular excavations. SANIRE 2006Symposium - Facing the Challenges, Rustenburg, pp.55–74.
OZBAY, M.U., and ROBERTS, M.K.C (1988). Yieldpillars in stope support. Proceedings SANGORMSympoium in Africa, Swaziland. P317–326.
OZBAY, M.U., RYDER, J.A. and JAGER, A.J. (1995).The design of pillar systems as practiced in shallowhard-rock tabular mines in South Africa. J. South. Afr.Inst. Min. Metall.
ROBERTS, D.P., ROBERTS, M.K.C. and JAGER, A.J.(2005a). Alternative support systems for mechanisedstopes, PlatMine project report 2004-0189, CSIR,Division of Miningtek, Johannesburg, RSA.
ROBERTS, D.P., ROBERTS, M.K.C., JAGER, A.J. andCOETZER, S (2005b). The determination of theresidual strength of hard rock crush pillars with awidth to height ratio of 2:1. J. South. Afr. Inst. Min.Metall. vol. 105, 2005. pp. 401–408.
RYDER, J.A. and JAGER, A.J. (2002). A textbook onRock Mechanics for Tabular Hard Rock mines.SIMRAC, Johannesburg. pp 287, 298–299.
RYDER, J.A. and OZBAY, M.U (1990). A methodologyfor designing pillar layouts for shallow mining. Int.Symp. on static and Dyn. Considerations in RockEngineering., Swaziland, ISRM. 1990.
SALAMON, M.D.G. and ORAVECZ, K.I. (1976). RockMechanics in Coal Mining. Coal Mining ResearchControlling Council. Chamber of Mines.
SALAMON, M.D.G., BADR, S. MENDOZA, R. andOZBAY, M.U. (2003). Pillar Failure in Deep CoalSeams: Numerical Simulation. In: Proceedings of the10th Congress of the International Society for RockMechanics, published by the South African Institutefor Mining and Metallurgy, Johannesburg, pp.1011–1018.
WATSON, B.P. (2010). Rock Behaviour of the BushveldMerensky Reef and the Design of Crush Pillars. PhDthesis, School of Mining Engineering, University ofthe Witwatersrand, Johannesburg, South Africa.

DESIGNING CONTROLLED PILLAR FAILURE – CRUSH PILLAR SUPPORT 347
Michael du Plessis Group Rock Engineer, Lonmin
Worked in the Rock Engineering industry for the past 13 years. Previous employment includedAnglo Platinum and Minova. Joined Lonmin in 2007 and was appointed as the Group RockEngineer in 2009.

‘PLATINUM METAL FOR THE FUTURE’348