designing biomaterial surfaces to enhance adhesion at the ...designing biomaterial surfaces to...
TRANSCRIPT
Designing Biomaterial Surfaces to Enhance Adhesion at the Skin-
Implant Interface
A thesis submitted to the faculty of
WORCESTER POLYTECHNIC INSTITUTE
In partial fulfillment of the requirements for the
Degree of Master of Science
By
_________________________________
Cara M. Ting
May 2011
Approved:
_________________________________
George Pins, PhD, Thesis Advisor
_________________________________
Kristen Billiar, PhD, Committee Member
_________________________________
Marsha Rolle, PhD, Committee Member

1
Acknowledgements and Funding
I would like to thank the following people for their contributions to this research:
Dr. George Pins for all of his guidance and patience through this process in his role as my advisor.
Dr. Kristen Billiar and Dr. Marsha Rolle for their advice and guidance while serving on my committee.
Dr. Katie Bush, Amanda Clement, Jen Sansom, and the other member of the Pins’ lab for their support,
help, and advice.
Sarah Mattessich for all of her hard work on the AFM imaging and analysis and for her help with the
fluorescence microscopy.
Dr. W. Grant McGimpsey, Dr. Christopher Lambert, and Aung Khaing for making all the SAMs used in
this research and for their insight into SAMs characterization and troubleshooting.
Dr. Terri Camesano and Ivan Ivanov for use of the AFM and for their help in running the machine, using
the software, and interpreting the resulting data.
Dr. Tanja Dominko and Dr. Ray Page for the use of their centrifuge for the centrifugation assay.
The Department of Obstetrics and Gynecology at UMass Memorial Medical Center for the donation of
the tissue used to provide all the keratinocytes utilized in this research.
My family and friends, especially my parents and my husband, Aaron. I never would have completed this
thesis without all of their support and encouragement.
This research was funded in part by:
NIH (EB-005645)
U.S. Army Medical Research and Material Command (USAMRC); grant W81XWH-08-01-0422.
“The views, opinions, and/or findings and information contained in this manuscript are those of the
authors and should not be construed as an official Department of Defense position or policy, unless so
designated by other documentation. No official endorsement should be made.
2
Abstract
The skin-implant interface of percutaneous devices is generally weak and can fail when
excessive loading disrupts the sealing of the interface by dermal and epidermal cells and tissue.
As such, the formation of a stable implant-skin junction is a major factor in determining
percutaneous implant success. In this study, we used functionalized self-assembled monolayers
(SAMs) with discrete surface properties as model systems to assess the effects of biomaterial
surface properties on controlling fibronectin (FN) adsorption and keratinocyte spreading and
adhesion. The surface properties investigated were charge (positive and negative) and wettability
(hydrophobic and hydrophilic). Gold slides prepared with SAMs were incubated with FN
overnight. The cell binding sites were quantified on each surface using an antibody that targets
the synergy binding site of the cell binding domains (HFN7.1) and the topography of the FN on
the surfaces was evaluated with atomic force microscopy. The topography data demonstrated
that the availability of cell binding domains is dependent on surface-mediated FN binding
orientation. Cell spreading was assessed using a lipid membrane stain, maleimide. The cells were
imaged by fluorescence microscopy and the cell area calculated. The percentage of cell adhesion
was determined using a centrifugal force assay. Both keratinocyte assays suggested that the
charge of the surface was the prominent factor in determining cell function on the surface over
the surface wettability. The findings of this study strongly suggest that a positively charged
implant surface with a FN coating will enhance the strength of the cutaneous seal around
percutaneous implants over an unmodified surface.
3
Table of Contents Acknowledgements and Funding .................................................................................................................. 1
Abstract ......................................................................................................................................................... 2
Table of Figures ............................................................................................................................................ 5
Table of Tables ............................................................................................................................................. 6
Table of Abbreviations ................................................................................................................................. 7
Chapter 1: Introduction ................................................................................................................................. 8
Chapter 2: Background ............................................................................................................................... 10
2.1 Infection is the leading cause of percutaneous implant failure ......................................................... 10
2.2 Epidermis as a barrier to infection .................................................................................................... 13
2.3 Keratinocytes and extracellular matrix cues ..................................................................................... 14
2.4 Fibronectin Structure and α5β1 integrin receptors ........................................................................... 16
2.5 Surface chemistry controls fibronectin binding ................................................................................ 17
2.6 Modified fibronectin binding alters cell functions ............................................................................ 18
Chapter 3: Hypothesis and Specific Aims .................................................................................................. 21
3.1 Specific Aim 1 .................................................................................................................................. 21
3.1.1 Characterize surfaces with contact angle measurements ........................................................... 22
3.1.2 Quantify cell binding domains using HFN7.1 ........................................................................... 22
3.1.3 Investigate surface modulated changes in FN adsorption on surfaces using AFM .................... 23
3.2 Specific Aim 2 .................................................................................................................................. 23
3.2.1 Evaluate keratinocyte spreading on FN-coated surfaces............................................................ 23
3.2.2 Compute keratinocyte adhesion on surfaces using centrifugation technique ............................. 24
3.2.3 Visualize focal adhesion complexes using vinculin staining ..................................................... 26
Chapter 4: Materials and Methods .............................................................................................................. 28
4.1 Keratinocyte culture .......................................................................................................................... 28
4.2 Production of self-assembled monolayers ........................................................................................ 28
4.3 Measuring contact angles .................................................................................................................. 29
4.4 Quantifying cell binding domains with HFN7.1 ............................................................................... 29
4.5 Assessing FN topography with atomic force microscopy ................................................................. 31
4.6 Evaluating KC spreading with maleimide ........................................................................................ 31
4.7 Computing KC adhesion with centrifugation ................................................................................... 32
4.8 Visualizing FACs with vinculin ........................................................................................................ 32
Chapter 5: Results ....................................................................................................................................... 34
4
5.1 Fibronectin adsorption to surface ..................................................................................................... 34
5.1.1 Contact angle characterization of surface wettability ................................................................ 34
5.1.2 Cell binding domain availability assessed using HFN7.1 ......................................................... 35
5.1.3 Observing FN topography with AFM ....................................................................................... 35
5.2 Keratinocyte spreading and adhesion .............................................................................................. 37
5.2.1 Evaluating KC spreading using maleimide ............................................................................... 37
5.2.2 Utilizing centrifugation to assess KC adhesion ........................................................................ 40
5.2.3 Quantifying FAC activation using vinculin .............................................................................. 41
Chapter 6: Discussion ................................................................................................................................. 45
6.1 FN adsorption surface dependent ...................................................................................................... 45
6.1.1 Contact angle measurements within published ranges ............................................................... 45
6.1.2 Binding sites increased on positive charged and hydrophobic surfaces .................................... 46
6.1.3 AFM demonstrated surface modified FN topography ............................................................... 47
6.2 Positively charged surface increased cell spreading and adhesion .................................................. 48
6.2.1 Positive charged surface increased KC spreading ..................................................................... 48
6.2.2 Positive charged surface increased cell adhesion ....................................................................... 49
6.2.3 Quantifying FAC area using vinculin ........................................................................................ 50
6.3 Trends in data identify a preferred surface chemistry ....................................................................... 52
Chapter 7: Future Work and Recommendations ......................................................................................... 53
7.1 Short term recommendations ............................................................................................................ 53
7.2 Long term recommendations ............................................................................................................ 54
Chapter 8: Conclusions ............................................................................................................................... 56
References ................................................................................................................................................... 57
Appendix A: Contact angle measurement data ........................................................................................... 64
Appendix B: HFN7.1 staining images and data .......................................................................................... 65
Appendix C: RMS roughness data .............................................................................................................. 67
Appendix D: Cell spreading data ................................................................................................................ 68
Appendix E: Cell adhesion data .................................................................................................................. 73
Appendix F: Vinculin staining data ............................................................................................................ 76
5
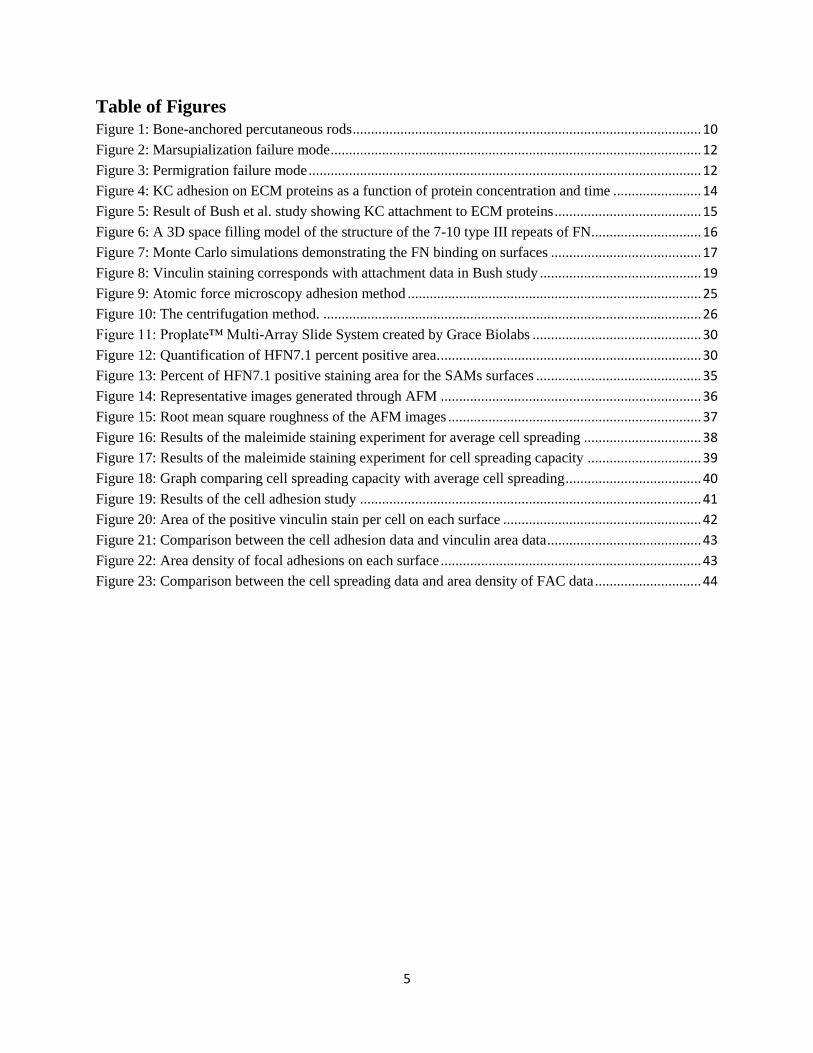
Table of Figures
Figure 1: Bone-anchored percutaneous rods ............................................................................................... 10
Figure 2: Marsupialization failure mode ..................................................................................................... 12
Figure 3: Permigration failure mode ........................................................................................................... 12
Figure 4: KC adhesion on ECM proteins as a function of protein concentration and time ........................ 14
Figure 5: Result of Bush et al. study showing KC attachment to ECM proteins ........................................ 15
Figure 6: A 3D space filling model of the structure of the 7-10 type III repeats of FN .............................. 16
Figure 7: Monte Carlo simulations demonstrating the FN binding on surfaces ......................................... 17
Figure 8: Vinculin staining corresponds with attachment data in Bush study ............................................ 19
Figure 9: Atomic force microscopy adhesion method ................................................................................ 25
Figure 10: The centrifugation method. ....................................................................................................... 26
Figure 11: Proplate™ Multi-Array Slide System created by Grace Biolabs .............................................. 30
Figure 12: Quantification of HFN7.1 percent positive area. ....................................................................... 30
Figure 13: Percent of HFN7.1 positive staining area for the SAMs surfaces ............................................. 35
Figure 14: Representative images generated through AFM ....................................................................... 36
Figure 15: Root mean square roughness of the AFM images ..................................................................... 37
Figure 16: Results of the maleimide staining experiment for average cell spreading ................................ 38
Figure 17: Results of the maleimide staining experiment for cell spreading capacity ............................... 39
Figure 18: Graph comparing cell spreading capacity with average cell spreading ..................................... 40
Figure 19: Results of the cell adhesion study ............................................................................................. 41
Figure 20: Area of the positive vinculin stain per cell on each surface ...................................................... 42
Figure 21: Comparison between the cell adhesion data and vinculin area data .......................................... 43
Figure 22: Area density of focal adhesions on each surface ....................................................................... 43
Figure 23: Comparison between the cell spreading data and area density of FAC data ............................. 44

6
Table of Tables
Table 1: Infection rates in studies involving percutaneous implants .......................................................... 11
Table 2: SAMs: terminal groups, chemical, contact angles and properties ................................................ 18
Table 3: Chemicals used to create SAMs slides ......................................................................................... 29
Table 4: Reported contact angles for our study .......................................................................................... 34
Table 5: The change in adhesion % when increasing force from 1xg to 50xg. .......................................... 41
Table 6: Trends in the functional cell assays. ............................................................................................. 52
7
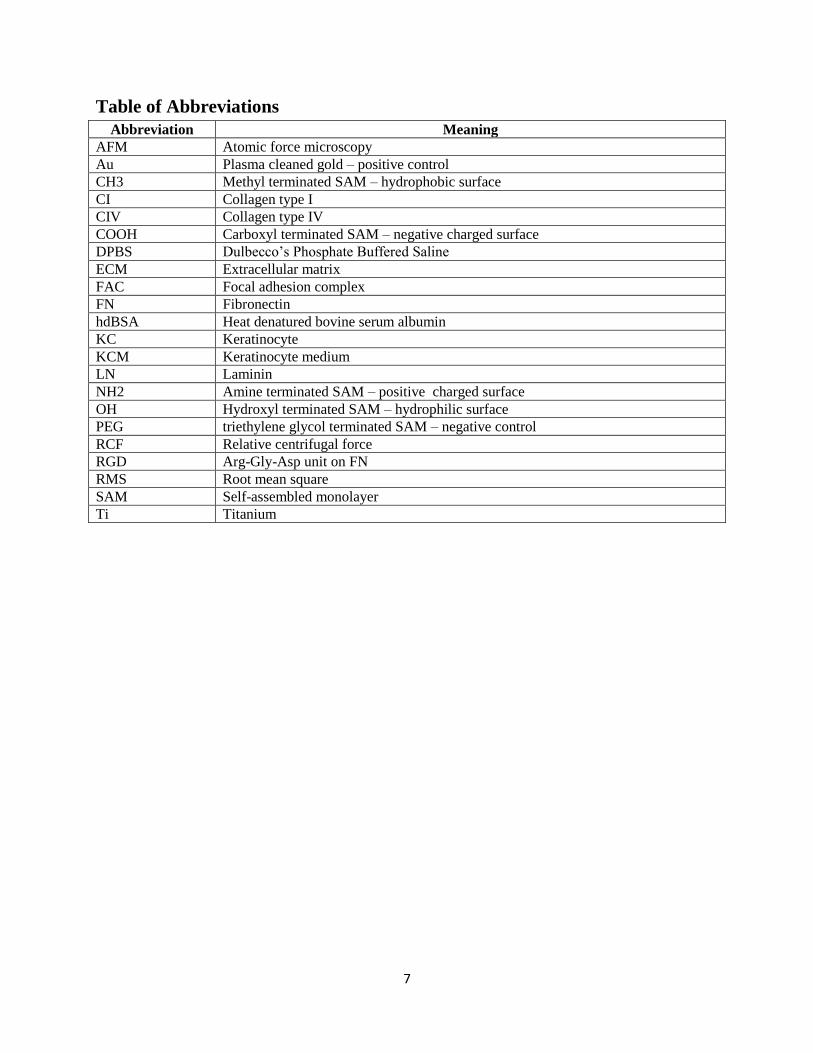
Table of Abbreviations
Abbreviation Meaning
AFM Atomic force microscopy
Au Plasma cleaned gold – positive control
CH3 Methyl terminated SAM – hydrophobic surface
CI Collagen type I
CIV Collagen type IV
COOH Carboxyl terminated SAM – negative charged surface
DPBS Dulbecco’s Phosphate Buffered Saline
ECM Extracellular matrix
FAC Focal adhesion complex
FN Fibronectin
hdBSA Heat denatured bovine serum albumin
KC Keratinocyte
KCM Keratinocyte medium
LN Laminin
NH2 Amine terminated SAM – positive charged surface
OH Hydroxyl terminated SAM – hydrophilic surface
PEG triethylene glycol terminated SAM – negative control
RCF Relative centrifugal force
RGD Arg-Gly-Asp unit on FN
RMS Root mean square
SAM Self-assembled monolayer
Ti Titanium
8
Chapter 1: Introduction
In current United States military actions in Iraq and Afghanistan, there is a 5.2%
amputation rate among all severe casualties [1]. Due to this high rate of amputation, the military
is invested in prosthetic research to care for its wounded veterans. Traditional socket prosthetics
are associated with a low quality of life due to skin irritation and difficulty in donning and using
the prosthetic. Consequently, many amputees choose to have a bone-anchored titanium
percutaneous rod implanted to aid with prosthetic attachment and function [2-7]. Patients with
percutaneous implants show an overall increased quality of life, however, these implants have a
high rate of failure due to infection, mechanically-induced chronic inflammation, and implant
marsupialization, resulting from an insufficient seal between the implant and the epidermis [8-
11]. In order for these implants to have enduring applications in the treatment of amputees, the
skin-implant interface must be engineered to create a robust cutaneous seal.
Although there are several approaches for addressing this need, one of the most
promising involves coating the surface of the implant with an extracellular matrix protein,
fibronectin (FN) [12, 13]. This is done to mimic the in vivo environment of the wounded
epidermis, specifically activated basal keratinocytes, which proliferate and differentiate to
produce the upper, cornified, protective layers of the epidermis following an injury. The
formation of protective cornified epidermis is crucial to preventing bacterial infiltration and
infection. [14, 15]
Keratinocyte attachment to FN occurs due to the interaction between the α5β1 integrin
binding to the cell binding domains on FN known as the RGD and PHSRN sites [16, 17]. These
two sites work synergistically and are found close together on the protein on the 9th
and 10th
type
III modules of FN [18]. Since FN is a dipole protein, the orientation and cell binding site
availability of the adsorbed FN depends on the chemistry of the underlying surface [19-21]. In
2009, Bush et al. published a study which examined keratinocyte attachment, spreading, and
differentiation on four discrete, tailored biomaterial surfaces that were hydrophobic, hydrophilic,
positively charged, and negatively charged. This study demonstrated that the positively charged
and the hydrophobic surfaces had greater keratinocyte spreading and attachment and fewer
differentiated keratinocytes. [17] These findings suggest that a change in FN binding site
availability can alter keratinocyte function and we seek to determine if this is also true for
keratinocyte adhesion.

9
We hypothesize that surface mediated changes in FN binding orientation and cell
binding domain presentation can precisely modulate keratinocyte spreading and adhesion.
Ultimately, the results of this study will facilitate the identification of design criteria allowing for
a selection of an ideal surface chemistry for FN coatings to enhance keratinocyte mediated
functions to improve the cutaneous seal around percutaneous implants.
Towards that end, the goals of this study are to use well defined surface chemistries to:
1. Control FN binding orientation
2. Enhance cell binding domain availability
3. Support keratinocyte spreading
4. Increase keratinocyte adhesion
We adsorbed 25 µg/mL of fibronectin to model surfaces with discrete surface properties:
positively charged, negatively charged, hydrophobic, and hydrophilic. We quantified the amount
of cell binding domains on each surface and compared that data to FN topography data obtained
using atomic force microscopy. These findings show that the positively charged surface and
hydrophobic surfaces had a greater percentage of available binding sites over the negatively
charged surface and the hydrophilic surface. The topography data suggests that the changes in
binding site availability are due to surface-mediated changes in FN binding orientation, which is
supported by the literature [20, 21]. The surfaces were seeded with KCs and the functional cell
assays were performed to measure cell spreading and adhesion to the surfaces. The functional
assays showed an increase in spreading and adhesion on the positively charged surface over the
negatively charged surface and little to no difference in spreading and adhesion between the
hydrophobic and hydrophilic surfaces. This suggests that the surface charge is a prominent factor
for improving FN orientation and cell adhesion to a FN adsorbed surface over wettability. Our
findings strongly suggest that a positive charge is the most promising surface chemistry for
improving the strength of the cutaneous seal around percutaneous implants.
10
Chapter 2: Background
2.1 Infection is the leading cause of percutaneous implant failure
In current United States military actions in Iraq and Afghanistan, 70.5% of serious
American casualties are due to limb injuries. Of these casualties, 7.4% of the injuries result in
amputation, incurring a 5.2% amputation rate among all severe casualties [1]. Due to this high
rate of amputation, the military is invested in prosthetic research to care for its wounded
veterans. Traditionally, amputees are fitted for a socket prosthetic. The residual limb is inserted
into the socket of the prosthetic limb, which attaches to the body through suction and friction and
may be supplemented with straps and harnesses. This design requires a significant amount of
surface area between the prosthetic and the skin and humidity can accumulate inside the socket
due to sweat from the limb. This leads to skin irritation, dermatitis, sores, and an overall lower
quality of life, which causes many wearers to stop using their prostheses. [2-5] To avoid issues
with the socket prostheses, many amputees choose to have a bone-anchored titanium
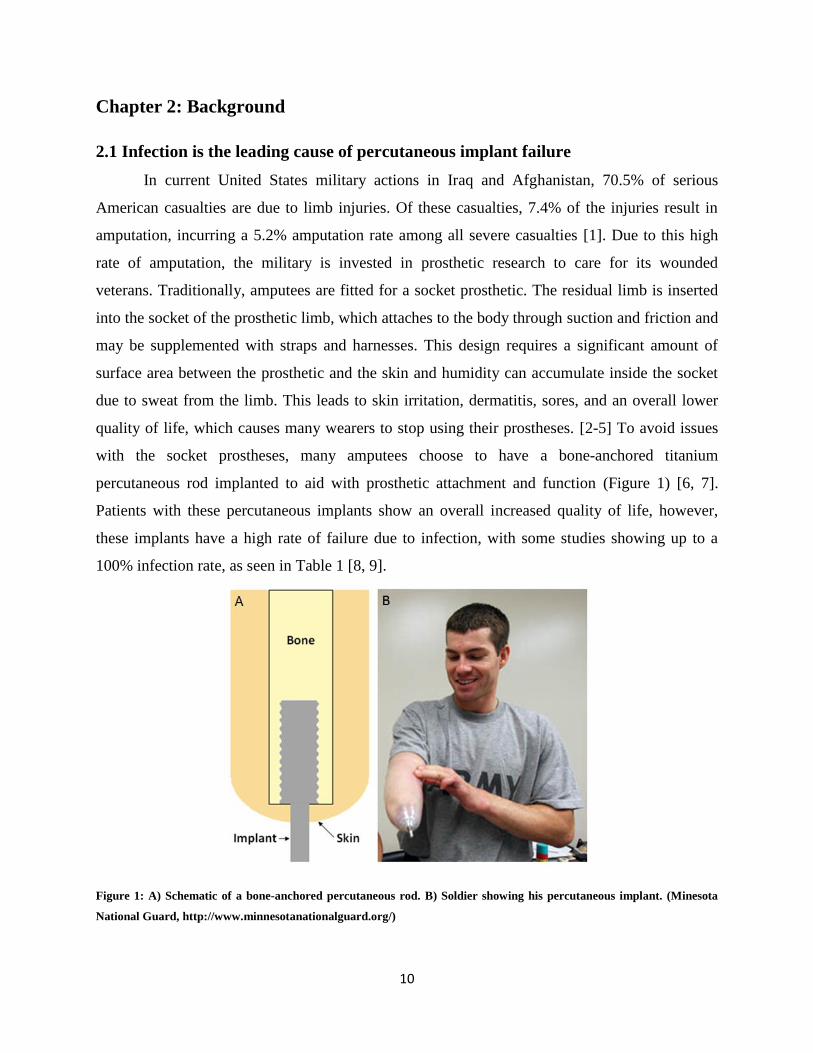
percutaneous rod implanted to aid with prosthetic attachment and function (Figure 1) [6, 7].
Patients with these percutaneous implants show an overall increased quality of life, however,
these implants have a high rate of failure due to infection, with some studies showing up to a
100% infection rate, as seen in Table 1 [8, 9].
Figure 1: A) Schematic of a bone-anchored percutaneous rod. B) Soldier showing his percutaneous implant. (Minesota
National Guard, http://www.minnesotanationalguard.org/)
11
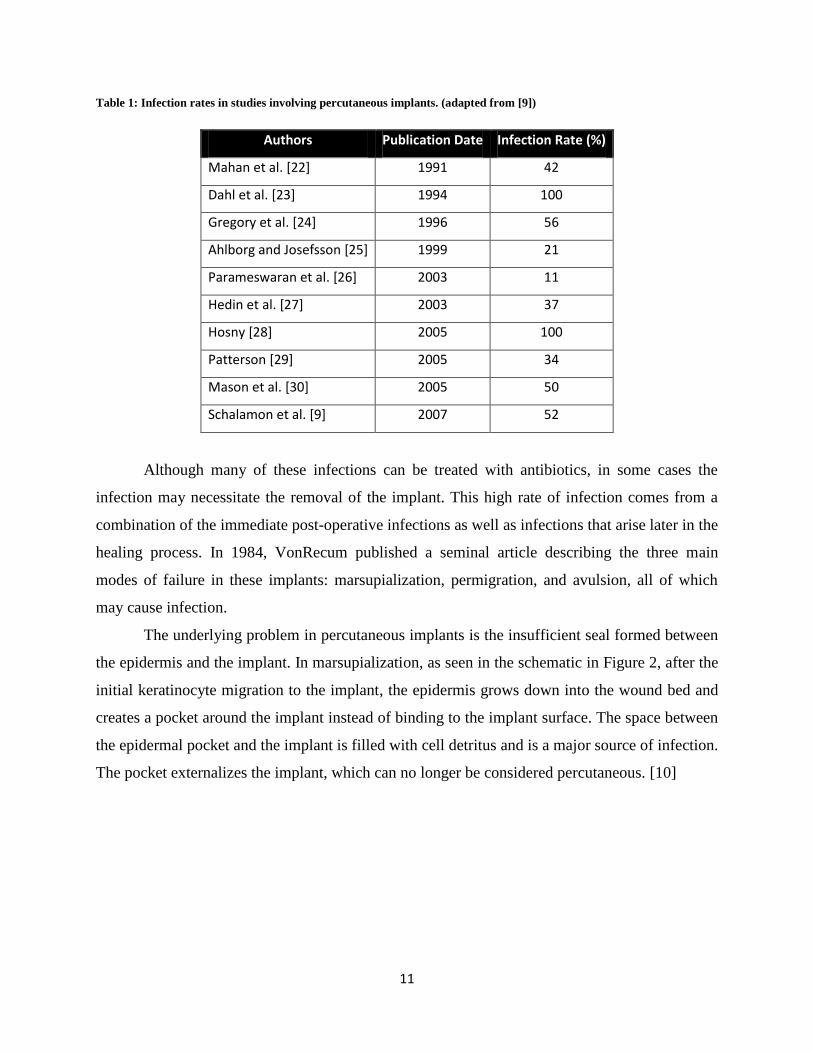
Table 1: Infection rates in studies involving percutaneous implants. (adapted from [9])
Authors Publication Date Infection Rate (%)
Mahan et al. [22] 1991 42
Dahl et al. [23] 1994 100
Gregory et al. [24] 1996 56
Ahlborg and Josefsson [25] 1999 21
Parameswaran et al. [26] 2003 11
Hedin et al. [27] 2003 37
Hosny [28] 2005 100
Patterson [29] 2005 34
Mason et al. [30] 2005 50
Schalamon et al. [9] 2007 52
Although many of these infections can be treated with antibiotics, in some cases the
infection may necessitate the removal of the implant. This high rate of infection comes from a
combination of the immediate post-operative infections as well as infections that arise later in the
healing process. In 1984, VonRecum published a seminal article describing the three main
modes of failure in these implants: marsupialization, permigration, and avulsion, all of which
may cause infection.
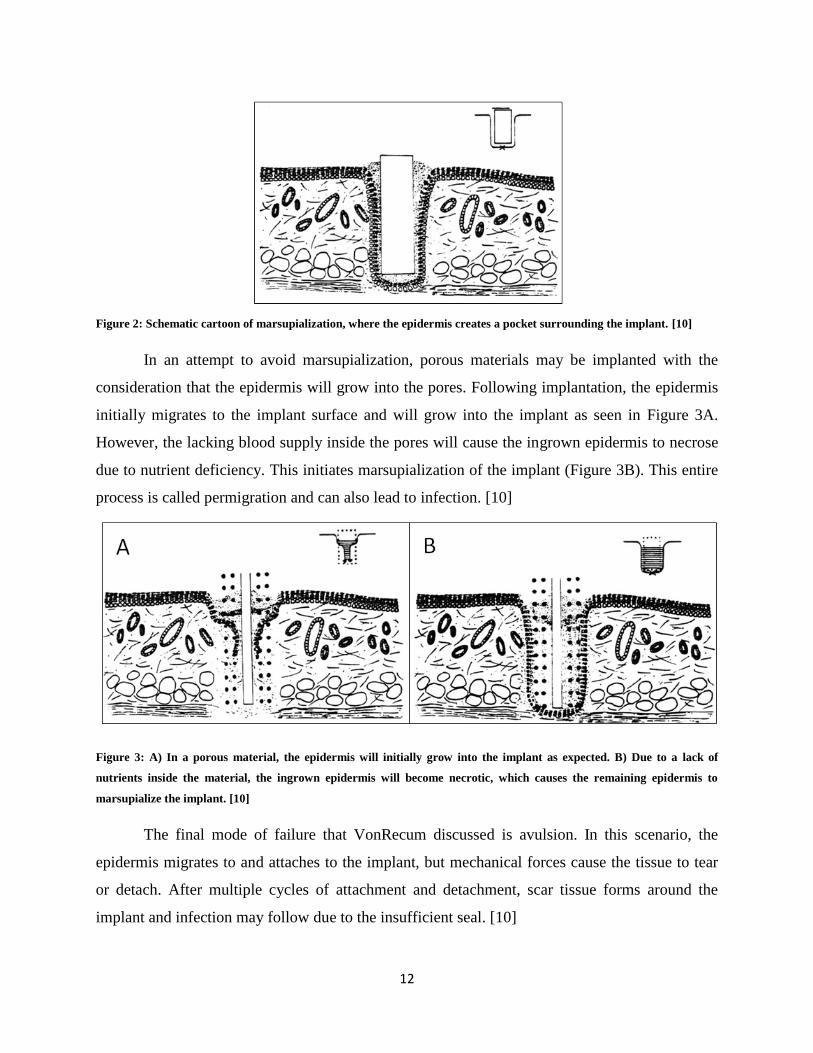
The underlying problem in percutaneous implants is the insufficient seal formed between
the epidermis and the implant. In marsupialization, as seen in the schematic in Figure 2, after the
initial keratinocyte migration to the implant, the epidermis grows down into the wound bed and
creates a pocket around the implant instead of binding to the implant surface. The space between
the epidermal pocket and the implant is filled with cell detritus and is a major source of infection.
The pocket externalizes the implant, which can no longer be considered percutaneous. [10]
12
Figure 2: Schematic cartoon of marsupialization, where the epidermis creates a pocket surrounding the implant. [10]
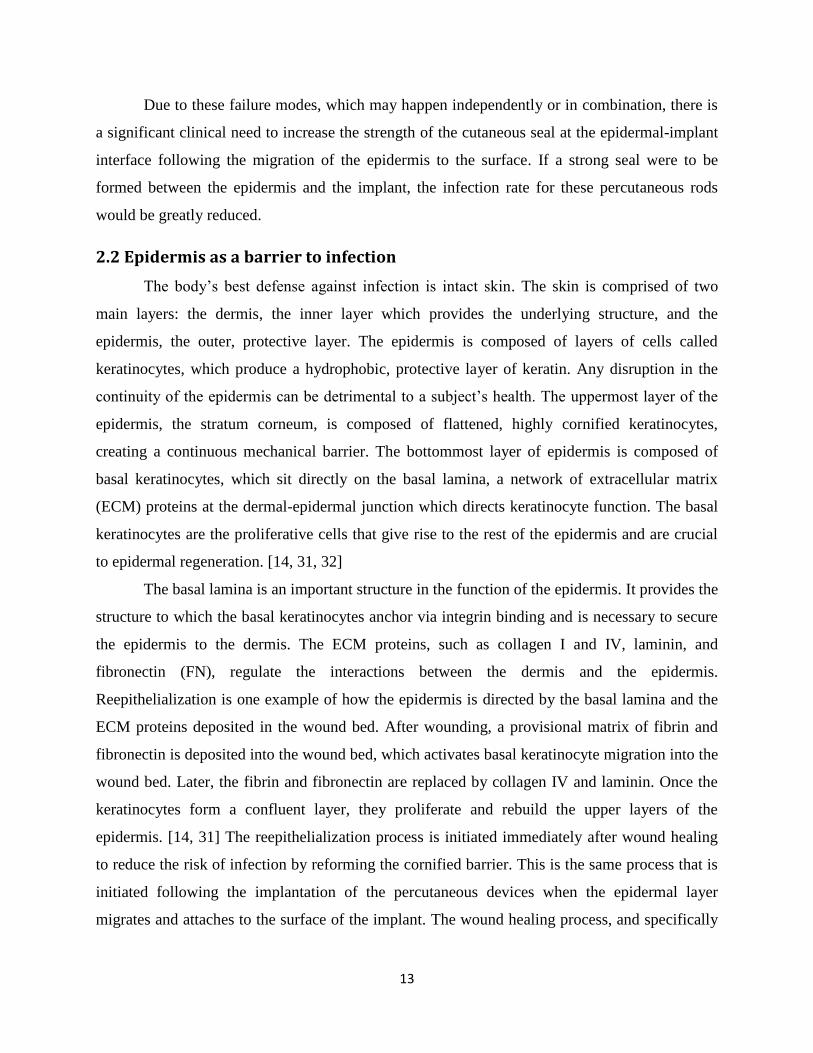
In an attempt to avoid marsupialization, porous materials may be implanted with the
consideration that the epidermis will grow into the pores. Following implantation, the epidermis
initially migrates to the implant surface and will grow into the implant as seen in Figure 3A.
However, the lacking blood supply inside the pores will cause the ingrown epidermis to necrose
due to nutrient deficiency. This initiates marsupialization of the implant (Figure 3B). This entire
process is called permigration and can also lead to infection. [10]
Figure 3: A) In a porous material, the epidermis will initially grow into the implant as expected. B) Due to a lack of
nutrients inside the material, the ingrown epidermis will become necrotic, which causes the remaining epidermis to
marsupialize the implant. [10]
The final mode of failure that VonRecum discussed is avulsion. In this scenario, the
epidermis migrates to and attaches to the implant, but mechanical forces cause the tissue to tear
or detach. After multiple cycles of attachment and detachment, scar tissue forms around the
implant and infection may follow due to the insufficient seal. [10]
13
Due to these failure modes, which may happen independently or in combination, there is
a significant clinical need to increase the strength of the cutaneous seal at the epidermal-implant
interface following the migration of the epidermis to the surface. If a strong seal were to be
formed between the epidermis and the implant, the infection rate for these percutaneous rods
would be greatly reduced.
2.2 Epidermis as a barrier to infection
The body’s best defense against infection is intact skin. The skin is comprised of two
main layers: the dermis, the inner layer which provides the underlying structure, and the
epidermis, the outer, protective layer. The epidermis is composed of layers of cells called
keratinocytes, which produce a hydrophobic, protective layer of keratin. Any disruption in the
continuity of the epidermis can be detrimental to a subject’s health. The uppermost layer of the
epidermis, the stratum corneum, is composed of flattened, highly cornified keratinocytes,
creating a continuous mechanical barrier. The bottommost layer of epidermis is composed of
basal keratinocytes, which sit directly on the basal lamina, a network of extracellular matrix
(ECM) proteins at the dermal-epidermal junction which directs keratinocyte function. The basal
keratinocytes are the proliferative cells that give rise to the rest of the epidermis and are crucial
to epidermal regeneration. [14, 31, 32]
The basal lamina is an important structure in the function of the epidermis. It provides the
structure to which the basal keratinocytes anchor via integrin binding and is necessary to secure
the epidermis to the dermis. The ECM proteins, such as collagen I and IV, laminin, and
fibronectin (FN), regulate the interactions between the dermis and the epidermis.
Reepithelialization is one example of how the epidermis is directed by the basal lamina and the
ECM proteins deposited in the wound bed. After wounding, a provisional matrix of fibrin and
fibronectin is deposited into the wound bed, which activates basal keratinocyte migration into the
wound bed. Later, the fibrin and fibronectin are replaced by collagen IV and laminin. Once the
keratinocytes form a confluent layer, they proliferate and rebuild the upper layers of the
epidermis. [14, 31] The reepithelialization process is initiated immediately after wound healing
to reduce the risk of infection by reforming the cornified barrier. This is the same process that is
initiated following the implantation of the percutaneous devices when the epidermal layer
migrates and attaches to the surface of the implant. The wound healing process, and specifically
14
the ECM protein directed cell adhesion, can be manipulated to enhance the strength of the
cutaneous seal by mimicking the in vivo environment.
2.3 Keratinocytes and extracellular matrix cues
The attachment and anchoring of basal keratinocytes to the dermis is directed by the
ECM proteins that compose the basal lamina. Research has been conducted to determine which
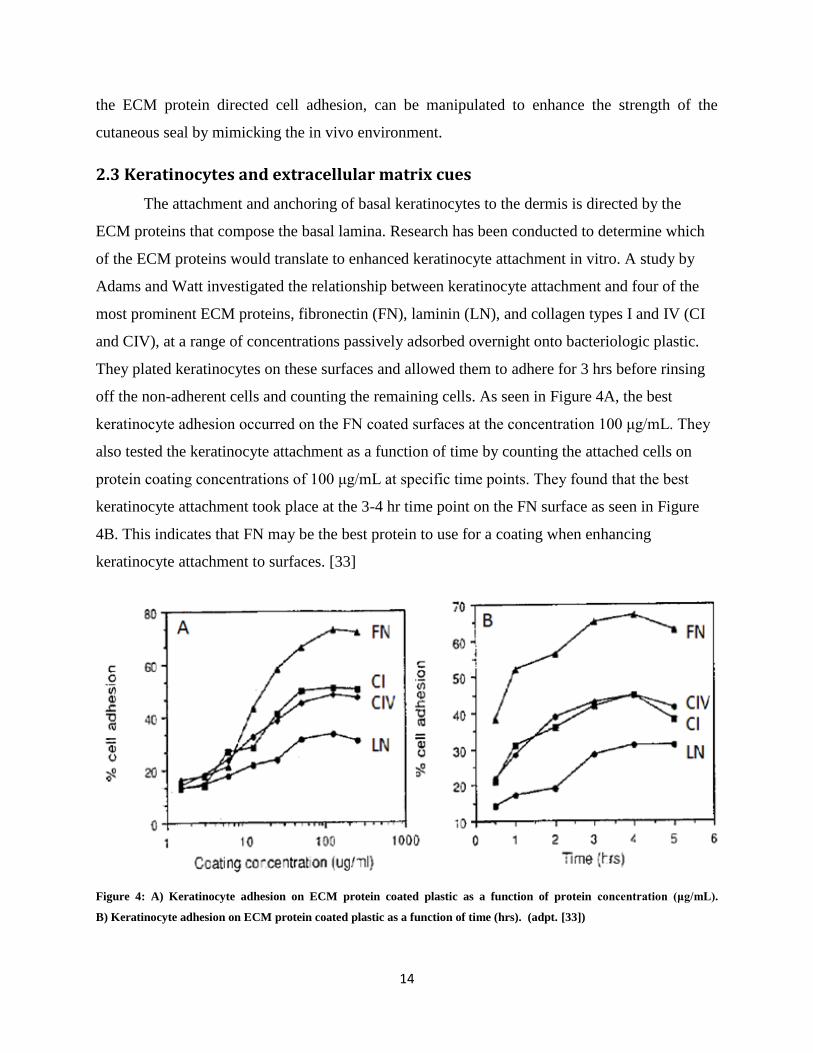
of the ECM proteins would translate to enhanced keratinocyte attachment in vitro. A study by
Adams and Watt investigated the relationship between keratinocyte attachment and four of the
most prominent ECM proteins, fibronectin (FN), laminin (LN), and collagen types I and IV (CI
and CIV), at a range of concentrations passively adsorbed overnight onto bacteriologic plastic.
They plated keratinocytes on these surfaces and allowed them to adhere for 3 hrs before rinsing
off the non-adherent cells and counting the remaining cells. As seen in Figure 4A, the best
keratinocyte adhesion occurred on the FN coated surfaces at the concentration 100 μg/mL. They
also tested the keratinocyte attachment as a function of time by counting the attached cells on
protein coating concentrations of 100 μg/mL at specific time points. They found that the best
keratinocyte attachment took place at the 3-4 hr time point on the FN surface as seen in Figure
4B. This indicates that FN may be the best protein to use for a coating when enhancing
keratinocyte attachment to surfaces. [33]
Figure 4: A) Keratinocyte adhesion on ECM protein coated plastic as a function of protein concentration (μg/mL).
B) Keratinocyte adhesion on ECM protein coated plastic as a function of time (hrs). (adpt. [33])
15
Although Adams and Watt showed that keratinocytes prefer fibronectin to other ECM
proteins on bacteriological plastic, it is imperative to understand whether this relationship
translates to other surfaces. To this end, Bush et al. investigated the respective relationships of
CI, CIV, LN, and FN on keratinocyte attachment to collagen-GAG sponges at various
concentrations. The results of this study can be seen in Figure 5.
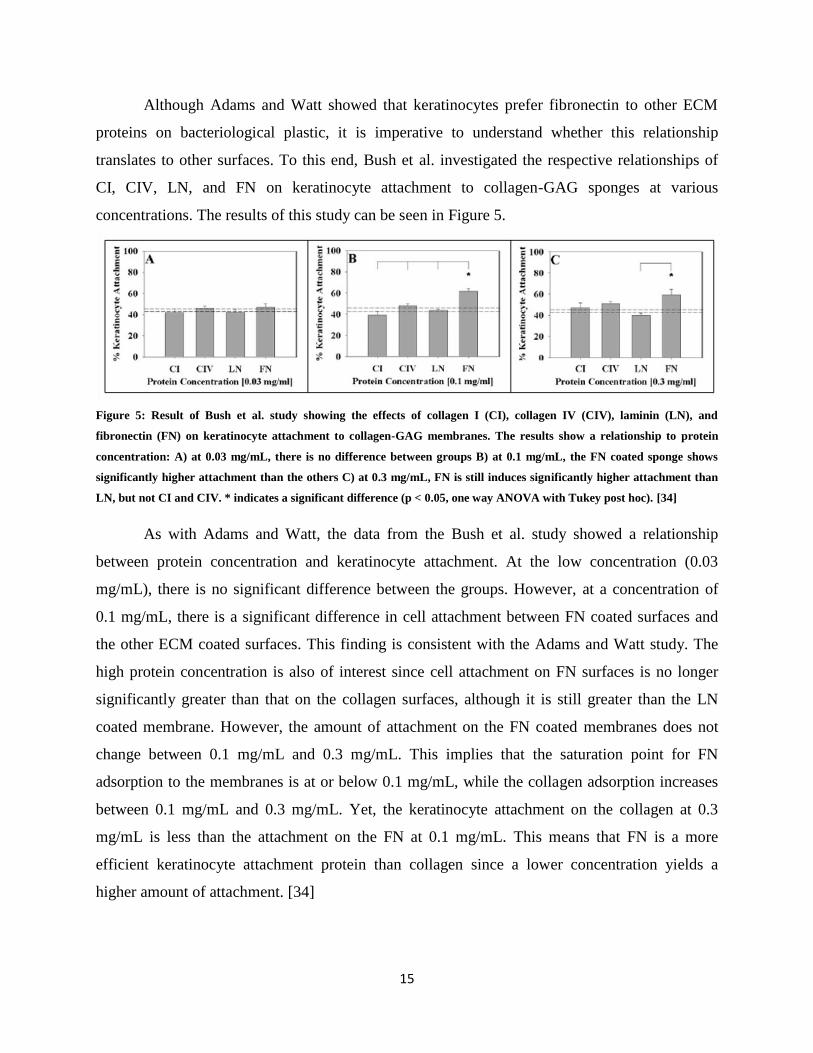
Figure 5: Result of Bush et al. study showing the effects of collagen I (CI), collagen IV (CIV), laminin (LN), and
fibronectin (FN) on keratinocyte attachment to collagen-GAG membranes. The results show a relationship to protein
concentration: A) at 0.03 mg/mL, there is no difference between groups B) at 0.1 mg/mL, the FN coated sponge shows
significantly higher attachment than the others C) at 0.3 mg/mL, FN is still induces significantly higher attachment than
LN, but not CI and CIV. * indicates a significant difference (p < 0.05, one way ANOVA with Tukey post hoc). [34]
As with Adams and Watt, the data from the Bush et al. study showed a relationship
between protein concentration and keratinocyte attachment. At the low concentration (0.03
mg/mL), there is no significant difference between the groups. However, at a concentration of
0.1 mg/mL, there is a significant difference in cell attachment between FN coated surfaces and
the other ECM coated surfaces. This finding is consistent with the Adams and Watt study. The
high protein concentration is also of interest since cell attachment on FN surfaces is no longer
significantly greater than that on the collagen surfaces, although it is still greater than the LN
coated membrane. However, the amount of attachment on the FN coated membranes does not
change between 0.1 mg/mL and 0.3 mg/mL. This implies that the saturation point for FN
adsorption to the membranes is at or below 0.1 mg/mL, while the collagen adsorption increases
between 0.1 mg/mL and 0.3 mg/mL. Yet, the keratinocyte attachment on the collagen at 0.3
mg/mL is less than the attachment on the FN at 0.1 mg/mL. This means that FN is a more
efficient keratinocyte attachment protein than collagen since a lower concentration yields a
higher amount of attachment. [34]
16
2.4 Fibronectin Structure and α5β1 integrin receptors
Due to the preference for keratinocyte attachment to FN, the keratinocyte-fibronectin
relationship has been explored extensively. Cells bind to proteins through integrins, a structure in
the cell composed of associated transmembrane proteins designated as the α and β subunits.
Keratinocyte binding to FN is dominated by the α5β1 integrin [16].
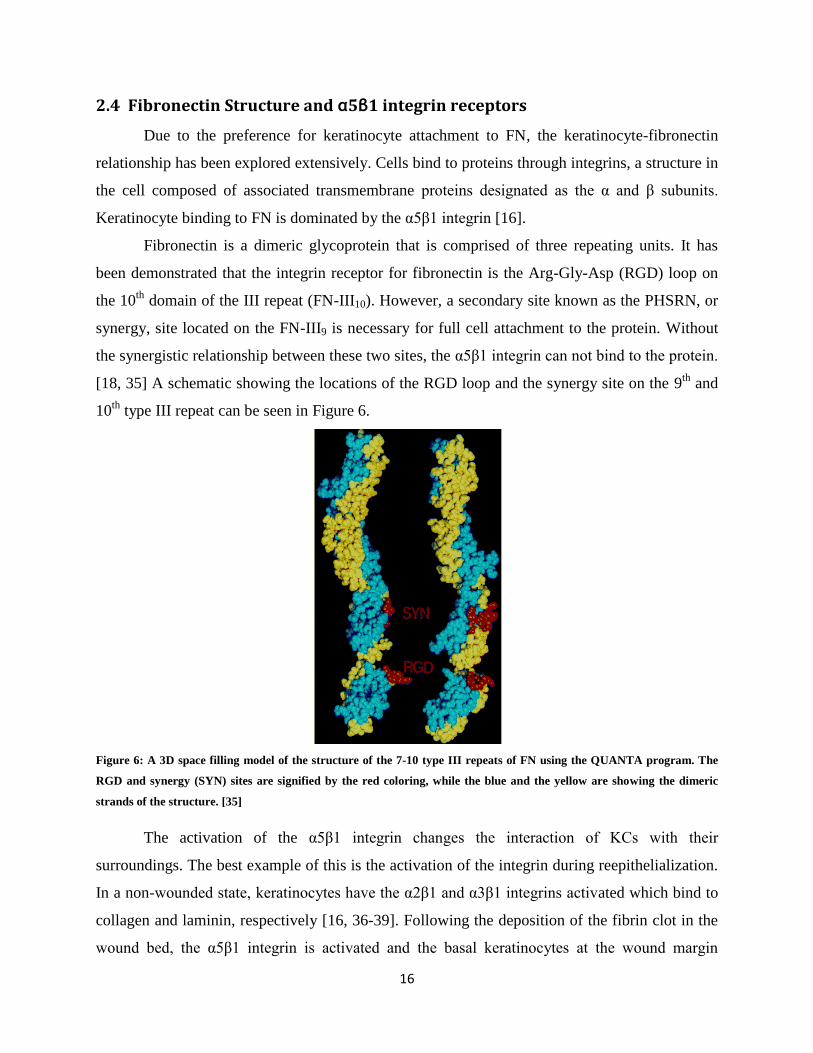
Fibronectin is a dimeric glycoprotein that is comprised of three repeating units. It has
been demonstrated that the integrin receptor for fibronectin is the Arg-Gly-Asp (RGD) loop on
the 10th
domain of the III repeat (FN-III10). However, a secondary site known as the PHSRN, or
synergy, site located on the FN-III9 is necessary for full cell attachment to the protein. Without
the synergistic relationship between these two sites, the α5β1 integrin can not bind to the protein.
[18, 35] A schematic showing the locations of the RGD loop and the synergy site on the 9th
and
10th
type III repeat can be seen in Figure 6.
Figure 6: A 3D space filling model of the structure of the 7-10 type III repeats of FN using the QUANTA program. The
RGD and synergy (SYN) sites are signified by the red coloring, while the blue and the yellow are showing the dimeric
strands of the structure. [35]
The activation of the α5β1 integrin changes the interaction of KCs with their
surroundings. The best example of this is the activation of the integrin during reepithelialization.
In a non-wounded state, keratinocytes have the α2β1 and α3β1 integrins activated which bind to
collagen and laminin, respectively [16, 36-39]. Following the deposition of the fibrin clot in the
wound bed, the α5β1 integrin is activated and the basal keratinocytes at the wound margin
17
migrate into the wound bed [15, 40-42]. The change in integrin expression is significant because
there is a layer of FN under the epithelial tongue, while collagen and laminin are not present until
the monolayer is formed across the wound bed and the cells proliferate and differentiate to form
the upper layers of the epidermis [15, 43, 44]. Keratinocyte function is clearly influenced
through the ECM proteins in their environment and the integrin activation associated with those
proteins.
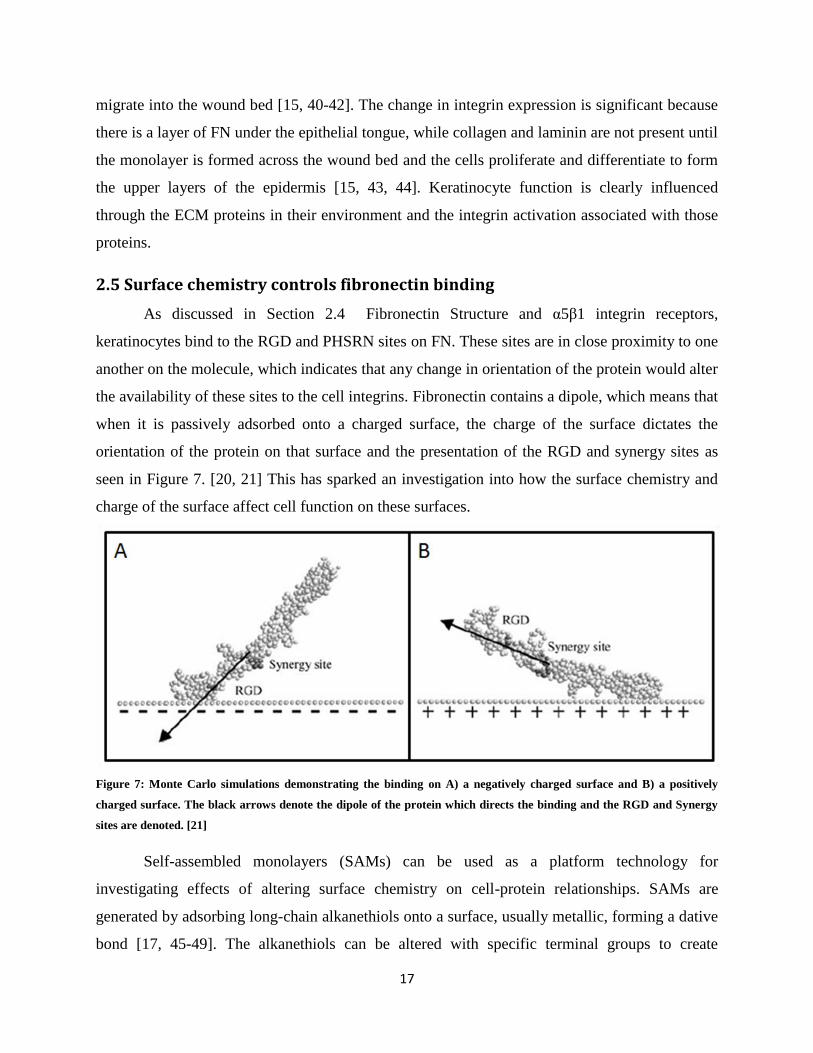
2.5 Surface chemistry controls fibronectin binding
As discussed in Section 2.4 Fibronectin Structure and α5β1 integrin receptors,
keratinocytes bind to the RGD and PHSRN sites on FN. These sites are in close proximity to one
another on the molecule, which indicates that any change in orientation of the protein would alter
the availability of these sites to the cell integrins. Fibronectin contains a dipole, which means that
when it is passively adsorbed onto a charged surface, the charge of the surface dictates the
orientation of the protein on that surface and the presentation of the RGD and synergy sites as
seen in Figure 7. [20, 21] This has sparked an investigation into how the surface chemistry and
charge of the surface affect cell function on these surfaces.
Figure 7: Monte Carlo simulations demonstrating the binding on A) a negatively charged surface and B) a positively
charged surface. The black arrows denote the dipole of the protein which directs the binding and the RGD and Synergy
sites are denoted. [21]
Self-assembled monolayers (SAMs) can be used as a platform technology for
investigating effects of altering surface chemistry on cell-protein relationships. SAMs are
generated by adsorbing long-chain alkanethiols onto a surface, usually metallic, forming a dative
bond [17, 45-49]. The alkanethiols can be altered with specific terminal groups to create
18
precisely designed surface properties [17, 45-49]. The resulting surface is a homogeneous layer
of alkanethiol with the terminal group presented, producing a surface with the same properties as
the terminal group [17, 45-49]. For example, a methyl terminated alkanethiol will result in a
hydrophobic surface, while a carboxyl terminated alkanethiol will give rise to a surface with a
negative charge. A summary of the commonly used alkanethiol SAMs can be seen in Table 2.
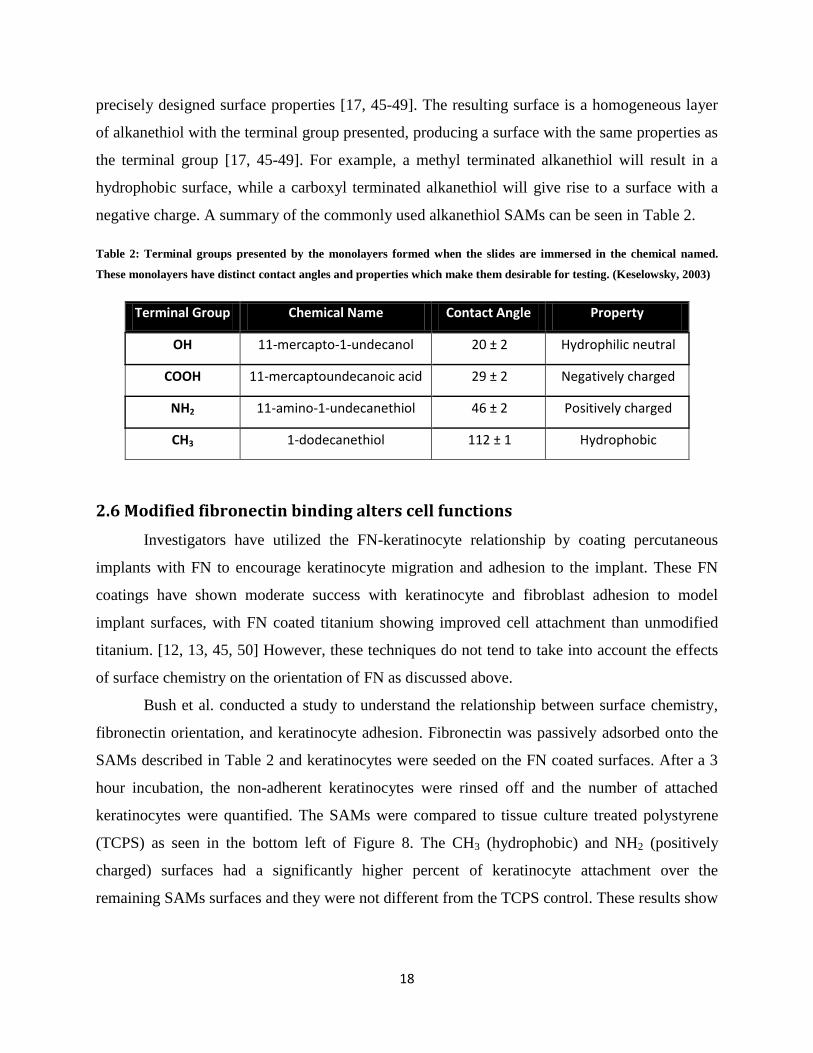
Table 2: Terminal groups presented by the monolayers formed when the slides are immersed in the chemical named.
These monolayers have distinct contact angles and properties which make them desirable for testing. (Keselowsky, 2003)
Terminal Group Chemical Name Contact Angle Property
OH 11-mercapto-1-undecanol 20 ± 2 Hydrophilic neutral
COOH 11-mercaptoundecanoic acid 29 ± 2 Negatively charged
NH2 11-amino-1-undecanethiol 46 ± 2 Positively charged
CH3 1-dodecanethiol 112 ± 1 Hydrophobic
2.6 Modified fibronectin binding alters cell functions
Investigators have utilized the FN-keratinocyte relationship by coating percutaneous
implants with FN to encourage keratinocyte migration and adhesion to the implant. These FN
coatings have shown moderate success with keratinocyte and fibroblast adhesion to model
implant surfaces, with FN coated titanium showing improved cell attachment than unmodified
titanium. [12, 13, 45, 50] However, these techniques do not tend to take into account the effects
of surface chemistry on the orientation of FN as discussed above.
Bush et al. conducted a study to understand the relationship between surface chemistry,
fibronectin orientation, and keratinocyte adhesion. Fibronectin was passively adsorbed onto the
SAMs described in Table 2 and keratinocytes were seeded on the FN coated surfaces. After a 3
hour incubation, the non-adherent keratinocytes were rinsed off and the number of attached
keratinocytes were quantified. The SAMs were compared to tissue culture treated polystyrene
(TCPS) as seen in the bottom left of Figure 8. The CH3 (hydrophobic) and NH2 (positively
charged) surfaces had a significantly higher percent of keratinocyte attachment over the
remaining SAMs surfaces and they were not different from the TCPS control. These results show
19
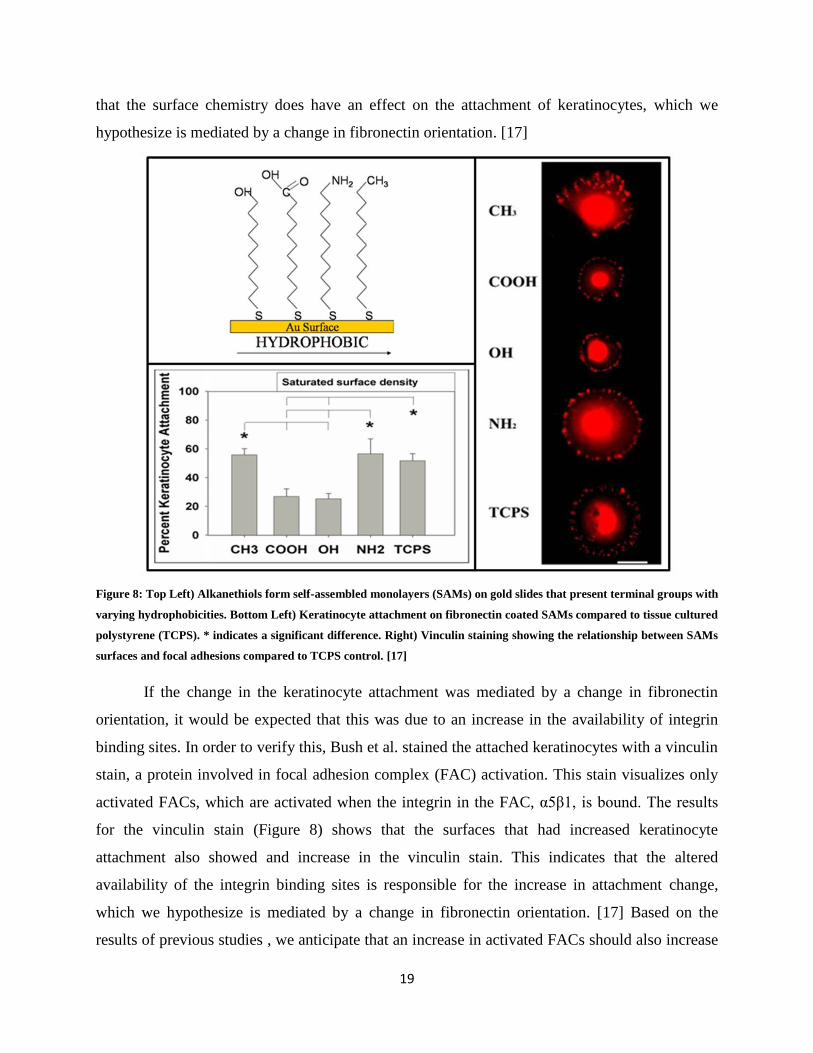
that the surface chemistry does have an effect on the attachment of keratinocytes, which we
hypothesize is mediated by a change in fibronectin orientation. [17]
Figure 8: Top Left) Alkanethiols form self-assembled monolayers (SAMs) on gold slides that present terminal groups with
varying hydrophobicities. Bottom Left) Keratinocyte attachment on fibronectin coated SAMs compared to tissue cultured
polystyrene (TCPS). * indicates a significant difference. Right) Vinculin staining showing the relationship between SAMs
surfaces and focal adhesions compared to TCPS control. [17]
If the change in the keratinocyte attachment was mediated by a change in fibronectin
orientation, it would be expected that this was due to an increase in the availability of integrin
binding sites. In order to verify this, Bush et al. stained the attached keratinocytes with a vinculin
stain, a protein involved in focal adhesion complex (FAC) activation. This stain visualizes only
activated FACs, which are activated when the integrin in the FAC, α5β1, is bound. The results
for the vinculin stain (Figure 8) shows that the surfaces that had increased keratinocyte
attachment also showed and increase in the vinculin stain. This indicates that the altered
availability of the integrin binding sites is responsible for the increase in attachment change,
which we hypothesize is mediated by a change in fibronectin orientation. [17] Based on the
results of previous studies , we anticipate that an increase in activated FACs should also increase
20
the amount of adhesion on these surfaces since more cell-surface bonds would have to be broken
for the cells to detach from the surface [45, 51, 52].
Keratinocyte adhesion has never been tested on FN adsorbed surfaces with diverse
surface chemistries. However, a group focusing on bone ingrowth to titanium surfaces has
conducted a study examining osteoblast adhesion to FN coated SAMs. In this study, MC3T3-E1
cells were seeded onto SAMs coated with FN. They were allowed to adhere for 30 minutes and
then were spun in a centrifuge to exert a normal detachment force on the cells. The percentage of
adherent cells were calculated for each surface and vinculin staining was conducted to assess
whether the changes in adhesion were related to the amount of activated FACs. They found that
the surface with the highest adhesion was the hydrophilic surface and the lowest amount of
adhesion on the hydrophobic surface. The charge of the surface, positive or negative, did not
affect the amount of adhesion. [46] This study demonstrates the importance of surface chemistry
on cell adhesion.
Through this literature review, we have identified that keratinocytes preferentially attach
to FN over other ECM proteins. However, the orientation of FN on the surface is directed by
surface chemistry which we hypothesize is responsible for altering the availability of the cell
binding domains. It has been shown that keratinocyte attachment and FAC activation is directed
by the surface chemistry of the FN adsorbed surface [17]. Our goal is to improve the strength of
the cutaneous seal, which we anticipate will translate to increasing keratinocyte adhesion to the
titanium surface. Model surfaces have been used to test surface-dependent osteoblast adhesion,
but have never been used to test keratinocyte adhesion. By investigating the optimal surface
chemistry for keratinocyte adhesion, we will eventually translate the technology to titanium to
give the epidermis the optimal conditions for maintaining the seal at the skin-implant interface.
21
Chapter 3: Hypothesis and Specific Aims
We hypothesize that surface mediated changes in FN binding orientation and cell binding
domain presentation can precisely modulate keratinocyte spreading and adhesion. To test this
hypothesis, we proposed the following objectives:
Control FN binding orientation
Enhance cell binding domain availability
Increase keratinocyte spreading
Improve keratinocyte adhesion
To further investigate our experimental approach, we proposed the following hypotheses:
Surface mediated changes in cell binding domain availability are caused by altering FN
binding orientation.
Increased keratinocyte spreading and adhesion are caused by increased focal adhesion
activation.
The overarching goal of this study was to identify a surface characteristic, or combination of
characteristics, that could be applied to an implant surface to increase adhesion at the skin-
implant seal. To accomplish this goal, we used model surfaces with discrete surface chemistries:
positive charge, negative charge, hydrophobic, and hydrophilic. All of the surfaces were
compared to determine if a surface with a particular charge or wettability would enhance the
cutaneous seal. These objectives and proposed hypotheses for our experimental approach were
explored with two specific aims.
3.1 Specific Aim 1
We aimed to control fibronectin adsorption using self-assembled monolayers and to
evaluate the ability of these surfaces to present the fibronectin cell binding domains.
This specific aim was completed by conducting three studies. The first experiment used
contact angle measurements to characterize the wettability of the surfaces. The second
experiment used HFN7.1, an antibody directed against the FN cell binding domains, to quantify
the cell binding domains per area on the surfaces. The third experiment used atomic force
microscopy (AFM) to allow us to image the FN on the surface and determine changes in
topography by visual observation and rms roughness measurements.
Each experiment utilized self-assembled monolayers of alkanethiols on gold slides as
model surfaces with discrete properties. We wanted to determine whether surface charge or
22
surface wettability, or a combination of the two, would alter the cell spreading and adhesion on
the surface. The experimental parameters compared a positively charged surface (NH2), a
negatively charged surface (COOH), a hydrophobic surface (CH3), and a hydrophilic surface
(OH). The positive control was a bare gold surface (AU), which has been used in dental implants
because it facilitates better soft tissue integration than titanium [53]. The negative control was a
polyethylene glycol (PEG) suface, which is well known not to adsorb proteins like FN [54-56].
The following sections will explain the rationale behind the experiments and methods
used to investigate this aim.
3.1.1 Characterize surfaces with contact angle measurements
Contact angle measurements are often made on SAM surfaces to characterize the
wettability of the monolayers [17, 45, 48, 57, 58]. Although this only characterized the
wettability and not the charge of the monolayers, we decided to measure the contact angles on
our surfaces for two purposes. The first purpose was to ensure that our surfaces were being
created consistently throughout our study by examining the trends in the contact angles. The
method is subject to high variability if not done with extreme precision. Even a slight variation in
the size of the water droplets, the exact angle of the camera measuring the droplet, and the pH of
the water can cause large shifts in the contact angle. As such, the general trends in the contact
angle measurements are far more important than the precise angle measured.[59, 60] The second
purpose was to compare our measurements with the reported values in the literature to ensure
consistency with the literature. We chose two studies to compare our values to: the 2009 Bush et
al. study (previous study performed by our lab) and the 2003 Keselowsky et al. study [17, 45].
These two studies were chosen because the experiments for which the SAMs were used were
similar to the experiments we were conducting.
3.1.2 Quantify cell binding domains using HFN7.1
We chose to quantify the cell binding domains on the FN adsorbed surfaces to observe
the availability of these domains to cells that would be binding on the surface. We hypothesized
that the amount of cell binding domains available would alter the keratinocyte spreading and
adhesion. We chose to quantify the cell binding domains by using HFN7.1, an antibody directed
against the synergy binding sites between the cell binding domain on FN [17, 61]. This was also
the method used by Bush et al., which allowed us to compare our findings to their results.
23
3.1.3 Investigate surface modulated changes in FN adsorption on surfaces using AFM
We proposed that the mechanism directing the altered binding site availability is due to
modified FN binding orientation on the surfaces based on surface chemistry. We needed a
method that would allow us to assess these changes both qualitatively and quantitatively, by
observing and analyzing the topography of the bound FN. Atomic force microscopy (AFM) is a
technique that has been used to study protein adsorption to surfaces [62-65]. AFM imaging is
performed by a cantilever with a tip that scans a surface. The deflections of the cantilever are
recorded and a series of cantilever scans are compiled to form an image showing the topography
of the surface. This allows us to visualize the surface and notice any changes in topography after
adsorbing FN onto the surface. Additionally, AFM allows us to measure the surface roughness of
the samples, which is commonly done using a metric called root mean square (rms) [62, 63].
Surface roughness is a common metric for measuring topography. The rms roughness of the
surfaces will give us a quantitative value for comparing the FN adsorbed surfaces.
3.2 Specific Aim 2
We aimed to increase keratinocyte spreading and adhesion by enhancing FN orientation
and the presentation of FN cell binding domains.
The second specific aim was completed through three studies, using the same model
surfaces as described in Section 3.1 Specific Aim 1. The first experiment measured the area of
the cells seeded on the surface using maleimide, a lipid membrane stain, and ImageJ. The second
experiment used a centrifugation assay to test KC adhesion to the surfaces. The final experiment
used an anti-vinculin antibody to analyze the activated focal adhesion complexes. The following
sections will explain the rationale behind the experiments and methods used to investigate this
aim.
3.2.1 Evaluate keratinocyte spreading on FN-coated surfaces
Cell spreading is a commonly used metric to analyze a cell’s affinity for attachment to
the surface as well as the proliferative potential of the cells on the surface [17, 21, 48, 66]. Cells
that are spread on a surface are more likely to remain on the surface. Measuring cell spreading
will allow us to compare our results with previous testing, most notably the previous study
conducted by our lab [17] Briefly, we adsorbed 25 µg/mL of FN overnight onto our model
surfaces, blocked with 1% hdBSA to prevent non-specific cell binding, and seeded KCs. The
24
KCs were allowed to attach for 3 hours, then were fixed and stained with maleimide, a lipid
membrane stain. Fluorescent microscopy was used to image 20 to 50 cells per surface and
ImageJ was used to measure cell area.
The amount of cell spreading on a surface is particularly important for keratinocytes.
Studies have demonstrated that KCs with greater surface area are less likely to express markers
for terminal differentiation and are more likely to proliferate. The KCs that have more cell-cell
contacts and that are on the surface for a longer amount of time are far more likely to
differentiate. [66, 67] Ideally the KCs attached to the implant surface proliferate until they have
formed a confluent monolayer, then the cell-cell contacts initiate KC differentiation to form the
upper, cornified layers of the epidermis. Our testing will be performed shortly after cell seeding,
so we would want the KCs on the surface to be in the proliferative state to form the confluent
basal layer. Cell spreading is a straight forward way to assess which surfaces have greater
proliferative potential.
3.2.2 Compute keratinocyte adhesion on surfaces using centrifugation technique
A cell adhesion assay involves applying a detachment force to live cells and calculating
the percentage of adherent cells by comparing the number of cells on the surface after applying
the force to the number of cells on the surface prior to applying the force. We adsorbed 25
µg/mL of FN overnight onto our model surfaces, blocked with 1% hdBSA, and seeded KCs
preloaded with calcein AM. The KCs were allowed to attach for 3 hours, then the surfaces were
rinsed, and the slides were read by a fluorescent plate reader at 485/535 nm. The slides were
subjected to either a low or high normal force by either inverting the slide (1x g) or centrifuging
it at 50x g, respectively. The slides were rinsed, then read by the plate reader again. The
fluorescence emission before and after the application of the force was compared to generate a
percentage of cell adhesion.
Our objective of this research is to strengthen the cutaneous seal around the percutaneous
titanium implants. This cannot be accomplished without increasing the strength of the adhesion
between the KCs composing the epidermis and the FN coating on the titanium. Cell adhesion
assays are well defined experiments used to test the strength of an individual cell attachment to
the surface by applying either a normal or shear force [45, 52, 68-71]. A study by Mori et al.
demonstrated how a soft tissue anchored to a post reacts under tension. They found that the
radial stress, which corresponds to normal forces, were the highest at the post and decreased with
25
distance from the post, while the circumferential stresses, which correspond to shear forces, were
the lowest at the post and increased with distance from the post. [72] The results of this study led
us to focus on testing cell adhesion when subjected to a normal force.
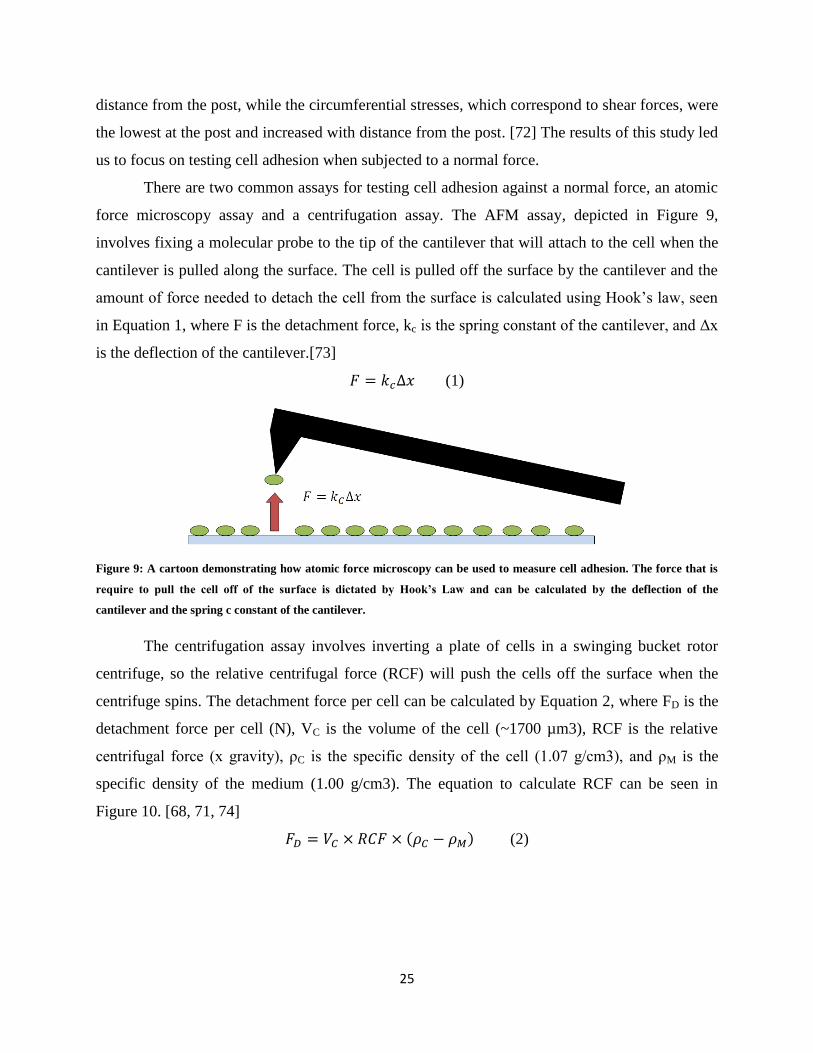
There are two common assays for testing cell adhesion against a normal force, an atomic
force microscopy assay and a centrifugation assay. The AFM assay, depicted in Figure 9,
involves fixing a molecular probe to the tip of the cantilever that will attach to the cell when the
cantilever is pulled along the surface. The cell is pulled off the surface by the cantilever and the
amount of force needed to detach the cell from the surface is calculated using Hook’s law, seen
in Equation 1, where F is the detachment force, kc is the spring constant of the cantilever, and Δx
is the deflection of the cantilever.[73]
(1)
Figure 9: A cartoon demonstrating how atomic force microscopy can be used to measure cell adhesion. The force that is
require to pull the cell off of the surface is dictated by Hook’s Law and can be calculated by the deflection of the
cantilever and the spring c constant of the cantilever.
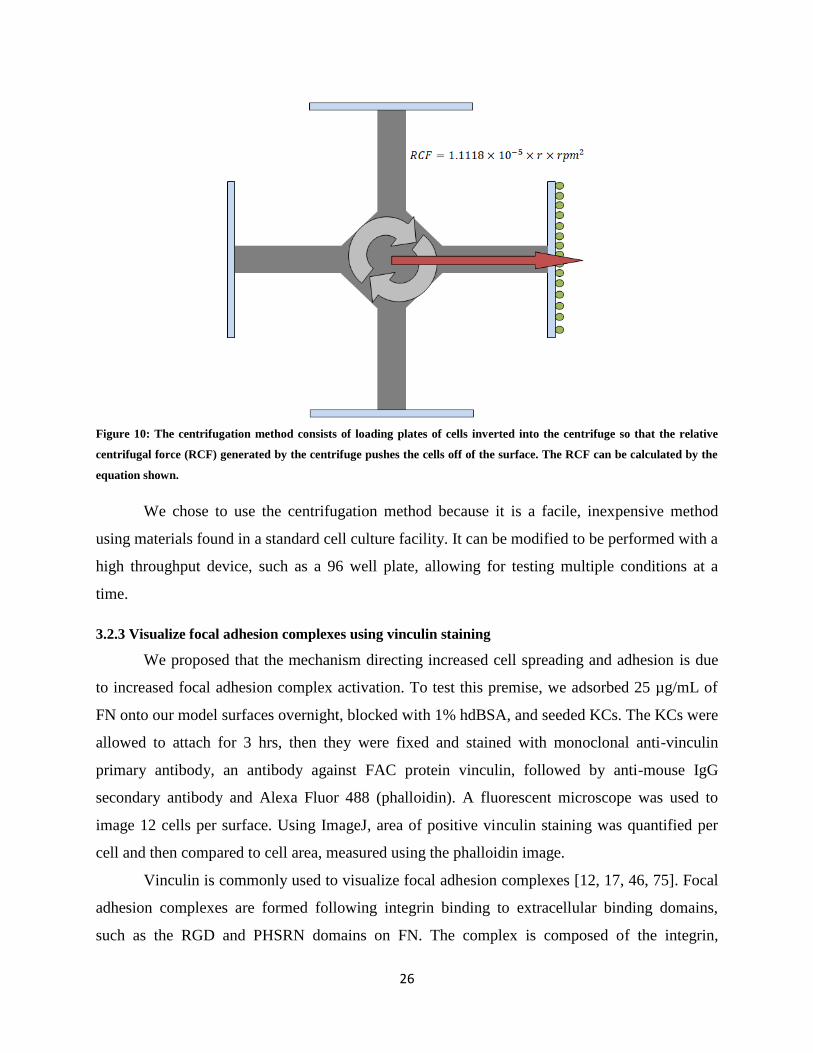
The centrifugation assay involves inverting a plate of cells in a swinging bucket rotor
centrifuge, so the relative centrifugal force (RCF) will push the cells off the surface when the
centrifuge spins. The detachment force per cell can be calculated by Equation 2, where FD is the
detachment force per cell (N), VC is the volume of the cell (~1700 µm3), RCF is the relative
centrifugal force (x gravity), ρC is the specific density of the cell (1.07 g/cm3), and ρM is the
specific density of the medium (1.00 g/cm3). The equation to calculate RCF can be seen in
Figure 10. [68, 71, 74]
(2)
26
Figure 10: The centrifugation method consists of loading plates of cells inverted into the centrifuge so that the relative
centrifugal force (RCF) generated by the centrifuge pushes the cells off of the surface. The RCF can be calculated by the
equation shown.
We chose to use the centrifugation method because it is a facile, inexpensive method
using materials found in a standard cell culture facility. It can be modified to be performed with a
high throughput device, such as a 96 well plate, allowing for testing multiple conditions at a
time.
3.2.3 Visualize focal adhesion complexes using vinculin staining
We proposed that the mechanism directing increased cell spreading and adhesion is due
to increased focal adhesion complex activation. To test this premise, we adsorbed 25 µg/mL of
FN onto our model surfaces overnight, blocked with 1% hdBSA, and seeded KCs. The KCs were
allowed to attach for 3 hrs, then they were fixed and stained with monoclonal anti-vinculin
primary antibody, an antibody against FAC protein vinculin, followed by anti-mouse IgG
secondary antibody and Alexa Fluor 488 (phalloidin). A fluorescent microscope was used to
image 12 cells per surface. Using ImageJ, area of positive vinculin staining was quantified per
cell and then compared to cell area, measured using the phalloidin image.
Vinculin is commonly used to visualize focal adhesion complexes [12, 17, 46, 75]. Focal
adhesion complexes are formed following integrin binding to extracellular binding domains,
such as the RGD and PHSRN domains on FN. The complex is composed of the integrin,
27
signaling molecules, and intracellular proteins, such as vinculin. Vinculin is an integral protein
that connects the FAC with the actin cytoskeleton and is only present in active FACs. [76-78]
We assessed FAC activation by evaluating the positive vinculin area (non-normalized) and the
positive vinculin percentage (normalized) in each cell. The positive stain in the center of the cell
was regarded as nuclear expression of vinculin and was not included in our data analysis. This
was done to remain consistent with the method described in the 2009 Bush et al. study [17]. The
normalized data was obtained by dividing the area of the stain by the area of the cell.
The positive vinculin area per cell will be compared to our cell adhesion data. The
detachment force will be acting against the volume of the cells, which are bound to the surfaces
through the activated integrins. We expect that the cells with higher adhesion would have more
activated integrins per cell, meaning that the detachment force would be divided by a greater
number of integrins. The percentage of positive vinculin will be compared to our cell spreading
data. We expect that the percentage of positive vinculin would increase with cell size, meaning
that larger cells have more activated integrins per area. We hypothesize that a greater percentage
of integrin activation is what allows the cells to spread on the surface.
28
Chapter 4: Materials and Methods
4.1 Keratinocyte culture
For all experiments, neonatal human keratinocytes isolated from foreskin tissue will be
used. The keratinocyte isolations and cultures will be conducted as previously described by Bush
et al. [34]. The following is a brief description of these methods.
Less than 48 hours after harvesting, foreskin tissue will be treated with dispase (Gibco,
Gaithersburg, MD) for 18 hours. The epidermis will be separated from the dermis and physically
and enzymatically agitated in order to isolate the cells from the tissue. These cells are
proliferated on a feeder layer of 3T3-J2 mouse fibroblasts (donated by Dr. Stelios Andreadis,
State University of New York at Buffalo, Buffalo, NY). Keratinocytes are seeded in a medium
composed of 3 parts DMEM (high glucose) to 1 part Ham’s F-12 medium. This medium is
supplemented with 10% fetal bovine serum, 10-10
M cholera toxin, 0.4 mg/mL hydrocortisone,
0.13 U/mL insulin, 1.4 10-4
M adenine, 1% penicillin/streptomycin, 5 mg/mL transferrin, and 2
10-9
M triiodo-L-thyronine. After culturing for 24 hrs, the keratinocytes are fed with keratinocyte
growth medium, the keratinocyte medium described above supplemented with 0.01 mg/mL
epidermal growth factor (EGF). Keratinocytes will be co-cultured for 6 days, then detached from
the tissue culture plastic with 0.05% Trypsin-EDTA. Before seeding onto FN surfaces,
keratinocytes will be rinsed with serum free and EGF free keratinocyte medium. In the following
experiments, passage 2 through 4 keratinocytes will be used.
4.2 Production of self-assembled monolayers
The gold coated titanium slides (Evaporated Metal Films Corp., Ithaca, NY) were
cleaned with piranha solution (7:3 solution of H2SO4 (EMD Chemicals, Inc., Gibbstown, NJ) to
H2O2 (Alfa Aesar, Ward Hill, MA). The slides were immersed in the solution for 5-10 minutes,
then transferred into a diH2O bath to stop oxidizing. They were rinsed with ethanol and dried
under a N2 stream. They were plasma cleaned before the SAMs were deposited.
Each of the SAMs solutions (Table 3) was prepared as a 1mM solution in ethanol (200
proof-absolute anhydrous, ACS/USP grade) and allowed to dissolve completely. The slides were
immersed in the solutions overnight (14 – 18 hrs) at room temperature. After incubation, the
SAM surfaces were rinsed with ethanol and dried under N2 gas. The five SAMs surfaces plus a
cleaned gold slide were used for all experiments.
29
Table 3: Chemicals used to create SAMs slides
Surface Chemical Name Company
CH3 11-Dodecanethiol Atofina Chemicals, Inc., Philadelphia, PA
COOH 11-Mercapto-undecanoic acid Sigma-Aldrich Corp., St. Louis, MO
NH2 11-Amino-1-undecanethiol hydrochloride Dojindo, Japan
OH 11-mercapto-1-undecanol Sigma-Aldrich Corp., St. Louis, MO
PEG Triethylene glycol mono-11-mercaptoundecyl ether Sigma-Aldrich Corp., St. Louis, MO
4.3 Measuring contact angles
Contact angle measurements were made by the sessile drop method using the Rame-Hart
Goniometer (Model 300, Netcong, NJ). Measurements were obtained using 3 μL drops of
deionized water deposited on the substrates using the automated dispensing system accessory
attached to the goniometer. The images of water drops were obtained by an integrated digital
camera coupled to the goniometer, and the system was computerized by Rame-Hart’s
DROPimage standard software package. The software automatically provides contact angle
measurements once the water droplet is dispensed onto the substrate. Three slides were measured
per surface chemistry with five measurements taken per slide and the averages of the
measurements were reported.
4.4 Quantifying cell binding domains with HFN7.1
Wells (6 mm diameter) were created on the slides using the ProPlate™ Multi-Array Slide
System created by Grace Biolabs (Figure 11). A 25 µg/mL fibronectin (BD Biosciences, San
Jose, CA) solution in Dulbecco’s Phosphate Buffered Saline (DPBS, Hyclone) was passively
adsorbed on the surfaces overnight at 4°C. The slides were blocked with 1% (w/v) heat
denatured bovine serum albumin (hdBSA, Sigma) in DPBS for 30 minutes. The wells were
incubated with 100 µL of a cell supernatant containing HFN7.1 (Developmental Studies
Hybridoma Bank, Iowa City, IA) for 1 hour in 10% CO2 at 37°C. The wells were rinsed with
blocking buffer made from 0.05% Tween-20 (Sigma) and 0.25% (w/v) BSA in DPBS. They
were incubated with a 1:200 solution of 546 Alexa Fluor conjugated goat anti-mouse IgG
(Molecular Probes, Eugene, OR) in blocking buffer for 1 h in 10% CO2 at 37°C, then rinsed
with DPBS.
30
Figure 11: Proplate™ Multi-Array Slide System created by Grace Biolabs
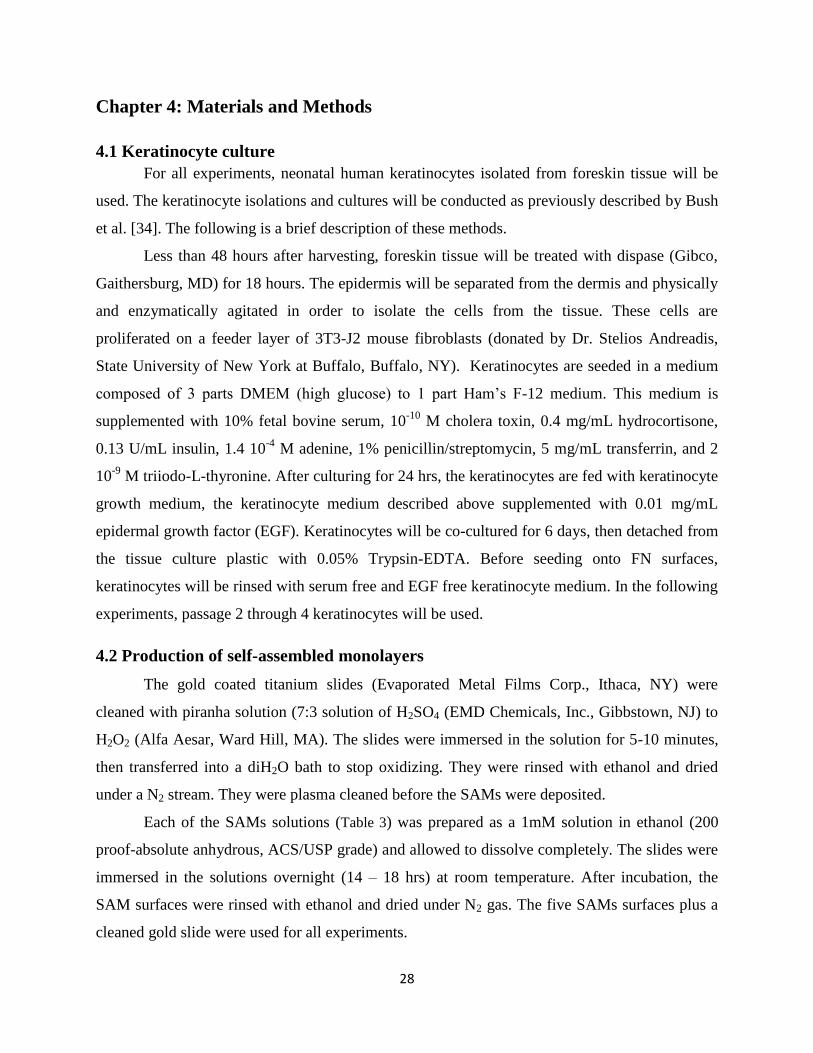
The wells were imaged with a fluorescent microscope at 20x using the Texas Red filter at
the same fluorescence intensity, capturing 9 random images per slide. The images were analyzed
using Image J Analysis software (downloaded from http://rsb.info.nih.gov/ij/) by quantifying the
number of fluorescent pixels in each image. Since the images were all captured with the same
fluorescence intensity, we allowed the software to threshold the images when converting to a
binary image. This number was normalized to the total number of pixels in the image to give
positive HFN7.1 staining per area as seen in Figure 12. This is reported as percent HFN7.1
positive area. Two slides per surface chemistry were measured.
Figure 12: Quantification of HFN7.1 percent positive area.
31
4.5 Assessing FN topography with atomic force microscopy
Rectangular wells (¾” x ½”) were created on the slides using polydimethylsiloxane
(PDMS) gaskets. A 25 µg/mL FN solution in DPBS was passively adsorbed on the surfaces
overnight at 4°C. The FN was removed and the slides were allowed to air dry for 30 minutes.
The samples were measured using the MFP-3D™ atomic force microscope (Asylum Research,
Santa Barbara, CA) and the associated MFP-3D™ software. The surfaces were measured using a
20-25 µm silicon tip with a 40° cone angle and 10 nm radius on a silicone cantilever with a 1.75
N/m spring constant (NSC36 series, MikroMasch, San Jose, CA) in tapping mode. The regions
measured were 5µm x 5µm with 512 scan lines per image at a rate of 0.5 Hz. Each surface
chemistry had 3 regions measured in the FN coated area and 3 regions measured outside of the
FN coated area. The software was used to measure the root mean square roughness of three 1µm
x 1µm areas of each measured region found using Equation 3, where h is the height of the
cantilever.
(3)
4.6 Evaluating KC spreading with maleimide
Wells (6 mm diameter) were created on the slides using the ProPlate™ Multi-Array Slide
System created by Grace Biolabs. A 25 µg/mL FN solution in DPBS was passively adsorbed on
the surfaces overnight at 4°C. The slides were blocked with 1% hdBSA in DPBS for 30 minutes.
Keratinocytes (7500 cells/well) in serum free medium were seeded and incubated for 3 hours in
10% CO2 at 37°C. The wells were rinsed with PBSABC (EMD Chemicals, Gibbstown, NJ) to
remove non-adherent cells and fixed with 16% formaldehyde (Ted Pella, Inc., Redding, CA) and
0.1% Triton X-100 (Sigma) in DPBS. The wells were incubated with 0.6 mM fluorescein-5-
maleimide (Molecular Probes) for 1 hour at room temperature. The wells were rinsed with DPBS
and incubated with 0.06 mM Hoechst (Molecular Probes) for 5 minutes at 37°C. The slides were
coverslipped using ProLong Gold Antifade Reagent (Invitrogen).
The wells were imaged with a fluorescent microscope at 40x using the FITC filter at the
same fluorescence intensity, capturing 12 images per slide. Each cell, not touching an adjacent
cell, was traced using ImageJ software to obtain cell area. The cell areas on each slide were
ranked from largest to smallest. The average cell area was obtained by averaging the middle 1/3
of the ranked cell areas to prevent the value from being skewed by outliers. The cell spreading
32
capacity was obtained by averaging the ten largest cells per slide to understand the largest KC
spreading the surface supported. Two slides per surface chemistry were measured.
4.7 Computing KC adhesion with centrifugation
Wells (6 mm diameter) were created on the slides using the ProPlate™ Multi-Array Slide
System created by Grace Biolabs. A 25 µg/mL FN solution in DPBS was passively adsorbed on
the surfaces overnight at 4°C. The slides were blocked with 1% hdBSA in DPBS for 30 minutes.
Keratinocytes were preloaded with 10mM Calcein AM (Invitrogen) and 8 wells per slide were
seeded (7500 cells/well) in serum free medium and incubated for 3 hours in 10% CO2 at 37°C.
The wells were rinsed with DPBS to remove non-adherent cells and DPBS was added to each
well. Then the slides were read at 485/535 nm using a PerkinElmer® Victor3™ fluorescent plate
reader to obtain the “before” reading. The wells were topped off with DPBS and sealed with
sealing tape (VWR). The 1x g slides were inverted and the 50xg slides were centrifuged inverted
in plate spinners. The slides remained inverted until decanted onto an adsorbent pad. The wells
were rinsed with DPBS to remove any loosely adherent cells and DPBS was added to each well.
The slides were reread in the plate reader to obtain the “after” reading. The percentage of
adherent cells were calculated by dividing the “after” reading by the “before” reading and
multiplying by 100. The values are reported as percent keratinocyte adhesion and each surface
chemistry was measured five times per force.
4.8 Visualizing FACs with vinculin
Wells (6 mm diameter) were created on the slides using the ProPlate™ Multi-Array Slide
System created by Grace Biolabs. A 25 µg/mL FN solution in DPBS was passively adsorbed on
the surfaces overnight at 4°C. The slides were blocked with 1% hdBSA in DPBS for 30 minutes.
Keratinocytes were seeded (7500 cells/well) in serum free medium and incubated for 3 hours in
10% CO2 at 37°C. The wells were rinsed with PBSABC to remove non-adherent cells and fixed
with 16% formaldehyde and 0.1% Triton X-100 in DPBS. The wells were blocked with 1% BSA
and incubated with a 1:100 solution of mouse antihuman vinculin primary antibody (Clone
HVIN-1, Sigma) in blocking solution for 45 min in 10% CO2 at 37°C. The slides were rinsed
with 1% (w/v) BSA and incubated with 1:100 solution of Alexa Fluor 546 conjugated goat anti-
mouse secondary antibody in blocking solution for 30 min in 10% CO2 at 37°C. The slides were
coverslipped using ProLong Gold Antifade Reagent (Invitrogen).

33
The wells were imaged with a fluorescent microscope at 40x using the TRITC filter at the
same fluorescence intensity, imaging 12 cells per slide. After subtracting out the background
stain from the centers of the cell, the amount of positive vinculin stain per cell was quantified
using ImageJ, giving the area of positive stain per cell (non-normalized data). These values were
normalized to the area of the cell to obtain the area density of the FAs (normalized data). Each
surface was measured twice.
34
Chapter 5: Results
5.1 Fibronectin adsorption to surface
The goal of the first Specific Aim was to characterize the effects of surface chemistry on
FN binding and FN cell binding domain availability on our model surfaces. This was done with
three studies. The first study was to characterize the surfaces using contact angle measurements,
the second to determine the amount of binding sites per area on our surfaces, and the third was to
investigate the mechanism of altered binding site domain availability through AFM.
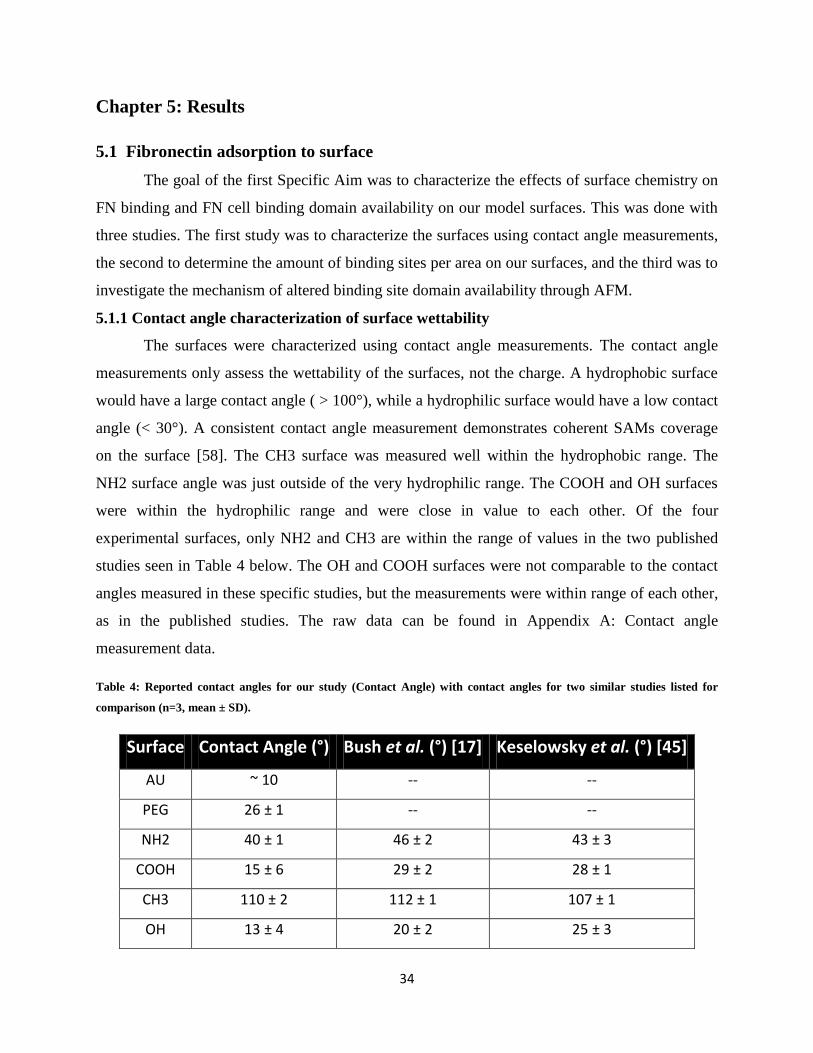
5.1.1 Contact angle characterization of surface wettability
The surfaces were characterized using contact angle measurements. The contact angle
measurements only assess the wettability of the surfaces, not the charge. A hydrophobic surface
would have a large contact angle ( > 100°), while a hydrophilic surface would have a low contact
angle (< 30°). A consistent contact angle measurement demonstrates coherent SAMs coverage
on the surface [58]. The CH3 surface was measured well within the hydrophobic range. The
NH2 surface angle was just outside of the very hydrophilic range. The COOH and OH surfaces
were within the hydrophilic range and were close in value to each other. Of the four
experimental surfaces, only NH2 and CH3 are within the range of values in the two published
studies seen in Table 4 below. The OH and COOH surfaces were not comparable to the contact
angles measured in these specific studies, but the measurements were within range of each other,
as in the published studies. The raw data can be found in Appendix A: Contact angle
measurement data.
Table 4: Reported contact angles for our study (Contact Angle) with contact angles for two similar studies listed for
comparison (n=3, mean ± SD).
Surface Contact Angle (°) Bush et al. (°) [17] Keselowsky et al. (°) [45]
AU ~ 10 -- --
PEG 26 ± 1 -- --
NH2 40 ± 1 46 ± 2 43 ± 3
COOH 15 ± 6 29 ± 2 28 ± 1
CH3 110 ± 2 112 ± 1 107 ± 1
OH 13 ± 4 20 ± 2 25 ± 3
35
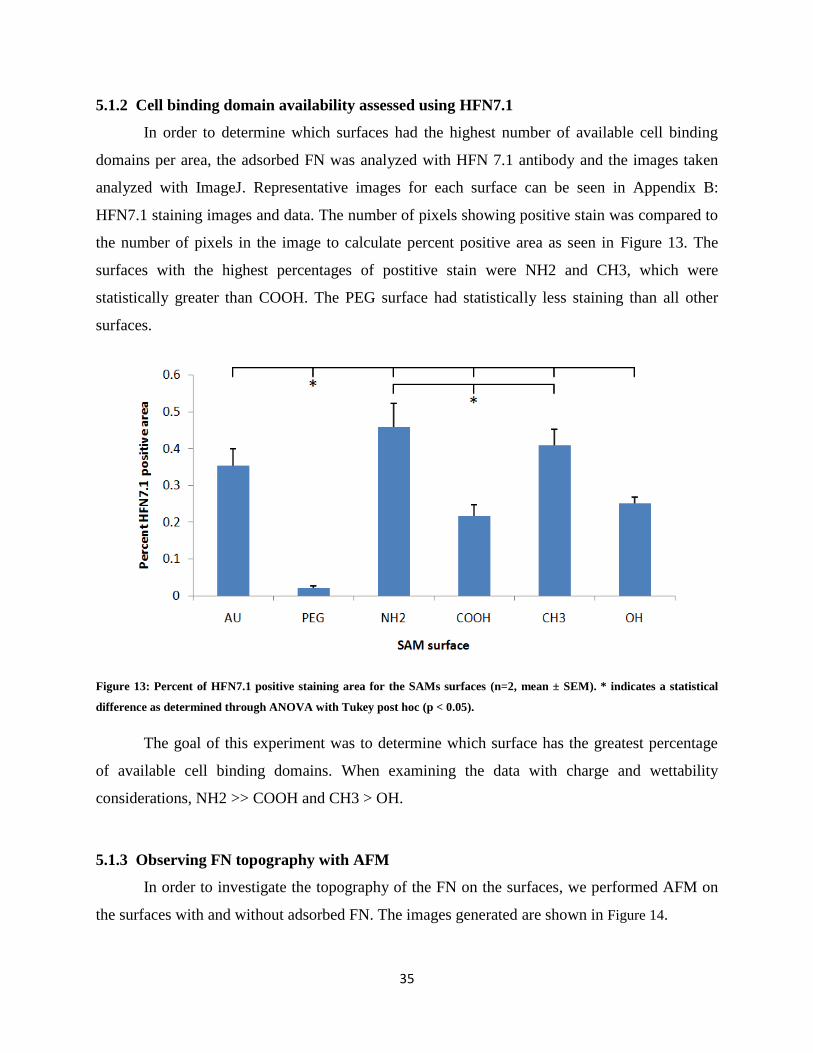
5.1.2 Cell binding domain availability assessed using HFN7.1
In order to determine which surfaces had the highest number of available cell binding
domains per area, the adsorbed FN was analyzed with HFN 7.1 antibody and the images taken
analyzed with ImageJ. Representative images for each surface can be seen in Appendix B:
HFN7.1 staining images and data. The number of pixels showing positive stain was compared to
the number of pixels in the image to calculate percent positive area as seen in Figure 13. The
surfaces with the highest percentages of postitive stain were NH2 and CH3, which were
statistically greater than COOH. The PEG surface had statistically less staining than all other
surfaces.
Figure 13: Percent of HFN7.1 positive staining area for the SAMs surfaces (n=2, mean ± SEM). * indicates a statistical
difference as determined through ANOVA with Tukey post hoc (p < 0.05).
The goal of this experiment was to determine which surface has the greatest percentage
of available cell binding domains. When examining the data with charge and wettability
considerations, NH2 >> COOH and CH3 > OH.
5.1.3 Observing FN topography with AFM
In order to investigate the topography of the FN on the surfaces, we performed AFM on
the surfaces with and without adsorbed FN. The images generated are shown in Figure 14.
36
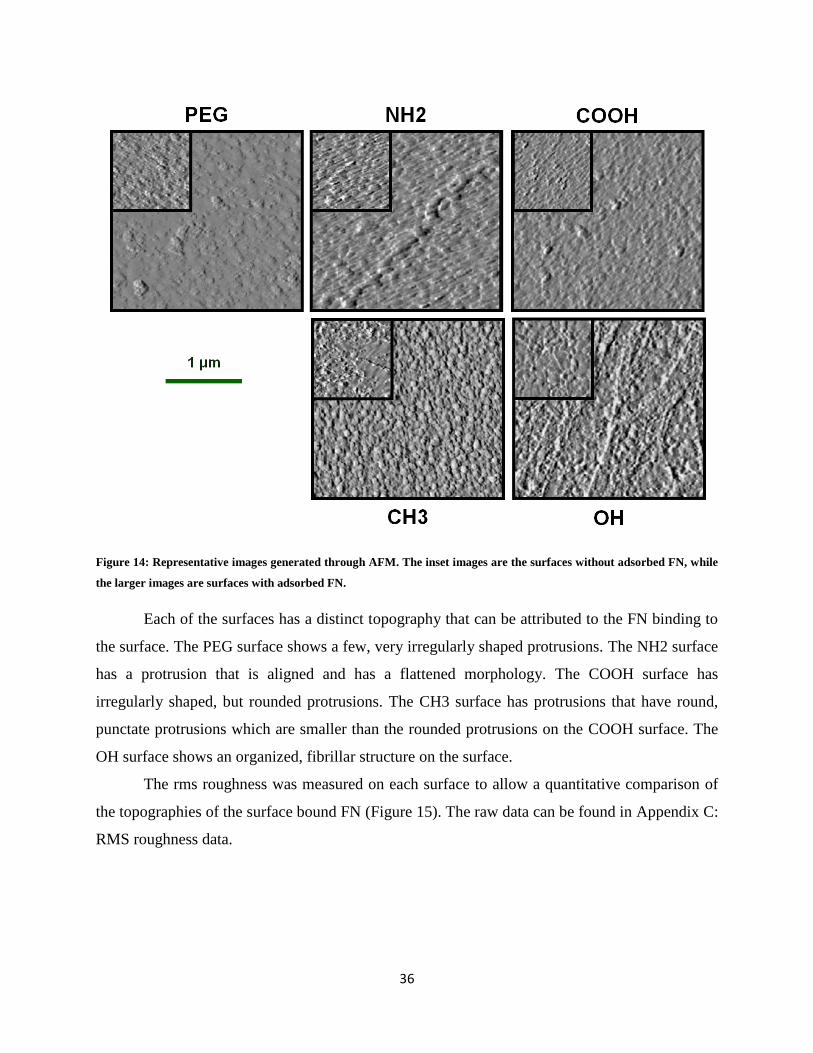
Figure 14: Representative images generated through AFM. The inset images are the surfaces without adsorbed FN, while
the larger images are surfaces with adsorbed FN.
Each of the surfaces has a distinct topography that can be attributed to the FN binding to
the surface. The PEG surface shows a few, very irregularly shaped protrusions. The NH2 surface
has a protrusion that is aligned and has a flattened morphology. The COOH surface has
irregularly shaped, but rounded protrusions. The CH3 surface has protrusions that have round,
punctate protrusions which are smaller than the rounded protrusions on the COOH surface. The
OH surface shows an organized, fibrillar structure on the surface.
The rms roughness was measured on each surface to allow a quantitative comparison of
the topographies of the surface bound FN (Figure 15). The raw data can be found in Appendix C:
RMS roughness data.
37
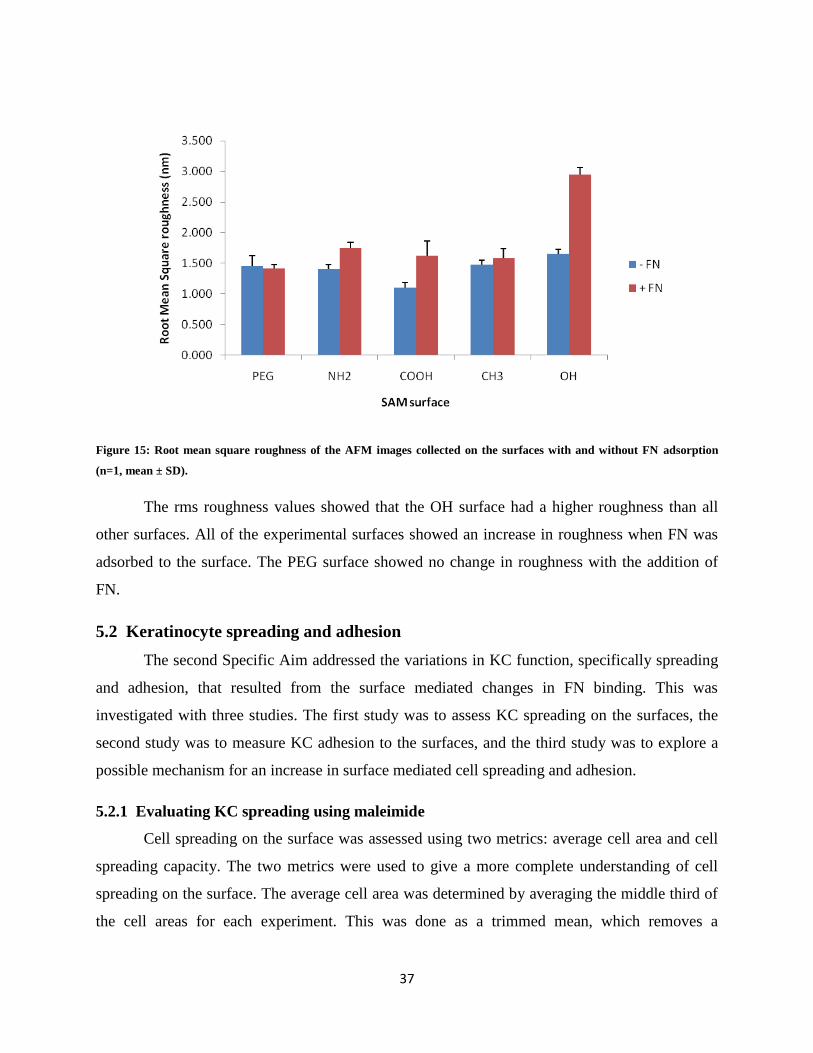
Figure 15: Root mean square roughness of the AFM images collected on the surfaces with and without FN adsorption
(n=1, mean ± SD).
The rms roughness values showed that the OH surface had a higher roughness than all
other surfaces. All of the experimental surfaces showed an increase in roughness when FN was
adsorbed to the surface. The PEG surface showed no change in roughness with the addition of
FN.
5.2 Keratinocyte spreading and adhesion
The second Specific Aim addressed the variations in KC function, specifically spreading
and adhesion, that resulted from the surface mediated changes in FN binding. This was
investigated with three studies. The first study was to assess KC spreading on the surfaces, the
second study was to measure KC adhesion to the surfaces, and the third study was to explore a
possible mechanism for an increase in surface mediated cell spreading and adhesion.
5.2.1 Evaluating KC spreading using maleimide
Cell spreading on the surface was assessed using two metrics: average cell area and cell
spreading capacity. The two metrics were used to give a more complete understanding of cell
spreading on the surface. The average cell area was determined by averaging the middle third of
the cell areas for each experiment. This was done as a trimmed mean, which removes a
38
percentage of the high and low data so that the value reported is not skewed by outliers. This
gives a truer account of the size of the average cell on the surface. The cell spreading capacity
was measured by averaging the ten largest cell areas on each surface. This was done to assess
how large a cell could spread on the surface, that is, how much the surface supports cell
spreading. The two metrics are different in that one measures the size of the average cells on the
surface, while the other measures the size of the large cells on the surface. The raw data collected
and used for each metric can be found in Appendix D: Cell spreading data.
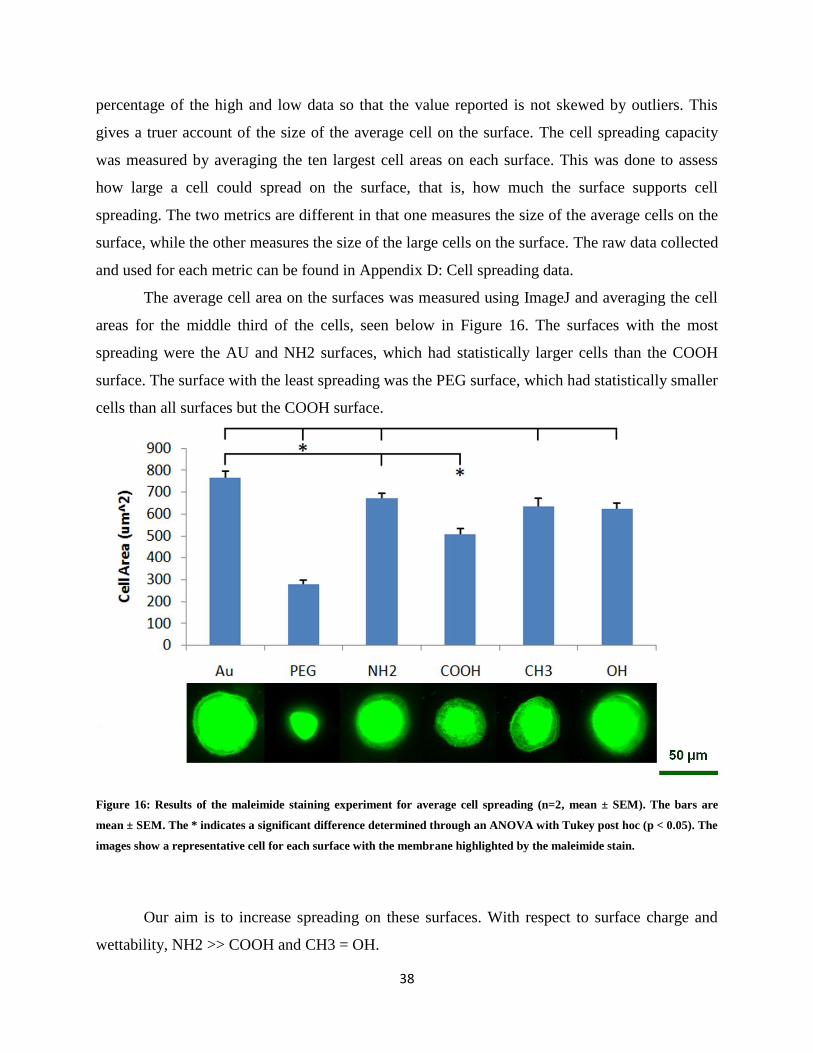
The average cell area on the surfaces was measured using ImageJ and averaging the cell
areas for the middle third of the cells, seen below in Figure 16. The surfaces with the most
spreading were the AU and NH2 surfaces, which had statistically larger cells than the COOH
surface. The surface with the least spreading was the PEG surface, which had statistically smaller
cells than all surfaces but the COOH surface.
Figure 16: Results of the maleimide staining experiment for average cell spreading (n=2, mean ± SEM). The bars are
mean ± SEM. The * indicates a significant difference determined through an ANOVA with Tukey post hoc (p < 0.05). The
images show a representative cell for each surface with the membrane highlighted by the maleimide stain.
Our aim is to increase spreading on these surfaces. With respect to surface charge and
wettability, NH2 >> COOH and CH3 = OH.
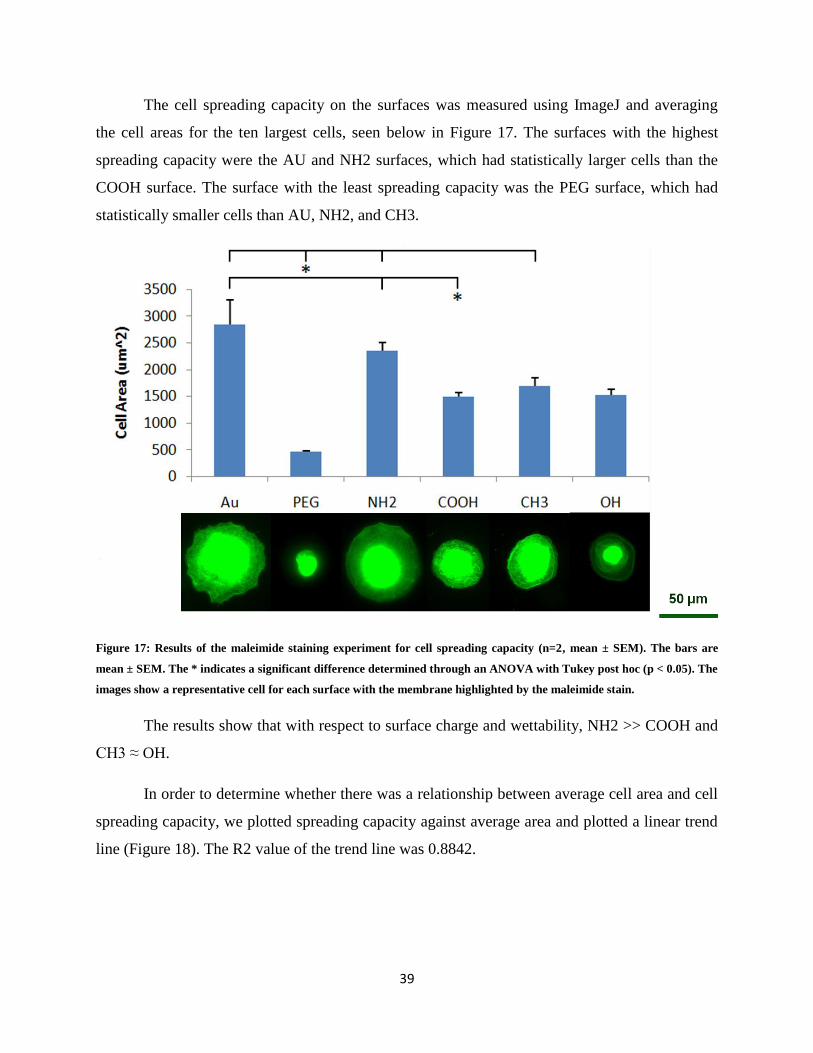
39
The cell spreading capacity on the surfaces was measured using ImageJ and averaging
the cell areas for the ten largest cells, seen below in Figure 17. The surfaces with the highest
spreading capacity were the AU and NH2 surfaces, which had statistically larger cells than the
COOH surface. The surface with the least spreading capacity was the PEG surface, which had
statistically smaller cells than AU, NH2, and CH3.
Figure 17: Results of the maleimide staining experiment for cell spreading capacity (n=2, mean ± SEM). The bars are
mean ± SEM. The * indicates a significant difference determined through an ANOVA with Tukey post hoc (p < 0.05). The
images show a representative cell for each surface with the membrane highlighted by the maleimide stain.
The results show that with respect to surface charge and wettability, NH2 >> COOH and
CH3 ≈ OH.
In order to determine whether there was a relationship between average cell area and cell
spreading capacity, we plotted spreading capacity against average area and plotted a linear trend
line (Figure 18). The R2 value of the trend line was 0.8842.
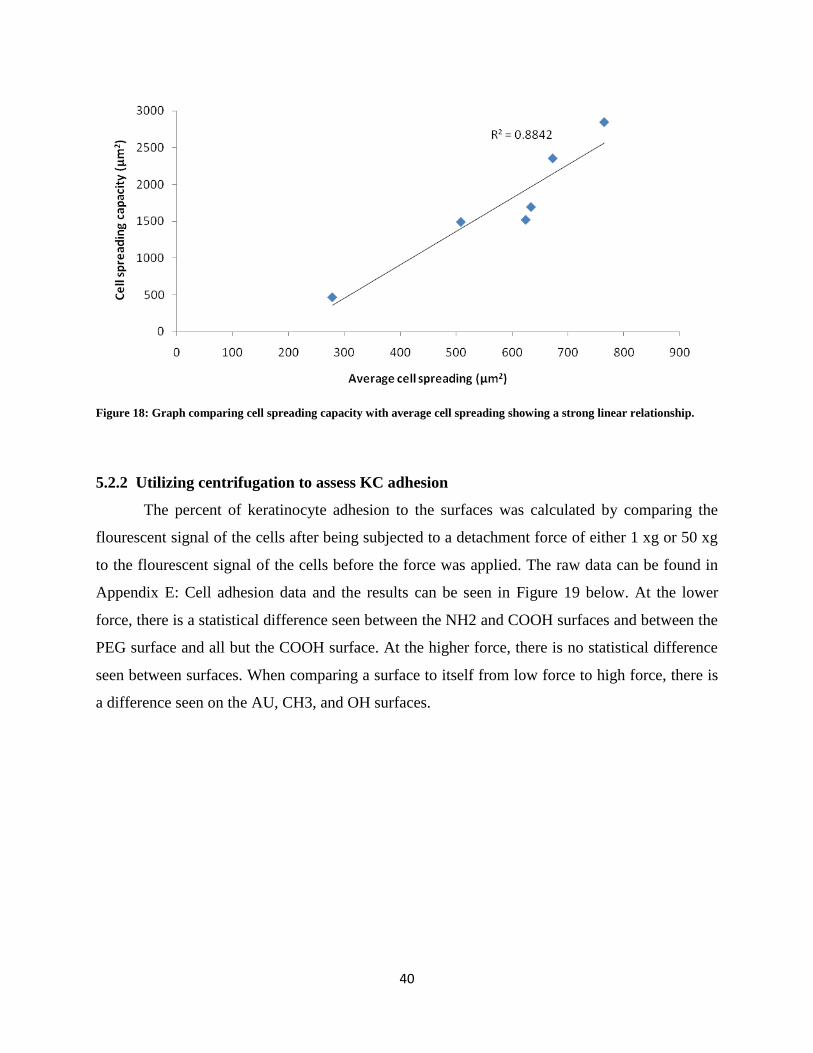
40
Figure 18: Graph comparing cell spreading capacity with average cell spreading showing a strong linear relationship.
5.2.2 Utilizing centrifugation to assess KC adhesion
The percent of keratinocyte adhesion to the surfaces was calculated by comparing the
flourescent signal of the cells after being subjected to a detachment force of either 1 xg or 50 xg
to the flourescent signal of the cells before the force was applied. The raw data can be found in
Appendix E: Cell adhesion data and the results can be seen in Figure 19 below. At the lower
force, there is a statistical difference seen between the NH2 and COOH surfaces and between the
PEG surface and all but the COOH surface. At the higher force, there is no statistical difference
seen between surfaces. When comparing a surface to itself from low force to high force, there is
a difference seen on the AU, CH3, and OH surfaces.
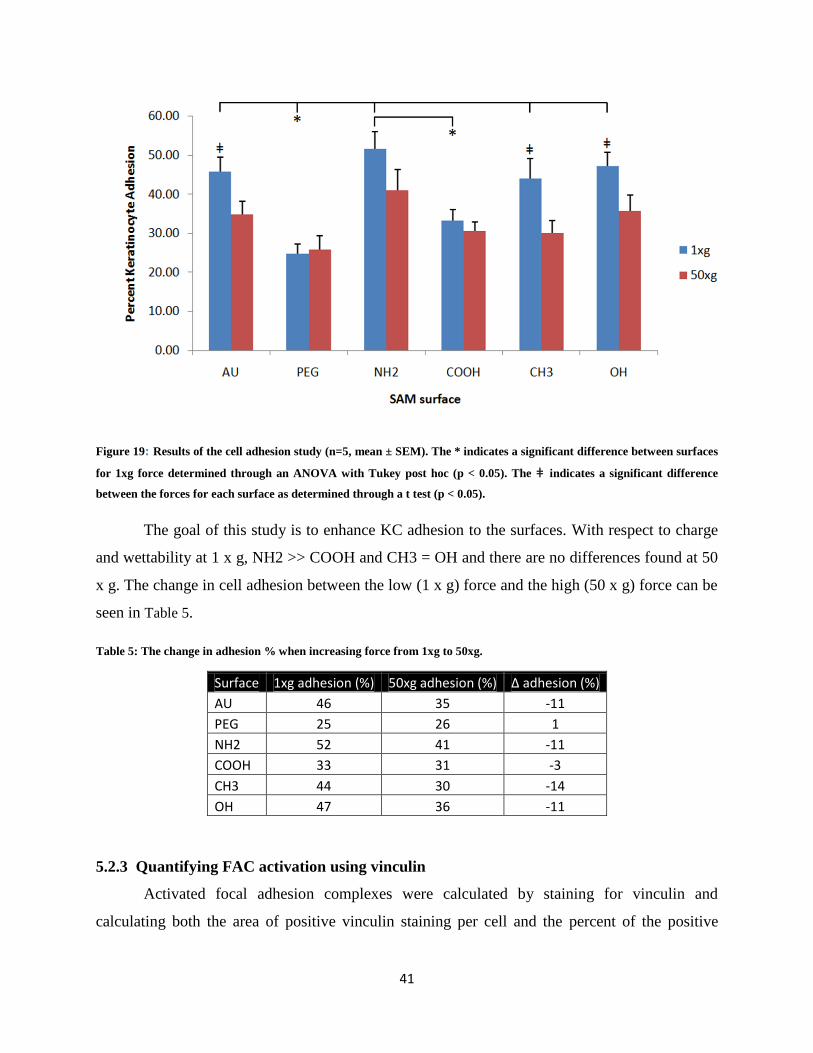
41
Figure 19: Results of the cell adhesion study (n=5, mean ± SEM). The * indicates a significant difference between surfaces
for 1xg force determined through an ANOVA with Tukey post hoc (p < 0.05). The ǂ indicates a significant difference
between the forces for each surface as determined through a t test (p < 0.05).
The goal of this study is to enhance KC adhesion to the surfaces. With respect to charge
and wettability at 1 x g, NH2 >> COOH and CH3 = OH and there are no differences found at 50
x g. The change in cell adhesion between the low (1 x g) force and the high (50 x g) force can be
seen in Table 5.
Table 5: The change in adhesion % when increasing force from 1xg to 50xg.
Surface 1xg adhesion (%) 50xg adhesion (%) Δ adhesion (%)
AU 46 35 -11
PEG 25 26 1
NH2 52 41 -11
COOH 33 31 -3
CH3 44 30 -14
OH 47 36 -11
5.2.3 Quantifying FAC activation using vinculin
Activated focal adhesion complexes were calculated by staining for vinculin and
calculating both the area of positive vinculin staining per cell and the percent of the positive
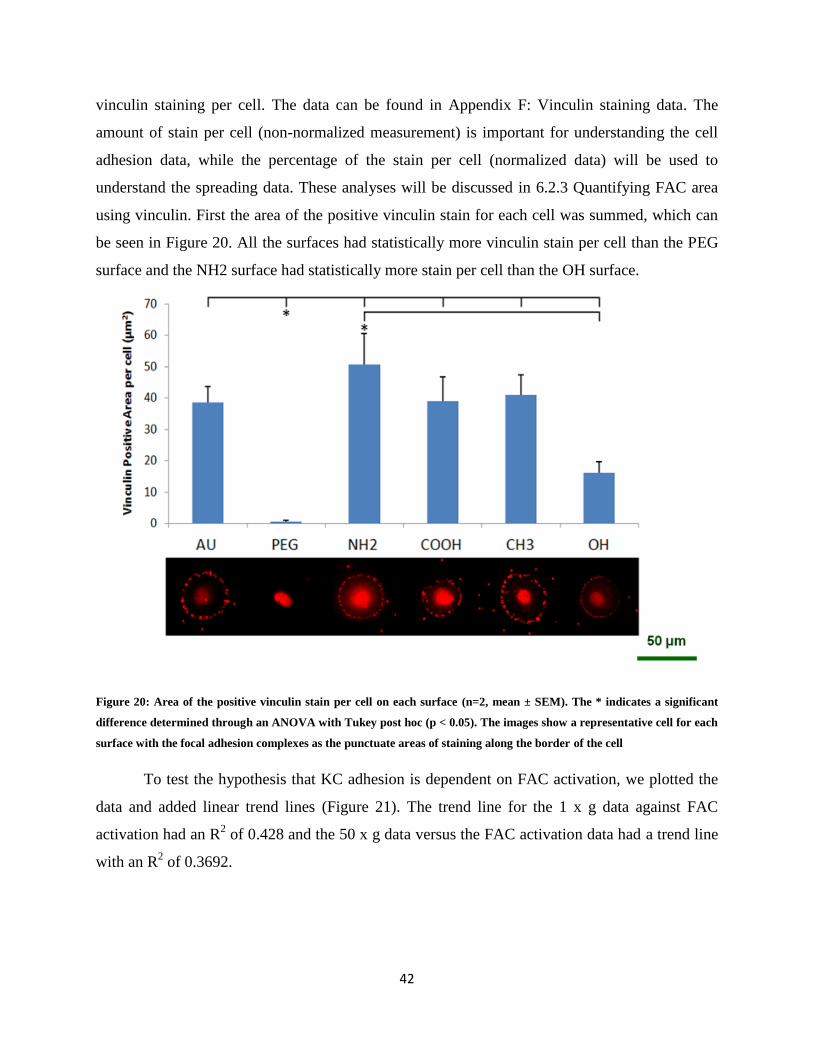
42
vinculin staining per cell. The data can be found in Appendix F: Vinculin staining data. The
amount of stain per cell (non-normalized measurement) is important for understanding the cell
adhesion data, while the percentage of the stain per cell (normalized data) will be used to
understand the spreading data. These analyses will be discussed in 6.2.3 Quantifying FAC area
using vinculin. First the area of the positive vinculin stain for each cell was summed, which can
be seen in Figure 20. All the surfaces had statistically more vinculin stain per cell than the PEG
surface and the NH2 surface had statistically more stain per cell than the OH surface.
Figure 20: Area of the positive vinculin stain per cell on each surface (n=2, mean ± SEM). The * indicates a significant
difference determined through an ANOVA with Tukey post hoc (p < 0.05). The images show a representative cell for each
surface with the focal adhesion complexes as the punctuate areas of staining along the border of the cell
To test the hypothesis that KC adhesion is dependent on FAC activation, we plotted the
data and added linear trend lines (Figure 21). The trend line for the 1 x g data against FAC
activation had an R2 of 0.428 and the 50 x g data versus the FAC activation data had a trend line
with an R2 of 0.3692.
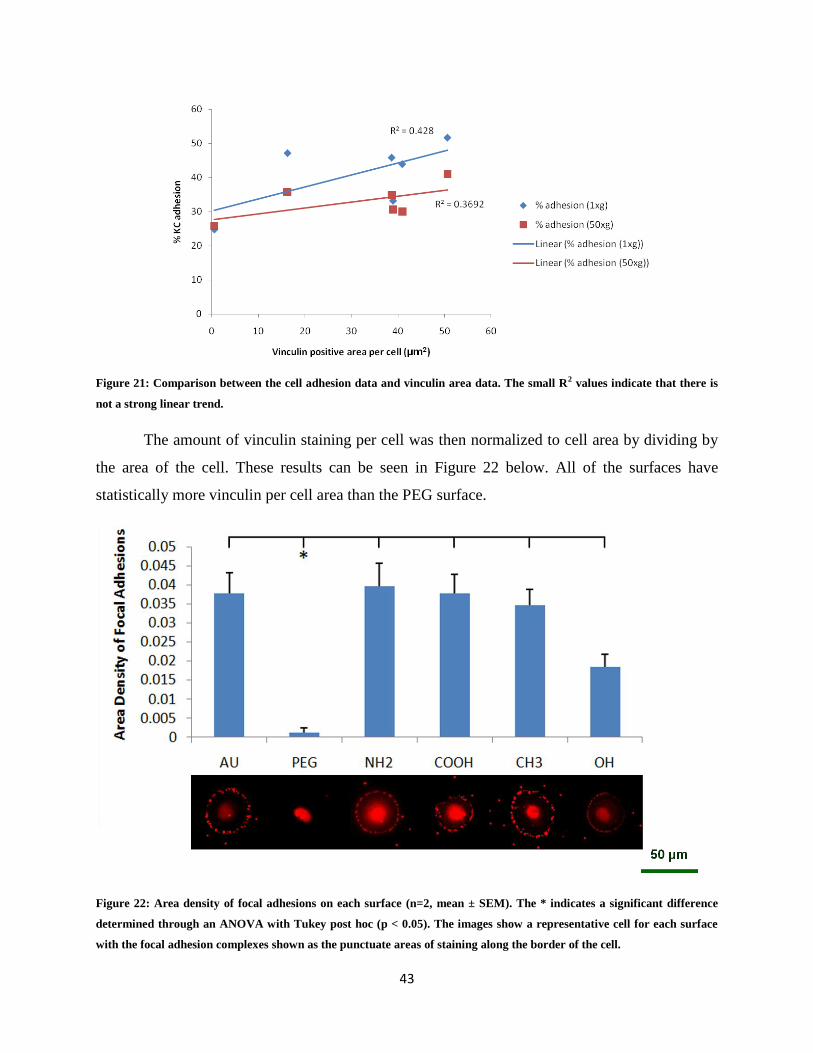
43
Figure 21: Comparison between the cell adhesion data and vinculin area data. The small R2 values indicate that there is
not a strong linear trend.
The amount of vinculin staining per cell was then normalized to cell area by dividing by
the area of the cell. These results can be seen in Figure 22 below. All of the surfaces have
statistically more vinculin per cell area than the PEG surface.
Figure 22: Area density of focal adhesions on each surface (n=2, mean ± SEM). The * indicates a significant difference
determined through an ANOVA with Tukey post hoc (p < 0.05). The images show a representative cell for each surface
with the focal adhesion complexes shown as the punctuate areas of staining along the border of the cell.
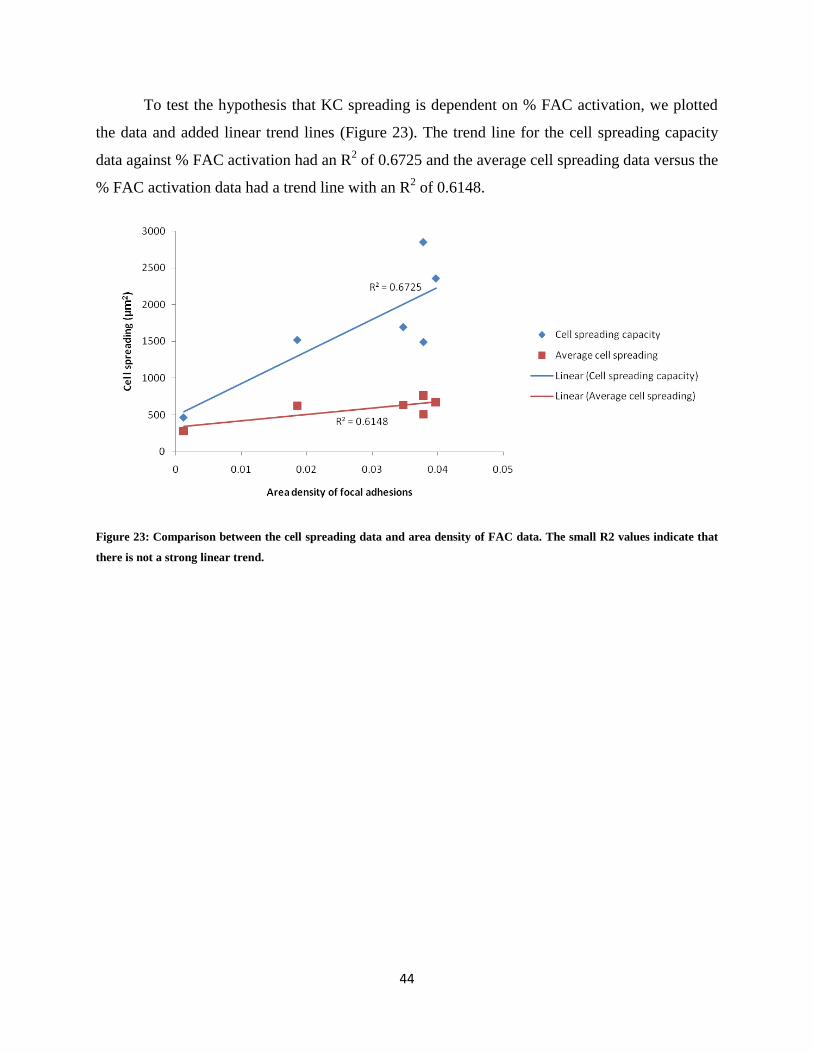
44
To test the hypothesis that KC spreading is dependent on % FAC activation, we plotted
the data and added linear trend lines (Figure 23). The trend line for the cell spreading capacity
data against % FAC activation had an R2 of 0.6725 and the average cell spreading data versus the
% FAC activation data had a trend line with an R2 of 0.6148.
Figure 23: Comparison between the cell spreading data and area density of FAC data. The small R2 values indicate that
there is not a strong linear trend.
45
Chapter 6: Discussion
6.1 FN adsorption surface dependent
The first Specific Aim addressed the surface mediated FN topography and the altered
binding domain presentation which we hypothesized resulted from a change in protein
orientation. The results of these studies show that surface chemistry altered FN topography
which caused an increase in cell binding domain availability on the NH2 and CH3 surfaces over
the COOH and OH surfaces.
6.1.1 Contact angle measurements within published ranges
Contact angle measurements were taken for two purposes: to compare our surfaces with
the previously published measurements and to ensure consistent trends during the production of
our surfaces. The two studies to which we were comparing our surfaces did not use the PEG or
AU surface, therefore, we will only be able to examine these for our second purpose. The AU
and PEG measurements were extremely consistent, meaning that they were being made
consistently during our studies. The NH2 surface was 40° ± 1, compared to the 46º ± 2 and 43º ±
3 of the studies. This means that the NH2 surface angle is consistently outside of the hydrophilic
range and is within the published range. The CH3 surface was reported at 110º ± 2, with the
studies reporting 112° ± 1 and 107º ± 1, keeping CH3 within published values and consistently
hydrophobic.
The other two surfaces, COOH and OH, were different from the published values in these
studies. The COOH was reported at 15° ± 6, where the published values are 29° ± 2 and 28° ± 1.
This would suggest that our method for producing the COOH SAM was inaccurate. However,
further investigation revealed that the contact angle measurements for the COOH SAM can vary
widely with published values ranging from < 10° to 28° and even as high as 70° [48, 58]. This
purports that our value is well within published values.
The OH surface was reported at 13° ± 4, where the studies showed 20° ± 2 and 25° ± 3.
Further reading revealed that the OH surface is another SAM that has several values reported in
literature. In 1989, Bain et al. did a study revealing that any alterations in the process of
generating the OH SAM can vary the contact angle. The measurement that the study found for
the process we used generated a contact angle of ˂5°. [57] The contact angle measurement that
we made is within the range of 5°-25° gleaned from the literature. Although the actual
46
measurements differed from the two published studies, the trend is the same. The studies placed
COOH and OH angles close together in the hydrophilic range and our measurements were
consistent with that trend.
The contact angle measurements that we found were all within published ranges for
measurements on these surfaces and the standard deviations showed that the surfaces were being
dependably manufactured.
6.1.2 Binding sites increased on positive charged and hydrophobic surfaces
The cell binding domains were quantified using an antibody that targets the synergy
binding site between the RGD and PHSRN cell-binding sites on fibronectin. This was done to
determine if the availability of the cell binding domains can be enhanced by altering the
properties of the adsorbed surface. Our results show that the NH2 and CH3 surfaces had
significantly more binding sites than the negative control and the COOH surface, and also had
more binding sites than the OH surface. These results exhibit the same trend that was observed
by Bush et al, where they found that the NH2 and CH3 surfaces had significantly more binding
sites than the COOH and OH surfaces. However, in the Bush study, the values for the percent
positive area were approximately half of what we found. We found the NH2 and CH3 were
0.4%-0.5% positive stain per cell area (positive area), where the Bush study found these surfaces
to have over 0.2%-0.3% positive area. For the COOH and OH surfaces, we found the percentage
to be 0.2%-0.3% positive area and Bush found the percentage to be 0.1%-0.2% positive area.
The differences in procedure between the two studies were the FN adsorption times. We allowed
FN to adsorb overnight, while the Bush study used a shorter adsorption time of 1 hr. [17] Since
the trends are similar, the difference in binding site percentages in the two studies is most likely
due to the amount of protein adsorbed to the surfaces. A study of FN adsorption on SAMs over
time conducted by Mrksich et al. demonstrated that the amount of adsorbed FN (25 µg/mL)
increases between 1 and 2 hours and then plateaus [79]. Since we allowed an adsorption time
longer than 1 hour, it is expected that more of the protein adsorbed, which reflected in the
proportional increase of cell binding domains.
The HFN7.1 staining analysis established that the NH2 and CH3 surfaces, along with the
positive control, allow for the most cell binding domain availability. We expected these increases
to be reproduced in the cell spreading and adhesion studies.
47
6.1.3 AFM demonstrated surface modified FN topography
Atomic force microscopy was used to evaluate the topography of the FN on the surface in
order to assess whether there could have been surface mediated changes in FN binding
orientation on the surfaces, which would explain the differences seen in the cell binding domain
availability. The topography was evaluated both qualitatively, by examining the images
generated of the surfaces, and quantitatively, by measuring the rms roughness values of the
surfaces.
The assessment of the visual representations of the surfaces suggests a change in FN
binding orientation on the surfaces. The differences in the topography of the protrusions on the
surfaces are evident of either protein orientation or changes in protein interactions with the
surfaces. For example, the round, punctate protrusions on the CH3 surface have a different
topography than the flattened, aligned protrusions on the NH2 surface. This can only be
explained by a change in binding orientation or protein interactions. If the FN did not change
binding orientation or the interactions, the protrusions would have the same topography.
The binding site assay showed a trend of increased binding site domain availability on the
CH3 and NH2 surfaces over the OH and COOH surfaces, as reported in Section 5.1.2 Cell
binding domain availability assessed using HFN7.1. This trend shows that the COOH and OH
surfaces have a lower percentage of binding site domain availability than the NH2 and CH3
surfaces. The COOH surface has protrusions on the surface that do not appear to be
homogeneous in size, while the OH surface shows a highly organized, fibrillar structure.
Fibronectin has been shown to form fibrillar structures on hydrophilic surfaces [80]. Since these
surfaces have lower binding site availability, the distinct shapes of the protrusions suggest that
the binding orientation of the protein is different on these two surfaces from the other surfaces
and this may be the mechanism for the lower binding domain availability.
The rms roughness values reiterated the qualitative findings. The rms roughness was
expected to increase on the surfaces with the adsorbed FN over the non-adsorbed surfaces. The
OH surface had an increased rms roughness over the other surfaces, except for NH2, due to the
highly organized structure of the FN on the surface. The NH2 surface had a large, aligned
protrusion on the surface which is reflected in the rms roughness values, with NH2 having a
significantly rougher surface than the PEG. The experimental surfaces all showed an increase in
roughness with the addition of the adsorbed FN. This strongly suggested that the surfaces were
48
adsorbing FN onto the surfaces. This supports the concept that the decrease in cell binding
domain availability on the COOH and OH surfaces compared to the NH2 and CH3 surfaces is
due to a change in FN binding orientation instead of a lack of FN adsorption to the surface. The
PEG showed no change, which was expected since it was a non protein adsorptive surface.
It is important to note that there are several limitations to the AFM data. First, the
experiment was only performed once per surface (n=1). This means that the experimental results
were not verified through repetition. Also, the surfaces were not rinsed with deionized water
before being dried, meaning that there could be salt crystals on the surfaces leading to the
topographies that we visualized and quantified. The final drawback in the data is the resolution
limits due to the radius of the tip. The radius of the tip is 10 nm, meaning that the tip could not
image any crevices smaller than 10 nm. Although the protein is sufficiently larger than 10 nm
[81], this could limit the resolution of the rms roughness data. Due to these limitations, it is
important that the AFM experiments be repeated to increase the robustness of the data and the
limitations must be considered during future analysis of the data.
6.2 Positively charged surface increased cell spreading and adhesion
The second Specific Aim investigated the effects of surface-mediated FN binding
orientation on keratinocyte spreading and adhesion. The cell spreading and adhesion assays are
the functional assays in this study and were used to determine which surface properties are
preferential to KC spreading and adhesion, charge or wettability, or a combination of the two
properties. We found that of the experimental surfaces, the NH2 surface supported more cell
spreading and adhesion than the COOH surface (NH2 >> COOH). There was little difference in
spreading and adhesion between the CH3 and OH surfaces (CH3 ≈ OH). This suggests that the
charge of the surface has more of an effect on the cell spreading and adhesion than the
wettability of the surface. The FAC analysis showed no differences between the experimental
surfaces indicating that FAC activation is not the mechanism that increased the cell spreading
and adhesion.
6.2.1 Positive charged surface increased KC spreading
Cell spreading was determined as a measure of the cells’ affinity for the surface and the
proliferative potential of the cells on the surface. Cell spreading was measured using two
metrics: average cell spreading and cell spreading capacity. Both metrics displayed the same
49
trend in the data; the NH2 surface and the positive control showed significantly more spreading
than the COOH surface (NH2 >> COOH). The cell spreading capacity and average cell
spreading showed that CH3 = OH. This suggests that the wettability does not seem to be the
driving mechanism for improving cell spreading considering that the two charged surfaces
showed great differences. The PEG surface had very little spreading, which is likely due to the
non-adsorptive properties of the surface. This indicates that the charge of the surface had more of
an effect on spreading than the wettability of the surface.
The cell spreading capacity was approximately 3 times the average cell spreading giving
insight into the range of spreading that can be present on any one surface. If we had not
measured the average cell area by only taking into account the middle third of the ranked cell
areas, the data would have been skewed by the spreading of the largest cells. This metric was
important to tell us about the amount of spreading the average cell on the surface will undergo.
The cell spreading capacity told us how much spreading the surfaces were able to support by
examining the size of the largest cells. The two metrics followed the same trend as can be seen in
Figure 18 by the trend line with the R2=0.8842. This means that the two metrics displayed a
strong linear relationship.
The literature showed that there is a direct relationship between increased cell spreading
and increased cell proliferation, as discussed in Section 3.2.1 Evaluate keratinocyte spreading on
FN-coated surfaces. Based on the cell spreading data collected, the NH2 surface would support
the cells with the highest proliferation rates. This suggests that the keratinocytes on the NH2
surface will proliferate and form a monolayer at a faster rate than on the other surfaces. After a
monolayer is formed and the cell-cell contacts are present, the KCs would differentiate and form
the protective layers of epidermis. This suggests that the NH2 surface would allow the KCs to
form the epidermal seal quicker than KCs on the other surfaces. In the future, this relationship
between proliferation and spreading on the model surfaces should be evaluated using a
proliferation assay using an antibodysuch as Ki-67.
6.2.2 Positive charged surface increased cell adhesion
Keratinocyte adhesion to the surface was assessed to determine which surfaces would
support a stable epidermal seal under force. Two forces were measured per surface to determine
the percent adhesion for a low force (1xg) and a high force (50xg). For the 50xg force, there
were no significant differences between the surfaces indicating that the magnitude of the force
50
may neutralize the effect of the surface chemistry. For the 1xg force, the percent adhesion to the
NH2 surface was significantly greater than the percent adhesion to the COOH force (NH2 >>
COOH). There was little difference between the CH3 and OH surfaces (CH3 = OH). This
suggests that surface charge had more of an effect on adhesion than surface wettability.
The change in the percent of cell adhesion between a low force and a high force for each
surface is an indicator of the surface’s ability to retain cells between low and high forces. This is
important when considering a dynamic system like the body, where the cutaneous seal will need
to endure multiple force loads. The NH2, AU, CH3, and OH surfaces all showed a comparable
change in cell adhesion. The PEG and COOH surfaces showed little change in percent adhesion.
These two surfaces had a smaller percentage of adhered cells at the low force and may have been
close to the threshold of cell detachment, meaning that there is a residual population of cells on
the surface that are extremely difficult to detach from the surface. This data suggests that there is
little difference in cell retention between the surfaces given when there are higher levels of low
force cell adhesion.
6.2.3 Quantifying FAC area using vinculin
We proposed that the mechanism of increasing cell spreading and adhesion based on
surface chemistry was due to increased FAC activation. This was tested using vinculin staining
for active focal adhesions, measuring the area of the focal adhesions per cell, then normalizing
the quantity of the positive stain per cell to the cell area. The non-punctate staining in the center
of the cell was not included in the analysis to remain consistent with the methods in the Bush
study. This staining is regarded as nuclear expression of vinculin, which is suggested by the
viewing the vinculin image overlaid with an image of the cell nucleus after hoechst staining.
However, in the future this should be verified by comparing the data obtained from the vinculin
analysis with a bound integrin quantification assay such as the one described by Keselowsky et
al. [46].
The area of the positive vinculin stain is important for comparison to the cell adhesion
data. The hypothesis is that a greater amount of vinculin per cell would allow for greater cell
adhesion, since more cell-FN bonds would have to be broken to allow cell detachment. The data
showed that all the surfaces had statistically greater vinculin positive area compared to the PEG
surface and the NH2 surface was statistically greater than the OH surface. The R2 values for the
trend lines indicate that there is not a strong relationship between the amount of positive vinculin
51
stain per cell and the cell adhesion (Figure 21), suggesting that increasing the amount of
activated integrins per cells is not the driving mechanism behind increasing KC adhesion.
The positive vinculin area per cell data was normalized to the cell area for each cell
yielding the area density of FACs. We found no differences in the area density of the focal
adhesions between the surfaces, with the exception of the negative control. This differs from the
2009 Bush study, which found the NH2 and CH3 surfaces to have significantly greater area
density than the COOH and OH surfaces [17]. The difference is presumably due to the varied FN
adsorption times between this experiment and the Bush study. In Section 6.1.2 Binding sites
increased on positive charged and hydrophobic surfaces, we observed in increase in binding site
domains on our surfaces relative to the surfaces in the Bush study. The cells that were less likely
to activate FACs in the Bush study may have more opportunity to activate them on our surfaces
due to the increase in cell binding domain availability.
This data were also important for comparing the area density of FACs with the cell
spreading on the surface. The hypothesis was that the cells with larger spreading areas were able
to spread because of a higher integrin to cell percentage. The R2 values of the trend lines suggest
that there is no strong linear trend between the groups (Figure 23). This indicates that the amount
of cell spreading is to some extent independent of the area density of FACs.
The comparison data suggest that our hypothesis on the mechanism of increased cell
adhesion and spreading being due to increased FAC activation is either incorrect or incomplete.
Another possible mechanism of the surface dependent changes in adhesion and spreading could
be due to integrin strengthening. This mechanism has been investigated by other groups and
suggests that FN binding orientation and binding site availability alters the strength of the cell-
FN bond instead of merely increasing the number of bonds [46, 51, 52]. To investigate this, the
force required to obtain a specific adhesion percentage, generally 50% adhesion, must be
calculated. This differs from our method, where we applied a specific amount of force and found
the percent adhesion at that force. This is best done by using the spinning disk method, which
applies a range of shear forces to a single disk of cells. The amount of force needed to detach
50% of the cells can be established. The amount of force require to detach this fraction of cells
from each surface is compared to the amount of FAC activation to determine the relative strength
of each integrin. An alternate mechanism to describe the relationship between cell adhesion and
spreading and FAC expression may incorporate the size of the individual focal adhesions in the
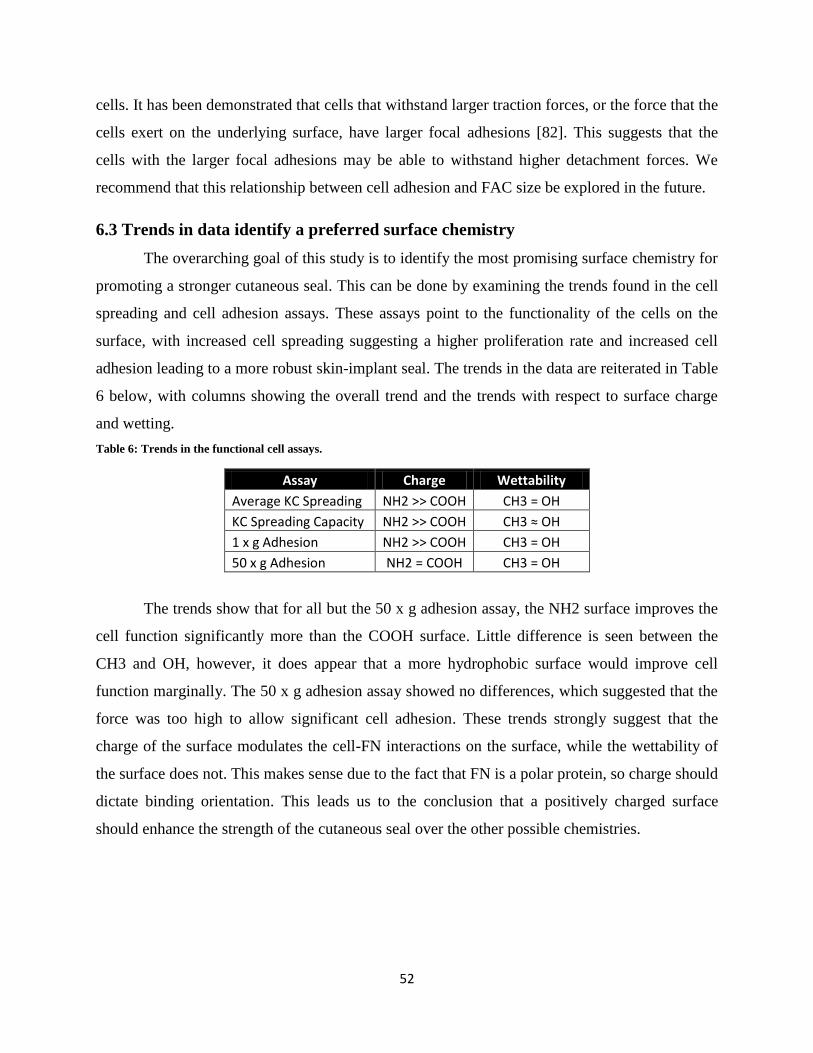
52
cells. It has been demonstrated that cells that withstand larger traction forces, or the force that the
cells exert on the underlying surface, have larger focal adhesions [82]. This suggests that the
cells with the larger focal adhesions may be able to withstand higher detachment forces. We
recommend that this relationship between cell adhesion and FAC size be explored in the future.
6.3 Trends in data identify a preferred surface chemistry
The overarching goal of this study is to identify the most promising surface chemistry for
promoting a stronger cutaneous seal. This can be done by examining the trends found in the cell
spreading and cell adhesion assays. These assays point to the functionality of the cells on the
surface, with increased cell spreading suggesting a higher proliferation rate and increased cell
adhesion leading to a more robust skin-implant seal. The trends in the data are reiterated in Table
6 below, with columns showing the overall trend and the trends with respect to surface charge
and wetting.
Table 6: Trends in the functional cell assays.
Assay Charge Wettability
Average KC Spreading NH2 >> COOH CH3 = OH
KC Spreading Capacity NH2 >> COOH CH3 ≈ OH
1 x g Adhesion NH2 >> COOH CH3 = OH
50 x g Adhesion NH2 = COOH CH3 = OH
The trends show that for all but the 50 x g adhesion assay, the NH2 surface improves the
cell function significantly more than the COOH surface. Little difference is seen between the
CH3 and OH, however, it does appear that a more hydrophobic surface would improve cell
function marginally. The 50 x g adhesion assay showed no differences, which suggested that the
force was too high to allow significant cell adhesion. These trends strongly suggest that the
charge of the surface modulates the cell-FN interactions on the surface, while the wettability of
the surface does not. This makes sense due to the fact that FN is a polar protein, so charge should
dictate binding orientation. This leads us to the conclusion that a positively charged surface
should enhance the strength of the cutaneous seal over the other possible chemistries.
53
Chapter 7: Future Work and Recommendations
This study has brought us closer to understanding how to improve the strength of the
cutaneous seal by using a positively charged SAM on implants prior to FN adsorption. However,
further testing is required before this research can be implemented on human implants to prove
its efficacy.
7.1 Short term recommendations
There are several short term recommendations for advancing this research:
We recommend repeating the AFM imaging and the rms roughness found in this thesis.
The AFM data consisted of an n=1 and needs to be repeated to increase the robustness of
the data. We also recommend considering repeating the reading with the surfaces wet.
Although other studies have done protein imaging on dried surfaces, we are interested in
understanding if the protein topography is different when it is wet (as in our experiments)
versus when it is dry.
We recommend determining the amount of FN adsorption to the surfaces and finding the
saturation point for overnight incubation periods. Bush et al. did this in their SAMs study,
however they only adsorbed FN for one hour. We adsorbed FN overnight, but did not
determine the saturation point of the FN on the SAMs and the quantity of the FN
adsorption per surface. These assays can be done by using the ellipsometry technique
described in the 2009 Bush et al. study [17] or by fluorescently tagging the protein and
quantifying the amount on the surface as in the 2007 Bush et al. study [34]. This will be
important determining if increased cell binding domain availability is due to increased
FN adsorption.
We recommend analyzing the relationship between keratinocyte proliferation and cell
spreading on our surfaces by performing a proliferation assay using an antibody such as
Ki-67.
We recommend determining the shear force profile for the SAMs surfaces. This data can
be used to determine the strength of the integrin binding to the FN adsorbed to the
surface. This can be accomplished by using the spinning disk method as described by
Gallant et al. [52].
54
We recommend analyzing the relationship between cell spreading and adhesion and FAC
size. This can be done by measuring the sizes of the individual focal adhesion complexes
using vinculin staining and comparing it to the area of that cell and to the overall
adhesion data.
We recommend translating the studies conducted to model titanium surfaces. There are
methods described in the literature for putting SAMs onto titanium including solution
based assembly, plasma spraying, and annealing [83]. Although we are confident that the
findings of this study will be repeatable on titanium, this needs to be verified to ensure
that the underlying material does not affect the overall FN binding orientation.
7.2 Long term recommendations
There are several long term recommendations for advancing this research:
We recommend conducting several in vitro tests with SAM coated titanium posts
embedded in foreskin tissue. Knowles et al. has a method for embedding polymer posts in
foreskins that we believe can be modified for titanium posts [84]. We feel that there are
three integral tests that should be done with embedded titanium posts. The first would be
soft tissue stress tests where the tissue would be pulled uniformly until the skin or the
skin-implant interface fails. This could be done by modifying the method used by
Balestrini et al. [85]. The second test would be a pull-out study as described by Furuzono
et al., where the force required to pull the post of the tissue would be measured [86]. The
third test, also described by Furuzono et al., is a peel test, where the force to peel the
tissue off of the surface is measured [86]. These three tests would allow for a more
comprehensive understanding of how surface chemistry effects tissue adhesion as
opposed to single cell adhesion.
We recommend implanting SAM modified Ti posts into animal models for in vivo
testing. Titanium posts modified with SAMs and adsorbed with FN can be implanted into
a rodent model using the method described by Isenhath et al. [87]. The post and
surrounding tissue would be harvested at a later time point. We recommend repeating the
pull-out and peel studies described above with the harvested tissue and post. We also
recommend performing hematoxylin and eosin histology on the samples as per Peramo et

55
al. to examine the organization of the adhered tissue [88]. These tests would offer an
evaluation of the efficacy of SAMs coated Ti in vivo.
56
Chapter 8: Conclusions
We hypothesized that surface chemistry-mediated control of FN binding orientation
would enhance keratinocyte spreading and adhesion. By testing four discrete surface chemistries,
we demonstrated that a positively charged surface would allow enhanced FN binding to increase
keratinocyte spreading and adhesion. We also showed that wettability had little effect on the
performance of the surfaces. We believe that this information will be valuable for enhancing the
strength of the cutaneous seal on percutaneous devices. Previous studies have successfully
coated titanium with NH2 terminated SAMs. If the implants were treated with these methods
before adsorbing FN, the epidermal barrier may have a better adhesion with the implant. We
believe that this research is more far reaching than bone-anchored Ti rods for amputees. The
implications of surface chemistry improving epidermal adhesion could be applied to other
percutaneous devices, such as indwelling catheters and central lines for chemotherapy patients,
as well as bioengineered skin substitutes. There is more research that needs to be completed
before this can be implemented, but the results of this study brings us closer to improving the
quality of life for amputees.
57
References [1] L. Stansbury, S. Lalliss, J. Branstetter, M. Bagg, and J. Holcomb, “Amputations in U.S. military
personnel in the current conflicts in Afghanistan and Iraq.,” J Orthop Trauma, vol. 22, (no. 1), pp. 43-6,
Jan 2008.
[2] A. Mak, M. Zhang, and D. Boone, “State-of-the-art research in lower-limb prosthetic
biomechanics-socket interface: a review.,” J Rehabil Res Dev, vol. 38, (no. 2), pp. 161-74, 2001 Mar-Apr
2001.
[3] N. Dudek, M. Marks, S. Marshall, and J. Chardon, “Dermatologic conditions associated with use
of a lower-extremity prosthesis.,” Arch Phys Med Rehabil, vol. 86, (no. 4), pp. 659-63, Apr 2005.
[4] L. Pezzin, T. Dillingham, and E. MacKenzie, “Rehabilitation and the long-term outcomes of
persons with trauma-related amputations.,” Arch Phys Med Rehabil, vol. 81, (no. 3), pp. 292-300, Mar
2000.
[5] L. Pezzin, T. Dillingham, E. Mackenzie, P. Ephraim, and P. Rossbach, “Use and satisfaction with
prosthetic limb devices and related services.,” Arch Phys Med Rehabil, vol. 85, (no. 5), pp. 723-9, May
2004.
[6] K. Hagberg, E. Häggström, M. Uden, and R. Brånemark, “Socket versus bone-anchored trans-
femoral prostheses: hip range of motion and sitting comfort.,” Prosthet Orthot Int, vol. 29, (no. 2), pp.
153-63, Aug 2005.
[7] J. Sullivan, M. Uden, K. Robinson, and S. Sooriakumaran, “Rehabilitation of the trans-femoral
amputee with an osseointegrated prosthesis: the United Kingdom experience.,” Prosthet Orthot Int, vol.
27, (no. 2), pp. 114-20, Aug 2003.
[8] J. Tillander, K. Hagberg, L. Hagberg, and R. Brånemark, “Osseointegrated Titanium Implants for
Limb Prostheses Attachments: Infectious Complications.,” Clin Orthop Relat Res, May 2010.
[9] J. Schalamon, T. Petnehazy, H. Ainoedhofer, E. Zwick, G. Singer, and M. Hoellwarth, “Pin tract
infection with external fixation of pediatric fractures.,” J Pediatr Surg, vol. 42, (no. 9), pp. 1584-7, Sep
2007.
[10] A. von Recum, “Applications and failure modes of percutaneous devices: a review.,” J Biomed
Mater Res, vol. 18, (no. 4), pp. 323-36, Apr 1984.
[11] G. Stynes, G. Kiroff, W. Morrison, and M. Kirkland, “Tissue compatibility of biomaterials:
benefits and problems of skin biointegration.,” ANZ J Surg, vol. 78, (no. 8), pp. 654-9, Aug 2008.
[12] C. Middleton, C. Pendegrass, D. Gordon, J. Jacob, and G. Blunn, “Fibronectin silanized titanium
alloy: a bioinductive and durable coating to enhance fibroblast attachment in vitro.,” J Biomed Mater Res
A, vol. 83, (no. 4), pp. 1032-8, Dec 2007.
[13] L. Scheideler, F. Rupp, H. Wendel, S. Sathe, and J. Geis-Gerstorfer, “Photocoupling of
fibronectin to titanium surfaces influences keratinocyte adhesion, pellicle formation and
thrombogenicity.,” Dent Mater, vol. 23, (no. 4), pp. 469-78, Apr 2007.
58
[14] D.T. Woodley, M. Demarchez, P. Sengel, and M. Prunieras, “The Control of Cutaneous
Development and Behavior: The Influence of Extracellular and Soluble Factors,” in Dermatology in
General Medicine 3rd ed., New York: McGraw-Hill, 1987, pp. 132-139.
[15] R. Clark, “Fibronectin matrix deposition and fibronectin receptor expression in healing and
normal skin.,” J Invest Dermatol, vol. 94, (no. 6 Suppl), pp. 128S-134S, Jun 1990.
[16] J. Adams and F. Watt, “Expression of beta 1, beta 3, beta 4, and beta 5 integrins by human
epidermal keratinocytes and non-differentiating keratinocytes.,” J Cell Biol, vol. 115, (no. 3), pp. 829-41,
Nov 1991.
[17] K. Bush, P. Driscoll, E. Soto, C. Lambert, W. McGimpsey, and G. Pins, “Designing tailored
biomaterial surfaces to direct keratinocyte morphology, attachment, and differentiation.,” J Biomed Mater
Res A, vol. 90, (no. 4), pp. 999-1009, Sep 2009.
[18] S.K. Akiyama, S.-I. Aota, and K.M. Yamada, “Function and Receptor Specificity of a Minimal
20 Kilodalton Cell Adhesive Fragment of Fibronectin,” Cell Adhesion & Communication, vol. 3, (no. 1),
pp. 13-25, 1995.
[19] A. García, M. Vega, and D. Boettiger, “Modulation of cell proliferation and differentiation
through substrate-dependent changes in fibronectin conformation.,” Mol Biol Cell, vol. 10, (no. 3), pp.
785-98, Mar 1999.
[20] K.E. Michael, B.G. Keselowsky, V.N. Vernekar, R.A. Latour, and A.J. Garcia, “Conformational
Changes in Fibronectin Due to Adsorption to Well-Defined Surface Chemistries,” in Book
Conformational Changes in Fibronectin Due to Adsorption to Well-Defined Surface Chemistries, vol. 1,
Series Conformational Changes in Fibronectin Due to Adsorption to Well-Defined Surface Chemistries,
Editor ed.^eds., City, 2002, pp. 601-602.
[21] H. Wang, Y. He, B. Ratner, and S. Jiang, “Modulating cell adhesion and spreading by control of
FnIII7-10 orientation on charged self-assembled monolayers (SAMs) of alkanethiolates.,” J Biomed
Mater Res A, vol. 77, (no. 4), pp. 672-8, Jun 2006.
[22] J. Mahan, D. Seligson, S.L. Henry, P. Hynes, and J. Dobbins, “Factors in pin tract infections.,”
Orthopedics, vol. 14, (no. 3), pp. 305-8, Mar 1991.
[23] M.T. Dahl, B. Gulli, and T. Berg, “Complications of limb lengthening. A learning curve.,” Clin
Orthop Relat Res, (no. 301), pp. 10-8, Apr 1994.
[24] P. Gregory, T. Pevny, and D. Teague, “Early complications with external fixation of pediatric
femoral shaft fractures.,” J Orthop Trauma, vol. 10, (no. 3), pp. 191-8, 1996.
[25] H.G. Ahlborg and P.O. Josefsson, “Pin-tract complications in external fixation of fractures of the
distal radius.,” Acta Orthop Scand, vol. 70, (no. 2), pp. 116-8, Apr 1999.
[26] A.D. Parameswaran, C.S. Roberts, D. Seligson, and M. Voor, “Pin tract infection with
contemporary external fixation: how much of a problem?,” J Orthop Trauma, vol. 17, (no. 7), pp. 503-7,
Aug 2003.
59
[27] H. Hedin, K. Hjorth, L. Rehnberg, and S. Larsson, “External fixation of displaced femoral shaft
fractures in children: a consecutive study of 98 fractures.,” J Orthop Trauma, vol. 17, (no. 4), pp. 250-6,
Apr 2003.
[28] G.A. Hosny, “Unilateral humeral lengthening in children and adolescents.,” J Pediatr Orthop B,
vol. 14, (no. 6), pp. 439-43, Nov 2005.
[29] M.M. Patterson, “Multicenter pin care study.,” Orthop Nurs, vol. 24, (no. 5), pp. 349-60, 2005
Sep-Oct 2005.
[30] W.T. Mason, S.N. Khan, C.L. James, T.J. Chesser, and A.J. Ward, “Complications of temporary
and definitive external fixation of pelvic ring injuries.,” Injury, vol. 36, (no. 5), pp. 599-604, May 2005.
[31] R. Burgeson, “Basement Membranes,” in Dermatology in General Medicine 3rd ed., New York:
McGraw-Hill, 1987, pp. 288-303.
[32] E. Marieb and K. Hoehn, “The Integumentary System: The Skin,” in Human Anatomy &
Physiology 7th ed., San Francisco: Pearson Benjamin Cummings, 2007, pp. 152-158.
[33] J.C. Adams and F.M. Watt, “Changes in keratinocyte adhesion during terminal differentiation:
reduction in fibronectin binding precedes alpha 5 beta 1 integrin loss from the cell surface.,” Cell, vol. 63,
(no. 2), pp. 425-35, Oct 1990.
[34] K. Bush, B. Downing, S. Walsh, and G. Pins, “Conjugation of extracellular matrix proteins to
basal lamina analogs enhances keratinocyte attachment.,” J Biomed Mater Res A, vol. 80, (no. 2), pp. 444-
52, Feb 2007.
[35] D.J. Leahy, I. Aukhil, and H.P. Erickson, “2.0 A crystal structure of a four-domain segment of
human fibronectin encompassing the RGD loop and synergy region.,” Cell, vol. 84, (no. 1), pp. 155-64,
Jan 1996.
[36] M.J. Staquet, B. Levarlet, C. Dezutter-Dambuyant, D. Schmitt, and J. Thivolet, “Identification of
specific human epithelial cell integrin receptors as VLA proteins.,” Exp Cell Res, vol. 187, (no. 2), pp.
277-83, Apr 1990.
[37] W.G. Carter, E.A. Wayner, T.S. Bouchard, and P. Kaur, “The role of integrins alpha 2 beta 1 and
alpha 3 beta 1 in cell-cell and cell-substrate adhesion of human epidermal cells.,” J Cell Biol, vol. 110,
(no. 4), pp. 1387-404, Apr 1990.
[38] J. Emsley, C.G. Knight, R.W. Farndale, M.J. Barnes, and R.C. Liddington, “Structural basis of
collagen recognition by integrin alpha2beta1.,” Cell, vol. 101, (no. 1), pp. 47-56, Mar 2000.
[39] M. De Luca, R.N. Tamura, S. Kajiji, S. Bondanza, P. Rossino, R. Cancedda, P.C. Marchisio, and
V. Quaranta, “Polarized integrin mediates human keratinocyte adhesion to basal lamina.,” Proc Natl Acad
Sci U S A, vol. 87, (no. 17), pp. 6888-92, Sep 1990.
[40] J.A. Garlick and L.B. Taichman, “Fate of human keratinocytes during reepithelialization in an
organotypic culture model.,” Lab Invest, vol. 70, (no. 6), pp. 916-24, Jun 1994.
60
[41] F. Grinnell, “Wound repair, keratinocyte activation and integrin modulation.,” J Cell Sci, vol. 101
( Pt 1), pp. 1-5, Jan 1992.
[42] H. Larjava, T. Salo, K. Haapasalmi, R.H. Kramer, and J. Heino, “Expression of integrins and
basement membrane components by wound keratinocytes.,” J Clin Invest, vol. 92, (no. 3), pp. 1425-35,
Sep 1993.
[43] R.A. Clark, J.M. Lanigan, P. DellaPelle, E. Manseau, H.F. Dvorak, and R.B. Colvin, “Fibronectin
and fibrin provide a provisional matrix for epidermal cell migration during wound reepithelialization.,” J
Invest Dermatol, vol. 79, (no. 5), pp. 264-9, Nov 1982.
[44] R.A. Clark, H.J. Winn, H.F. Dvorak, and R.B. Colvin, “Fibronectin beneath reepithelializing
epidermis in vivo: sources and significance.,” J Invest Dermatol, vol. 80, (no. 1 Suppl), pp. 26s-30s, Jun
1983.
[45] B. Keselowsky, D. Collard, and A. García, “Surface chemistry modulates fibronectin
conformation and directs integrin binding and specificity to control cell adhesion.,” J Biomed Mater Res
A, vol. 66, (no. 2), pp. 247-59, Aug 2003.
[46] B. Keselowsky, D. Collard, and A. García, “Surface chemistry modulates focal adhesion
composition and signaling through changes in integrin binding.,” Biomaterials, vol. 25, (no. 28), pp.
5947-54, Dec 2004.
[47] B. Keselowsky, D. Collard, and A. García, “Integrin binding specificity regulates biomaterial
surface chemistry effects on cell differentiation.,” Proc Natl Acad Sci U S A, vol. 102, (no. 17), pp. 5953-
7, Apr 2005.
[48] K. McClary, T. Ugarova, and D. Grainger, “Modulating fibroblast adhesion, spreading, and
proliferation using self-assembled monolayer films of alkylthiolates on gold.,” J Biomed Mater Res, vol.
50, (no. 3), pp. 428-39, Jun 2000.
[49] K. Prime and G. Whitesides, “Self-assembled organic monolayers: model systems for studying
adsorption of proteins at surfaces.,” Science, vol. 252, (no. 5010), pp. 1164-7, May 1991.
[50] S. Säuberlich, D. Klee, E.J. Richter, H. Höcker, and H. Spiekermann, “Cell culture tests for
assessing the tolerance of soft tissue to variously modified titanium surfaces.,” Clin Oral Implants Res,
vol. 10, (no. 5), pp. 379-93, Oct 1999.
[51] K.E. Michael, D.W. Dumbauld, K.L. Burns, S.K. Hanks, and A.J. García, “Focal adhesion kinase
modulates cell adhesion strengthening via integrin activation.,” Mol Biol Cell, vol. 20, (no. 9), pp. 2508-
19, May 2009.
[52] N.D. Gallant, K.E. Michael, and A.J. García, “Cell adhesion strengthening: contributions of
adhesive area, integrin binding, and focal adhesion assembly.,” Mol Biol Cell, vol. 16, (no. 9), pp. 4329-
40, Sep 2005.
[53] I. Abrahamsson and G. Cardaropoli, “Peri-implant hard and soft tissue integration to dental
implants made of titanium and gold.,” Clin Oral Implants Res, vol. 18, (no. 3), pp. 269-74, Jun 2007.
61
[54] S. Bozzini, P. Petrini, M.C. Tanzi, S. Zürcher, and S. Tosatti, “Poly(ethylene glycol) and hydroxy
functionalized alkane phosphate mixed self-assembled monolayers to control nonspecific adsorption of
proteins on titanium oxide surfaces.,” Langmuir, vol. 26, (no. 9), pp. 6529-34, May 2010.
[55] J. Rundqvist, J.H. Hoh, and D.B. Haviland, “Substrate effects in poly(ethylene glycol) self-
assembled monolayers on granular and flame-annealed gold.,” J Colloid Interface Sci, vol. 301, (no. 1),
pp. 337-41, Sep 2006.
[56] J. Rundqvist, J.H. Hoh, and D.B. Haviland, “Poly(ethylene glycol) self-assembled monolayer
island growth.,” Langmuir, vol. 21, (no. 7), pp. 2981-7, Mar 2005.
[57] C.D. Bain, J. Evall, and G.M. Whitesides, “Formation of Monolayers by the Coadsorption of
Thiols on Gold: Variation in the Head Group, Tail Group, and Solvent,” J. Am. Chem. Soc., vol. 111, pp.
7155-7164, 1989.
[58] H. Wang, S. Chen, L. Li, and S. Jiang, “Improved method for the preparation of carboxylic acid
and amine terminated self-assembled monolayers of alkanethiolates.,” Langmuir, vol. 21, (no. 7), pp.
2633-6, Mar 2005.
[59] Personal Communication with T. Camesano, Department of Chemical Engineering, Worcester
Polytechnic Institute, April 19, 2011.
[60] Personal Communication with W.G. McGimpsey, Department of Chemistry and Biochemistry,
Bioengineering Institute, Worcester Polytechnic Institute, March 1, 2010.
[61] R.D. Bowditch, C.E. Halloran, S. Aota, M. Obara, E.F. Plow, K.M. Yamada, and M.H. Ginsberg,
“Integrin alpha IIb beta 3 (platelet GPIIb-IIIa) recognizes multiple sites in fibronectin.,” J Biol Chem, vol.
266, (no. 34), pp. 23323-8, Dec 1991.
[62] K. Vallières, P. Chevallier, C. Sarra-Bournet, S. Turgeon, and G. Laroche, “AFM imaging of
immobilized fibronectin: does the surface conjugation scheme affect the protein
orientation/conformation?,” Langmuir, vol. 23, (no. 19), pp. 9745-51, Sep 2007.
[63] P.Y. Meadows and G.C. Walker, “Force microscopy studies of fibronectin adsorption and
subsequent cellular adhesion to substrates with well-defined surface chemistries.,” Langmuir, vol. 21, (no.
9), pp. 4096-107, Apr 2005.
[64] E. Servoli, D. Maniglio, M. Aguilar, A. Motta, J. San Roman, L. Belfiore, and C. Migliaresi,
“Quantitative analysis of protein adsorption via atomic force microscopy and surface plasmon
resonance.,” Macromol Biosci, vol. 8, (no. 12), pp. 1126-34, Dec 2008.
[65] E. Servoli, D. Maniglio, M.R. Aguilar, A. Motta, B. Vazquez, J.S. Roman, and C. Migliaresi,
“Comparative methods for the evaluation of protein adsorption.,” Macromol Biosci, vol. 9, (no. 7), pp.
661-70, Jul 2009.
[66] J.L. Charest, J.M. Jennings, W.P. King, A.P. Kowalczyk, and A.J. García, “Cadherin-mediated
cell-cell contact regulates keratinocyte differentiation.,” J Invest Dermatol, vol. 129, (no. 3), pp. 564-72,
Mar 2009.
62
[67] J.T. Connelly, J.E. Gautrot, B. Trappmann, D.W. Tan, G. Donati, W.T. Huck, and F.M. Watt,
“Actin and serum response factor transduce physical cues from the microenvironment to regulate
epidermal stem cell fate decisions.,” Nat Cell Biol, vol. 12, (no. 7), pp. 711-8, Jul 2010.
[68] C. Reyes and A. García, “A centrifugation cell adhesion assay for high-throughput screening of
biomaterial surfaces.,” J Biomed Mater Res A, vol. 67, (no. 1), pp. 328-33, Oct 2003.
[69] N. Faucheux, R. Schweiss, K. Lützow, C. Werner, and T. Groth, “Self-assembled monolayers
with different terminating groups as model substrates for cell adhesion studies.,” Biomaterials, vol. 25,
(no. 14), pp. 2721-30, Jun 2004.
[70] A.S. Goldstein and P.A. DiMilla, “Effect of adsorbed fibronectin concentration on cell adhesion
and deformation under shear on hydrophobic surfaces.,” J Biomed Mater Res, vol. 59, (no. 4), pp. 665-75,
Mar 2002.
[71] L. Koo, D. Irvine, A. Mayes, D. Lauffenburger, and L. Griffith, “Co-regulation of cell adhesion
by nanoscale RGD organization and mechanical stimulus.,” J Cell Sci, vol. 115, (no. Pt 7), pp. 1423-33,
Apr 2002.
[72] D. Mori, G. David, J. Humphrey, and J.J. Moore, “Stress distribution in a circular membrane with
a central fixation.,” J Biomech Eng, vol. 127, (no. 3), pp. 549-53, Jun 2005.
[73] C. McNamee, S. Armini, S. Yamamoto, and K. Higashitani, “Determination of the binding of
non-cross-linked and cross-linked gels to living cells by atomic force microscopy.,” Langmuir, vol. 25,
(no. 12), pp. 6977-84, Jun 2009.
[74] W. Hertl, W. Ramsey, and E. Nowlan, “Assessment of cell-substrate adhesion by a centrifugal
method.,” In Vitro, vol. 20, (no. 10), pp. 796-801, Oct 1984.
[75] C.J. Pendegrass, C.A. Middleton, D. Gordon, J. Jacob, and G.W. Blunn, “Measuring the strength
of dermal fibroblast attachment to functionalized titanium alloys in vitro.,” J Biomed Mater Res A, vol.
92, (no. 3), pp. 1028-37, Mar 2010.
[76] M.A. Wozniak, K. Modzelewska, L. Kwong, and P.J. Keely, “Focal adhesion regulation of cell
behavior.,” Biochim Biophys Acta, vol. 1692, (no. 2-3), pp. 103-19, Jul 2004.
[77] S. Miyamoto, S.K. Akiyama, and K.M. Yamada, “Synergistic roles for receptor occupancy and
aggregation in integrin transmembrane function.,” Science, vol. 267, (no. 5199), pp. 883-5, Feb 1995.
[78] B. Geiger, A. Bershadsky, R. Pankov, and K.M. Yamada, “Transmembrane crosstalk between the
extracellular matrix--cytoskeleton crosstalk.,” Nat Rev Mol Cell Biol, vol. 2, (no. 11), pp. 793-805, Nov
2001.
[79] M. Mrksich, L.E. Dike, J. Tien, D.E. Ingber, and G.M. Whitesides, “Using microcontact printing
to pattern the attachment of mammalian cells to self-assembled monolayers of alkanethiolates on
transparent films of gold and silver.,” Exp Cell Res, vol. 235, (no. 2), pp. 305-13, Sep 1997.
63
[80] A.W. Feinberg and K.K. Parker, “Surface-initiated assembly of protein nanofabrics.,” Nano Lett,
vol. 10, (no. 6), pp. 2184-91, Jun 2010.
[81] Y. Mao and J.E. Schwarzbauer, “Fibronectin fibrillogenesis, a cell-mediated matrix assembly
process.,” Matrix Biol, vol. 24, (no. 6), pp. 389-99, Sep 2005.
[82] A.D. Rape, W. Guo, and Y. Wang, “The regulation of traction force in relation to cell shape and
focal adhesions.,” Biomaterials, vol. 32, pp. 2043-51, Mar 2011.
[83] G. Mani, D.M. Johnson, D. Marton, V.L. Dougherty, M.D. Feldman, D. Patel, A.A. Ayon, and
C.M. Agrawal, “Stability of self-assembled monolayers on titanium and gold.,” Langmuir, vol. 24, (no.
13), pp. 6774-84, Jun 2008.
[84] N.G. Knowles, Y. Miyashita, M.L. Usui, A.J. Marshall, A. Pirrone, K.D. Hauch, B.D. Ratner,
R.A. Underwood, P. Fleckman, and J.E. Olerud, “A model for studying epithelial attachment and
morphology at the interface between skin and percutaneous devices.,” J Biomed Mater Res A, vol. 74,
(no. 3), pp. 482-8, Sep 2005.
[85] J.L. Balestrini, J.K. Skorinko, A. Hera, G.R. Gaudette, and K.L. Billiar, “Applying controlled
non-uniform deformation for in vitro studies of cell mechanobiology.,” Biomech Model Mechanobiol, vol.
9, (no. 3), pp. 329-44, Jun 2010.
[86] T. Furuzono, P.L. Wang, A. Korematsu, K. Miyazaki, M. Oido-Mori, Y. Kowashi, K. Ohura, J.
Tanaka, and A. Kishida, “Physical and biological evaluations of sintered hydroxyapatite/silicone
composite with covalent bonding for a percutaneous implant material.,” J Biomed Mater Res B Appl
Biomater, vol. 65, (no. 2), pp. 217-26, May 2003.
[87] S.N. Isenhath, Y. Fukano, M.L. Usui, R.A. Underwood, C.A. Irvin, A.J. Marshall, K.D. Hauch,
B.D. Ratner, P. Fleckman, and J.E. Olerud, “A mouse model to evaluate the interface between skin and a
percutaneous device.,” J Biomed Mater Res A, vol. 83, (no. 4), pp. 915-22, Dec 2007.
[88] A. Peramo, C.L. Marcelo, S.A. Goldstein, and D.C. Martin, “Novel organotypic cultures of
human skin explants with an implant-tissue biomaterial interface.,” Ann Biomed Eng, vol. 37, (no. 2), pp.
401-9, Feb 2009.
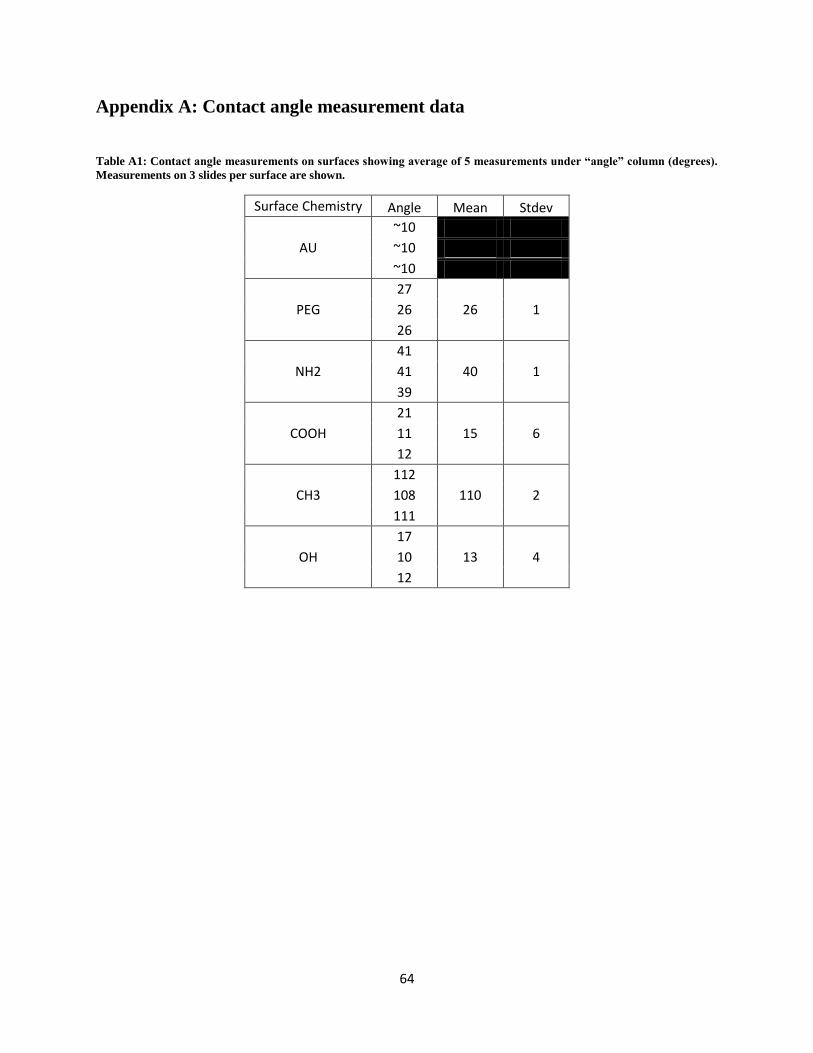
64
Appendix A: Contact angle measurement data
Table A1: Contact angle measurements on surfaces showing average of 5 measurements under “angle” column (degrees).
Measurements on 3 slides per surface are shown.
Surface Chemistry Angle Mean Stdev
AU
~10
~10
~10
PEG
27
26 1 26
26
NH2
41
40 1 41
39
COOH
21
15 6 11
12
CH3
112
110 2 108
111
OH
17
13 4 10
12
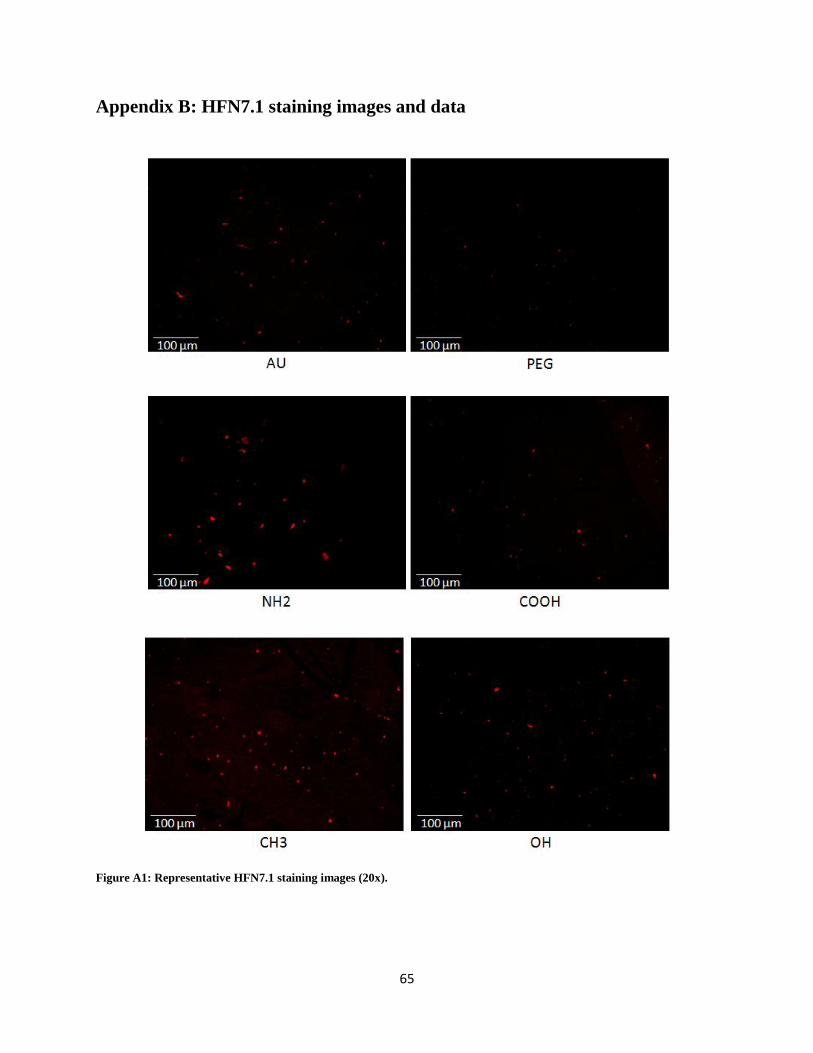
65
Appendix B: HFN7.1 staining images and data
Figure A1: Representative HFN7.1 staining images (20x).
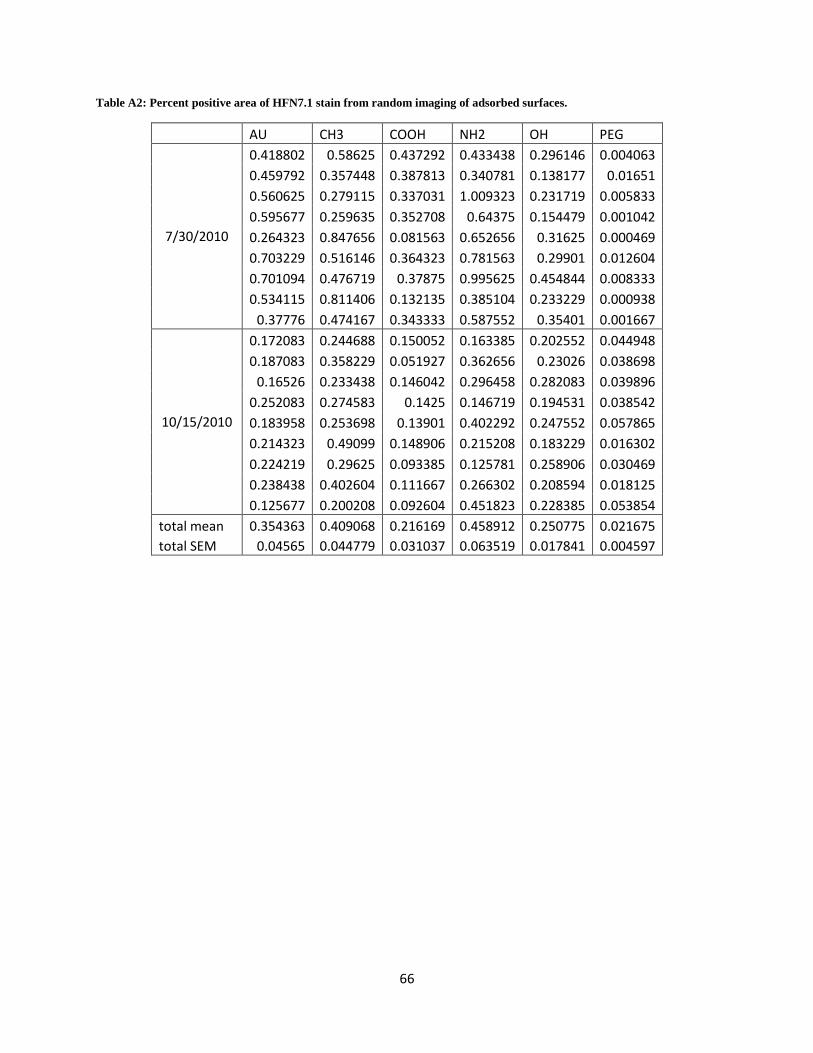
66
Table A2: Percent positive area of HFN7.1 stain from random imaging of adsorbed surfaces.
AU CH3 COOH NH2 OH PEG
7/30/2010
0.418802 0.58625 0.437292 0.433438 0.296146 0.004063
0.459792 0.357448 0.387813 0.340781 0.138177 0.01651
0.560625 0.279115 0.337031 1.009323 0.231719 0.005833
0.595677 0.259635 0.352708 0.64375 0.154479 0.001042
0.264323 0.847656 0.081563 0.652656 0.31625 0.000469
0.703229 0.516146 0.364323 0.781563 0.29901 0.012604
0.701094 0.476719 0.37875 0.995625 0.454844 0.008333
0.534115 0.811406 0.132135 0.385104 0.233229 0.000938
0.37776 0.474167 0.343333 0.587552 0.35401 0.001667
10/15/2010
0.172083 0.244688 0.150052 0.163385 0.202552 0.044948
0.187083 0.358229 0.051927 0.362656 0.23026 0.038698
0.16526 0.233438 0.146042 0.296458 0.282083 0.039896
0.252083 0.274583 0.1425 0.146719 0.194531 0.038542
0.183958 0.253698 0.13901 0.402292 0.247552 0.057865
0.214323 0.49099 0.148906 0.215208 0.183229 0.016302
0.224219 0.29625 0.093385 0.125781 0.258906 0.030469
0.238438 0.402604 0.111667 0.266302 0.208594 0.018125
0.125677 0.200208 0.092604 0.451823 0.228385 0.053854
total mean 0.354363 0.409068 0.216169 0.458912 0.250775 0.021675
total SEM 0.04565 0.044779 0.031037 0.063519 0.017841 0.004597
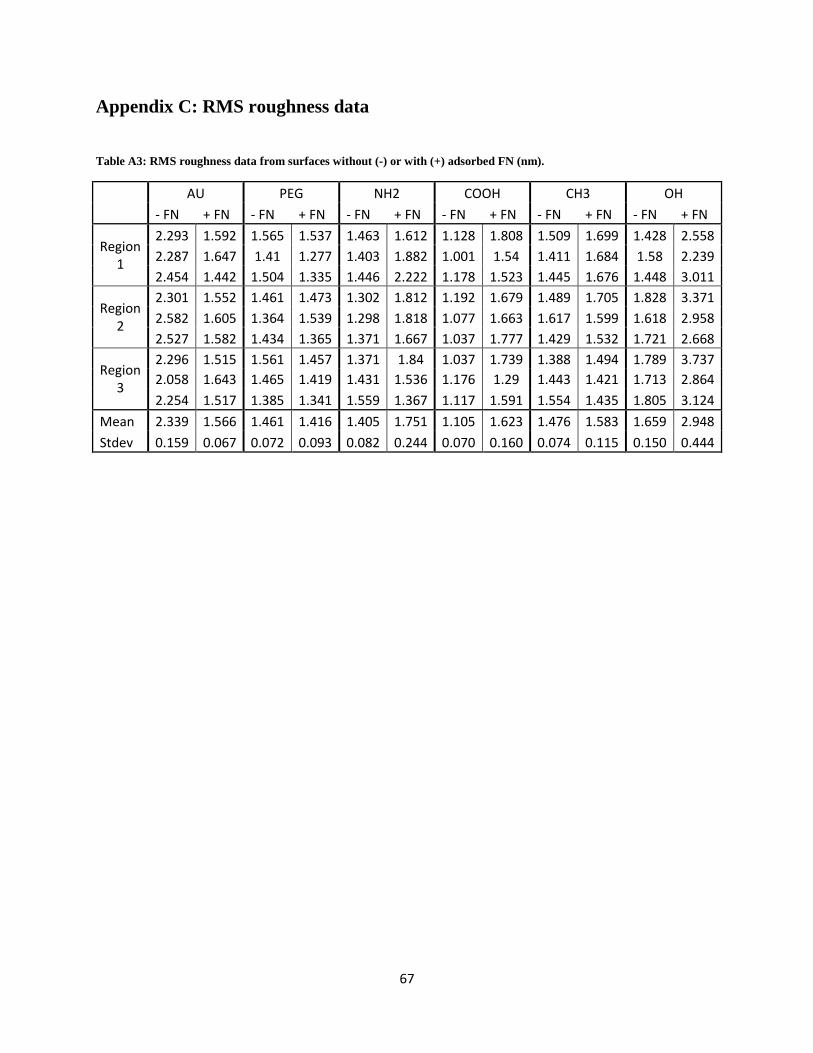
67
Appendix C: RMS roughness data
Table A3: RMS roughness data from surfaces without (-) or with (+) adsorbed FN (nm).
AU PEG NH2 COOH CH3 OH
- FN + FN - FN + FN - FN + FN - FN + FN - FN + FN - FN + FN
Region 1
2.293 1.592 1.565 1.537 1.463 1.612 1.128 1.808 1.509 1.699 1.428 2.558
2.287 1.647 1.41 1.277 1.403 1.882 1.001 1.54 1.411 1.684 1.58 2.239
2.454 1.442 1.504 1.335 1.446 2.222 1.178 1.523 1.445 1.676 1.448 3.011
Region 2
2.301 1.552 1.461 1.473 1.302 1.812 1.192 1.679 1.489 1.705 1.828 3.371
2.582 1.605 1.364 1.539 1.298 1.818 1.077 1.663 1.617 1.599 1.618 2.958
2.527 1.582 1.434 1.365 1.371 1.667 1.037 1.777 1.429 1.532 1.721 2.668
Region 3
2.296 1.515 1.561 1.457 1.371 1.84 1.037 1.739 1.388 1.494 1.789 3.737
2.058 1.643 1.465 1.419 1.431 1.536 1.176 1.29 1.443 1.421 1.713 2.864
2.254 1.517 1.385 1.341 1.559 1.367 1.117 1.591 1.554 1.435 1.805 3.124
Mean 2.339 1.566 1.461 1.416 1.405 1.751 1.105 1.623 1.476 1.583 1.659 2.948
Stdev 0.159 0.067 0.072 0.093 0.082 0.244 0.070 0.160 0.074 0.115 0.150 0.444
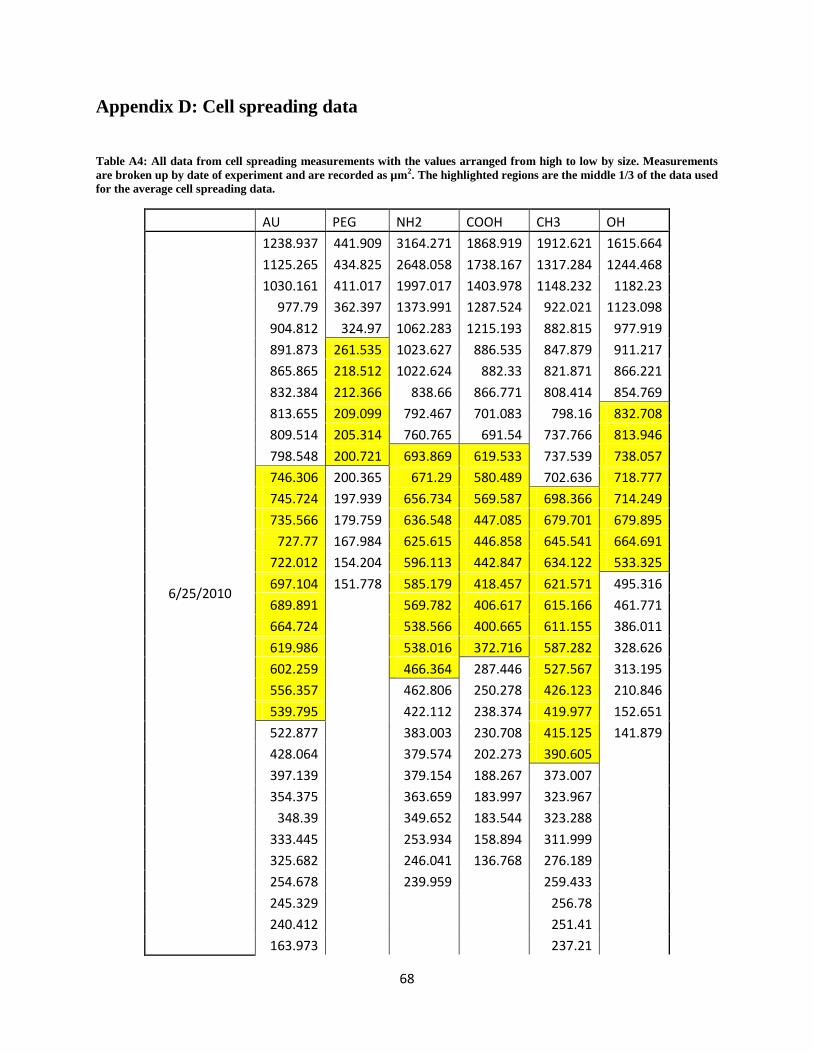
68
Appendix D: Cell spreading data
Table A4: All data from cell spreading measurements with the values arranged from high to low by size. Measurements
are broken up by date of experiment and are recorded as µm2. The highlighted regions are the middle 1/3 of the data used
for the average cell spreading data.
AU PEG NH2 COOH CH3 OH
6/25/2010
1238.937 441.909 3164.271 1868.919 1912.621 1615.664
1125.265 434.825 2648.058 1738.167 1317.284 1244.468
1030.161 411.017 1997.017 1403.978 1148.232 1182.23
977.79 362.397 1373.991 1287.524 922.021 1123.098
904.812 324.97 1062.283 1215.193 882.815 977.919
891.873 261.535 1023.627 886.535 847.879 911.217
865.865 218.512 1022.624 882.33 821.871 866.221
832.384 212.366 838.66 866.771 808.414 854.769
813.655 209.099 792.467 701.083 798.16 832.708
809.514 205.314 760.765 691.54 737.766 813.946
798.548 200.721 693.869 619.533 737.539 738.057
746.306 200.365 671.29 580.489 702.636 718.777
745.724 197.939 656.734 569.587 698.366 714.249
735.566 179.759 636.548 447.085 679.701 679.895
727.77 167.984 625.615 446.858 645.541 664.691
722.012 154.204 596.113 442.847 634.122 533.325
697.104 151.778 585.179 418.457 621.571 495.316
689.891 569.782 406.617 615.166 461.771
664.724 538.566 400.665 611.155 386.011
619.986 538.016 372.716 587.282 328.626
602.259 466.364 287.446 527.567 313.195
556.357 462.806 250.278 426.123 210.846
539.795 422.112 238.374 419.977 152.651
522.877 383.003 230.708 415.125 141.879
428.064 379.574 202.273 390.605
397.139 379.154 188.267 373.007
354.375 363.659 183.997 323.967
348.39 349.652 183.544 323.288
333.445 253.934 158.894 311.999
325.682 246.041 136.768 276.189
254.678 239.959 259.433
245.329 256.78
240.412 251.41
163.973 237.21
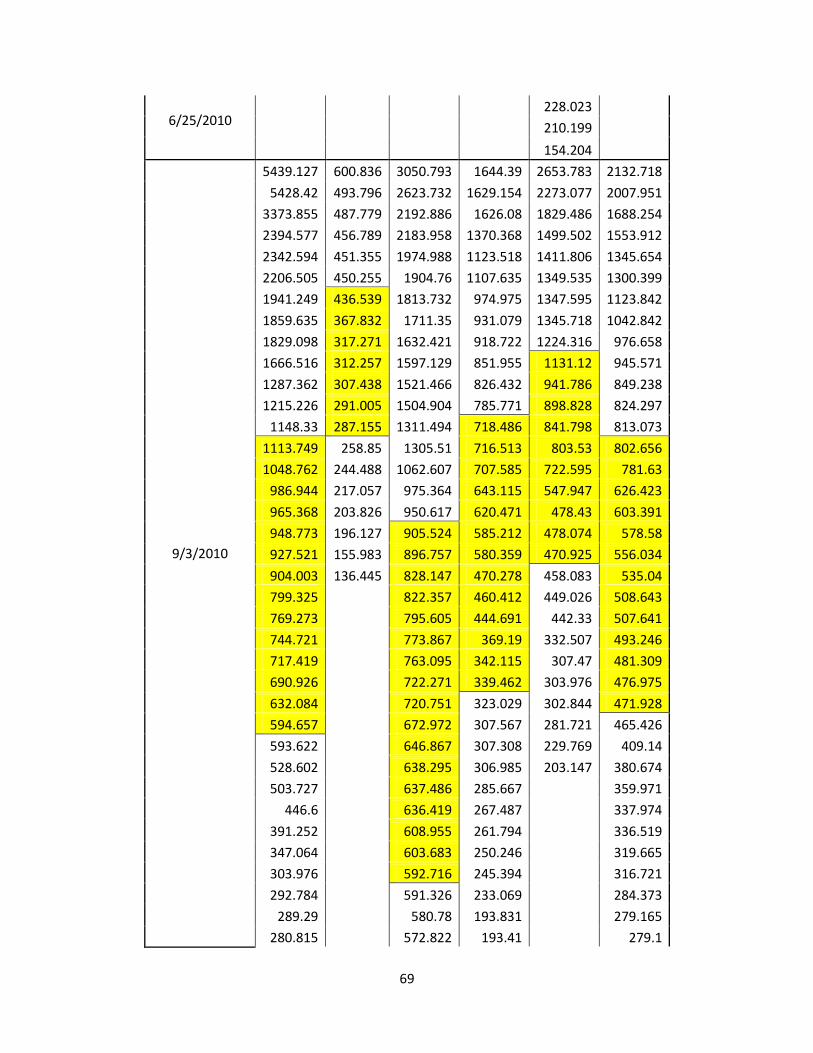
69
228.023
210.199
154.204
9/3/2010
5439.127 600.836 3050.793 1644.39 2653.783 2132.718
5428.42 493.796 2623.732 1629.154 2273.077 2007.951
3373.855 487.779 2192.886 1626.08 1829.486 1688.254
2394.577 456.789 2183.958 1370.368 1499.502 1553.912
2342.594 451.355 1974.988 1123.518 1411.806 1345.654
2206.505 450.255 1904.76 1107.635 1349.535 1300.399
1941.249 436.539 1813.732 974.975 1347.595 1123.842
1859.635 367.832 1711.35 931.079 1345.718 1042.842
1829.098 317.271 1632.421 918.722 1224.316 976.658
1666.516 312.257 1597.129 851.955 1131.12 945.571
1287.362 307.438 1521.466 826.432 941.786 849.238
1215.226 291.005 1504.904 785.771 898.828 824.297
1148.33 287.155 1311.494 718.486 841.798 813.073
1113.749 258.85 1305.51 716.513 803.53 802.656
1048.762 244.488 1062.607 707.585 722.595 781.63
986.944 217.057 975.364 643.115 547.947 626.423
965.368 203.826 950.617 620.471 478.43 603.391
948.773 196.127 905.524 585.212 478.074 578.58
927.521 155.983 896.757 580.359 470.925 556.034
904.003 136.445 828.147 470.278 458.083 535.04
799.325 822.357 460.412 449.026 508.643
769.273 795.605 444.691 442.33 507.641
744.721 773.867 369.19 332.507 493.246
717.419 763.095 342.115 307.47 481.309
690.926 722.271 339.462 303.976 476.975
632.084 720.751 323.029 302.844 471.928
594.657 672.972 307.567 281.721 465.426
593.622 646.867 307.308 229.769 409.14
528.602 638.295 306.985 203.147 380.674
503.727 637.486 285.667 359.971
446.6 636.419 267.487 337.974
391.252 608.955 261.794 336.519
347.064 603.683 250.246 319.665
303.976 592.716 245.394 316.721
292.784 591.326 233.069 284.373
289.29 580.78 193.831 279.165
280.815 572.822 193.41 279.1
6/25/2010
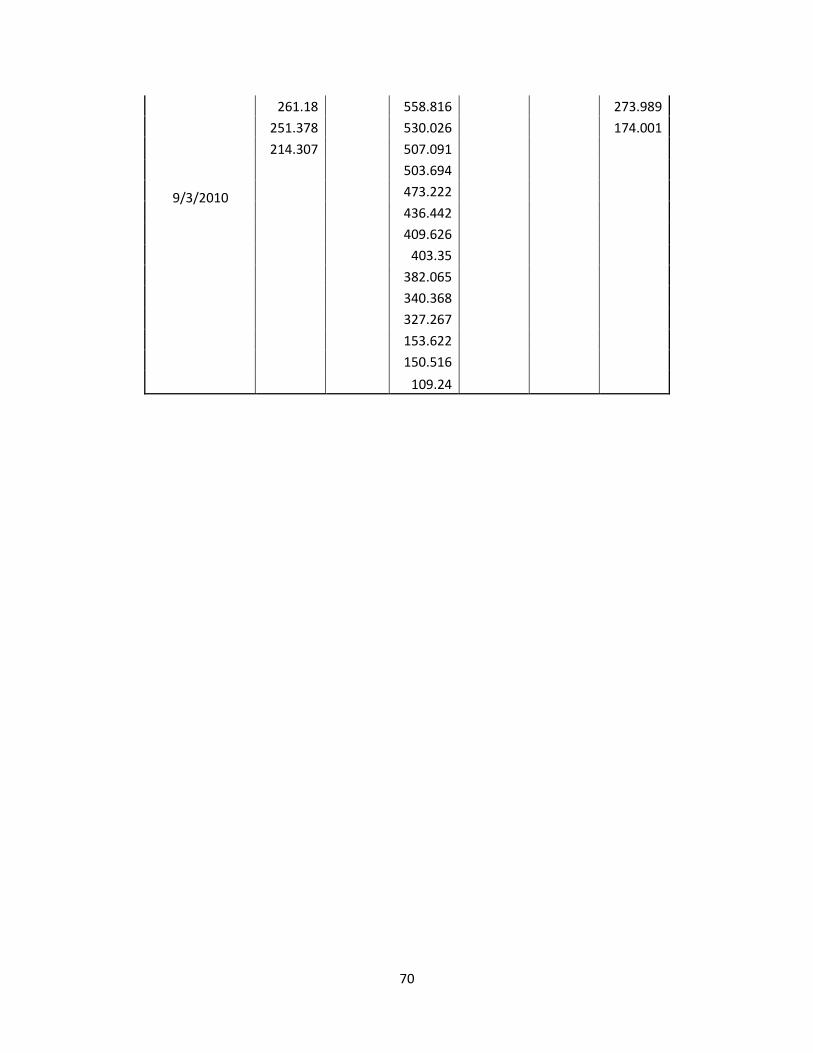
70
261.18 558.816 273.989
251.378 530.026 174.001
214.307 507.091
503.694
473.222
436.442
409.626
403.35
382.065
340.368
327.267
153.622
150.516
109.24
9/3/2010
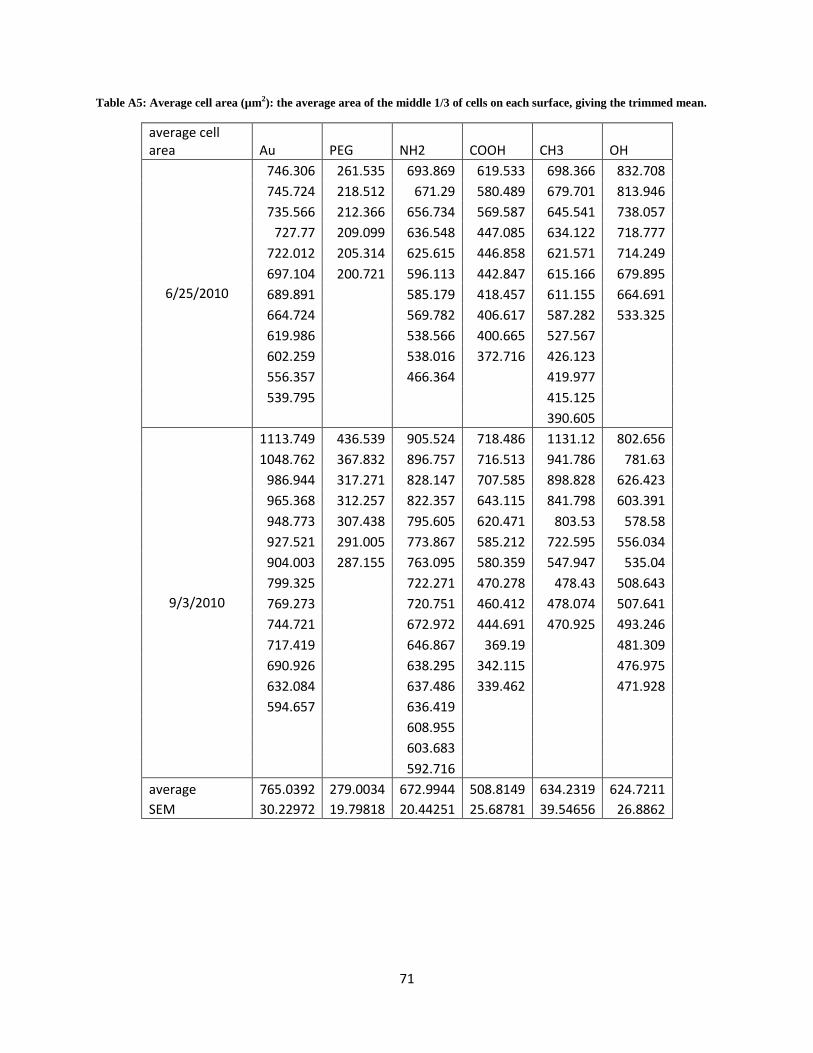
71
Table A5: Average cell area (µm2): the average area of the middle 1/3 of cells on each surface, giving the trimmed mean.
average cell area Au PEG NH2 COOH CH3 OH
6/25/2010
746.306 261.535 693.869 619.533 698.366 832.708
745.724 218.512 671.29 580.489 679.701 813.946
735.566 212.366 656.734 569.587 645.541 738.057
727.77 209.099 636.548 447.085 634.122 718.777
722.012 205.314 625.615 446.858 621.571 714.249
697.104 200.721 596.113 442.847 615.166 679.895
689.891 585.179 418.457 611.155 664.691
664.724 569.782 406.617 587.282 533.325
619.986 538.566 400.665 527.567
602.259 538.016 372.716 426.123
556.357 466.364 419.977
539.795 415.125
390.605
9/3/2010
1113.749 436.539 905.524 718.486 1131.12 802.656
1048.762 367.832 896.757 716.513 941.786 781.63
986.944 317.271 828.147 707.585 898.828 626.423
965.368 312.257 822.357 643.115 841.798 603.391
948.773 307.438 795.605 620.471 803.53 578.58
927.521 291.005 773.867 585.212 722.595 556.034
904.003 287.155 763.095 580.359 547.947 535.04
799.325 722.271 470.278 478.43 508.643
769.273 720.751 460.412 478.074 507.641
744.721 672.972 444.691 470.925 493.246
717.419 646.867 369.19 481.309
690.926 638.295 342.115 476.975
632.084 637.486 339.462 471.928
594.657 636.419
608.955
603.683
592.716
average 765.0392 279.0034 672.9944 508.8149 634.2319 624.7211
SEM 30.22972 19.79818 20.44251 25.68781 39.54656 26.8862
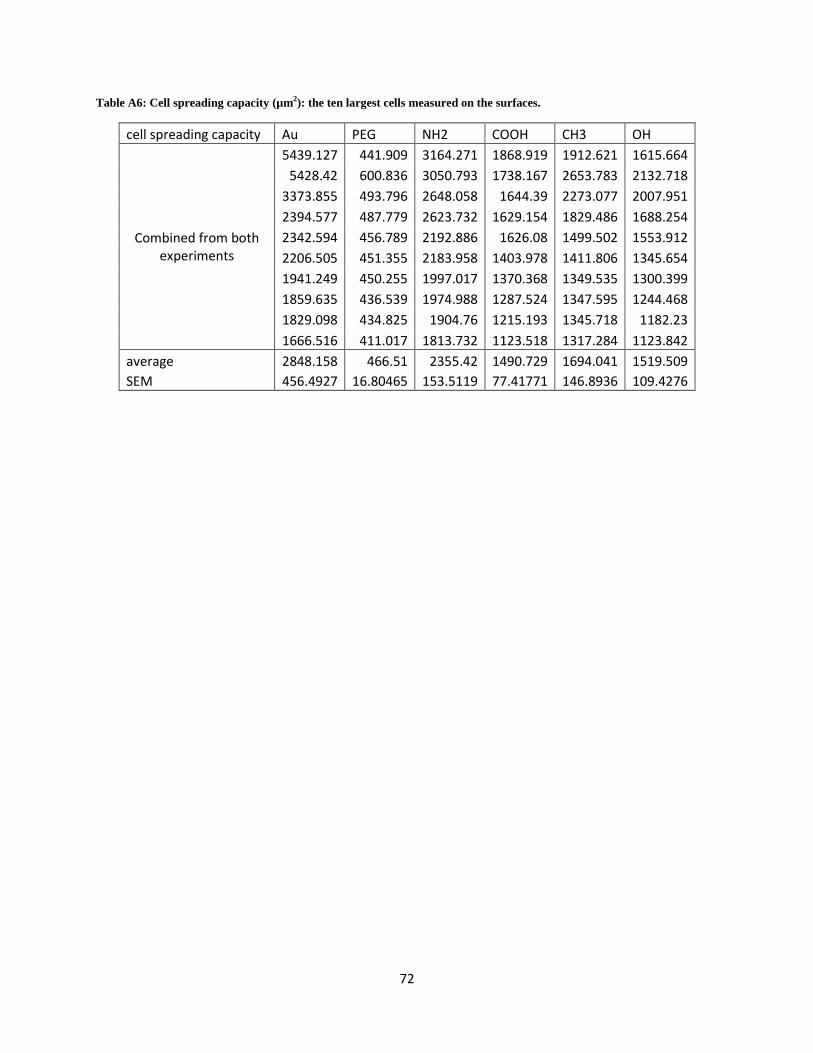
72
Table A6: Cell spreading capacity (µm2): the ten largest cells measured on the surfaces.
cell spreading capacity Au PEG NH2 COOH CH3 OH
Combined from both experiments
5439.127 441.909 3164.271 1868.919 1912.621 1615.664
5428.42 600.836 3050.793 1738.167 2653.783 2132.718
3373.855 493.796 2648.058 1644.39 2273.077 2007.951
2394.577 487.779 2623.732 1629.154 1829.486 1688.254
2342.594 456.789 2192.886 1626.08 1499.502 1553.912
2206.505 451.355 2183.958 1403.978 1411.806 1345.654
1941.249 450.255 1997.017 1370.368 1349.535 1300.399
1859.635 436.539 1974.988 1287.524 1347.595 1244.468
1829.098 434.825 1904.76 1215.193 1345.718 1182.23
1666.516 411.017 1813.732 1123.518 1317.284 1123.842
average 2848.158 466.51 2355.42 1490.729 1694.041 1519.509
SEM 456.4927 16.80465 153.5119 77.41771 146.8936 109.4276
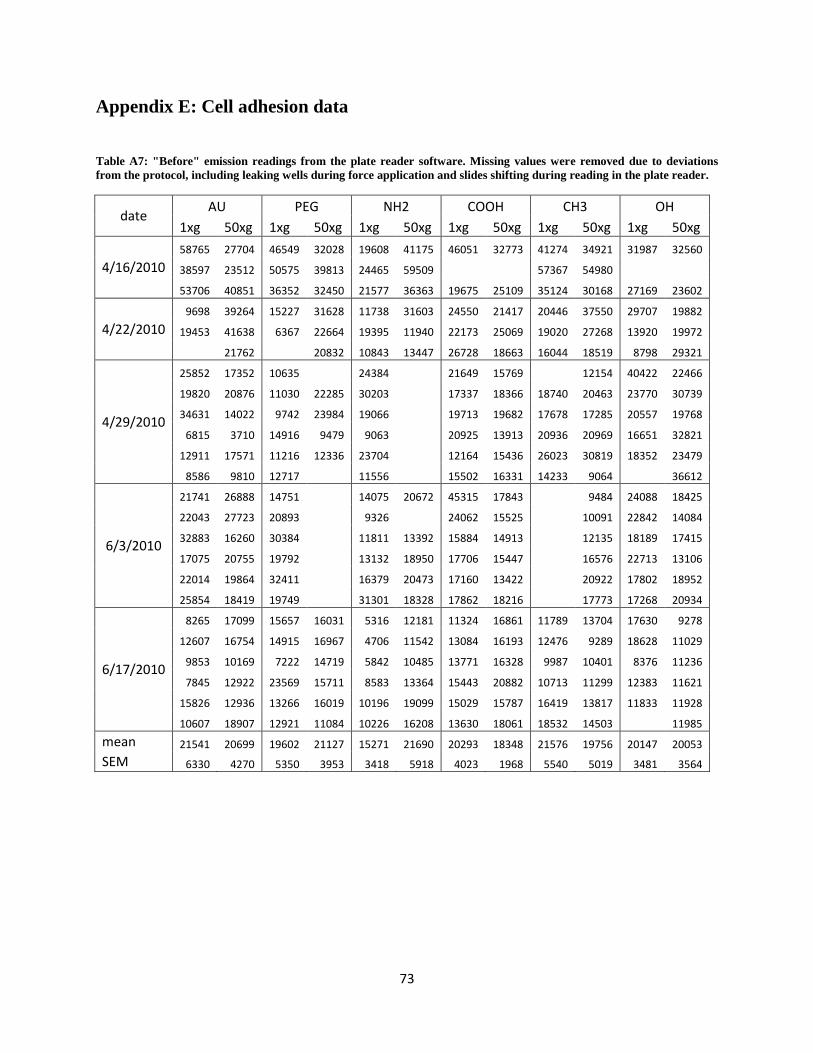
73
Appendix E: Cell adhesion data
Table A7: "Before" emission readings from the plate reader software. Missing values were removed due to deviations
from the protocol, including leaking wells during force application and slides shifting during reading in the plate reader.
date AU PEG NH2 COOH CH3 OH
1xg 50xg 1xg 50xg 1xg 50xg 1xg 50xg 1xg 50xg 1xg 50xg
4/16/2010
58765 27704 46549 32028 19608 41175 46051 32773 41274 34921 31987 32560
38597 23512 50575 39813 24465 59509
57367 54980
53706 40851 36352 32450 21577 36363 19675 25109 35124 30168 27169 23602
4/22/2010
9698 39264 15227 31628 11738 31603 24550 21417 20446 37550 29707 19882
19453 41638 6367 22664 19395 11940 22173 25069 19020 27268 13920 19972
21762 20832 10843 13447 26728 18663 16044 18519 8798 29321
4/29/2010
25852 17352 10635 24384 21649 15769 12154 40422 22466
19820 20876 11030 22285 30203
17337 18366 18740 20463 23770 30739
34631 14022 9742 23984 19066
19713 19682 17678 17285 20557 19768
6815 3710 14916 9479 9063
20925 13913 20936 20969 16651 32821
12911 17571 11216 12336 23704
12164 15436 26023 30819 18352 23479
8586 9810 12717 11556 15502 16331 14233 9064 36612
6/3/2010
21741 26888 14751 14075 20672 45315 17843 9484 24088 18425
22043 27723 20893
9326
24062 15525 10091 22842 14084
32883 16260 30384
11811 13392 15884 14913 12135 18189 17415
17075 20755 19792
13132 18950 17706 15447 16576 22713 13106
22014 19864 32411
16379 20473 17160 13422 20922 17802 18952
25854 18419 19749 31301 18328 17862 18216 17773 17268 20934
6/17/2010
8265 17099 15657 16031 5316 12181 11324 16861 11789 13704 17630 9278
12607 16754 14915 16967 4706 11542 13084 16193 12476 9289 18628 11029
9853 10169 7222 14719 5842 10485 13771 16328 9987 10401 8376 11236
7845 12922 23569 15711 8583 13364 15443 20882 10713 11299 12383 11621
15826 12936 13266 16019 10196 19099 15029 15787 16419 13817 11833 11928
10607 18907 12921 11084 10226 16208 13630 18061 18532 14503 11985
mean 21541 20699 19602 21127 15271 21690 20293 18348 21576 19756 20147 20053
SEM 6330 4270 5350 3953 3418 5918 4023 1968 5540 5019 3481 3564
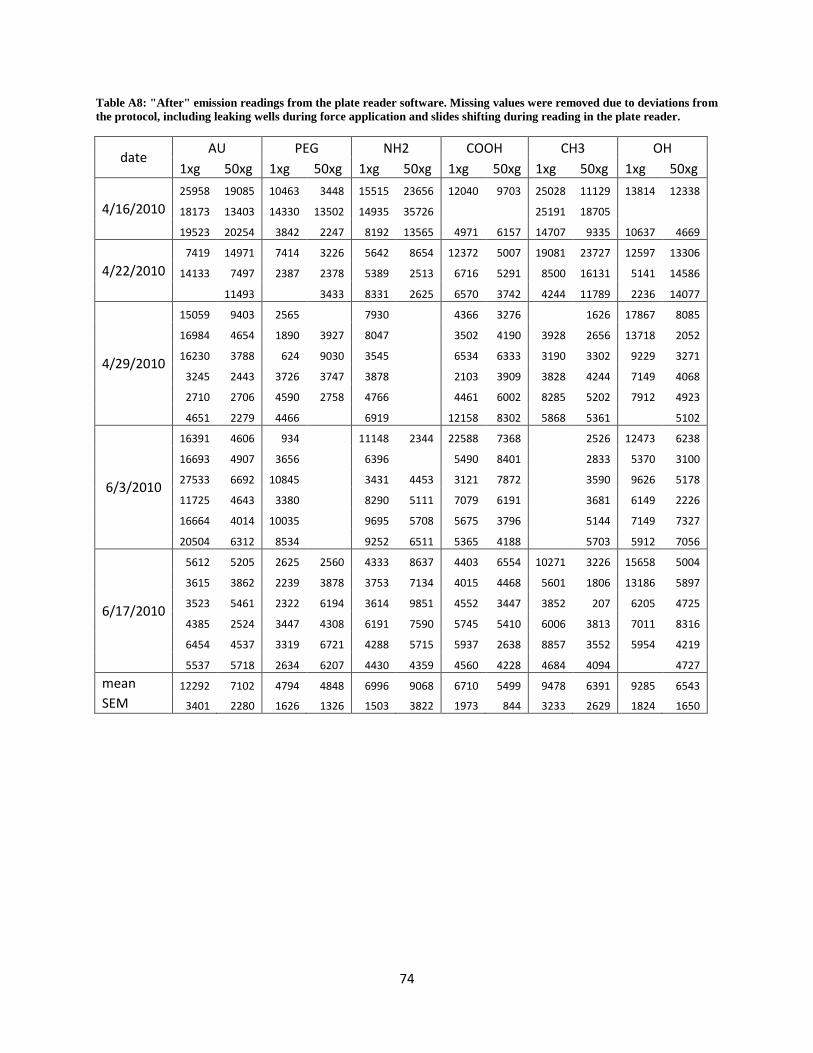
74
Table A8: "After" emission readings from the plate reader software. Missing values were removed due to deviations from
the protocol, including leaking wells during force application and slides shifting during reading in the plate reader.
date AU PEG NH2 COOH CH3 OH
1xg 50xg 1xg 50xg 1xg 50xg 1xg 50xg 1xg 50xg 1xg 50xg
4/16/2010
25958 19085 10463 3448 15515 23656 12040 9703 25028 11129 13814 12338
18173 13403 14330 13502 14935 35726
25191 18705
19523 20254 3842 2247 8192 13565 4971 6157 14707 9335 10637 4669
4/22/2010
7419 14971 7414 3226 5642 8654 12372 5007 19081 23727 12597 13306
14133 7497 2387 2378 5389 2513 6716 5291 8500 16131 5141 14586
11493 3433 8331 2625 6570 3742 4244 11789 2236 14077
4/29/2010
15059 9403 2565 7930 4366 3276 1626 17867 8085
16984 4654 1890 3927 8047 3502 4190 3928 2656 13718 2052
16230 3788 624 9030 3545 6534 6333 3190 3302 9229 3271
3245 2443 3726 3747 3878 2103 3909 3828 4244 7149 4068
2710 2706 4590 2758 4766 4461 6002 8285 5202 7912 4923
4651 2279 4466 6919 12158 8302 5868 5361 5102
6/3/2010
16391 4606 934 11148 2344 22588 7368 2526 12473 6238
16693 4907 3656 6396 5490 8401
2833 5370 3100
27533 6692 10845 3431 4453 3121 7872
3590 9626 5178
11725 4643 3380 8290 5111 7079 6191
3681 6149 2226
16664 4014 10035 9695 5708 5675 3796
5144 7149 7327
20504 6312 8534 9252 6511 5365 4188 5703 5912 7056
6/17/2010
5612 5205 2625 2560 4333 8637 4403 6554 10271 3226 15658 5004
3615 3862 2239 3878 3753 7134 4015 4468 5601 1806 13186 5897
3523 5461 2322 6194 3614 9851 4552 3447 3852 207 6205 4725
4385 2524 3447 4308 6191 7590 5745 5410 6006 3813 7011 8316
6454 4537 3319 6721 4288 5715 5937 2638 8857 3552 5954 4219
5537 5718 2634 6207 4430 4359 4560 4228 4684 4094 4727
mean 12292 7102 4794 4848 6996 9068 6710 5499 9478 6391 9285 6543
SEM 3401 2280 1626 1326 1503 3822 1973 844 3233 2629 1824 1650
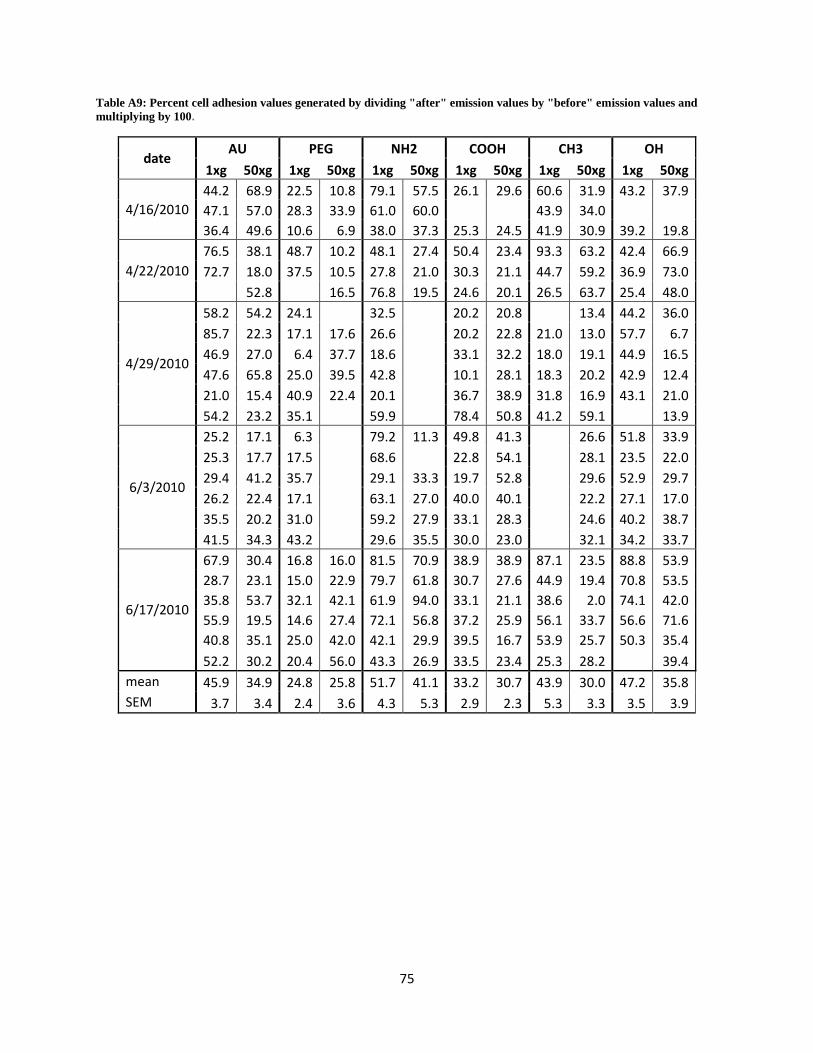
75
Table A9: Percent cell adhesion values generated by dividing "after" emission values by "before" emission values and
multiplying by 100.
date AU PEG NH2 COOH CH3 OH
1xg 50xg 1xg 50xg 1xg 50xg 1xg 50xg 1xg 50xg 1xg 50xg
4/16/2010
44.2 68.9 22.5 10.8 79.1 57.5 26.1 29.6 60.6 31.9 43.2 37.9
47.1 57.0 28.3 33.9 61.0 60.0 43.9 34.0
36.4 49.6 10.6 6.9 38.0 37.3 25.3 24.5 41.9 30.9 39.2 19.8
4/22/2010
76.5 38.1 48.7 10.2 48.1 27.4 50.4 23.4 93.3 63.2 42.4 66.9
72.7 18.0 37.5 10.5 27.8 21.0 30.3 21.1 44.7 59.2 36.9 73.0
52.8 16.5 76.8 19.5 24.6 20.1 26.5 63.7 25.4 48.0
4/29/2010
58.2 54.2 24.1 32.5 20.2 20.8 13.4 44.2 36.0
85.7 22.3 17.1 17.6 26.6 20.2 22.8 21.0 13.0 57.7 6.7
46.9 27.0 6.4 37.7 18.6 33.1 32.2 18.0 19.1 44.9 16.5
47.6 65.8 25.0 39.5 42.8 10.1 28.1 18.3 20.2 42.9 12.4
21.0 15.4 40.9 22.4 20.1 36.7 38.9 31.8 16.9 43.1 21.0
54.2 23.2 35.1 59.9 78.4 50.8 41.2 59.1 13.9
6/3/2010
25.2 17.1 6.3 79.2 11.3 49.8 41.3 26.6 51.8 33.9
25.3 17.7 17.5 68.6 22.8 54.1 28.1 23.5 22.0
29.4 41.2 35.7 29.1 33.3 19.7 52.8 29.6 52.9 29.7
26.2 22.4 17.1 63.1 27.0 40.0 40.1 22.2 27.1 17.0
35.5 20.2 31.0 59.2 27.9 33.1 28.3 24.6 40.2 38.7
41.5 34.3 43.2 29.6 35.5 30.0 23.0 32.1 34.2 33.7
6/17/2010
67.9 30.4 16.8 16.0 81.5 70.9 38.9 38.9 87.1 23.5 88.8 53.9
28.7 23.1 15.0 22.9 79.7 61.8 30.7 27.6 44.9 19.4 70.8 53.5
35.8 53.7 32.1 42.1 61.9 94.0 33.1 21.1 38.6 2.0 74.1 42.0
55.9 19.5 14.6 27.4 72.1 56.8 37.2 25.9 56.1 33.7 56.6 71.6
40.8 35.1 25.0 42.0 42.1 29.9 39.5 16.7 53.9 25.7 50.3 35.4
52.2 30.2 20.4 56.0 43.3 26.9 33.5 23.4 25.3 28.2 39.4
mean 45.9 34.9 24.8 25.8 51.7 41.1 33.2 30.7 43.9 30.0 47.2 35.8
SEM 3.7 3.4 2.4 3.6 4.3 5.3 2.9 2.3 5.3 3.3 3.5 3.9
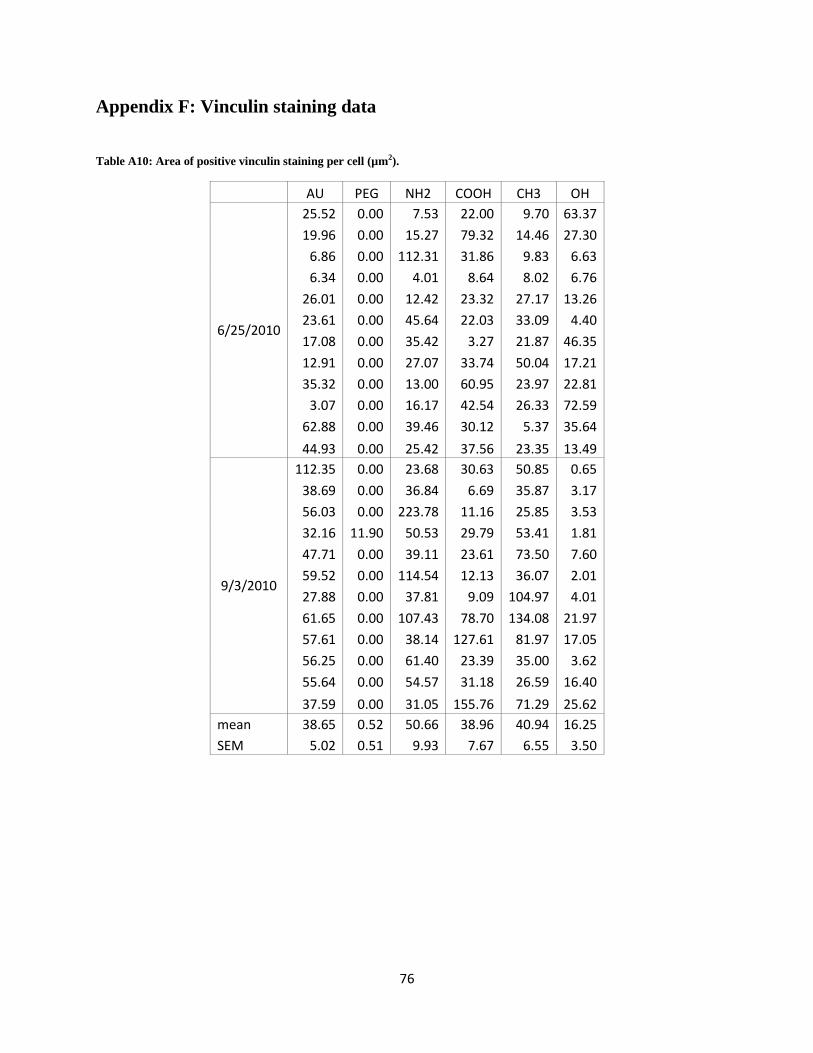
76
Appendix F: Vinculin staining data
Table A10: Area of positive vinculin staining per cell (µm2).
AU PEG NH2 COOH CH3 OH
6/25/2010
25.52 0.00 7.53 22.00 9.70 63.37
19.96 0.00 15.27 79.32 14.46 27.30
6.86 0.00 112.31 31.86 9.83 6.63
6.34 0.00 4.01 8.64 8.02 6.76
26.01 0.00 12.42 23.32 27.17 13.26
23.61 0.00 45.64 22.03 33.09 4.40
17.08 0.00 35.42 3.27 21.87 46.35
12.91 0.00 27.07 33.74 50.04 17.21
35.32 0.00 13.00 60.95 23.97 22.81
3.07 0.00 16.17 42.54 26.33 72.59
62.88 0.00 39.46 30.12 5.37 35.64
44.93 0.00 25.42 37.56 23.35 13.49
9/3/2010
112.35 0.00 23.68 30.63 50.85 0.65
38.69 0.00 36.84 6.69 35.87 3.17
56.03 0.00 223.78 11.16 25.85 3.53
32.16 11.90 50.53 29.79 53.41 1.81
47.71 0.00 39.11 23.61 73.50 7.60
59.52 0.00 114.54 12.13 36.07 2.01
27.88 0.00 37.81 9.09 104.97 4.01
61.65 0.00 107.43 78.70 134.08 21.97
57.61 0.00 38.14 127.61 81.97 17.05
56.25 0.00 61.40 23.39 35.00 3.62
55.64 0.00 54.57 31.18 26.59 16.40
37.59 0.00 31.05 155.76 71.29 25.62
mean 38.65 0.52 50.66 38.96 40.94 16.25
SEM 5.02 0.51 9.93 7.67 6.55 3.50
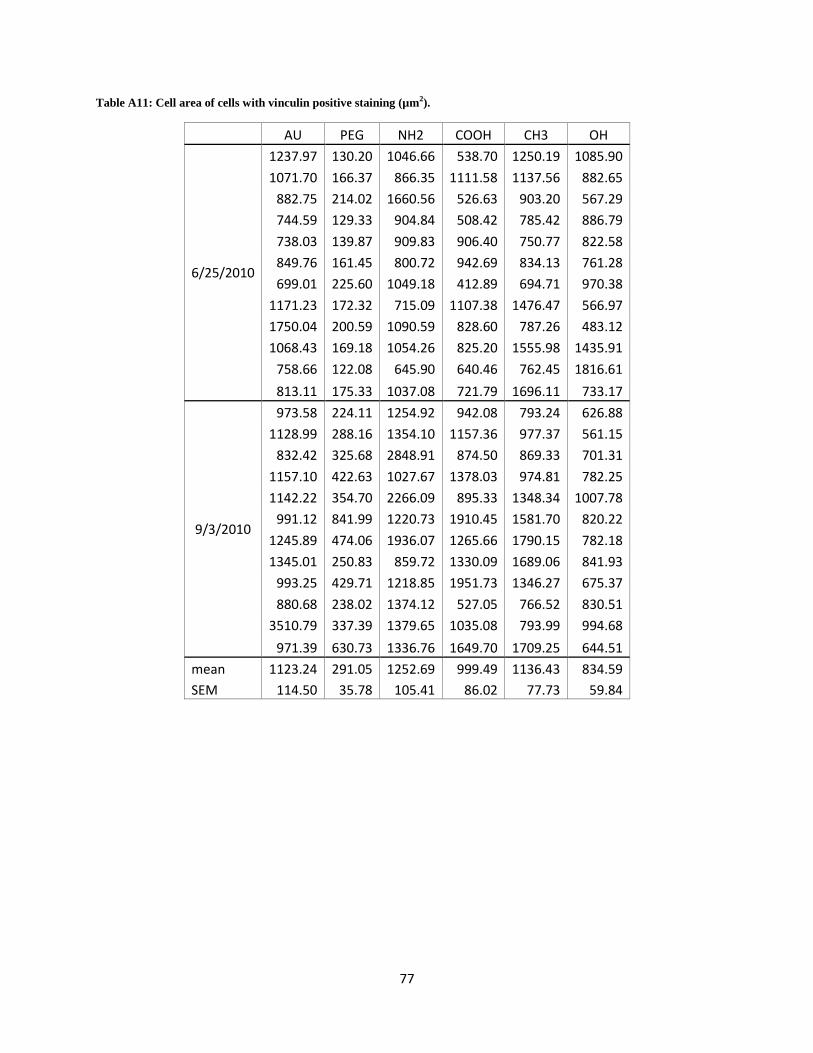
77
Table A11: Cell area of cells with vinculin positive staining (µm2).
AU PEG NH2 COOH CH3 OH
6/25/2010
1237.97 130.20 1046.66 538.70 1250.19 1085.90
1071.70 166.37 866.35 1111.58 1137.56 882.65
882.75 214.02 1660.56 526.63 903.20 567.29
744.59 129.33 904.84 508.42 785.42 886.79
738.03 139.87 909.83 906.40 750.77 822.58
849.76 161.45 800.72 942.69 834.13 761.28
699.01 225.60 1049.18 412.89 694.71 970.38
1171.23 172.32 715.09 1107.38 1476.47 566.97
1750.04 200.59 1090.59 828.60 787.26 483.12
1068.43 169.18 1054.26 825.20 1555.98 1435.91
758.66 122.08 645.90 640.46 762.45 1816.61
813.11 175.33 1037.08 721.79 1696.11 733.17
9/3/2010
973.58 224.11 1254.92 942.08 793.24 626.88
1128.99 288.16 1354.10 1157.36 977.37 561.15
832.42 325.68 2848.91 874.50 869.33 701.31
1157.10 422.63 1027.67 1378.03 974.81 782.25
1142.22 354.70 2266.09 895.33 1348.34 1007.78
991.12 841.99 1220.73 1910.45 1581.70 820.22
1245.89 474.06 1936.07 1265.66 1790.15 782.18
1345.01 250.83 859.72 1330.09 1689.06 841.93
993.25 429.71 1218.85 1951.73 1346.27 675.37
880.68 238.02 1374.12 527.05 766.52 830.51
3510.79 337.39 1379.65 1035.08 793.99 994.68
971.39 630.73 1336.76 1649.70 1709.25 644.51
mean 1123.24 291.05 1252.69 999.49 1136.43 834.59
SEM 114.50 35.78 105.41 86.02 77.73 59.84
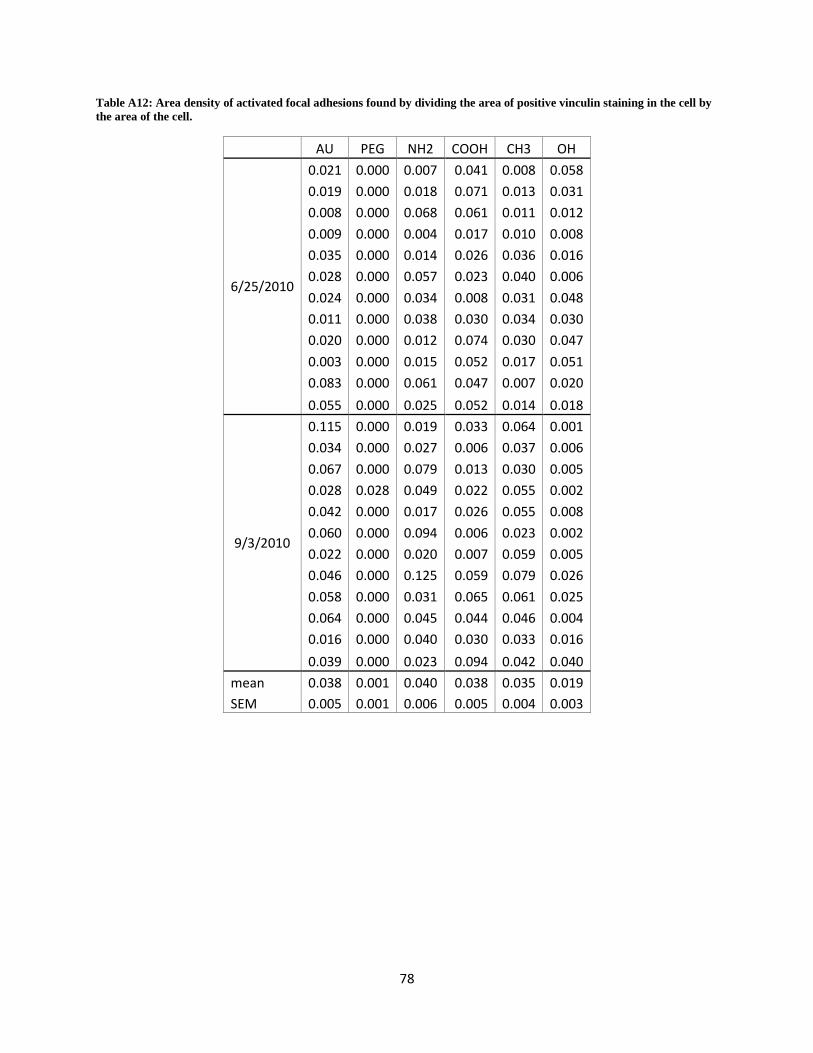
78
Table A12: Area density of activated focal adhesions found by dividing the area of positive vinculin staining in the cell by
the area of the cell.
AU PEG NH2 COOH CH3 OH
6/25/2010
0.021 0.000 0.007 0.041 0.008 0.058
0.019 0.000 0.018 0.071 0.013 0.031
0.008 0.000 0.068 0.061 0.011 0.012
0.009 0.000 0.004 0.017 0.010 0.008
0.035 0.000 0.014 0.026 0.036 0.016
0.028 0.000 0.057 0.023 0.040 0.006
0.024 0.000 0.034 0.008 0.031 0.048
0.011 0.000 0.038 0.030 0.034 0.030
0.020 0.000 0.012 0.074 0.030 0.047
0.003 0.000 0.015 0.052 0.017 0.051
0.083 0.000 0.061 0.047 0.007 0.020
0.055 0.000 0.025 0.052 0.014 0.018
9/3/2010
0.115 0.000 0.019 0.033 0.064 0.001
0.034 0.000 0.027 0.006 0.037 0.006
0.067 0.000 0.079 0.013 0.030 0.005
0.028 0.028 0.049 0.022 0.055 0.002
0.042 0.000 0.017 0.026 0.055 0.008
0.060 0.000 0.094 0.006 0.023 0.002
0.022 0.000 0.020 0.007 0.059 0.005
0.046 0.000 0.125 0.059 0.079 0.026
0.058 0.000 0.031 0.065 0.061 0.025
0.064 0.000 0.045 0.044 0.046 0.004
0.016 0.000 0.040 0.030 0.033 0.016
0.039 0.000 0.023 0.094 0.042 0.040
mean 0.038 0.001 0.040 0.038 0.035 0.019
SEM 0.005 0.001 0.006 0.005 0.004 0.003