designing and managing for a reliability of zero! - nasa · 1 designing and managing for a...
TRANSCRIPT

1
Designing and Managingfor a
Reliability of Zero!
Bill Purdy & Mike Hurley
2
Topics
• Two Slides on the Naval Research Lab– Provide some Sense of Where We are Coming From
• The Goal
• A Little Philosophy
• What the Reliability Prediction Is and Is Not
• Comparing Predictions to Spacecraft Data
• Considerations for True, On-Orbit Reliability
• Going Forward
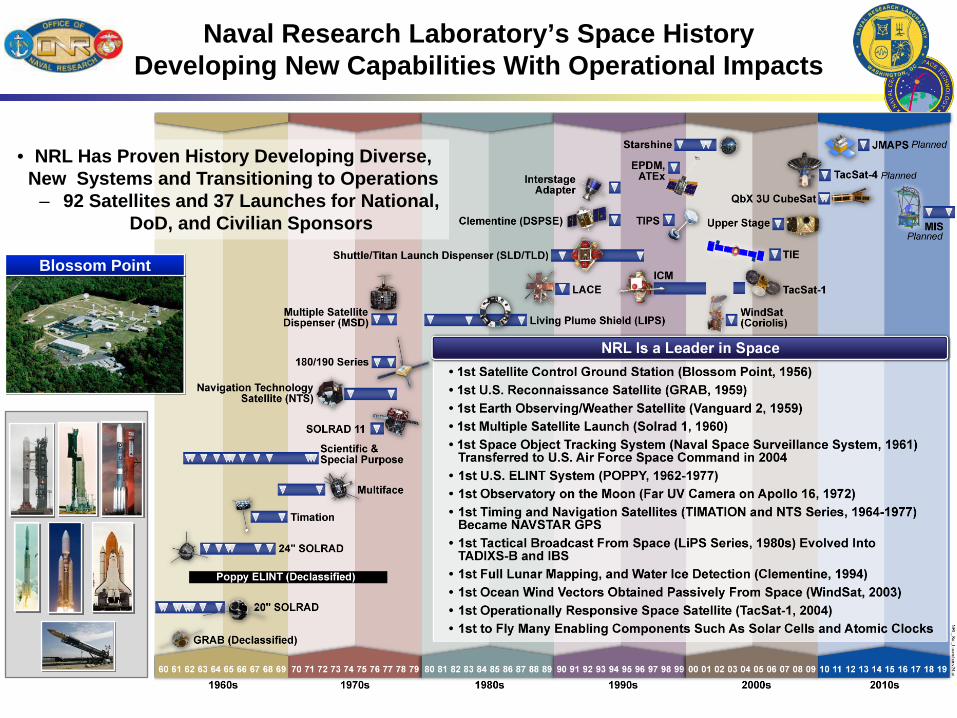
Naval Research Laboratory’s Space History Developing New Capabilities With Operational Impacts
• NRL Has Proven History Developing Diverse, New Systems and Transitioning to Operations
– 92 Satellites and 37 Launches for National, DoD, and Civilian Sponsors
Blossom Point
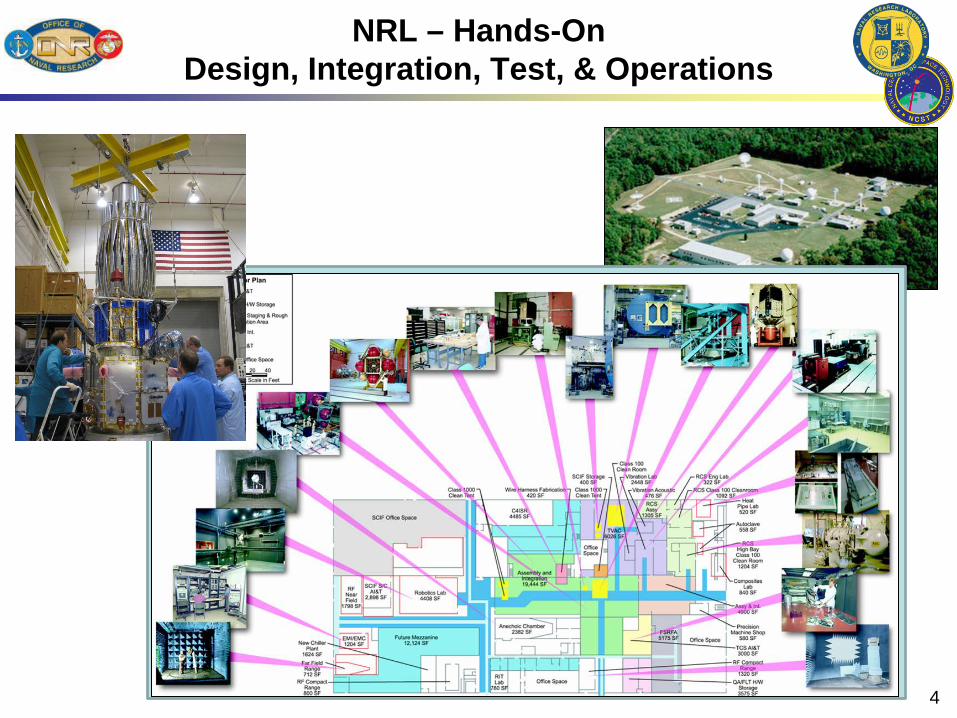
NRL – Hands-OnDesign, Integration, Test, & Operations
4
The Goal
• To provoke the reader to reevaluate their thoughts on reliability.
• Ultimately, this paper strives to advance the industry-wide understanding necessary to better achieve reliable, available space systems for users.
A Little Philosophy
• The space industry’s philosophy and management understanding of reliability may be one of the most important drivers in space programs today. – Often misunderstood and misapplied on space systems
• “Reliability” is heavily influenced by the perspective of the space system program office and developers.– Rarely from the perspective of the end users– Requirement is even “met” before launch
• Ironically, efforts to achieve high reliability often prove counterproductive to schedule and cost, which are essential elements of reliability, especially from a user’s perspective.
• On-orbit reliability for users is what ultimately counts.
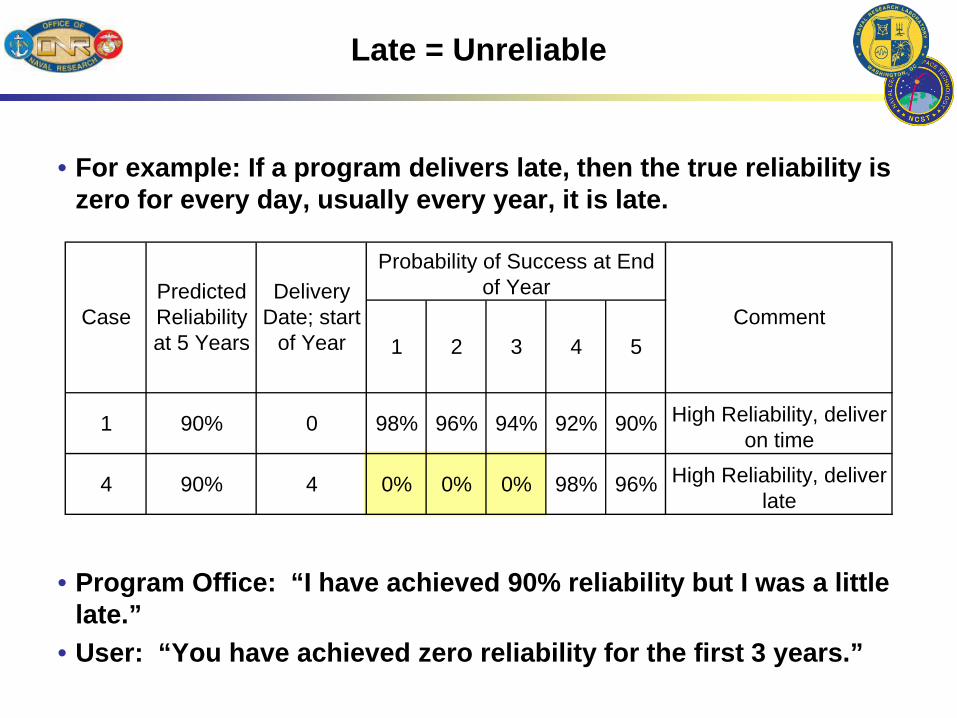
• For example: If a program delivers late, then the true reliability is zero for every day, usually every year, it is late.
• Program Office: “I have achieved 90% reliability but I was a little late.”
• User: “You have achieved zero reliability for the first 3 years.”
Late = Unreliable
1 2 3 4 5
1 90% 0 98% 96% 94% 92% 90% High Reliability, deliver on time
4 90% 4 0% 0% 0% 98% 96% High Reliability, deliver late
CommentCasePredicted Reliability at 5 Years
Delivery Date; start
of Year
Probability of Success at End of Year
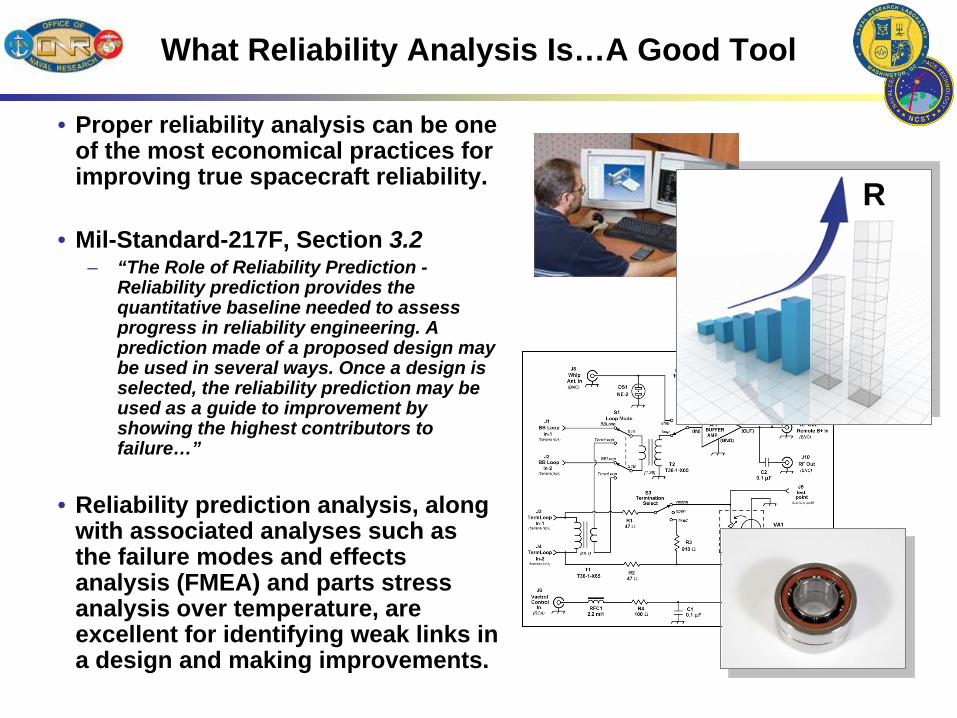
What Reliability Analysis Is…A Good Tool
• Proper reliability analysis can be one of the most economical practices for improving true spacecraft reliability.
• Mil-Standard-217F, Section 3.2 – “The Role of Reliability Prediction -
Reliability prediction provides the quantitative baseline needed to assess progress in reliability engineering. A prediction made of a proposed design may be used in several ways. Once a design is selected, the reliability prediction may be used as a guide to improvement by showing the highest contributors to failure…”
• Reliability prediction analysis, along with associated analyses such as the failure modes and effects analysis (FMEA) and parts stress analysis over temperature, are excellent for identifying weak links in a design and making improvements.
R

What the Reliability Analysis Prediction Does and Does NOT Include
Failure Modes Considered in Reliability Prediction
Failure Modes NOT Considered in Reliability Prediction
• Electronic part failure• Solder joint failure• Connector / pin failure• Mechanical moving elements
e.g. bearing failure
• Design failure• Software failure• Operator error• Proper build, assembly & workmanship• Late launch (schedule impacts)• Insufficient funds
Reliability AnalysisDoes NOT Predict On-Orbit Performance (1 of 4)
• Reliability analysis is fundamentally misapplied as a predictor of spacecraft success on orbit.
• Both MIL-STD-217F and on-orbit data confirm this point.
• Mil-Standard-217F, Section 3.3– “…Hence, a reliability prediction should never be
assumed to represent the expected field reliability as measured by the user … note that none of the applications discussed above require the predicted reliability to match the field measurement.”
• Therefore, the spacecraft community must avoid this tendency for misuse which can lead to bad decisions.
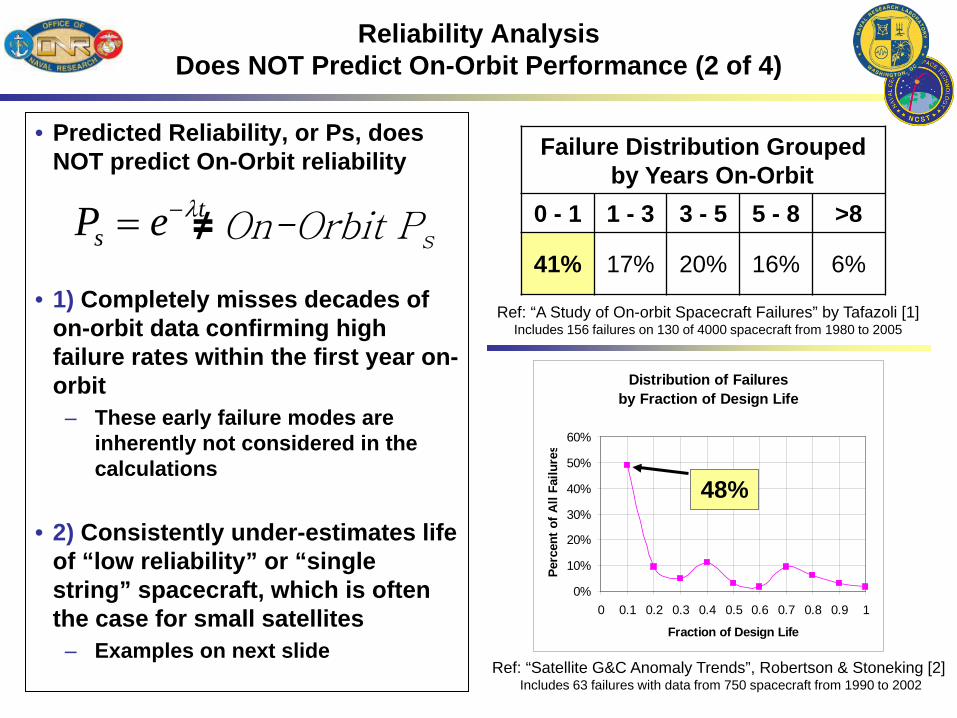
Distribution of Failures by Fraction of Design Life
0%
10%
20%
30%
40%
50%
60%
0 0.1 0.2 0.3 0.4 0.5 0.6 0.7 0.8 0.9 1
Fraction of Design Life
Perc
ent o
f All
Failu
res
Reliability AnalysisDoes NOT Predict On-Orbit Performance (2 of 4)
• Predicted Reliability, or Ps, does NOT predict On-Orbit reliability
• 1) Completely misses decades of on-orbit data confirming high failure rates within the first year on-orbit
– These early failure modes are inherently not considered in the calculations
• 2) Consistently under-estimates life of “low reliability” or “single string” spacecraft, which is often the case for small satellites
– Examples on next slide
Failure Distribution Grouped by Years On-Orbit
0 - 1 1 - 3 3 - 5 5 - 8 >8
41% 17% 20% 16% 6%
Ref: “A Study of On-orbit Spacecraft Failures” by Tafazoli [1]Includes 156 failures on 130 of 4000 spacecraft from 1980 to 2005
Ref: “Satellite G&C Anomaly Trends”, Robertson & Stoneking [2] Includes 63 failures with data from 750 spacecraft from 1990 to 2002
ts eP λ−=
48%
≠ On-Orbit Ps
Reliability AnalysisDoes NOT Predict On-Obit Performance (3 of 4)
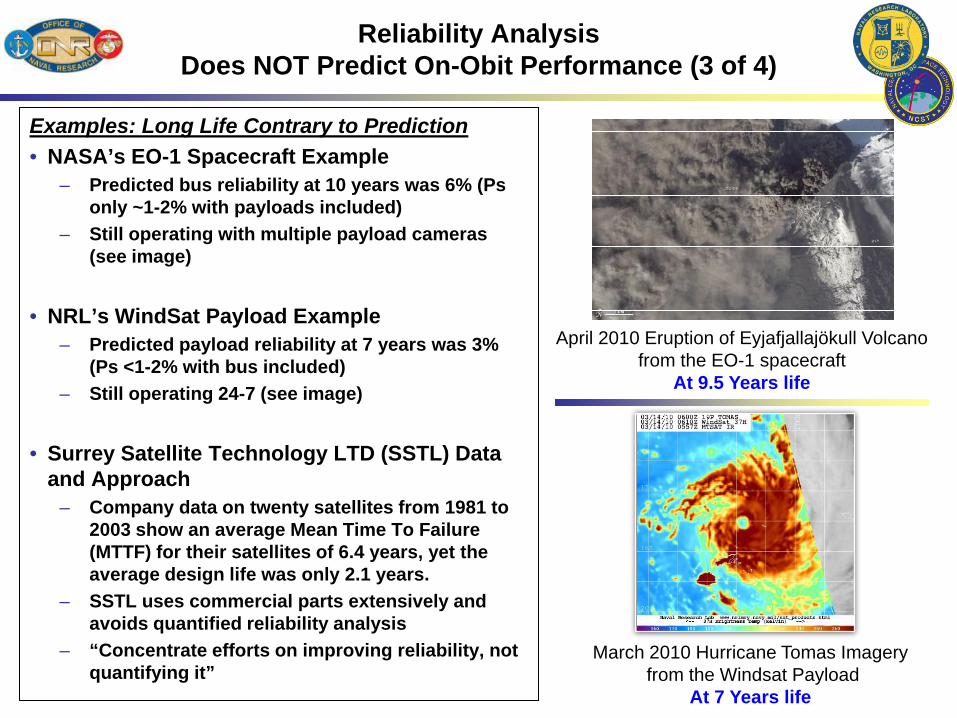
Examples: Long Life Contrary to Prediction• NASA’s EO-1 Spacecraft Example
– Predicted bus reliability at 10 years was 6% (Ps only ~1-2% with payloads included)
– Still operating with multiple payload cameras (see image)
• NRL’s WindSat Payload Example– Predicted payload reliability at 7 years was 3%
(Ps <1-2% with bus included)– Still operating 24-7 (see image)
• Surrey Satellite Technology LTD (SSTL) Data and Approach
– Company data on twenty satellites from 1981 to 2003 show an average Mean Time To Failure (MTTF) for their satellites of 6.4 years, yet the average design life was only 2.1 years.
– SSTL uses commercial parts extensively and avoids quantified reliability analysis
– “Concentrate efforts on improving reliability, not quantifying it”
April 2010 Eruption of Eyjafjallajökull Volcanofrom the EO-1 spacecraft
At 9.5 Years life
March 2010 Hurricane Tomas Imageryfrom the Windsat Payload
At 7 Years life

Reliability AnalysisDoes NOT Predict On-Obit Performance (4 of 4)
Examples: Short Life Contrary to Prediction• High Reliability Satellite Examples
– Typical Ps>95% at 5yrs & Ps>90% at 10yrs– Over 24 high reliability satellites had failures during 1999-2003, most with lives
shortened to <~ 5 years after launch [3]• Galaxy 3R,4,7,11, DirecTV-1&3, PAS-4, AMSC-1, MSAT-1, TDRSII-F1 & F2, Anik F1,
LandSat-7, Adeos-2, XM Rock, XM Roll, etc.
• Absolutely impossible if Calculated R = On-orbit Ps! … 6E-30% chance
REF: “Satellites & Launches Trend Down,” Aerospace America, January 2004, Marco Cáceres, Teal Group, http://www.aiaa.org/aerospace/images/articleimages/pdf/insightsjanuary04.pdf
One Reason Why R is Sometimes Misapplied
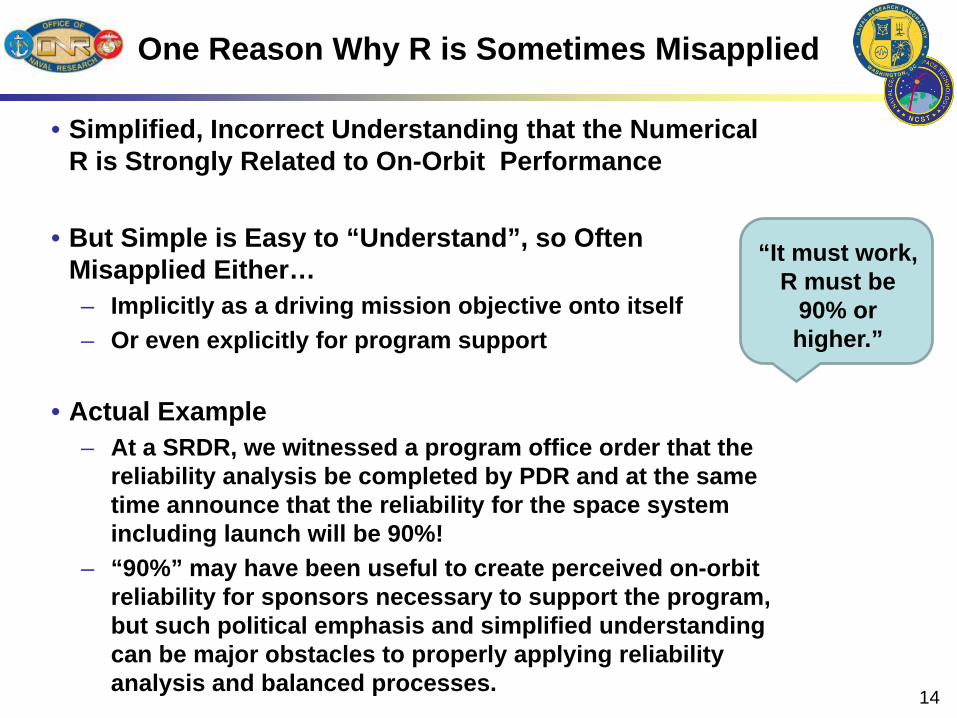
• Simplified, Incorrect Understanding that the Numerical R is Strongly Related to On-Orbit Performance
• But Simple is Easy to “Understand”, so Often Misapplied Either…– Implicitly as a driving mission objective onto itself – Or even explicitly for program support
• Actual Example– At a SRDR, we witnessed a program office order that the
reliability analysis be completed by PDR and at the same time announce that the reliability for the space system including launch will be 90%!
– “90%” may have been useful to create perceived on-orbit reliability for sponsors necessary to support the program, but such political emphasis and simplified understanding can be major obstacles to properly applying reliability analysis and balanced processes.
14
“It must work, R must be
90% or higher.”
Failure Modes
Practice to Address Failure Mode
Meets Mission
Performance
Survives Environments
- Stress & Thermal
Avoidance of parts failure,
radiation, & wear out
Built as Designed
Meets Budget
Meets Schedule
Operator Error
Software Failure
Good Design
++ strong benefit
++ strong benefit
+ weak benefit via simplicity NA
- moderately higher cost
++ strong benefit via simplicity
+ weak benefit via simplicity
++ strong benefit
Good Testing
++ strong benefit
++ strong benefit NA
++ strong benefit
- moderately higher cost
- moderately
longer schedule
++ if test like
you fly
++ strong benefit
Flexibility & Margins NA
++ ability to
survive after component
failures
+ margins
enable work around for some part
failures NA
- moderately higher cost
++ strong benefit
++ more likely can recover
from op errors NA
Redundancy NA
++ ability to
survive after component
failures
++ strong benefit NA
- - high cost of
parts & complexity
- increased build and
test schedule NA NA
Use of Mass Production Components if Available NA
+ part
capabilities known in advance
++ measured reliability
data exists & learning
curve complete
+ weak benefit
++ production efficiency
++ production
efficiency or truly off the
shelf
+ ops of
component often well
understood
depends on specific
component type
Reliability Analysis
+ circuit
improvements
+ parts thermal
stress analysis
++ strong benefit NA
- or -- because of cost of Hi-
REL parts if chosen
- or -- because of lead time of Hi-REL parts
if chosen NA NA
Rigorous Manufacturing & QA Controls NA NA
++ strong benefit
++ strong benefit
- or -- pending
level chosen
- moderately
longer schedule
+ QA & config
control of ops
procedures
++ strong benefit through
software QA
Mission Simulation & Training
++ "flying"
scenarios before launch, increases on-
orbit availability NA NA NA
- cost for mission
simulator & training
+ often
enables parallel testing
++ strong benefit
++ wring out errors &
inefficiencies in both
ground & flight SW
Constellation design (multiple S/C) or launch on demand replacement NA NA NA NA
- or -- cost pending specifics of the mission
++ strong benefit
++ learning
curve ops benefits if multiple
spacecraft NA
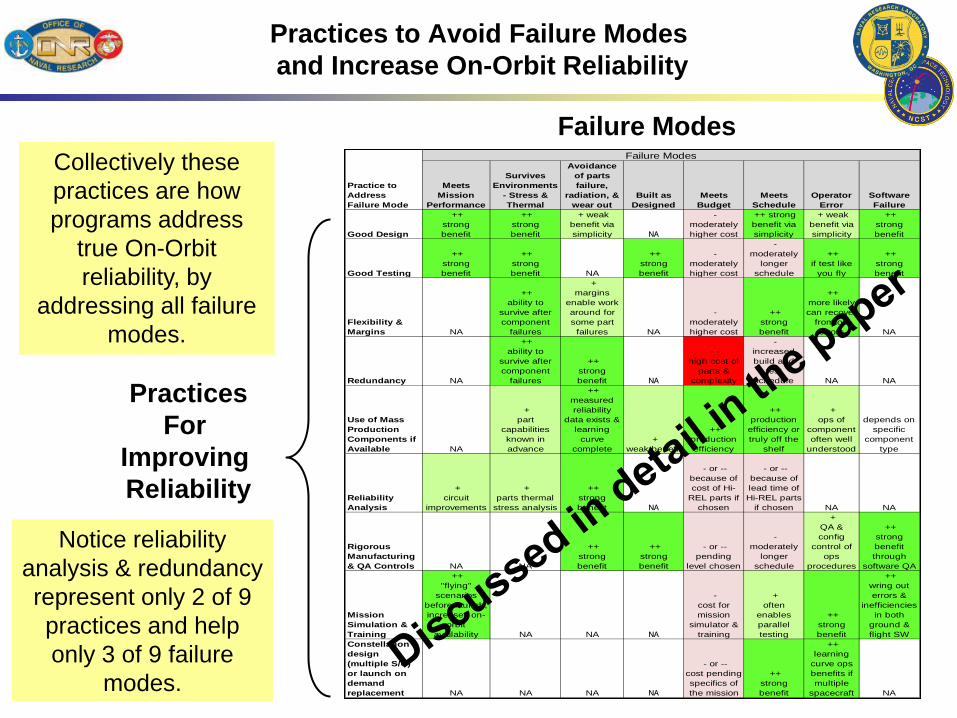
Practices to Avoid Failure Modesand Increase On-Orbit Reliability
PracticesFor
Improving Reliability
Failure ModesCollectively these practices are how programs address
true On-Orbit reliability, by
addressing all failure modes.
Notice reliability analysis & redundancy represent only 2 of 9 practices and help only 3 of 9 failure
modes.
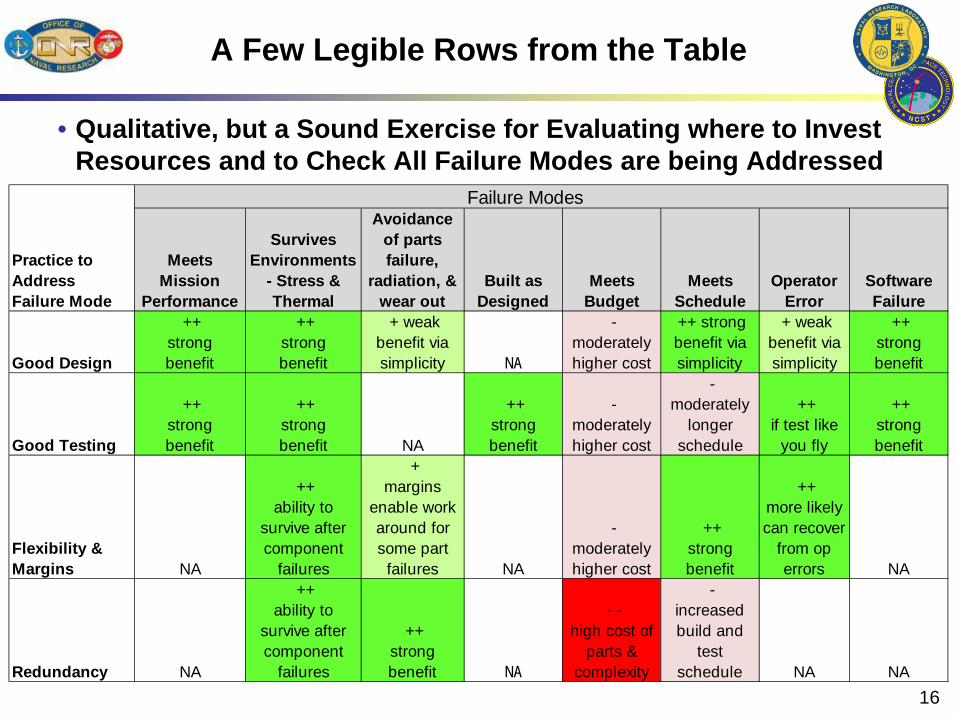
A Few Legible Rows from the Table
• Qualitative, but a Sound Exercise for Evaluating where to Invest Resources and to Check All Failure Modes are being Addressed
16
Failure Modes
Practice to Address Failure Mode
Meets Mission
Performance
Survives Environments
- Stress & Thermal
Avoidance of parts failure,
radiation, & wear out
Built as Designed
Meets Budget
Meets Schedule
Operator Error
Software Failure
Good Design
++ strong benefit
++ strong benefit
+ weak benefit via simplicity NA
- moderately higher cost
++ strong benefit via simplicity
+ weak benefit via simplicity
++ strong benefit
Good Testing
++ strong benefit
++ strong benefit NA
++ strong benefit
- moderately higher cost
- moderately
longer schedule
++ if test like
you fly
++ strong benefit
Flexibility & Margins NA
++ ability to
survive after component
failures
+ margins
enable work around for some part
failures NA
- moderately higher cost
++ strong benefit
++ more likely can recover
from op errors NA
Redundancy NA
++ ability to
survive after component
failures
++ strong benefit NA
- - high cost of
parts & complexity
- increased build and
test schedule NA NA
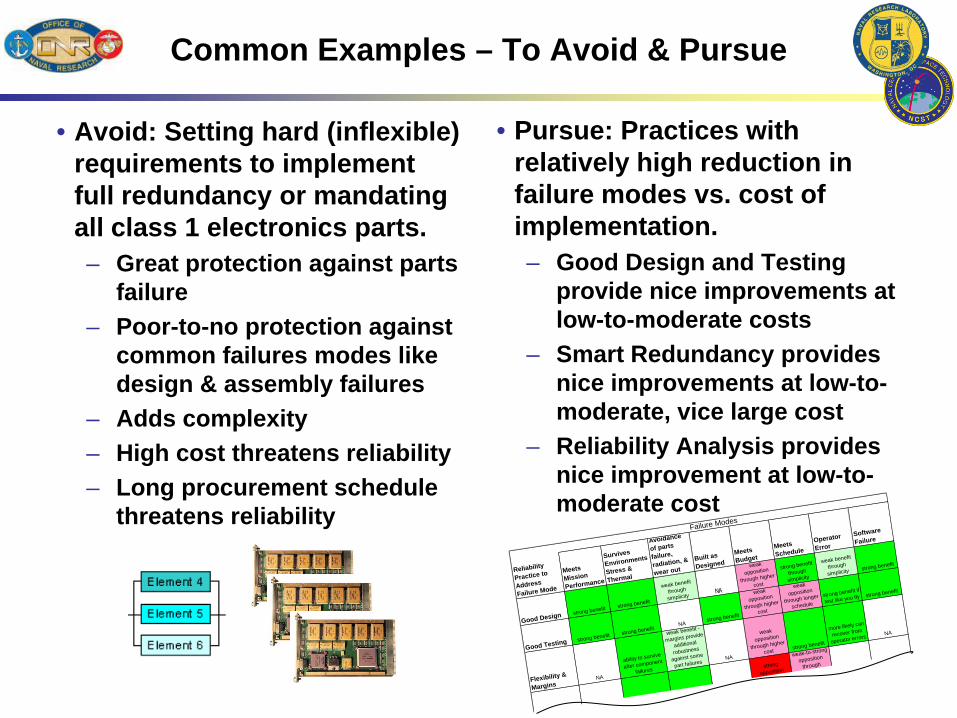
Common Examples – To Avoid & Pursue
• Avoid: Setting hard (inflexible) requirements to implement full redundancy or mandating all class 1 electronics parts.– Great protection against parts
failure– Poor-to-no protection against
common failures modes like design & assembly failures
– Adds complexity– High cost threatens reliability– Long procurement schedule
threatens reliability
• Pursue: Practices with relatively high reduction in failure modes vs. cost of implementation. – Good Design and Testing
provide nice improvements at low-to-moderate costs
– Smart Redundancy provides nice improvements at low-to-moderate, vice large cost
– Reliability Analysis provides nice improvement at low-to-moderate cost
Failure Modes
Reliability
Practice to
Address
Failure Mode
Meets Mission
Performance
Survives
Environments -
Stress &
Thermal
Avoidance
of parts
failure,
radiation, &
wear outBuilt as
DesignedMeets Budget
Meets Schedule
Operator
Error
Software
Failure
Good Design strong benefit strong benefit
weak benefit
through
simplicityNA
weak
opposition
through higher
cost
strong benefit
through
simplicity
weak benefit
through
simplicity strong benefit
Good Testing strong benefit strong benefitNA
strong benefit
weak
opposition
through higher
cost
weak
opposition
through longer
schedulestrong benefit if
test like you fly strong benefit
Flexibility &
MarginsNA
ability to survive
after component
failures
weak benefit -
margins provide
additional
robustness
against some
part failuresNA
weak
opposition
through higher
cost strong benefit
more likely can
recover from
operator errors NA
strong
opposition
weak-to-strong
opposition
through
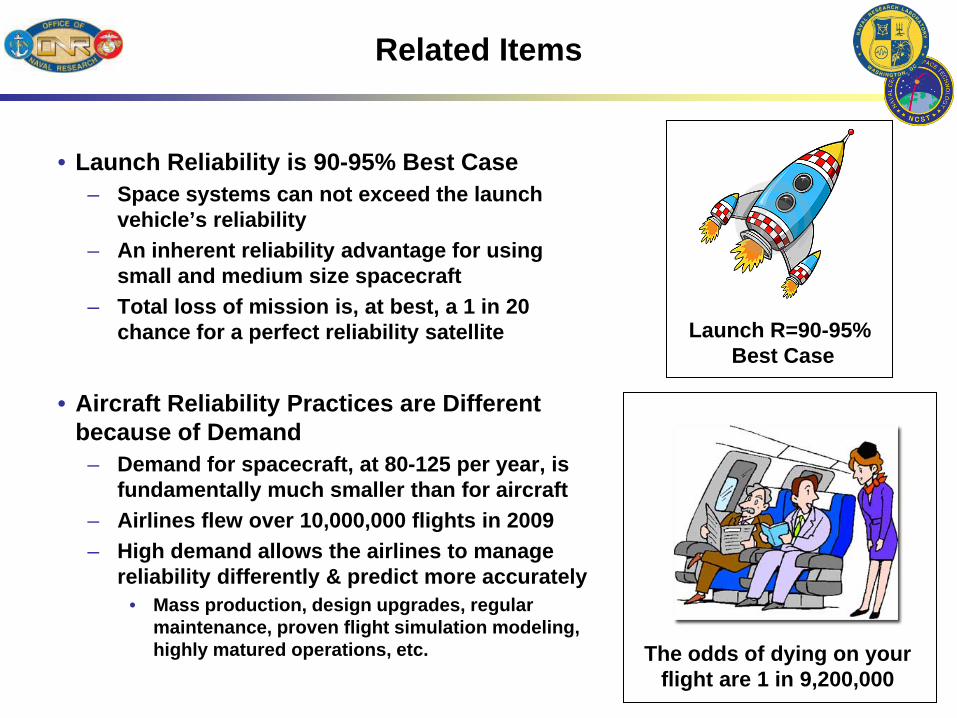
Related Items
• Launch Reliability is 90-95% Best Case– Space systems can not exceed the launch
vehicle’s reliability– An inherent reliability advantage for using
small and medium size spacecraft– Total loss of mission is, at best, a 1 in 20
chance for a perfect reliability satellite
• Aircraft Reliability Practices are Different because of Demand
– Demand for spacecraft, at 80-125 per year, is fundamentally much smaller than for aircraft
– Airlines flew over 10,000,000 flights in 2009– High demand allows the airlines to manage
reliability differently & predict more accurately• Mass production, design upgrades, regular
maintenance, proven flight simulation modeling, highly matured operations, etc.
Launch R=90-95% Best Case
The odds of dying on your flight are 1 in 9,200,000
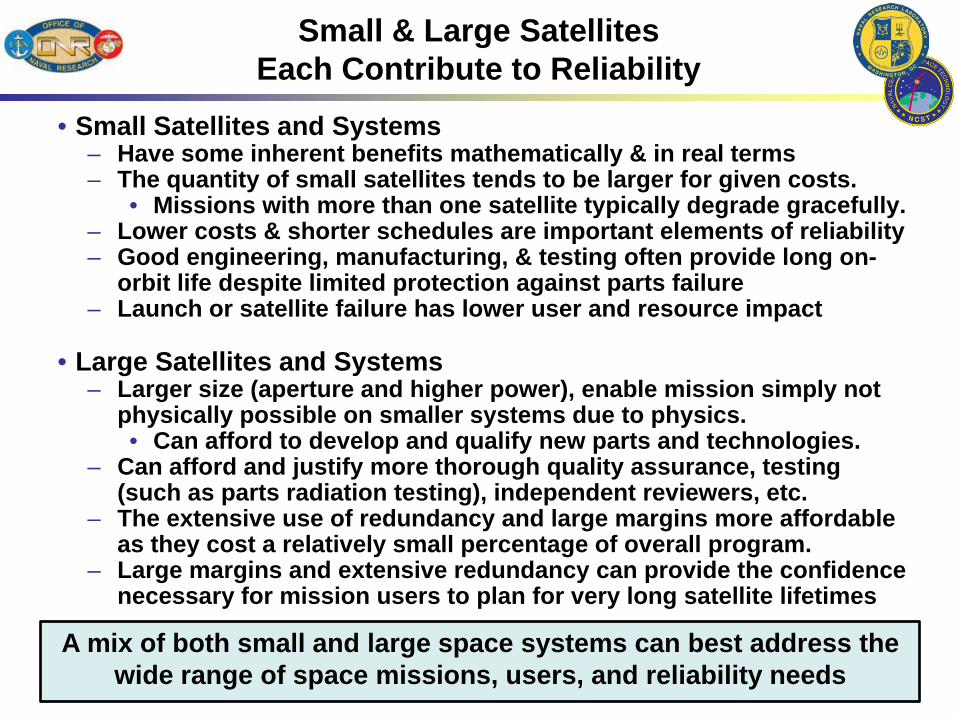
A mix of both small and large space systems can best address the wide range of space missions, users, and reliability needs
Small & Large Satellites Each Contribute to Reliability
• Small Satellites and Systems – Have some inherent benefits mathematically & in real terms – The quantity of small satellites tends to be larger for given costs.
• Missions with more than one satellite typically degrade gracefully.– Lower costs & shorter schedules are important elements of reliability– Good engineering, manufacturing, & testing often provide long on-
orbit life despite limited protection against parts failure– Launch or satellite failure has lower user and resource impact
• Large Satellites and Systems – Larger size (aperture and higher power), enable mission simply not
physically possible on smaller systems due to physics.• Can afford to develop and qualify new parts and technologies.
– Can afford and justify more thorough quality assurance, testing (such as parts radiation testing), independent reviewers, etc.
– The extensive use of redundancy and large margins more affordable as they cost a relatively small percentage of overall program.
– Large margins and extensive redundancy can provide the confidence necessary for mission users to plan for very long satellite lifetimes
Summary
• “Designing and Managing for a Reliability of Zero”, means:– Some practices intended to improve reliability actually degrade
reliability through complexity, schedule delays, and cost overruns
• Reliability analysis is fundamentally misapplied as a predictor of spacecraft success on orbit.– Both the MIL-STD-217F and on-orbit data confirm this– Misuse can result in bad program decisions
• For on-orbit reliability, addressing all failure modes, developers should create availability plans based on conscious value judgments of the true, on-orbit reliability provided by each of the available practices.– Conceptually shifting focus from 2 practices, redundancy and
reliability analysis, to the full set of 9 practices available
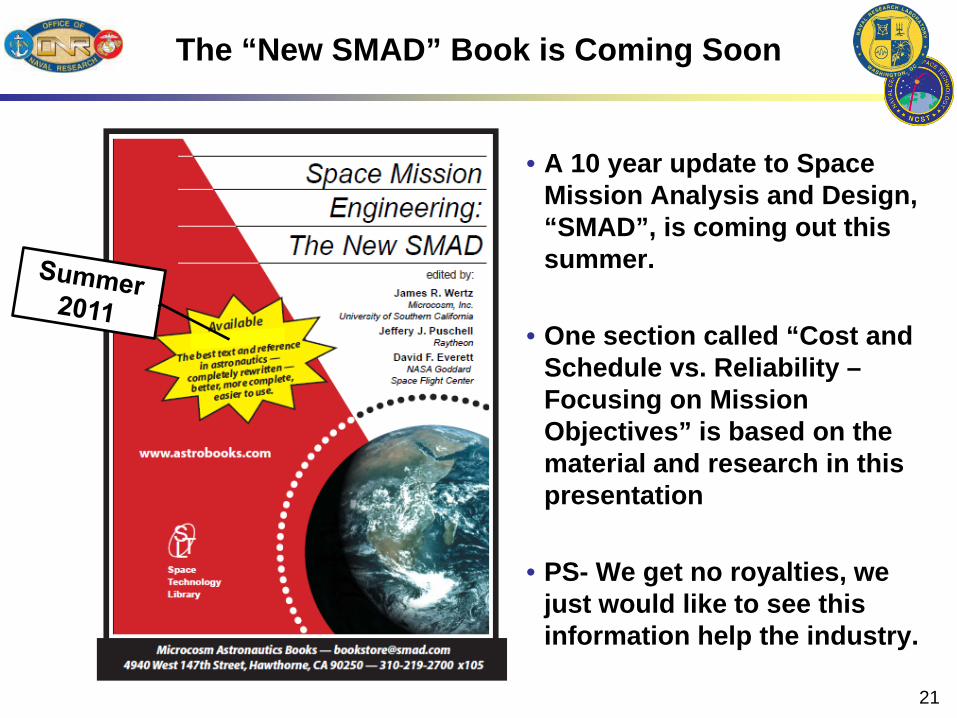
The “New SMAD” Book is Coming Soon
• A 10 year update to Space Mission Analysis and Design, “SMAD”, is coming out this summer.
• One section called “Cost and Schedule vs. Reliability –Focusing on Mission Objectives” is based on the material and research in this presentation
• PS- We get no royalties, we just would like to see this information help the industry.
21