designing and implementing compensation … and implementing compensation systems for employed...
TRANSCRIPT

Designing and Implementing Compensation Systems
for Employed Physicians:
Compensating today’s work while
preparing for the future
April 14, 2011
STROUDWATER ASSOCIATES

2© 2
01
1 S
trou
dwat
er A
ssoc
iate
s
Meeting Agenda
• Health reform impact on compensation
• The process
• Linking to strategy
• Design and Implementation
• Structures
• Design principles
• Challenges
• Questions
2

3
Health Reform

4© 2
01
1 S
trou
dwat
er A
ssoc
iate
s
Compensation under health reform
• Health reform is encouraging tighter alignment between hospitals and physicians • The shared savings program requires that participating
providers meet 65 different quality and performance metrics• These initiatives will force hospitals and physicians to re-
examine their approach to compensation• Even before the Patient Protection and Affordable Care Act
(PPACA) was passed into law, payment programs1 were emphasizing the importance of quality and performance in reimbursement
• In order to drive the relevance to the physician level, new compensation models will likely:• Reduce the portion of compensation that is tied directly to
production• Increase the portion of compensation tied to performance
metrics around quality, patient satisfaction, and team based care
4
1 – Examples include Physician Quality Reporting System and EHR meaningful use

The process
5
6© 2
01
1 S
trou
dwat
er A
ssoc
iate
s
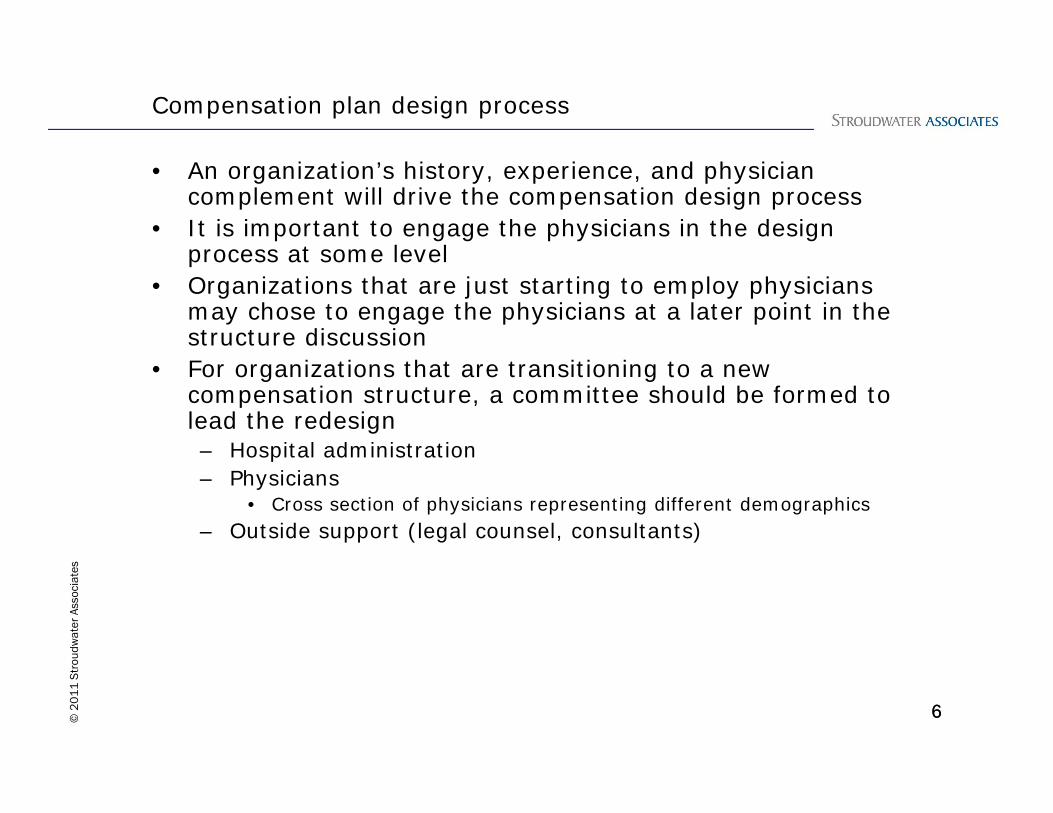
• An organization’s history, experience, and physician complement will drive the compensation design process
• It is important to engage the physicians in the design process at some level
• Organizations that are just starting to employ physicians may chose to engage the physicians at a later point in the structure discussion
• For organizations that are transitioning to a new compensation structure, a committee should be formed to lead the redesign– Hospital administration– Physicians
• Cross section of physicians representing different demographics – Outside support (legal counsel, consultants)
Compensation plan design process
6

7© 2
01
1 S
trou
dwat
er A
ssoc
iate
s
• Process should cover:– External marketplace – Goals of the organization– Goals for the compensation plan– Principles of design– Different compensation structures (strengths and weaknesses)– Review of prior compensation plan (strengths and weaknesses)
• History of approaches used• Benchmark historical performance
– Determine most appropriate approach for the organization• Define components • Establish measurement system (if not already in place)• Create scorecard and feedback mechanism (if not already in place)
Compensation plan design process
7

8© 2
01
1 S
trou
dwat
er A
ssoc
iate
s
• Process continued– Develop a transition plan to move physicians from old system
to new– Establish an ongoing oversight committee or process
• Addresses questions or issues as they arise• Maintains log of issues for future use in compensation plan design• Reviews and provides scorecards to physicians
8
Compensation plan design process
9© 2
01
1 S
trou
dwat
er A
ssoc
iate
s
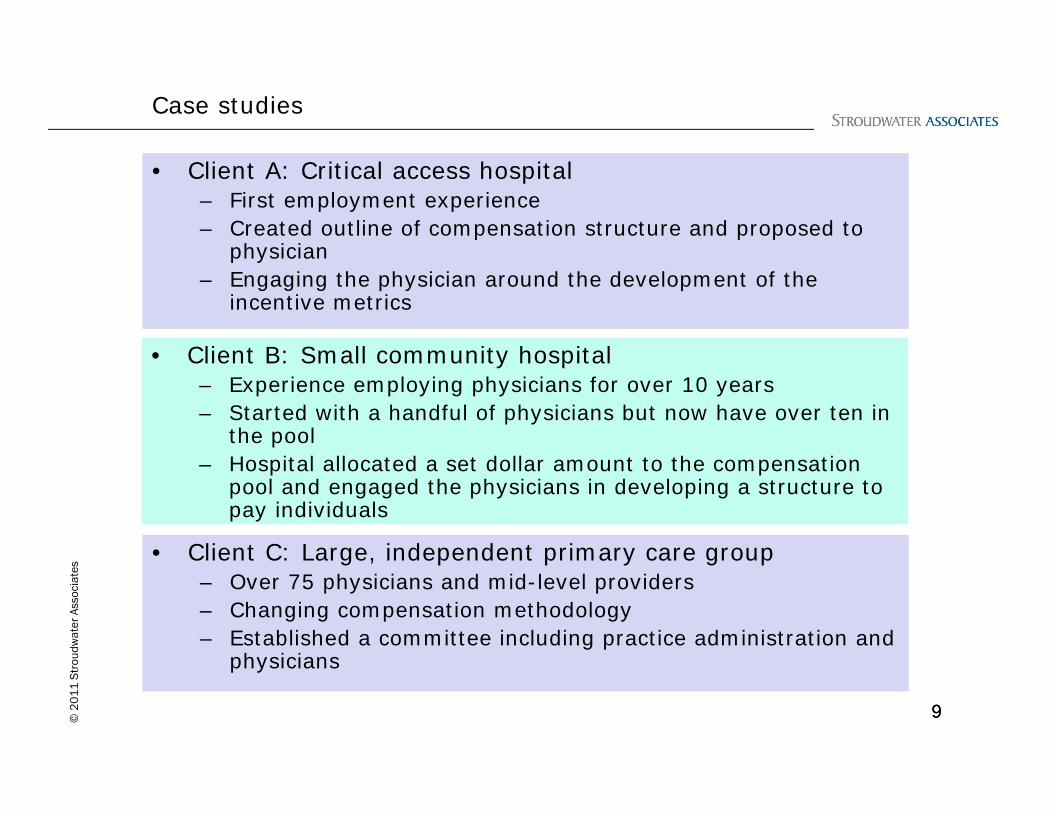
• Client A: Critical access hospital – First employment experience– Created outline of compensation structure and proposed to
physician– Engaging the physician around the development of the
incentive metrics
Case studies
9
• Client B: Small community hospital – Experience employing physicians for over 10 years– Started with a handful of physicians but now have over ten in
the pool– Hospital allocated a set dollar amount to the compensation
pool and engaged the physicians in developing a structure to pay individuals
• Client C: Large, independent primary care group– Over 75 physicians and mid-level providers– Changing compensation methodology– Established a committee including practice administration and
physicians

Linking to strategy
10
11© 2
01
1 S
trou
dwat
er A
ssoc
iate
s
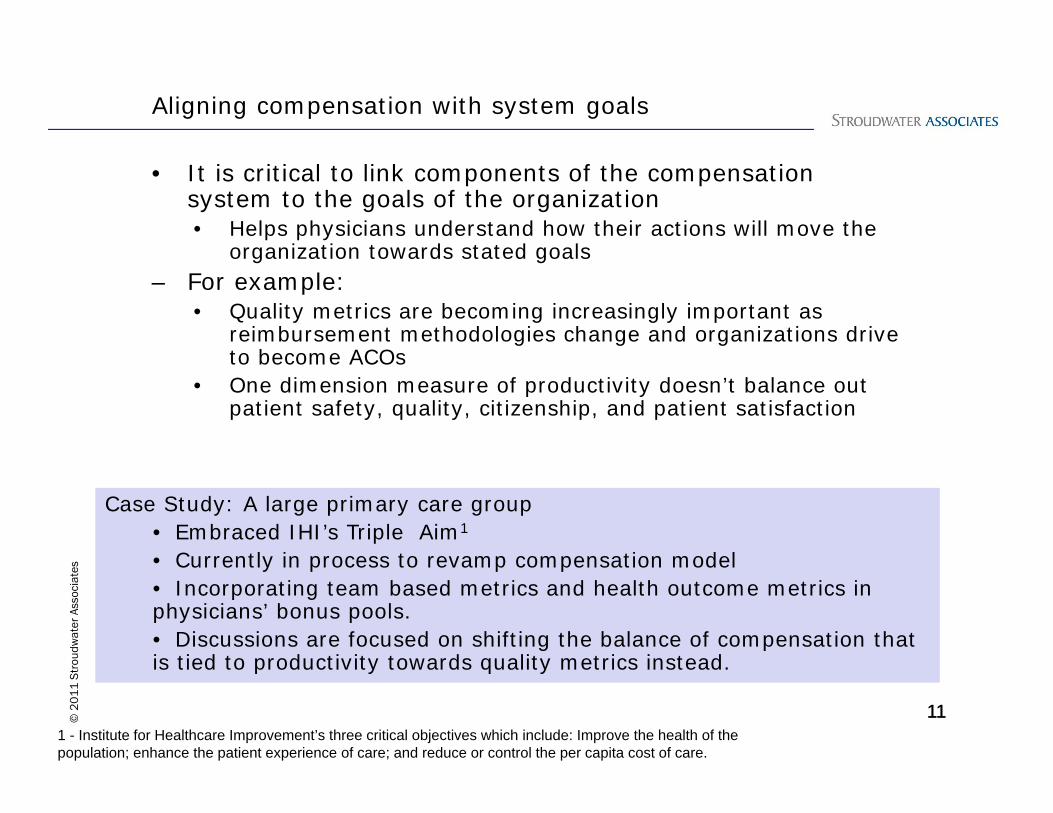
• It is critical to link components of the compensation system to the goals of the organization• Helps physicians understand how their actions will move the
organization towards stated goals – For example:
• Quality metrics are becoming increasingly important as reimbursement methodologies change and organizations drive to become ACOs
• One dimension measure of productivity doesn’t balance out patient safety, quality, citizenship, and patient satisfaction
Aligning compensation with system goals
11
Case Study: A large primary care group• Embraced IHI’s Triple Aim1
• Currently in process to revamp compensation model • Incorporating team based metrics and health outcome metrics in physicians’ bonus pools. • Discussions are focused on shifting the balance of compensation that is tied to productivity towards quality metrics instead.
1 - Institute for Healthcare Improvement’s three critical objectives which include: Improve the health of the population; enhance the patient experience of care; and reduce or control the per capita cost of care.
Design and Implementation
12

Structures
13
14© 2
01
1 S
trou
dwat
er A
ssoc
iate
s
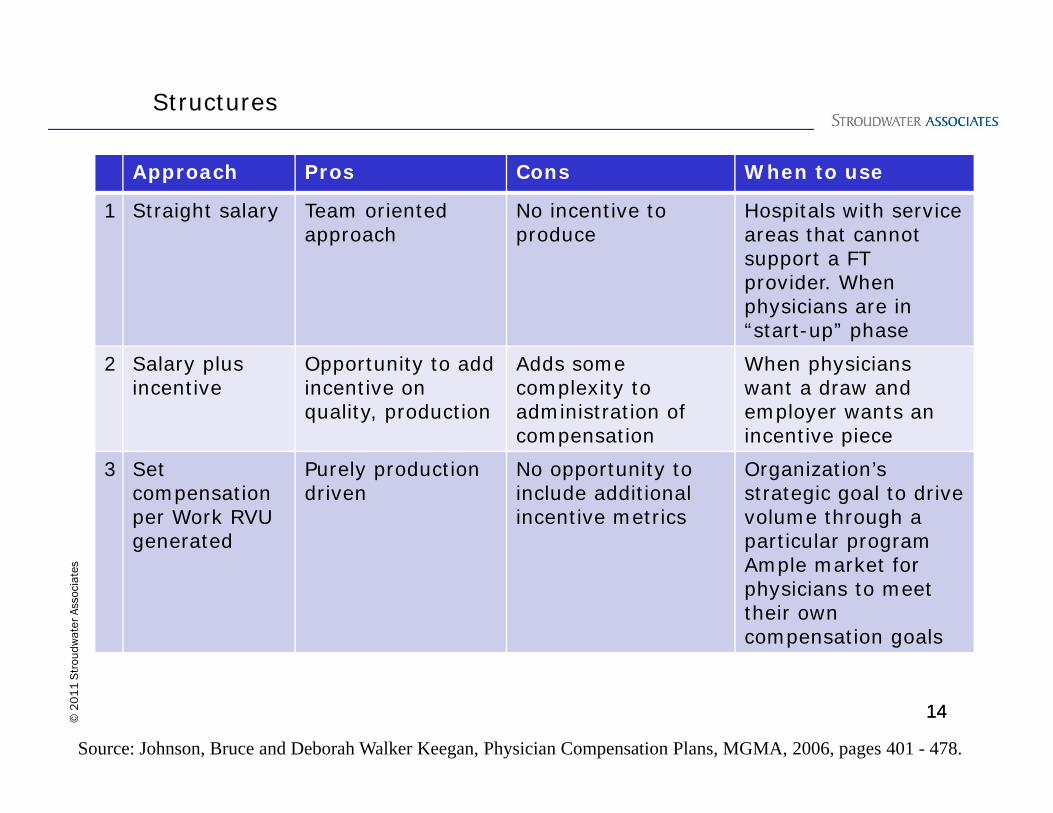
Structures
Approach Pros Cons When to use
1 Straight salary Team oriented approach
No incentive to produce
Hospitals with service areas that cannot support a FT provider. When physicians are in “start-up” phase
2 Salary plus incentive
Opportunity to add incentive on quality, production
Adds some complexity to administration of compensation
When physicians want a draw and employer wants an incentive piece
3 Set compensation per Work RVU generated
Purely productiondriven
No opportunity to include additional incentive metrics
Organization’s strategic goal to drive volume through a particular programAmple market for physicians to meet their own compensation goals
14
Source: Johnson, Bruce and Deborah Walker Keegan, Physician Compensation Plans, MGMA, 2006, pages 401 - 478.
15© 2
01
1 S
trou
dwat
er A
ssoc
iate
s
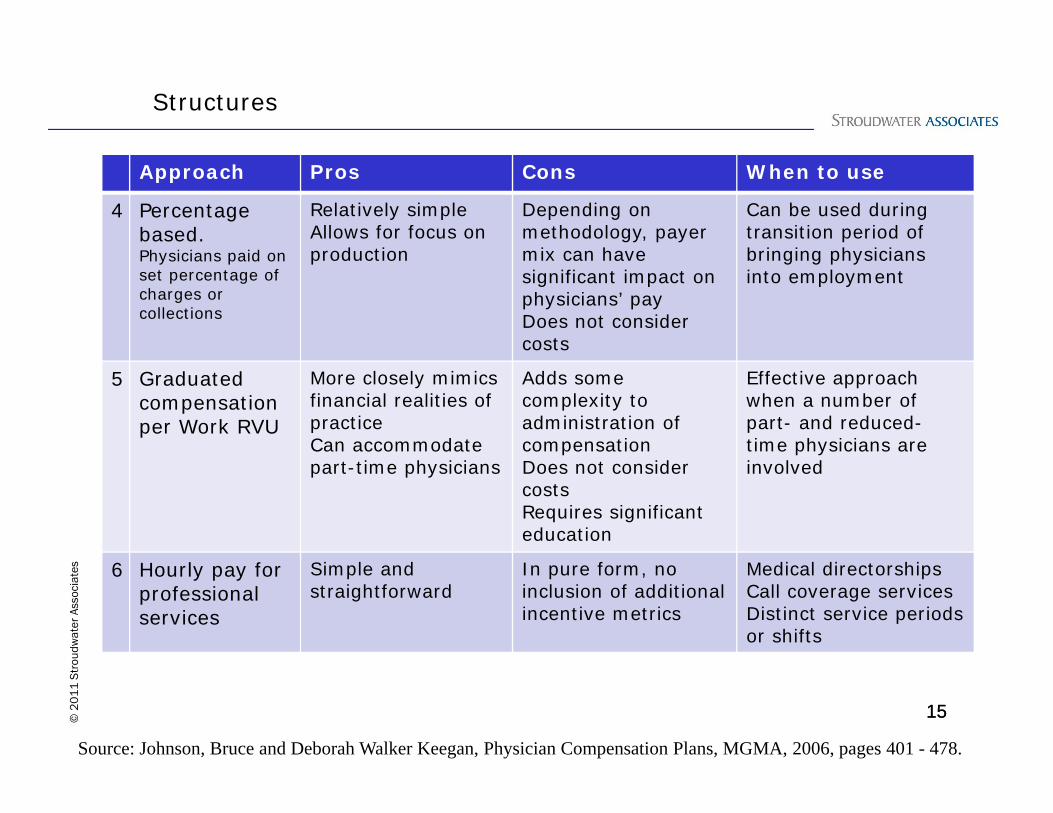
Structures
Approach Pros Cons When to use
4 Percentage based.Physicians paid on set percentage of charges or collections
Relatively simpleAllows for focus on production
Depending on methodology, payer mix can have significant impact on physicians’ payDoes not consider costs
Can be used during transition period of bringing physicians into employment
5 Graduated compensation per Work RVU
More closely mimics financial realities of practiceCan accommodate part-time physicians
Adds some complexity to administration of compensationDoes not consider costsRequires significant education
Effective approach when a number of part- and reduced-time physicians are involved
6 Hourly pay for professional services
Simple and straightforward
In pure form, noinclusion of additional incentive metrics
Medical directorshipsCall coverage servicesDistinct service periods or shifts
15
Source: Johnson, Bruce and Deborah Walker Keegan, Physician Compensation Plans, MGMA, 2006, pages 401 - 478.

16© 2
01
1 S
trou
dwat
er A
ssoc
iate
s
• Many organizations combine the different approaches into one compensation structure– Component A: Salary or draw– Component B: Productivity payment– Component C: Incentive pay using metrics around quality,
patient satisfaction, and financial management
16
Structures

17© 2
01
1 S
trou
dwat
er A
ssoc
iate
s
17
Base salary or draw
• Most organizations include a base salary– Decision is around level at which to set the base– Some hospitals use a minimal base and add a draw which
means more is at risk for the physician
18© 2
01
1 S
trou
dwat
er A
ssoc
iate
s
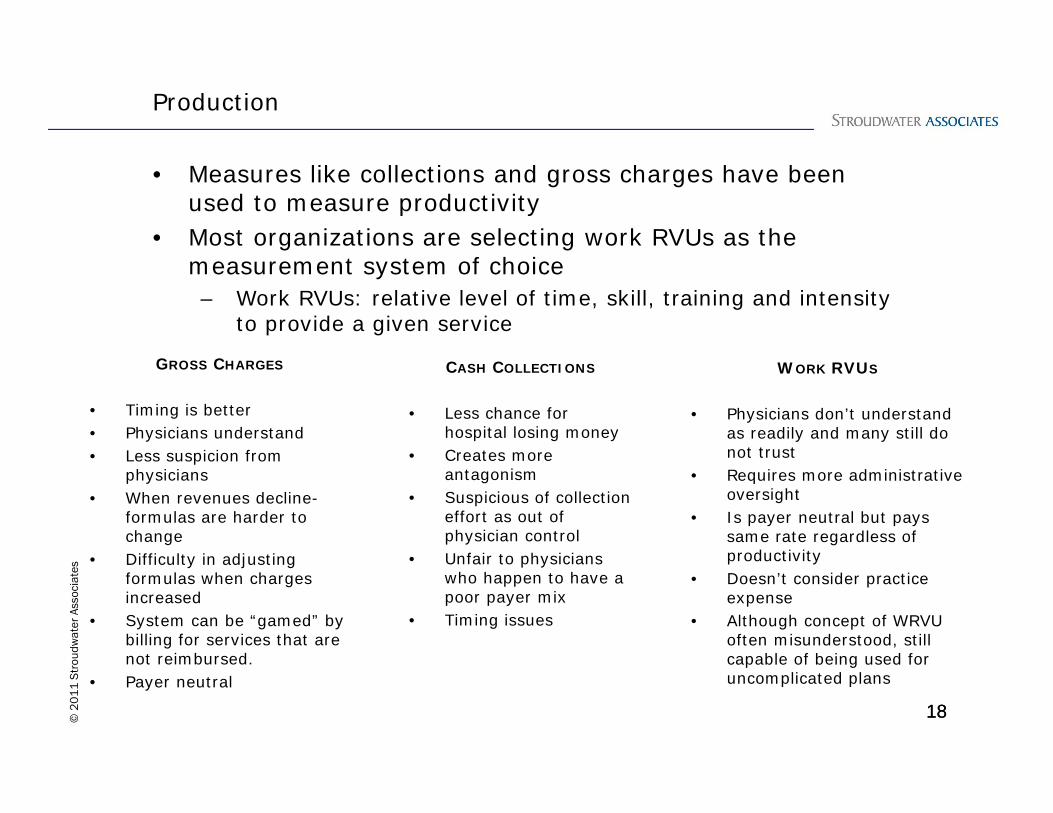
• Measures like collections and gross charges have been used to measure productivity
• Most organizations are selecting work RVUs as the measurement system of choice
– Work RVUs: relative level of time, skill, training and intensity to provide a given service
18
Production
GROSS CHARGES
• Timing is better• Physicians understand• Less suspicion from
physicians• When revenues decline-
formulas are harder to change
• Difficulty in adjusting formulas when charges increased
• System can be “gamed” by billing for services that are not reimbursed.
• Payer neutral
CASH COLLECTIONS
• Less chance for hospital losing money
• Creates more antagonism
• Suspicious of collection effort as out of physician control
• Unfair to physicians who happen to have a poor payer mix
• Timing issues
WORK RVUS
• Physicians don’t understand as readily and many still do not trust
• Requires more administrative oversight
• Is payer neutral but pays same rate regardless of productivity
• Doesn’t consider practice expense
• Although concept of WRVU often misunderstood, still capable of being used for uncomplicated plans
19© 2
01
1 S
trou
dwat
er A
ssoc
iate
s
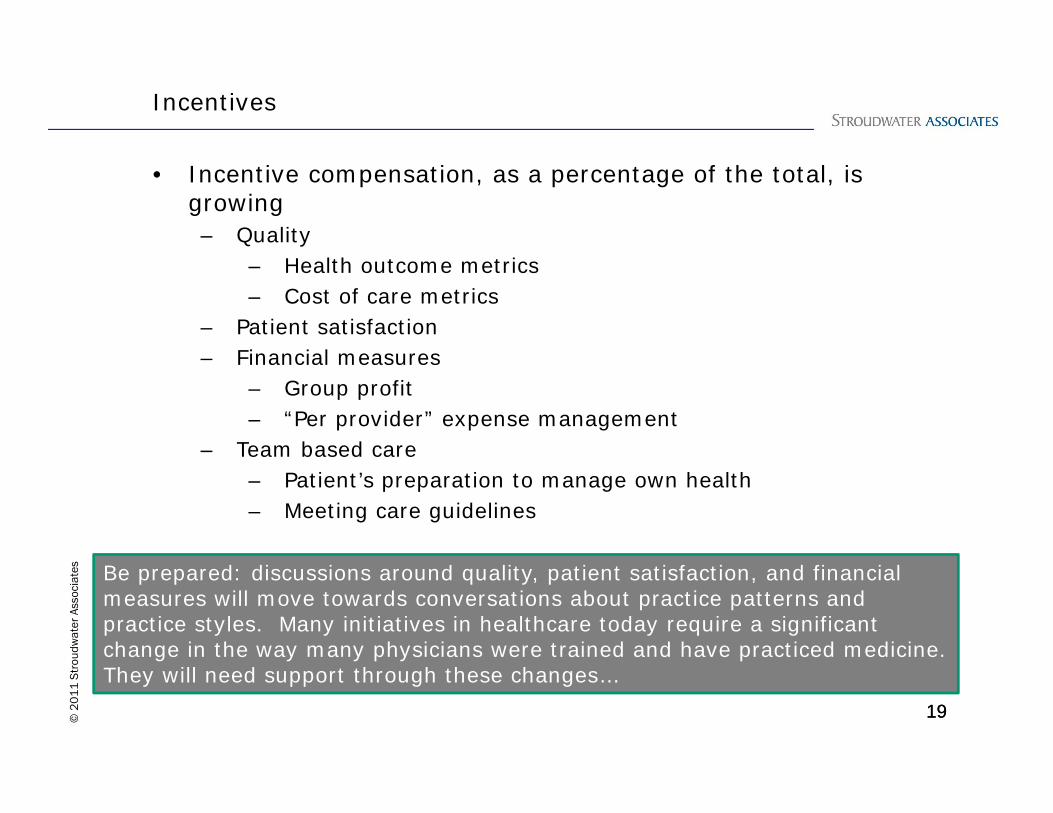
• Incentive compensation, as a percentage of the total, is growing
– Quality– Health outcome metrics– Cost of care metrics
– Patient satisfaction– Financial measures
– Group profit– “Per provider” expense management
– Team based care– Patient’s preparation to manage own health– Meeting care guidelines
19
Incentives
Be prepared: discussions around quality, patient satisfaction, and financial measures will move towards conversations about practice patterns and practice styles. Many initiatives in healthcare today require a significant change in the way many physicians were trained and have practiced medicine. They will need support through these changes…

ChallengesSurveys
20

21© 2
01
1 S
trou
dwat
er A
ssoc
iate
s
• Many employers are relying on surveys1 to establish target compensation levels
• In order to use them effectively, it is critical to:
Understand the limitations of the surveys
Understand your marketplace and its characteristics
Balance local and national market considerations
Challenges – using the surveys
1 – Examples include Medical Group Management Association’s Physician Productivity and Compensation Survey and the American Medical Group Association’s Compensation and Financial Survey
22© 2
01
1 S
trou
dwat
er A
ssoc
iate
s
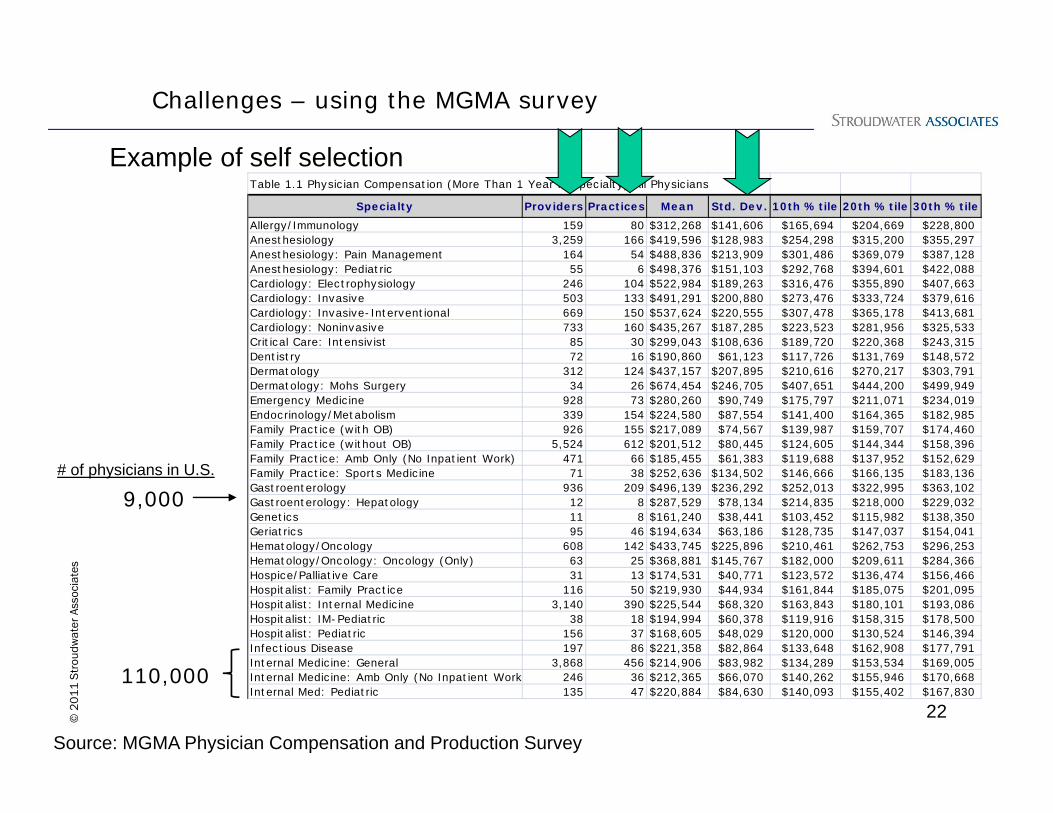
Table 1.1 Physician Compensation (More Than 1 Year in Specialty) All Physicians
Specialty Providers Practices Mean Std. Dev. 10th %tile 20th %tile 30th %tileAllergy/Immunology 159 80 $312,268 $141,606 $165,694 $204,669 $228,800 Anesthesiology 3,259 166 $419,596 $128,983 $254,298 $315,200 $355,297 Anesthesiology: Pain Management 164 54 $488,836 $213,909 $301,486 $369,079 $387,128 Anesthesiology: Pediatric 55 6 $498,376 $151,103 $292,768 $394,601 $422,088 Cardiology: Electrophysiology 246 104 $522,984 $189,263 $316,476 $355,890 $407,663 Cardiology: Invasive 503 133 $491,291 $200,880 $273,476 $333,724 $379,616 Cardiology: Invasive-Interventional 669 150 $537,624 $220,555 $307,478 $365,178 $413,681 Cardiology: Noninvasive 733 160 $435,267 $187,285 $223,523 $281,956 $325,533 Critical Care: Intensivist 85 30 $299,043 $108,636 $189,720 $220,368 $243,315 Dentistry 72 16 $190,860 $61,123 $117,726 $131,769 $148,572 Dermatology 312 124 $437,157 $207,895 $210,616 $270,217 $303,791 Dermatology: Mohs Surgery 34 26 $674,454 $246,705 $407,651 $444,200 $499,949 Emergency Medicine 928 73 $280,260 $90,749 $175,797 $211,071 $234,019 Endocrinology/Metabolism 339 154 $224,580 $87,554 $141,400 $164,365 $182,985 Family Practice (with OB) 926 155 $217,089 $74,567 $139,987 $159,707 $174,460 Family Practice (without OB) 5,524 612 $201,512 $80,445 $124,605 $144,344 $158,396 Family Practice: Amb Only (No Inpatient Work) 471 66 $185,455 $61,383 $119,688 $137,952 $152,629 Family Practice: Sports Medicine 71 38 $252,636 $134,502 $146,666 $166,135 $183,136 Gastroenterology 936 209 $496,139 $236,292 $252,013 $322,995 $363,102 Gastroenterology: Hepatology 12 8 $287,529 $78,134 $214,835 $218,000 $229,032 Genetics 11 8 $161,240 $38,441 $103,452 $115,982 $138,350 Geriatrics 95 46 $194,634 $63,186 $128,735 $147,037 $154,041 Hematology/Oncology 608 142 $433,745 $225,896 $210,461 $262,753 $296,253 Hematology/Oncology: Oncology (Only) 63 25 $368,881 $145,767 $182,000 $209,611 $284,366 Hospice/Palliative Care 31 13 $174,531 $40,771 $123,572 $136,474 $156,466 Hospitalist: Family Practice 116 50 $219,930 $44,934 $161,844 $185,075 $201,095 Hospitalist: Internal Medicine 3,140 390 $225,544 $68,320 $163,843 $180,101 $193,086 Hospitalist: IM-Pediatric 38 18 $194,994 $60,378 $119,916 $158,315 $178,500 Hospitalist: Pediatric 156 37 $168,605 $48,029 $120,000 $130,524 $146,394 Infectious Disease 197 86 $221,358 $82,864 $133,648 $162,908 $177,791 Internal Medicine: General 3,868 456 $214,906 $83,982 $134,289 $153,534 $169,005 Internal Medicine: Amb Only (No Inpatient Work 246 36 $212,365 $66,070 $140,262 $155,946 $170,668 Internal Med: Pediatric 135 47 $220,884 $84,630 $140,093 $155,402 $167,830
Source: MGMA Physician Compensation and Production Survey
9,000
110,000
Challenges – using the MGMA survey
Example of self selection
# of physicians in U.S.

23© 2
01
1 S
trou
dwat
er A
ssoc
iate
s
Table 1.1 Physician Compensation (More Than 1 Year in Specialty) All
Specialty Providers PracticesAllergy/Immunology 159 80Anesthesiology 3,259 166Anesthesiology: Pain Management 164 54Anesthesiology: Pediatric 55 6Cardiology: Electrophysiology 246 104Cardiology: Invasive 503 133Cardiology: Invasive-Interventional 669 150Cardiology: Noninvasive 733 160Critical Care: Intensivist 85 30Dentistry 72 16Dermatology 312 124Dermatology: Mohs Surgery 34 26Emergency Medicine 928 73Endocrinology/Metabolism 339 154Family Practice (with OB) 926 155Family Practice (without OB) 5,524 612
Source: MGMA Physician Compensation and Production Survey, 2010
Caution: Watch the sample size when “slicing” the data
Interpreting MGMA Tables
Challenges – using the MGMA survey
Both tables reflect compensation data but
have a significant difference in sample size
Specialty Providers PracticesAllergy/Immunology 84 47Anesthesiology 1,459 127Anesthesiology: Pain Management 73 34Anesthesiology: Pediatric 47 3Cardiology: Electrophysiology 171 72Cardiology: Invasive 339 90Cardiology: Invasive-Interventional 456 112Cardiology: Noninvasive 455 117Critical Care: Intensivist 45 18Dentistry 27 9Dermatology 159 75Dermatology: Dermatopathology 2 2Dermatology: Mohs Surgery 22 16Emergency Medicine 445 41Endocrinology/Metabolism 137 71Family Practice (with OB) 407 97Family Practice (without OB) 2,297 314

24© 2
01
1 S
trou
dwat
er A
ssoc
iate
s
Source: Medical Group Management Association, 2010
Multiple tables cannot be comparedExamples for Family Practice (without OB)
Providers Practices Std. Dev. MedianTable 1.1: Physician Compensation
5,524 612 $ 80,445 $ 183,999
Table 13.1: Ambulatory Encounters
3,113 364 1,730 4,008
Table 9.1: Physician Gross Charges (TC/NPP excluded)
3,248 353 $ 258,894 $ 595,153
Table 20.1: Physician Work RVUs
4,179 417 1,734 4,845
Table 22.1: Physician Compensation to Physician Work RVUs Ratio
4,159 416 $ 19.86 $ 39.13
Challenges – using the MGMA survey
When comparing across tables, the recommendation is to use a percentage of the median as your starting point and apply that percentage to the median in other tables
Tables do not necessarily include the same respondents
25© 2
01
1 S
trou
dwat
er A
ssoc
iate
s
• Adjust national survey figures to local market conditions• Adjust to recruitment environment• When benchmarking and target setting require you to cut
across tables, use a percentage of the median as your starting point
Recommendations
ChallengesSetting compensation levels and targets
26

27© 2
01
1 S
trou
dwat
er A
ssoc
iate
s
• Understand marketplace– Competition for services– Demographics– Location of services– Demand for services
• Have a general idea of what the physician(s) should be producing – Established physician
• 3 years of historical production– Newly recruited physician
• Survey targets or projected area demand
• Know how the physician will be spending his/her time
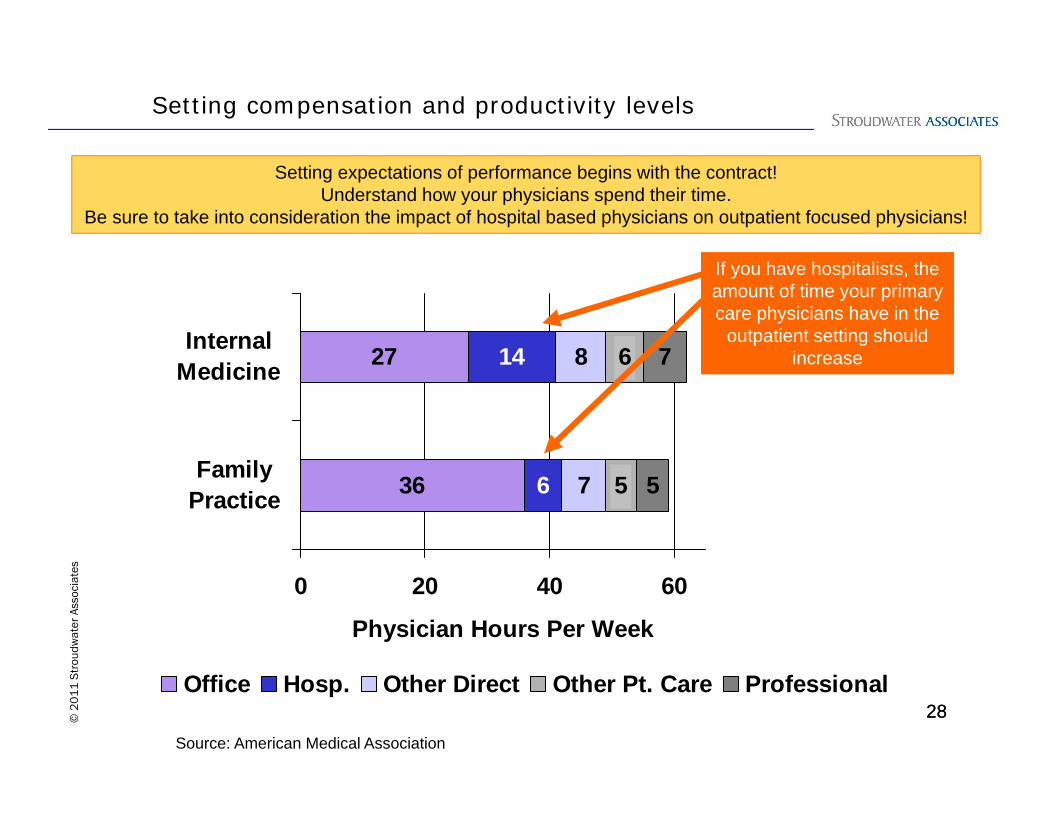
Setting compensation and productivity levels
28© 2
01
1 S
trou
dwat
er A
ssoc
iate
s
36
27
6
14
7
8
5
6
5
7
0 20 40 60
FamilyPractice
InternalMedicine
Physician Hours Per Week
Office Hosp. Other Direct Other Pt. Care Professional
Source: American Medical Association
If you have hospitalists, the amount of time your primary care physicians have in the
outpatient setting should increase
Setting expectations of performance begins with the contract! Understand how your physicians spend their time.
Be sure to take into consideration the impact of hospital based physicians on outpatient focused physicians!
28
Setting compensation and productivity levels

29© 2
01
1 S
trou
dwat
er A
ssoc
iate
s
• Client A – sole community provider, community hospital– Base targeted at median of MGMA survey– Production and incentive metrics were in addition to
• Client B – rural hospital– Base was a smaller percentage of total compensation– Dollar amounts allocated to base were not “high enough” for
physicians’ personal expenditures, so they received “advances” on their productivity pay
• Difference – client A adjusted pay due to missed production targets in the second year of the contract, client B was able to adjust in current year
Considerations:– Are you prepared to have a conversation with a physician
about an overpayment to him/her which requires a payback to the hospital?
– Is the base or draw enough so physicians can manage their own personal expenditures?
– Is the base/draw enough to support recruitment?
Case Studies: setting compensation levels

30© 2
01
1 S
trou
dwat
er A
ssoc
iate
s
• Client A– Production target (work RVUs) set at median of MGMA survey– Any excess work RVUs produced are compensated based on
the excess multiplied by a conversion factor• Client B
– Targets (work RVUs) were adjusted based on historical performance and market conditions
– Targets were easier to hit • Difference – client A had stretch goals that were not
“guaranteed” while client B’s targets were much easier to reach
Considerations:– Are you prepared to measure production?– Would you rather pay on real production or an estimate?
Case Studies: setting productivity targets

ChallengesSelecting incentives
31
32© 2
01
1 S
trou
dwat
er A
ssoc
iate
s
• Examine your list of potential incentive metrics• Prioritize the list
– Focus on those where you anticipate having the greatest impact
– Select ones that are easily measured– If some metrics are captured now but not currently included
in the compensation structure, start there• Have a plan on how to collect data on the metrics the
group determines should be in the next phase of the compensation structure
Selecting incentive metrics

33© 2
01
1 S
trou
dwat
er A
ssoc
iate
s
Metric Year 1 Year 2Compensation Per Work RVU Based Upon Office Visits and Surgical Cases $64.50 $68.50
25% Per Work RVU Withheld From the Above for Quality Performance Payment (QPP) 16.13$ 17.13$
Allocation of QPP Withhold:
Supply Utilization 2.30$ 2.45$ On Time Starts 2.30$ 2.45$ Patient Satisfaction 2.30$ 2.45$ Employee Retention 2.30$ 2.45$ Percentage of Denied Claims 2.30$ 2.45$ Clinical Outcomes 2.30$ 2.45$ Leadership 2.30$ 2.45$
Total Allocation 16.13$ 17.13$ Total QPP Percentage of Payment Rate 25% 25%
At Existing Volume
When first incorporating incentive metrics in your physicians’ compensation structure, be sure to keep the number of metrics manageable and meaningful
• Too many measures: • Diffuse incentive effort• ‘Pools’ are too small• Create confusion over how structure works 33
Case study:
• A large community hospital in urban setting
• Structuring contract model with specialty physician
• Wanted to tie quality and performance metrics to pay
• Listed 7-8 metrics to be included
Case Studies: prioritizing incentive metrics
34© 2
01
1 S
trou
dwat
er A
ssoc
iate
s
• Client A– New employment arrangement (little historical data)– Wanted to engage physicians around financial performance of the
practice– Worked together to establish budgets for the practices– Rewarded tight management of provider-influenced expenses
• Client B– Had a long history measuring patient satisfaction– Focused on one question within the survey that highlighted an
area of concern for the practices– Set dollar amount per level of performance attained
• Difference – client B had historic information that could be used to set stretch but attainable goals
Considerations:– What data is available?– How much of the outcome on a particular metric is within the
physician’s control?– Are you prepared to support and improve systems to minimize
the “noise”?
Case Studies: picking incentive metrics

35© 2
01
1 S
trou
dwat
er A
ssoc
iate
s
• Client C– Large, multi-specialty group in urban setting– Has robust quality reporting initiative
– Physicians receive monthly reports on performance across many quality metrics and patient satisfaction
– Many of the metrics require self-reporting– Incentives within compensation plan are NOT based on any
metrics requiring self-reporting• Client D
– Mid-sized, primary care group in urban setting– In transition period to new compensation structure– Growing portion of compensation that is tied to quality
metrics– Turning inward to set performance standards and
expectations (rather than relying on payers to set standards)
Considerations– Do you want to have an internal or external focus when
setting the incentive targets? 35
Case studies: target setting for incentives

Ensuring success
36

37© 2
01
1 S
trou
dwat
er A
ssoc
iate
s
• Understand the capabilities and the limitations of the systems and processes that you currently have in place– Production
• Be certain that your EMR or encounter forms are properly set up• Confirm that your physician charge capture and revenue cycle
process are efficient and effective
– Incentives• Be certain you can easily measure what will be included in the
compensation program
Systems
Case study: a small, PPS hospital with 8-10 employed physicians was switching to a productivity based compensation system but its encounter forms did not reflect all of the procedures that were being performed in the officeHospital was losing out on revenuePhysician would lose out on compensation
Case study: a critical access hospital wanted to include in its compensation structure metrics on adherence to colon screening recommendations. However, with the organization planning to transition to an EMR, current data gathering would be manual. The organization was not ready to implement this metric.

38© 2
01
1 S
trou
dwat
er A
ssoc
iate
s
• If a metric is included in the compensation structure, measure and report!!
• Providers need to know how they are doing: Productivity Financial performance of the
practiceOther, non-production measures
Data Reporting
2007 2007Budget Actual Varience
Total Net Collections 8,263,795$ 8,938,587$ 674,792$ -$
Other Income -$ Rental Income 212,194 216,283 4,089$ Interest Income 8,750 10,500 1,750$
Total Income 8,484,739$ 9,165,371$ 680,632$
ExpensesSalaries to Physician Primary 1,604,302 1,669,895 65,593$ Salaries- Other Physicians and Medical Providers 1,860,934 2,101,577 240,643$ Salaries and Wages-Administrative staff 1,617,387 1,750,128 132,741$ Payroll Taxes 311,868 333,329 21,461$ Payroll Expense 12,000 12,360 360$ Purchases-Drugs 36,000 37,080 1,080$ Purchases-Supplies 110,000 113,300 3,300$ Purchases- Supplies- GI Suite 210,000 216,300 6,300$
Give straightforward and timely feedback on performance
© 2011 Stroudwater Associates
39© 2
01
1 S
trou
dwat
er A
ssoc
iate
s
Data Reporting
Case study: an anesthesiology group introduced a performance scorecard to its physicians. Monthly reports to individual physicians started with just five measures but has grown over time to include fifteen measures of performance. President of the group was one of the worst performers on a specific metric. Once he received the data, he conferred with his colleagues to understand what he was doing differently. The following year, this physician was the top performer on this specific metric.
You can drive behavioral change by providing timely and trusted reports on performance including targets and goals

40© 2
01
1 S
trou
dwat
er A
ssoc
iate
s
• Develop projections to reflect the impact of the physician’s performance on the practice’s budget and the hospital’s budget– Completed as part of the compensation development process,
the projections will help hospital administrators, physicians, and practice managers understand the impact of performance on the organization
– Engages the physicians around the finances of the practice– Can be used in support of any financial management metrics
incorporated into the compensation structure
Financial expectations
Case study: a sole community provider wanted to include a group profit sharing approach (not tied to any DHS related services). They had to first develop a budget for the practice. Process included working with the committee to understand the financial results of provider performance at various levels.

41© 2
01
1 S
trou
dwat
er A
ssoc
iate
s
• Organizations contemplating a significant change in its compensation approach should commit to a transition period– Allows participants time to understand how their current
behavior will be reflected in the new system and give them time to make appropriate adjustments
– Provides time for feedback– Any process issues can be identified before “going live”
Transition periods
Case study: A large physician group, was transitioning from three different models into one consolidated approach. A template was created and shared with participants so they could see the impact of the new system on their compensation
Current Base Call Productivity Medical ProposedComp. Salary Bonus Bonus Director Comp. Variance141,642$ 59,880$ 9,239$ 61,663$ $2,101 132,882$ (8,760)$ 148,405$ 63,235$ 18,478$ 64,076$ 145,789$ (2,616)$ 158,727$ 66,749$ 21,998$ 77,645$ 166,392$ 7,665$ 109,030$ 45,965$ 21,998$ 41,556$ $2,101 111,620$ 2,590$ 69,758$ 36,560$ 21,998$ 5,372$ $2,101 66,031$ (3,727)$ 82,270$ 35,404$ 29,389$ 26,689$ $2,101 93,582$ 11,313$ 75,000$ 59,800$ 9,239$ 528$ 69,567$ (5,433)$
107,182$ 57,229$ 29,389$ 24,247$ 110,865$ 3,683$ 59,800$ 42,873$ 8,444$ 2,999$ $2,101 56,417$ (3,383)$ 98,500$ 57,461$ 29,389$ 10,318$ 97,169$ (1,331)$
T 1,050,313$ 525,157$ 199,560$ 315,094$ 10,503$ 1,050,313$ -$
ABCDEFGHIJ
Total

Recommendations
42
43© 2
01
1 S
trou
dwat
er A
ssoc
iate
s
• Simple, straight forward, and transparent– If a compensation structure is too complex:
• Physicians will not understand how their behavior or performance impacts their pay
• It will breed distrust • It will lead to a poor relationship with your physicians
• Engage the physicians in developing the compensation structure
• For every incentive concept, there must be a valid method of measuring performance– Measurement systems need to stay one step ahead of
compensation incentives • A well-designed formula implemented poorly is just as sure
to fail as a poorly designed formula • Compensation systems are dynamic. They must change as
the group values change, as the market evolves, and as feedback capabilities are refined.
Design principles

44© 2
01
1 S
trou
dwat
er A
ssoc
iate
s
5 key parting concepts
• Align compensation system with the strategic goals of the organization.• Begin to incorporate incentive metrics including quality and
satisfaction metrics.
• Engage physicians in the process of designing the system.
• Accept that there is no perfect compensation system and that regardless of what is designed there will be ‘gaming’ and unintended consequences.• Keep the structure as simple and straight forward as possible
• Measure and report data
• Monitor, continuously, the system and be prepared to revisit it on an annual basis to realign and adjust.
44

45© 2
01
1 S
trou
dwat
er A
ssoc
iate
s
Contact for more information:
Stroudwater Associates 50 Sewall Street, Suite 102Portland, Maine 04102
Susan StowellPrincipalHospital-Physician Alignment, Practice Leader [email protected]

46© 2
01
1 S
trou
dwat
er A
ssoc
iate
s
SUSAN R. STOWELL, MBA, AVA, CMPEPrincipalHospital-Physician Alignment, Practice Leader
Ms. Stowell joined Stroudwater Associates in 2002. Her professional focus is hospital-physician relations, facilities planning, and medical staff planning. She has experience working with physician practices as well as hospitals of all sizes ranging from critical access hospitals to academic medical centers.
Susan's recent work has included the development and implementation of theCommunity Service Plan, a deferred compensation plan for ED Call, at a largecommunity hospital; hospital employment offers and arrangements forphysicians; assessment of physician practices for process improvementpurposes and sales; Strategic Master Facility Planning for a number ofdifferent clients including two academic medical centers in the South Atlanticarea and a large community hospital in the south; and affiliations, acquisitions,joint ventures, and divestitures work with acute care hospitals and long-termcare facilities in several regions of the United States
William E. Simon School, University of Rochester, MBA
Princeton University, BA