design of large scale on-demand irrigation system … markoc et al.pdfirrigation network for an...
TRANSCRIPT
Agriculture & Forestry, Vol. 64 Issue 4: 89-103, 2018, Podgorica 89
DOI: 10.17707/AgricultForest.64.4.11
Marija MARKOČ, Milica ČOLOVIĆ, Gamal Abd Elnasser ALLAM, Shawkat BASEL and Qotada AL-ALI1
DESIGN OF LARGE SCALE ON-DEMAND IRRIGATION SYSTEM IN THE AGRICULTURAL AREA OF CORATO, APULIA, ITALY
SUMMARY
The objective of this project was to design a collective, on-demand irrigation network for an agricultural area near Corato, province of Bari, Apulia region, southern Italy. For this purpose, a study integrating agronomic, engineering, economic and environmental aspects has been conducted. The goal was to evaluate the ability to supply agricultural lands with irrigation water in order to cover the cropping pattern requirements in this district during the peak period of a dry year. After collecting and processing the climatic data for 30 years period, as well soil characteristics, crop water requirements have been determined. Besides that, modelling tool CROPWAT generated curves of yield response to different amounts of irrigation applied. The most optimal cropping pattern is chosen in socio-economic part through a predictive model, consisting of 3 annual (watermelon, tomato, lettuce) and 3 permanent crops (peach, grapevine, olive). Furthermore, sensitivity analysis have been done in order to avoid future risk and to predict farmers’ behaviour. The irrigation network was designed based on the specific continuous discharge (0.422 ls-1ha-1) which was computed on GIR values for the peak month of the dry year. A layout of the distribution network is computed by Geographical Information System (GIS) including reservoir, main pipelines, secondary pipelines, nodes, 38 hydrants with a module of 5 ls-1 and 23 hydrants with a module of 10 ls-1. Several tools (air and relief valves, control gates) are included in the network as well. Optimization model was used in order to calculate pipe diameter and their length (13271.7 m). In addition, storage reservoir was designed, as well as pumping station with 4 horizontal and 2 submerged pumps and pressurized regulating tank that controls opening and closure of the pumps. Cost and benefit analysis showed that the project is cost-effective on social basis and will fully recover its investment in two years, with an economic rate of return of 129%. An environmental impact assessment was conducted for the project and neighbouring area and it showed that they are not affected negatively. In addition, good management and monitoring practices to minimize the potential negative environmental impact are required and proposed for long-term sustainability of the irrigation project.
1Marija Markoč, (corresponding author: [email protected]), Milica Čolović, MONTENEGRO; Gamal Abd Elnasser Allam, Shawkat Basel, EGYPT; Qotada Al-Ali, SYRIA; MSc students in “Land and Water Resources Management: Irrigated Agriculture”, Mediterranean Agronomic Institute of Bari (CIHEAM-MAIB), Via Ceglie 9, 70010, Valenzano, Bari, ITALY. Paper is presented on Green Room Sessions - International Conference, Podgorica 2018 Notes: The authors declare that they have no conflicts of interest. Authorship Form signed online.
Markoč et al. 90
Keywords: irrigation, hydrant, discharge, crop water requirements, precipitation, yield, groundwater.
INTRODUCTION
Agricultural sector is the most water consuming sector in the world, reaching more than 70% of the withdrawal in many areas of the world and especially in the Southern Mediterranean countries.
In many countries, particularly those situated in the arid and semi-arid regions of the world, this dependency can be expected to intensify, due to the increasing demand on agricultural products. Thus, contribution of irrigated agriculture to food production is substantial and the expansion of irrigated agriculture will surely result in higher yield and production. According to it, irrigation is required to satisfy the water demand during the driest periods of the year, especially in semi-arid Mediterranean climate.
The objective of this project is to design a collective on demand irrigation network for an agricultural area Corato, in the province of Bari, Apulia region (Southern Italy).
The total area of Corato region is 280 ha, of which 235 ha are suitable for agriculture and irrigable. Water sources for irrigation in this region are provided by two wells with discharges of Q1=80 ls-1 and Q2=50 ls-1.
For this purpose, a study integrated agronomic, engineering, economic and environmental aspects have been conducted as presented in the following steps:
Climatic, soil, water source, water quality and crop characteristics data collection and elaboration;
Economic analysis through cropping pattern optimization under certain constraints and for a specific objective function;
Determination of specific continuous discharge for optimal cropping pattern;
Irrigation network design and design of storage reservoir, pumping station, pressurized tank and all the other structures and equipment of the project;
Estimation of the project’s implementation, operation and maintenance costs (cost of expropriation, excavation works, pipe cost, technical equipment cost, concrete works cost, electrical equipment cost, pump cost, etc.);
Economic evaluation of the project (Cost & Benefit Analysis) and Environmental Impact Assessment (EIA) and propose of possible
mitigation measures and the monitoring plan.
MATERIAL AND METHODS Agronomic part Obtained climatic data for Corato region is collected and elaborated for 30
years period, and information about minimum, maximum, average temperatures and rainfall are obtained and dry year precipitation is calculated. Available soil physical and chemical properties are used to determine soil texture, effective
Design of large scale on-demand irrigation system in the agricultural area … 91
depth, available water content, cation exchange capacity, electrical conductivity, exchangeable sodium percentage, organic matter, soil pH etc.
CROPWAT, software and modeling tool to support decision making for irrigation planning and management, was used in order to calculate reference evapotranspiration, crop water requirements as well as irrigation requirements. The data for twenty-one crops grown in the region were arranged using the FAO database and results of studies carried out in Apulia region. For the purposes of our project, after calculating the crop water requirements, CROPWAT model was used to generate the crop response curves that represent the yield response to different amounts of irrigation water applied. Different scenarios were introduced into the model, including different amounts of irrigation water from full irrigation to no irrigation (rainfed agriculture), under fixed management rules on evapotranspiration and effective rainfall estimation, as well as for irrigation timing, application and efficiency, (Smith et al., 1992).
Socio - economic part The main objectives of the socio-economic analysis are to identify the
optimal cropping pattern for the irrigation project area in Corato region that maximizes farmers utility, to assess the impact of different water pricing options on cropping pattern, on farm income and on water consumption and to choose the optimal water tariff system. To reach these objectives, a predictive model written in GAMS (General Algebraic Modeling System) programming language was used. It consists of a static and nonlinear optimization model aiming to represent farmer's behavior and to simulate his response to the introduction of irrigation. This is a constrained optimisation model that maximises an objective function subject to a set of constraints (land, water and crop constraints). Effectively, it assumes that farmers select the crop allocation that maximize the expected income and minimize the risk, which is measured by the risk aversion coefficient (the degree to which the farmer is averse to taking risks), (Hazell and Norton, 1986). Two sources of risks were considered in this model: market (i.e. price) and climate (i.e. yield) risks. Both prices and yields are assumed to be normally distributed and their means and standard deviations values are derived from regional statistical database (ISMEA – Istituto di Servizi per il Mercato Agricolo Alimentari, 2018).
Engineering part A layout of the distribution network (reservoir, main pipelines, secondary
pipelines, nodes and hydrants) are computed by Geographical Information System (GIS). In order to choose the proper diameters for each section of the irrigation network, it is necessary to compute the discharges in these sections which were calculated based on the peak month of the dry year. To avoid over-sizing the diameters of the pipelines, they were calculated using Clément first model probabilistic approach, in which, the probability that the flow discharge downstream of each section will not exceed Clément discharge is 95%. Selection of the most suitable pipe is done by an optimization process based on the peak discharge and network layout, (Lamadalena and Sagardoy, 2000). The optimization model that was used to calculate pipe diameters was developed by
Markoč et al. 92
Labye in 1981, and is called Labye’s Iterative Discontinuous Model (LIDM). In order to facilitate the calculation of Clément discharges and LIDM’s optimized diameters, a computer software package called COPAM was used, (Labye et al, 1988).
Cost and Benefit Analysis In order to assess if a project is profitable for general welfare or not, and
what would be the best project alternative, useful economic model is CBA. Two types of analysis are done, financial and economic. The CBA method is conducted in the following phases: determination of the time frame (construction, management and dismantling phase), determination of costs and benefits (in financial analysis, costs are related to the total investment and maintenance costs, while the benefits are obtained from the water agency revenue, while for the economic analysis, costs and benefits of farmers are added considering the situation before and after the implementation of the project), choice of rate of interest according to the Italian standards (Arborea et al, 2017). In order to show project's feasibility, performance indexes are determined (the Net Present Value, the Benefit Cost Ratio, the Internal Rate of Return and the Payback Period).
Environmental part The environmental impact assessment (EIA) of Corato irrigation scheme
project was analyzed through five main categories: natural resources, biological life, socio-economic, political and economic impacts. For each category of impacts, a positive or negative score was given for both project area and nearby areas. The impacts were assessed and scored using the Environmental Impact Assessment Decision Support System (EIDASS) proposed by CEDARE (Abu-Zeid and Bayoumi, 1999).
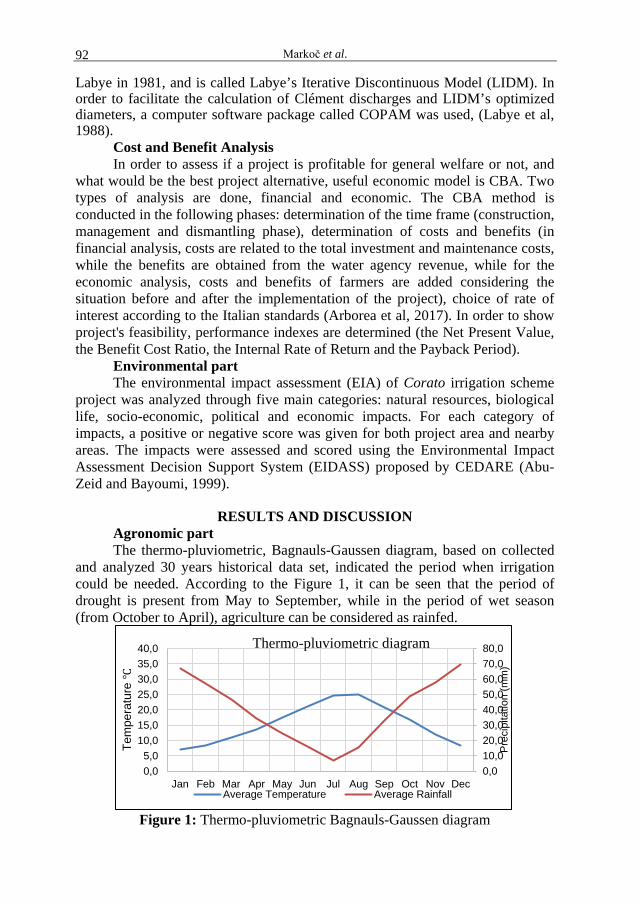
RESULTS AND DISCUSSION Agronomic part The thermo-pluviometric, Bagnauls-Gaussen diagram, based on collected
and analyzed 30 years historical data set, indicated the period when irrigation could be needed. According to the Figure 1, it can be seen that the period of drought is present from May to September, while in the period of wet season (from October to April), agriculture can be considered as rainfed.
Figure 1: Thermo-pluviometric Bagnauls-Gaussen diagram
0,0 10,0 20,0 30,0 40,0 50,0 60,0 70,0 80,0
0,0 5,0
10,0 15,0 20,0 25,0 30,0 35,0 40,0
Jan Feb Mar Apr May Jun Jul Aug Sep Oct Nov Dec
Pre
cipi
tatio
n (m
m)
Tem
pera
ture
℃
Thermo-pluviometric diagram
Average Temperature Average Rainfall
Design of large scale on-demand irrigation system in the agricultural area … 93
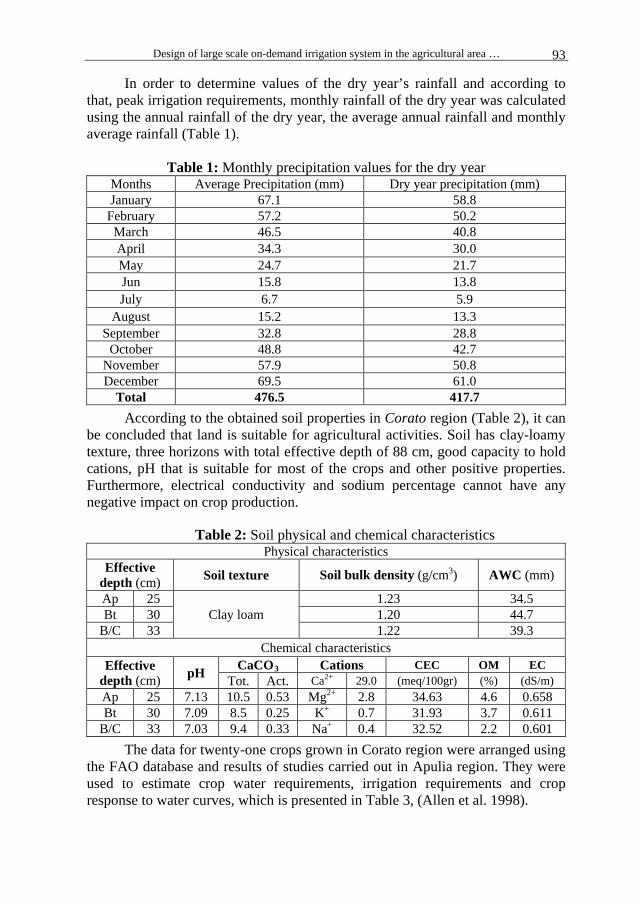
In order to determine values of the dry year’s rainfall and according to that, peak irrigation requirements, monthly rainfall of the dry year was calculated using the annual rainfall of the dry year, the average annual rainfall and monthly average rainfall (Table 1).
Table 1: Monthly precipitation values for the dry year
Months Average Precipitation (mm) Dry year precipitation (mm) January 67.1 58.8
February 57.2 50.2 March 46.5 40.8 April 34.3 30.0 May 24.7 21.7 Jun 15.8 13.8 July 6.7 5.9
August 15.2 13.3 September 32.8 28.8
October 48.8 42.7 November 57.9 50.8 December 69.5 61.0
Total 476.5 417.7 According to the obtained soil properties in Corato region (Table 2), it can
be concluded that land is suitable for agricultural activities. Soil has clay-loamy texture, three horizons with total effective depth of 88 cm, good capacity to hold cations, pH that is suitable for most of the crops and other positive properties. Furthermore, electrical conductivity and sodium percentage cannot have any negative impact on crop production.
Table 2: Soil physical and chemical characteristics Physical characteristics
Effective depth (cm) Soil texture Soil bulk density (g/cm3) AWC (mm)
Ap 25 Clay loam
1.23 34.5 Bt 30 1.20 44.7
B/C 33 1.22 39.3 Chemical characteristics
Effective depth (cm) pH CaCO3 Cations CEC OM EC
Tot. Act. Ca2+ 29.0 (meq/100gr) (%) (dS/m) Ap 25 7.13 10.5 0.53 Mg2+ 2.8 34.63 4.6 0.658 Bt 30 7.09 8.5 0.25 K+ 0.7 31.93 3.7 0.611
B/C 33 7.03 9.4 0.33 Na+ 0.4 32.52 2.2 0.601 The data for twenty-one crops grown in Corato region were arranged using
the FAO database and results of studies carried out in Apulia region. They were used to estimate crop water requirements, irrigation requirements and crop response to water curves, which is presented in Table 3, (Allen et al. 1998).
Markoč et al. 94
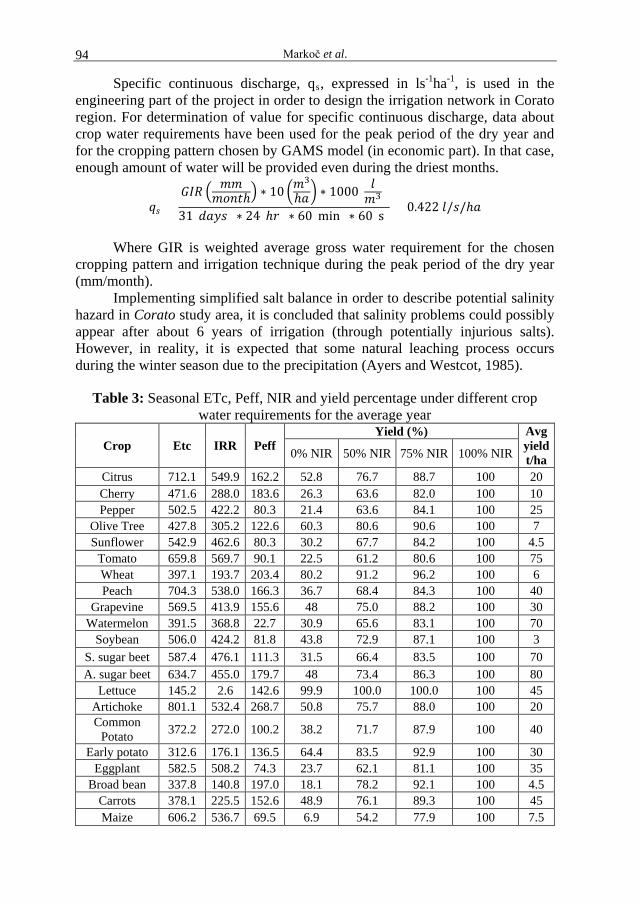
Specific continuous discharge, qs, expressed in ls-1ha-1, is used in the engineering part of the project in order to design the irrigation network in Corato region. For determination of value for specific continuous discharge, data about crop water requirements have been used for the peak period of the dry year and for the cropping pattern chosen by GAMS model (in economic part). In that case, enough amount of water will be provided even during the driest months.
𝑞𝑞𝑠𝑠 =𝐺𝐺𝐺𝐺𝐺𝐺 � 𝑚𝑚𝑚𝑚
𝑚𝑚𝑚𝑚𝑚𝑚𝑚𝑚ℎ� ∗ 10 �𝑚𝑚3
ℎ𝑎𝑎� ∗ 1000( 𝑙𝑙𝑚𝑚3)
31(𝑑𝑑𝑎𝑎𝑑𝑑𝑠𝑠) ∗ 24(ℎ𝑟𝑟) ∗ 60(min) ∗ 60(s)= 0.422 𝑙𝑙/𝑠𝑠/ℎ𝑎𝑎
Where GIR is weighted average gross water requirement for the chosen
cropping pattern and irrigation technique during the peak period of the dry year (mm/month).
Implementing simplified salt balance in order to describe potential salinity hazard in Corato study area, it is concluded that salinity problems could possibly appear after about 6 years of irrigation (through potentially injurious salts). However, in reality, it is expected that some natural leaching process occurs during the winter season due to the precipitation (Ayers and Westcot, 1985).
Table 3: Seasonal ETc, Peff, NIR and yield percentage under different crop water requirements for the average year
Crop Etc IRR Peff Yield (%) Avg
yield t/ha 0% NIR 50% NIR 75% NIR 100% NIR
Citrus 712.1 549.9 162.2 52.8 76.7 88.7 100 20 Cherry 471.6 288.0 183.6 26.3 63.6 82.0 100 10 Pepper 502.5 422.2 80.3 21.4 63.6 84.1 100 25
Olive Tree 427.8 305.2 122.6 60.3 80.6 90.6 100 7 Sunflower 542.9 462.6 80.3 30.2 67.7 84.2 100 4.5
Tomato 659.8 569.7 90.1 22.5 61.2 80.6 100 75 Wheat 397.1 193.7 203.4 80.2 91.2 96.2 100 6 Peach 704.3 538.0 166.3 36.7 68.4 84.3 100 40
Grapevine 569.5 413.9 155.6 48 75.0 88.2 100 30 Watermelon 391.5 368.8 22.7 30.9 65.6 83.1 100 70
Soybean 506.0 424.2 81.8 43.8 72.9 87.1 100 3 S. sugar beet 587.4 476.1 111.3 31.5 66.4 83.5 100 70 A. sugar beet 634.7 455.0 179.7 48 73.4 86.3 100 80
Lettuce 145.2 2.6 142.6 99.9 100.0 100.0 100 45 Artichoke 801.1 532.4 268.7 50.8 75.7 88.0 100 20 Common
Potato 372.2 272.0 100.2 38.2 71.7 87.9 100 40
Early potato 312.6 176.1 136.5 64.4 83.5 92.9 100 30 Eggplant 582.5 508.2 74.3 23.7 62.1 81.1 100 35
Broad bean 337.8 140.8 197.0 18.1 78.2 92.1 100 4.5 Carrots 378.1 225.5 152.6 48.9 76.1 89.3 100 45 Maize 606.2 536.7 69.5 6.9 54.2 77.9 100 7.5
Design of large scale on-demand irrigation system in the agricultural area … 95
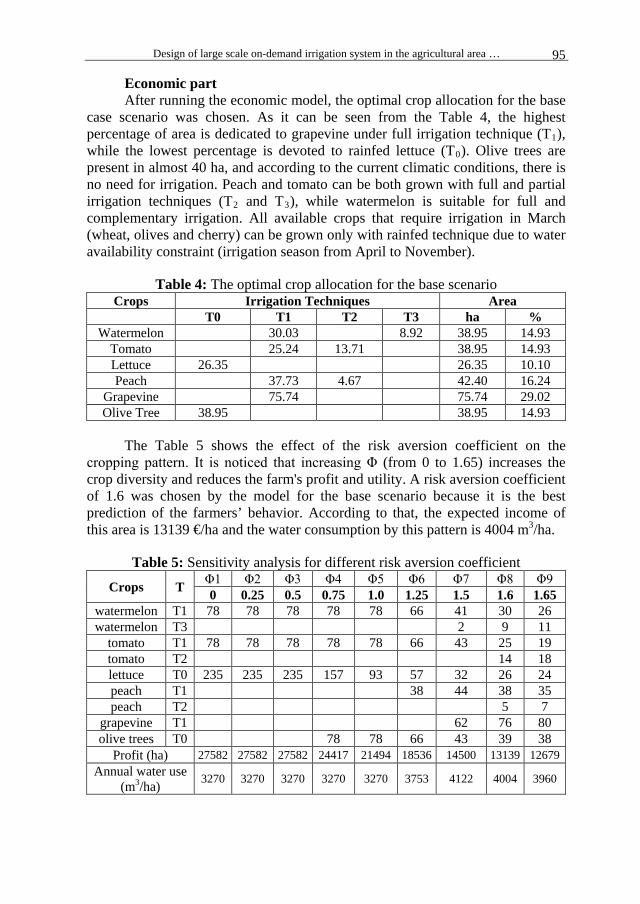
Economic part After running the economic model, the optimal crop allocation for the base
case scenario was chosen. As it can be seen from the Table 4, the highest percentage of area is dedicated to grapevine under full irrigation technique (T1), while the lowest percentage is devoted to rainfed lettuce (T0). Olive trees are present in almost 40 ha, and according to the current climatic conditions, there is no need for irrigation. Peach and tomato can be both grown with full and partial irrigation techniques (T2 and T3), while watermelon is suitable for full and complementary irrigation. All available crops that require irrigation in March (wheat, olives and cherry) can be grown only with rainfed technique due to water availability constraint (irrigation season from April to November).
Table 4: The optimal crop allocation for the base scenario Crops Irrigation Techniques Area
T0 T1 T2 T3 ha % Watermelon 30.03 8.92 38.95 14.93
Tomato 25.24 13.71 38.95 14.93 Lettuce 26.35 26.35 10.10 Peach 37.73 4.67 42.40 16.24
Grapevine 75.74 75.74 29.02 Olive Tree 38.95 38.95 14.93
The Table 5 shows the effect of the risk aversion coefficient on the cropping pattern. It is noticed that increasing Φ (from 0 to 1.65) increases the crop diversity and reduces the farm's profit and utility. A risk aversion coefficient of 1.6 was chosen by the model for the base scenario because it is the best prediction of the farmers’ behavior. According to that, the expected income of this area is 13139 €/ha and the water consumption by this pattern is 4004 m3/ha.
Table 5: Sensitivity analysis for different risk aversion coefficient
Crops T Φ1 Φ2 Φ3 Φ4 Φ5 Φ6 Φ7 Φ8 Φ9 0 0.25 0.5 0.75 1.0 1.25 1.5 1.6 1.65
watermelon T1 78 78 78 78 78 66 41 30 26 watermelon T3 2 9 11
tomato T1 78 78 78 78 78 66 43 25 19 tomato T2 14 18 lettuce T0 235 235 235 157 93 57 32 26 24 peach T1 38 44 38 35 peach T2 5 7
grapevine T1 62 76 80 olive trees T0 78 78 66 43 39 38
Profit (ha) 27582 27582 27582 24417 21494 18536 14500 13139 12679 Annual water use
(m3/ha) 3270 3270 3270 3270 3270 3753 4122 4004 3960
Markoč et al. 96
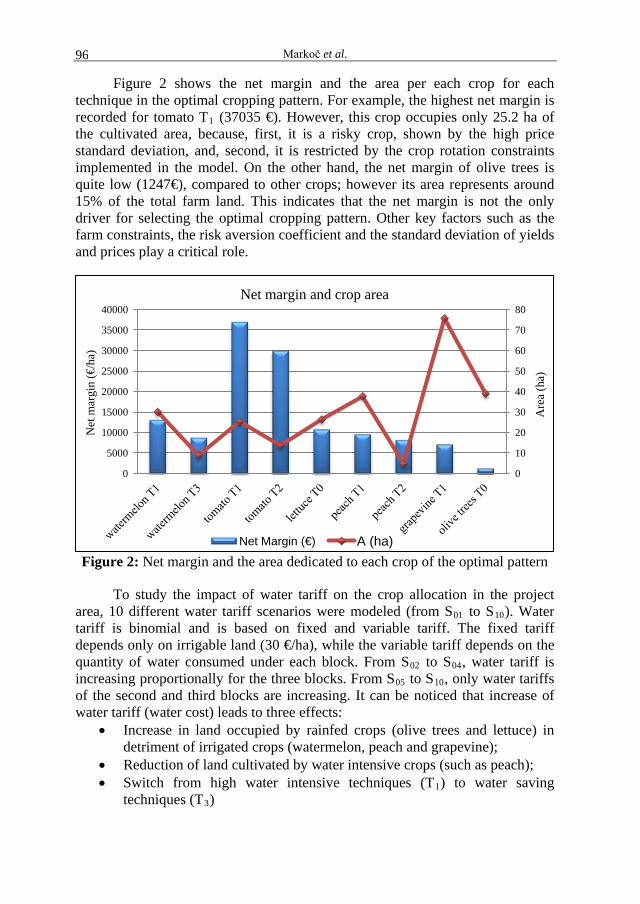
Figure 2 shows the net margin and the area per each crop for each technique in the optimal cropping pattern. For example, the highest net margin is recorded for tomato T1 (37035 €). However, this crop occupies only 25.2 ha of the cultivated area, because, first, it is a risky crop, shown by the high price standard deviation, and, second, it is restricted by the crop rotation constraints implemented in the model. On the other hand, the net margin of olive trees is quite low (1247€), compared to other crops; however its area represents around 15% of the total farm land. This indicates that the net margin is not the only driver for selecting the optimal cropping pattern. Other key factors such as the farm constraints, the risk aversion coefficient and the standard deviation of yields and prices play a critical role.
Figure 2: Net margin and the area dedicated to each crop of the optimal pattern
To study the impact of water tariff on the crop allocation in the project area, 10 different water tariff scenarios were modeled (from S01 to S10). Water tariff is binomial and is based on fixed and variable tariff. The fixed tariff depends only on irrigable land (30 €/ha), while the variable tariff depends on the quantity of water consumed under each block. From S02 to S04, water tariff is increasing proportionally for the three blocks. From S05 to S10, only water tariffs of the second and third blocks are increasing. It can be noticed that increase of water tariff (water cost) leads to three effects:
• Increase in land occupied by rainfed crops (olive trees and lettuce) in detriment of irrigated crops (watermelon, peach and grapevine);
• Reduction of land cultivated by water intensive crops (such as peach); • Switch from high water intensive techniques (T1) to water saving
techniques (T3)
0
10
20
30
40
50
60
70
80
0
5000
10000
15000
20000
25000
30000
35000
40000
Are
a (h
a)
Net
mar
gin
(€/h
a)
Net margin and crop area
Net Margin (€) A (ha)
Design of large scale on-demand irrigation system in the agricultural area … 97
The choice of the optimal water tariff depends on compromising between the needs of: the farmers, the water agency, and all the society members. In order to choose the best scenario, the multi-criteria method, called Compromise Programing was used. In this method, a weight is given to each purpose according to its degree of importance. The highest weight was given to the minimization of water consumption, which has to be interest of all stakeholders, followed by the maximization of farm profit which is important for the economic viability of the irrigation project. And based on these assumptions, the best scenario was chosen as S05, because it is the best in water conservation without significantly affecting the farmers’ profit, (Romero and Rahman, 2003).
Engineering part Water for the study area is supplied by two wells located at elevations of
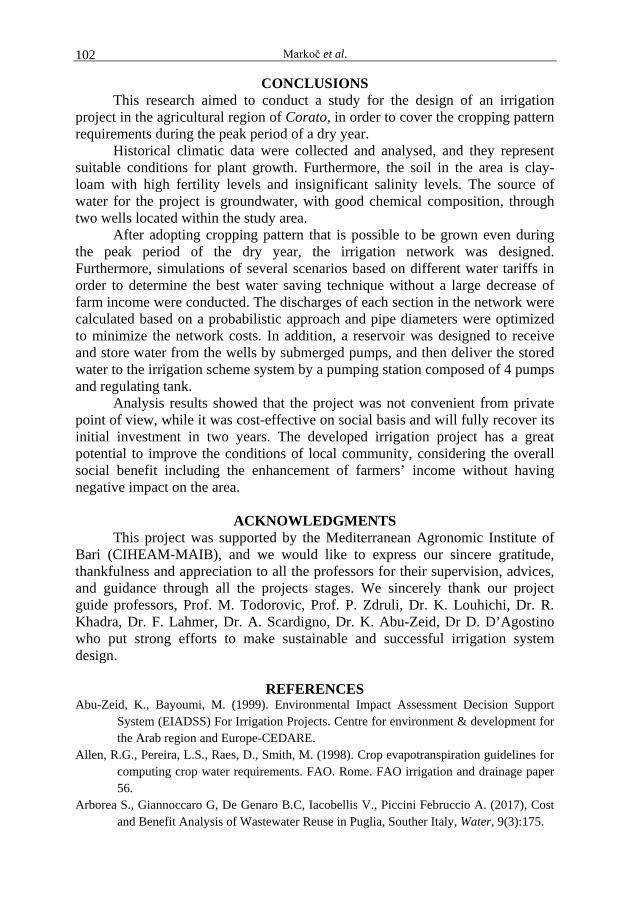
215 m a.s.l. and 223,5 m a.s.l. The first well is located at a distance of 298,3 meters from the reservoir, while the second is at distance of 350,9 meters. Water is delivered by set of four pumps, designed to provide the required discharge of the network and satisfy a minimum pressure at the hydrant level (20 m). A pressurized tank is installed just after the pumping station in order to regulate and control the pressure of the pumps. In addition to the hydrants, the network consists of several tools: 2 air valves to remove air excess from the network, 3 relief valves to clean the network and remove all present sediments and 24 gates to control the operation and maintenance of the network. By combining three farms together or less, modules of 5 ls-1 and 10 ls-1 are used for hydrants, while the elasticity (farmers' freedom) is fixed at 3. A hydrant of 5 ls-1 can serve an area up to 4 ha, while a hydrant with the module of 10 ls-1 serve maximum of 7,65 ha. The total number of hydrants installed is 61, and 38 of them are with the module of 5 ls-1 and the rest, 23, have the module of 10 ls-1 (Figure 5).
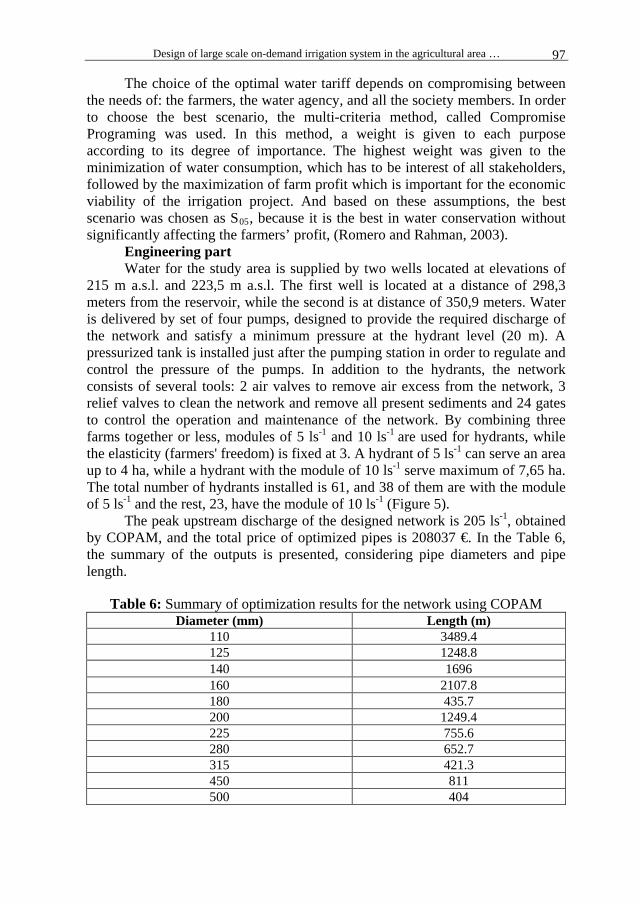
The peak upstream discharge of the designed network is 205 ls-1, obtained by COPAM, and the total price of optimized pipes is 208037 €. In the Table 6, the summary of the outputs is presented, considering pipe diameters and pipe length.
Table 6: Summary of optimization results for the network using COPAM Diameter (mm) Length (m)
110 3489.4 125 1248.8 140 1696 160 2107.8 180 435.7 200 1249.4 225 755.6 280 652.7 315 421.3 450 811 500 404
Markoč et al. 98
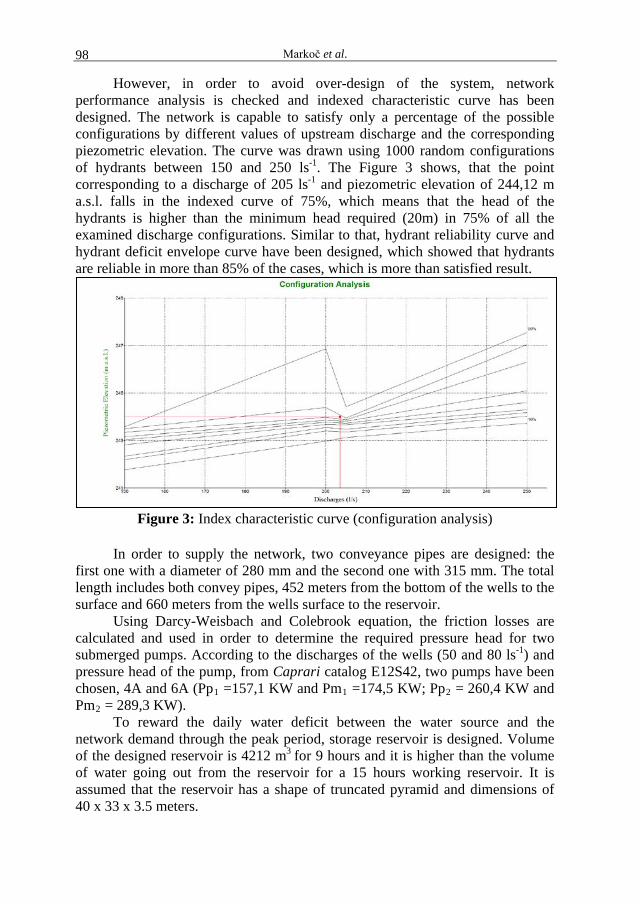
However, in order to avoid over-design of the system, network performance analysis is checked and indexed characteristic curve has been designed. The network is capable to satisfy only a percentage of the possible configurations by different values of upstream discharge and the corresponding piezometric elevation. The curve was drawn using 1000 random configurations of hydrants between 150 and 250 ls-1. The Figure 3 shows, that the point corresponding to a discharge of 205 ls-1 and piezometric elevation of 244,12 m a.s.l. falls in the indexed curve of 75%, which means that the head of the hydrants is higher than the minimum head required (20m) in 75% of all the examined discharge configurations. Similar to that, hydrant reliability curve and hydrant deficit envelope curve have been designed, which showed that hydrants are reliable in more than 85% of the cases, which is more than satisfied result.
Figure 3: Index characteristic curve (configuration analysis)
In order to supply the network, two conveyance pipes are designed: the
first one with a diameter of 280 mm and the second one with 315 mm. The total length includes both convey pipes, 452 meters from the bottom of the wells to the surface and 660 meters from the wells surface to the reservoir.
Using Darcy-Weisbach and Colebrook equation, the friction losses are calculated and used in order to determine the required pressure head for two submerged pumps. According to the discharges of the wells (50 and 80 ls-1) and pressure head of the pump, from Caprari catalog E12S42, two pumps have been chosen, 4A and 6A (Pp1 =157,1 KW and Pm1 =174,5 KW; Pp2 = 260,4 KW and Pm2 = 289,3 KW).
To reward the daily water deficit between the water source and the network demand through the peak period, storage reservoir is designed. Volume of the designed reservoir is 4212 m3 for 9 hours and it is higher than the volume of water going out from the reservoir for a 15 hours working reservoir. It is assumed that the reservoir has a shape of truncated pyramid and dimensions of 40 x 33 x 3.5 meters.
Design of large scale on-demand irrigation system in the agricultural area … 99
The pumping station design has been made to supply the network with maximum upstream discharge (Qclé=205 ls-1), and at the same time maintaining an upstream pressure sufficiently enough to ensure a minimum pressure head in each hydrant. 4 pumps are selected, type (80-160) and 2900 rpm-50 Hz (Pp = 17,94 KW and Pm = 19,94 KW). Pressurized regulating tank is designed in order to control the opening and the closing of the pump. The volume of the pressurized tank is obtained as 12 m3, and the dimensions of: diameter of 2,2 m, the height of 3,15 m with an additional 50 cm for sensors in the tank to turn on and turn off the pumps. An important step in the project, more precisely, in engineering part is the total cost of the project, presented in the Table 7.
Table 7: Final cost of the project
Cost of Pipes 298037 Excavation Cost 226011
Technical Equipment 146015 Expropriation 104037
Concrete for reservoir and manholes 59108 Building cost of pumping station 102900
Electrical Equipment 25000 Protection works 2000
TOTAL (1) 963,108 Cost of Design (3%) 28893
Supervision of work (1%) 9631 Topographic Studies (1%) 9631
TOTAL (2) 48155 TOTAL ==> (1) + (2) 1,011,263
Taxes (20%) 202253 TOTAL (including taxes) 1,213,515
Maintenance cost (8%) 97081 FINAL COST 1,310,596
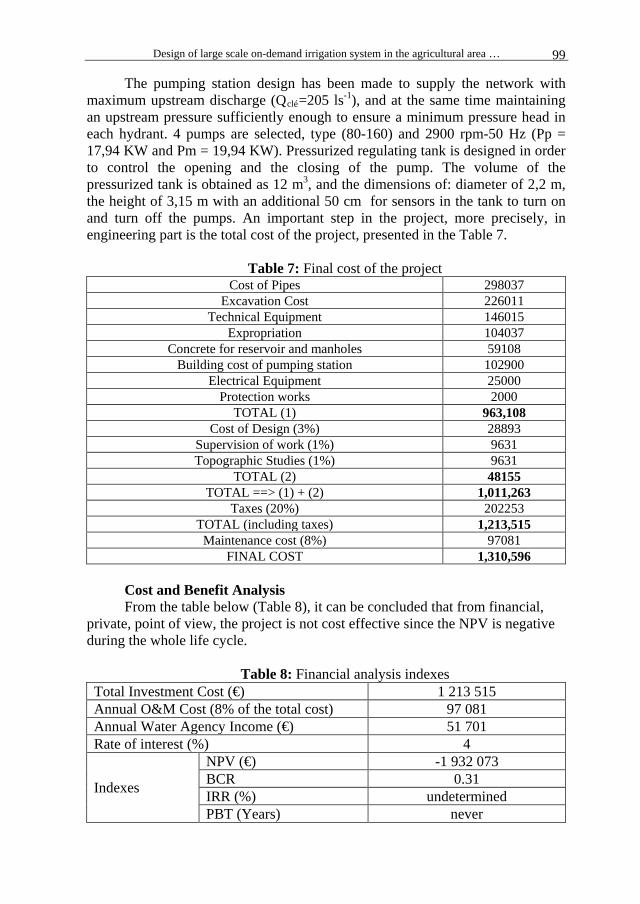
Cost and Benefit Analysis From the table below (Table 8), it can be concluded that from financial,
private, point of view, the project is not cost effective since the NPV is negative during the whole life cycle.
Table 8: Financial analysis indexes
Total Investment Cost (€) 1 213 515 Annual O&M Cost (8% of the total cost) 97 081 Annual Water Agency Income (€) 51 701 Rate of interest (%) 4
Indexes
NPV (€) -1 932 073 BCR 0.31 IRR (%) undetermined PBT (Years) never
Markoč et al. 100
Furthermore, the income of water agency from chosen water tariff cannot cover the annual costs of operation and maintenance (O&M). When IRR is lower than discount rate, which is 4% in our case, it means that our investment costs cannot be returned as revenue.
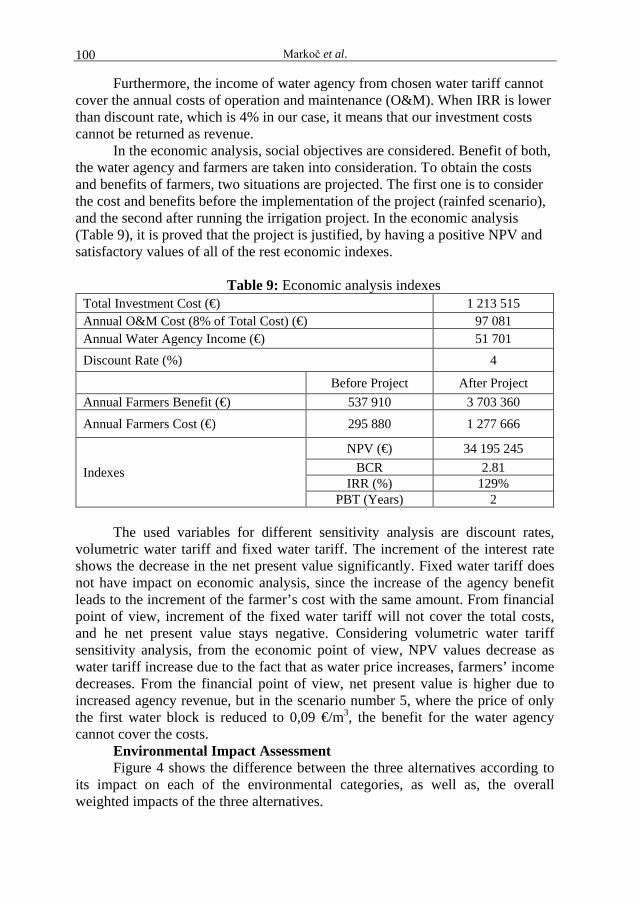
In the economic analysis, social objectives are considered. Benefit of both, the water agency and farmers are taken into consideration. To obtain the costs and benefits of farmers, two situations are projected. The first one is to consider the cost and benefits before the implementation of the project (rainfed scenario), and the second after running the irrigation project. In the economic analysis (Table 9), it is proved that the project is justified, by having a positive NPV and satisfactory values of all of the rest economic indexes.
Table 9: Economic analysis indexes
Total Investment Cost (€) 1 213 515 Annual O&M Cost (8% of Total Cost) (€) 97 081 Annual Water Agency Income (€) 51 701 Discount Rate (%) 4
Before Project After Project Annual Farmers Benefit (€) 537 910 3 703 360 Annual Farmers Cost (€) 295 880 1 277 666
Indexes
NPV (€) 34 195 245 BCR 2.81
IRR (%) 129% PBT (Years) 2
The used variables for different sensitivity analysis are discount rates, volumetric water tariff and fixed water tariff. The increment of the interest rate shows the decrease in the net present value significantly. Fixed water tariff does not have impact on economic analysis, since the increase of the agency benefit leads to the increment of the farmer’s cost with the same amount. From financial point of view, increment of the fixed water tariff will not cover the total costs, and he net present value stays negative. Considering volumetric water tariff sensitivity analysis, from the economic point of view, NPV values decrease as water tariff increase due to the fact that as water price increases, farmers’ income decreases. From the financial point of view, net present value is higher due to increased agency revenue, but in the scenario number 5, where the price of only the first water block is reduced to 0,09 €/m3, the benefit for the water agency cannot cover the costs.
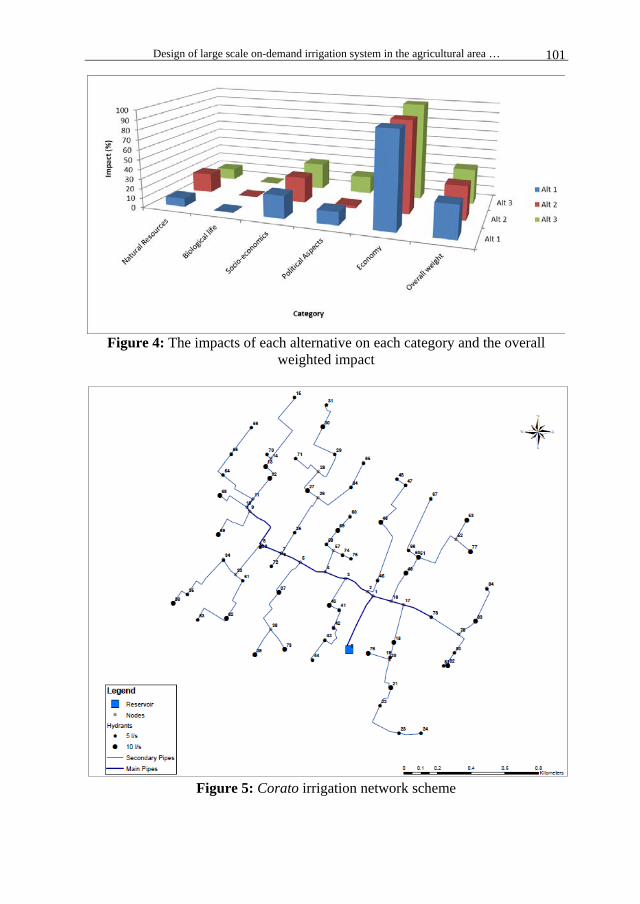
Environmental Impact Assessment Figure 4 shows the difference between the three alternatives according to
its impact on each of the environmental categories, as well as, the overall weighted impacts of the three alternatives.
Design of large scale on-demand irrigation system in the agricultural area … 101
Figure 4: The impacts of each alternative on each category and the overall
weighted impact
Figure 5: Corato irrigation network scheme
Markoč et al. 102
CONCLUSIONS This research aimed to conduct a study for the design of an irrigation
project in the agricultural region of Corato, in order to cover the cropping pattern requirements during the peak period of a dry year.
Historical climatic data were collected and analysed, and they represent suitable conditions for plant growth. Furthermore, the soil in the area is clay-loam with high fertility levels and insignificant salinity levels. The source of water for the project is groundwater, with good chemical composition, through two wells located within the study area.
After adopting cropping pattern that is possible to be grown even during the peak period of the dry year, the irrigation network was designed. Furthermore, simulations of several scenarios based on different water tariffs in order to determine the best water saving technique without a large decrease of farm income were conducted. The discharges of each section in the network were calculated based on a probabilistic approach and pipe diameters were optimized to minimize the network costs. In addition, a reservoir was designed to receive and store water from the wells by submerged pumps, and then deliver the stored water to the irrigation scheme system by a pumping station composed of 4 pumps and regulating tank.
Analysis results showed that the project was not convenient from private point of view, while it was cost-effective on social basis and will fully recover its initial investment in two years. The developed irrigation project has a great potential to improve the conditions of local community, considering the overall social benefit including the enhancement of farmers’ income without having negative impact on the area.
ACKNOWLEDGMENTS This project was supported by the Mediterranean Agronomic Institute of
Bari (CIHEAM-MAIB), and we would like to express our sincere gratitude, thankfulness and appreciation to all the professors for their supervision, advices, and guidance through all the projects stages. We sincerely thank our project guide professors, Prof. M. Todorovic, Prof. P. Zdruli, Dr. K. Louhichi, Dr. R. Khadra, Dr. F. Lahmer, Dr. A. Scardigno, Dr. K. Abu-Zeid, Dr D. D’Agostino who put strong efforts to make sustainable and successful irrigation system design.
REFERENCES
Abu-Zeid, K., Bayoumi, M. (1999). Environmental Impact Assessment Decision Support System (EIADSS) For Irrigation Projects. Centre for environment & development for the Arab region and Europe-CEDARE.
Allen, R.G., Pereira, L.S., Raes, D., Smith, M. (1998). Crop evapotranspiration guidelines for computing crop water requirements. FAO. Rome. FAO irrigation and drainage paper 56.
Arborea S., Giannoccaro G, De Genaro B.C, Iacobellis V., Piccini Februccio A. (2017), Cost and Benefit Analysis of Wastewater Reuse in Puglia, Souther Italy, Water, 9(3):175.
Design of large scale on-demand irrigation system in the agricultural area … 103
Ayers, R.S. and Westcot, D.W. (1985). Water quality for agriculture. FAO. Rome. FAO irrigation and drainage paper 29. Rev.1.
Hazell, P. B. R., Norton, R.D. (1986). Mathematical programming for economic analysis in agriculture, Macmillan.
Labye, Y., Olson, M.A., Galand, A. and Tsiourtis, N. (1988). Design and optimization of irrigation distribution networks. FAO, Rome. FAO irrigation and drainage paper, 44.
Lamadalena, N. and Sagardoy, J.A. (2000). Performance analysis of on demand pressurized irrigation systems. FAO, Rome. Irrigation and drainage paper, 59.
Istituto di Servizi per il Mercato Agricolo Alimentare (ISMEA). (available at http://www.ismea.it/flex/cm/pages/ServeBLOB.php/L/IT/IDPagina/1)
Romero, C., Rehman, T. (2003). Multiple Criteria Analysis for Agricultural Decisions, Second Edition, Volume 11.
Smith M., Kivumbi D, Heng L.K. (1992), Use of the FAO Cropwat model in deficit irrigation studies, FAO, Rome, Italy.