design and development of data mart for animal resources
TRANSCRIPT
O
D
AI
a
A
R
R
2
A
K
A
D
D
O
D
D
1
Prirkan
0d
c o m p u t e r s a n d e l e c t r o n i c s i n a g r i c u l t u r e 6 4 ( 2 0 0 8 ) 111–119
avai lab le at www.sc iencedi rec t .com
journa l homepage: www.e lsev ier .com/ locate /compag
riginal papers
esign and development of data mart for animal resources
nil Rai ∗, Vipin Dubey, K.K. Chaturvedi, P.K. Malhotrandian Agricultural Statistics Research Institute, Library Avenue, New Delhi 110012, India
r t i c l e i n f o
rticle history:
eceived 23 August 2006
eceived in revised form
7 March 2008
ccepted 19 April 2008
eywords:
nimal resources
ata warehouse
imensional modeling
LAP
ata mart
ecision support system
a b s t r a c t
Planners, researchers, development agencies and farmers require information on animal
resources for further studies and evolving realistic strategies for improvement and rearing
of livestock and poultry. Data is also required for keeping watch on prices and movement
of animal products, animal feed and establishment of services such as veterinary hos-
pitals, artificial insemination (AI) centers, meat and dairy industries, etc. Further, there
is a need to study animal resources in relation to other aspects of agriculture, such as
soils, vegetation, agro-meteorology, socio-economic, land use, water resources for overall
development of agricultural production system. Indian Agricultural Statistics Research Insti-
tute (IASRI), New Delhi has designed and implemented a Central Data Warehouse (CDW)
under a National Agricultural Technology Project (NATP) Mission Mode sub-project entitled
“Integrated National Agricultural Resources Information System (INARIS)”. In this CDW, 13
different data marts related to various subjects in agriculture were designed, implemented
and integrated. In this article, attempt was made to discuss concepts and problems of dimen-
sional modeling of the animal data mart in relation to available source data on livestock
resources in the country. Alternative solutions to specific problems were also discussed
along with the solution implemented for modeling of this data mart. The complete process
of building On-line Analytical Processing (OLAP) system for research managers includ-
ing inbuilt technique of data quality and consistency checks to be implemented is being
described with special reference to animal resource management. This article will provide
guidelines for design and development of similar complex data marts in agricultural sector,
particularly in the field of livestock management.
Animal wealth of India is represented by a broad spectrum
. Introduction
lanners, researchers, development agencies and farmersequire information on animal resources for further stud-es and evolving realistic strategies for improvement andearing of livestock and poultry. Data is also required for
eeping watch on prices and movement of animal products,nimal feed and establishment of services such as veteri-ary hospitals, artificial insemination (AI) centers, meat and∗ Corresponding author. Tel.: +91 11 25847122 25x4290; fax: +91 11 2584E-mail addresses: [email protected], [email protected] (A. Rai).
168-1699/$ – see front matter © 2008 Elsevier B.V. All rights reserved.oi:10.1016/j.compag.2008.04.009
© 2008 Elsevier B.V. All rights reserved.
dairy industries, etc. Further, there is a need to study ani-mal resources in relation to other aspects of agriculture, suchas soils, vegetation, agro-meteorology, socio-economic, landuse, water resources for overall development of agriculturalproduction system.
1564.
of native breeds of cattle (30), buffalo (10), goat (20), sheep (42),equines (6) and camels (8). In addition, several other animalssuch as poultry, duck, geese, quails, yak, mithun, pigs are also
i n a g
112 c o m p u t e r s a n d e l e c t r o n i c simportant components of animal wealth of India. The live-stock resources of India contribute 29% in the gross domesticproduct of the country. Statistical information on livestockresources in the country is being collected by different organi-zations, through integrated livestock survey, livestock censusand ad hoc studies. Livestock census is being conducted afterevery 5 years in India. This provides age and sex wise data atdistrict level for different categories of animals. State AnimalHusbandry Departments and National Sample Survey Organi-zation are conducting integrated livestock survey to get infor-mation on livestock products, prices and utilization of animalproducts all over the country. Surveys are also being conductedby different research organizations on estimation and assess-ments related to animal diseases, animal genetic resources,migration of livestock, etc. Still huge data gap persists in thissector. Information on livestock population and products suchas poultry meat production, production of milk by products,numbers of animals from different breeds of a species, etc. arenot available. Data gaps in terms of geographical coverage forcollection of various information related livestock numbersand products still exist in the country. The problems of iden-tification of data gaps, monitoring of data quality, integratedanalysis of livestock sector and information dissemination tostakeholders exists due to non-availability of digital central-ized repository of information for livestock sector.
A data warehouse is a read only analytical database whichis used as a foundation of a decision support system. In otherwords, a data warehouse is a repository of integrated informa-tion of operational systems, available for queries and analysisto provide decision support. In general, data warehouses aresubject oriented, integrated, time variant and non-volatile(Inmon, 1995, 2002). Data mart is a logical subset of an orga-nizational data warehouse. The dimensional data marts areorganized by a specific domain or by subject area. Basically,data warehouses are developed to enhance profitability, trans-parency and visibility of an organization. The design andimplementation of a data warehouse present many chal-lenges, i.e. data quality, accessibility and appropriate design(Agosta, 2001). It is reported that 40% of the data warehousedevelopment efforts fails to meet design objectives (Kelly,1997; Whiting, 2003). Presently, popularity of this technologyis in banking, retail marketing, telecommunication, manufac-turing, transportation etc. (Inmon, 2002; Whiting, 2003; Hofferet al., 2005). However, adoption of this technology in gov-ernment sector is slow due to data ownership, data privacy,data security and mainly due to lack in attitude (Bieber, 1998;Harper, 2004). United States Department of Agriculture (USDA)has developed one of the earliest data warehouse in gov-ernment sector. This includes information from primary aswell as secondary sources through various agricultural sur-veys, census and agribusiness (Yost, 2000). The informationon pests, pesticides, and meteorological parameters from gov-ernment of Pakistan has been integrated in the form of datawarehouse (Abdullah et al., 2004).
Design and development of animal resource data martis very important not only for decision making but also
for understanding and solving problems related to livestocksector for sustainable development. Relationships of ani-mal resources with other sectors of the country can also bestudied through integration of information related to vari-r i c u l t u r e 6 4 ( 2 0 0 8 ) 111–119
ous sectors of agriculture with livestock sector. A missionmode sub-project entitled “Integrated National AgriculturalResources Information System (INARIS)” was taken up underWorld Bank funded National Agricultural Technology Project(NATP). The mission set for this project was to designand develop a state-of-art, flexible Central Data Warehouse(CDW) of agricultural resources of the country at IndianAgricultural Statistics Research Institute (IASRI), New Delhi(http://agdw.iasri.res.in/). This project has been implementedwith active collaboration and support from 13 other organi-zations from Indian Council of Agricultural Research (ICAR),New Delhi (Rai et al., 2007).
In this article process of design and development of a datamart of animal resources in India has been described. The con-cepts and problems of dimensional modeling of the animaldata mart in relation to available data on livestock resourcesin the country has been discussed. Alternative solutions tospecific problems were also discussed along with the solutionimplemented for modeling of this data mart. The process offact builds adopted for building various fact tables and briefdescription about each fact has been mentioned in this article.In order to maintain the data quality of the data mart, numberof consistency checks on the source data was applied whilemoving it to the staging area. The process of extraction anddata transformation at the various stages of data mapping arealso described. The process of automation for updating datamart and On-line Analytical Processing (OLAP) functionalitiesare presented in this article. Results of end user evaluationsurveys of INARIS project have been presented to demonstratethe utility of this data warehouse.
2. Dimensional modeling of animal datamart
The data warehouse database is maintained separately fromoperational databases. The organizational data warehousesare projected to hundreds of gigabytes or terabytes in size.Therefore, basic design and implementation issue of a datawarehouse is query performance. In data warehouse, query,mostly ad hoc in nature, can access millions of records andcan perform a lot of scans, joins and aggregates (Gupta andMumick, 1995; O’Neil and Graefe, 1995; O’Neil and Quass,1997). In this system, query throughput and response time aremore important than transaction throughput.
In order to improve the query performance, the data ina data warehouse is typically modeled for multidimensionalperspective. In case of data warehouse technology, the keyperformance indicators are known as fact. Facts are additive,non-additive and semi-additive. These are the numeric dataitems used to satisfy all calculation options that are of interestto the end user. The table which provides context to the factis called dimensional table. The details of information can bevisualized further to the lower levels, which are also knownas grain level. Granularity of information is the lowest level ofavailable fact information. Data storage in the data warehouse
database is in the form of a multidimensional model, knownas a cube.In a data mart design, grain level of fact tables is to bedecided first (Kimball, 1996, 1998; Kimball and Ross, 2002). The
a g r i c u l t u r e 6 4 ( 2 0 0 8 ) 111–119 113
da
ilTapiee
((i((
rttbaecdllsTN(
agtlhwisahi
2
To(s
disahlm
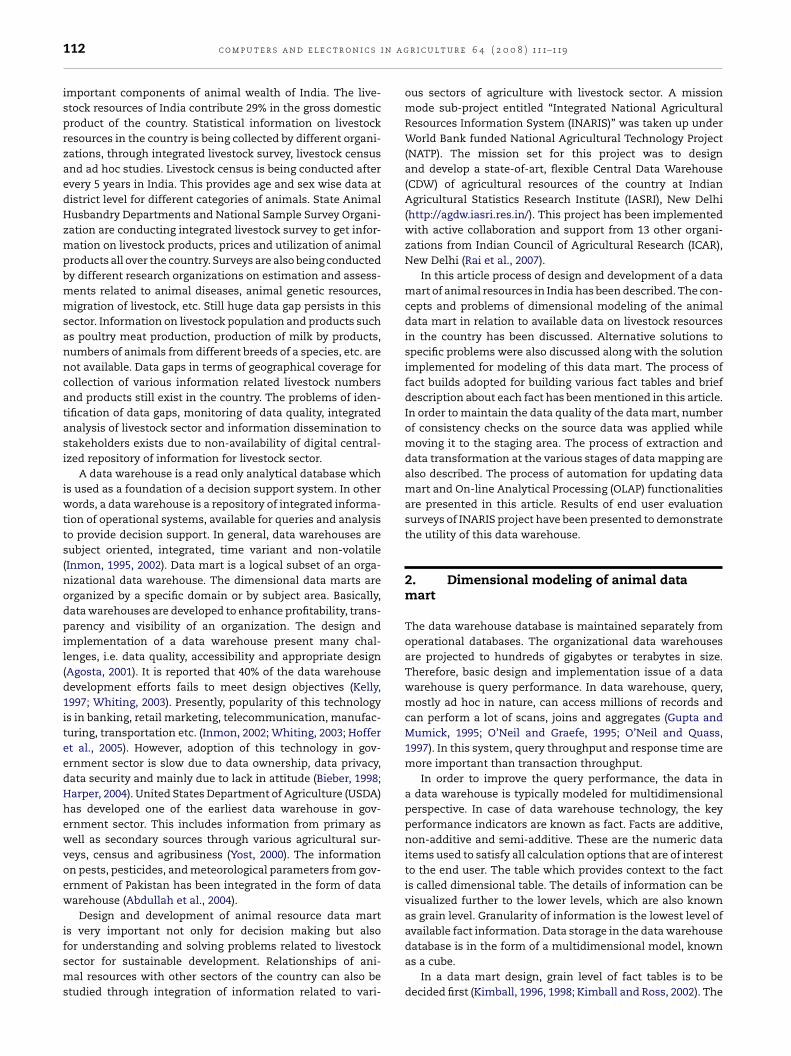
for every possible path in the above hierarchy.Fig. 2 shows the Location hierarchical structure of the
livestock information available in the source system. Simi-lar to the Animal hierarchy, it also has three different paths.
c o m p u t e r s a n d e l e c t r o n i c s i n
ecision regarding granularity depends on the level of detailt which fact need to be addressed (Bonifati et al., 2001).
Animal resources in India are highly diverse. Therefore,nformation on different aspects of animal resources is col-ected through a large number of data collection agencies.he problem is further compounded by the fact that therere no common standards that are applied in data collectionrocedures. Designing a data mart to integrate the collected
nformation poses a formidable challenge to any data mod-ler. The available information of animal resources has beenxtracted from following operational source systems:
(i) Livestock breed database.ii) Livestock population database.ii) Livestock infrastructure and production database.iv) Livestock products and utilization database.v) Livestock import/export database.
Livestock breed database at national level has informationelated to breeds of different species of livestock animals andheir characterizations. Livestock population database at dis-rict level has information from livestock census, which iseing held after every 5 years. The information of livestockre categorized with respect to Sex, Age, Working Categories,tc. Information related to livestock infrastructure is beingollected occasionally at district level. Information related toifferent livestock products and its utilization is being col-
ected every year through integrated livestock survey at districtevel. Data related to import and exports of various live-tock products are available on yearly basis at country level.hese databases were developed and populated in Oracle 9i atational Bureau of Animal Genetic Resources (NBAGR), Karnal
India).In order to use the information at micro/macro planning
nd decision-making level (Chen et al., 2003) data is to be inte-rated and aggregated properly. Further, it is also importanto capture information at its lowest level so that there is nooss of information due to its aggregation from lower level toigher level data flow hierarchy. Therefore, several fact tablesere designed to capture information at its lowest level. The
nformation from these databases were extracted from theource system and after suitable cleaning, transformation andggregations, moved into staging area of the central data ware-ouse. Consistency checks were also applied while extracting
nformation from the source system.
.1. Dimensions and hierarchies in the data mart
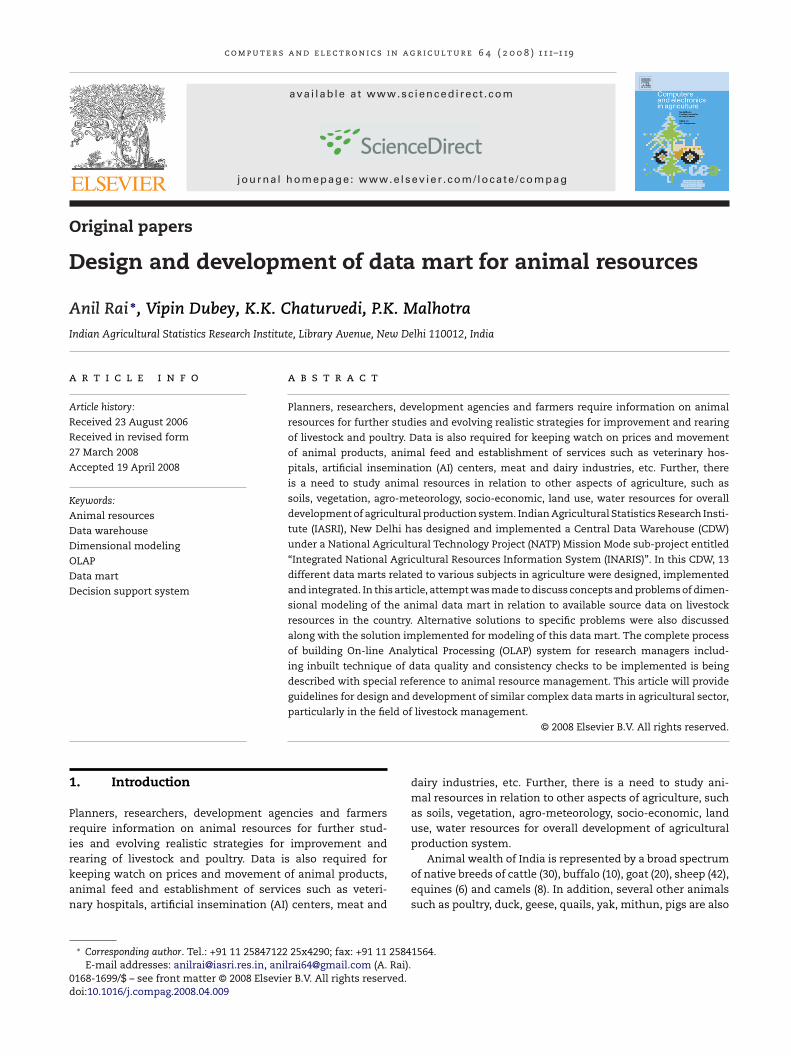
hree important dimensions were identified for developmentf animal resource data mart, i.e. (i) Animal (ii) Location and
iii) Time. Animal is a subject dimension. The hierarchicaltructure of this dimension has been given in Fig. 1.
Fig. 1 shows alternate multiple path hierarchy of animalimension. It has three alternate paths. These paths were
dentified after careful analysis of information available inource systems. This is a non-covering hierarchy (Pedersen et
l., 2001; Malinowski and Zimanyi, 2004) which is a generalizedierarchy with the additional restriction that at the schemaevel the alternative paths are obtained by skipping one orore intermediate levels. Animal hierarchy has three differ-
Fig. 1 – Hierarchical structure of animal dimension.
ent paths. First path starts from Animal and ends on WorkingCategory via Species, Gender and Age. The figures in brack-ets indicate cardinalities of respective levels. Here, WorkingCategory cardinality depends on animal species. Therefore,wi indicates the number of categories of ith species. Secondpath of this hierarchy is from Animal to Maturity via Speciesand Gender. Third and last path is from Animal to WorkingCategory via Species, Breed, Gender and Age.
Several approaches were proposed in the literature to dealwith these kinds of hierarchies, i.e. (i) by creating separatetables for each level of hierarchies based on different paths(Jagadish et al., 1999), (ii) using null values for absent levels ofa attribute (Cabibbo and Torlone, 2000; Lehner et al., 1998), (iii)separate star schema for each path (Bauer et al., 2000; Hahnet al., 2000; Kimball and Ross, 2002) and (iv) creating one tablefor common levels and separate for specific levels (Bauer etal., 2000). In this data mart, dimension table were designed
Fig. 2 – Hierarchical structure of Location dimension.
i n a g r i c u l t u r e 6 4 ( 2 0 0 8 ) 111–119
Fig. 3 – Fact diagram of livestock production fact.
114 c o m p u t e r s a n d e l e c t r o n i c s
First path starts from National and ends at the District levelvia Agro-climatic zone and State. Second path starts fromNational and ends at Animal Farm instead of District. Thirdand last path starts from National and ends at Facilities viaAgro-climatic zone, State, District and Species. In this case alsoseparate dimension tables were designed for every possiblepath of the above hierarchy.
In this data mart three different definitions were followedfor year in the TIME dimension. Therefore, TIME dimensionshows all three definitions, i.e. financial year, agriculturalyear and calendar year associated with different informa-tion. Months in calendar year are from January to Decemberwhereas in agriculture year of India, it is from July to June.Similarly, months in financial year of India are from April toMarch. Therefore, particular agricultural and financial yearsare part of two calendar years. As a consequence of this, firstmonth of calendar year i.e., January is seventh month of agri-cultural year and 10th month of financial year. In other words,first month of financial year i.e., April is fourth month of calen-dar year and 10th month of agricultural year. Also, first monthof agricultural year i.e., July is seventh month of calendar yearand fourth month of financial year. It can be seen that thereare three different year systems followed for collection of datafor agricultural sector of the country. Therefore, integrationof data at monthly grain level is a major issue. Also, in casethe data is available at grain levels of quarterly, half yearly,can also be integrated across years as quarters are offset by 3months. The major problem of integration is for weekly andannual grain level information with respect to different yeardomains. This information can be integrated through someapportionment techniques at appropriate grain level.
3. Fact design
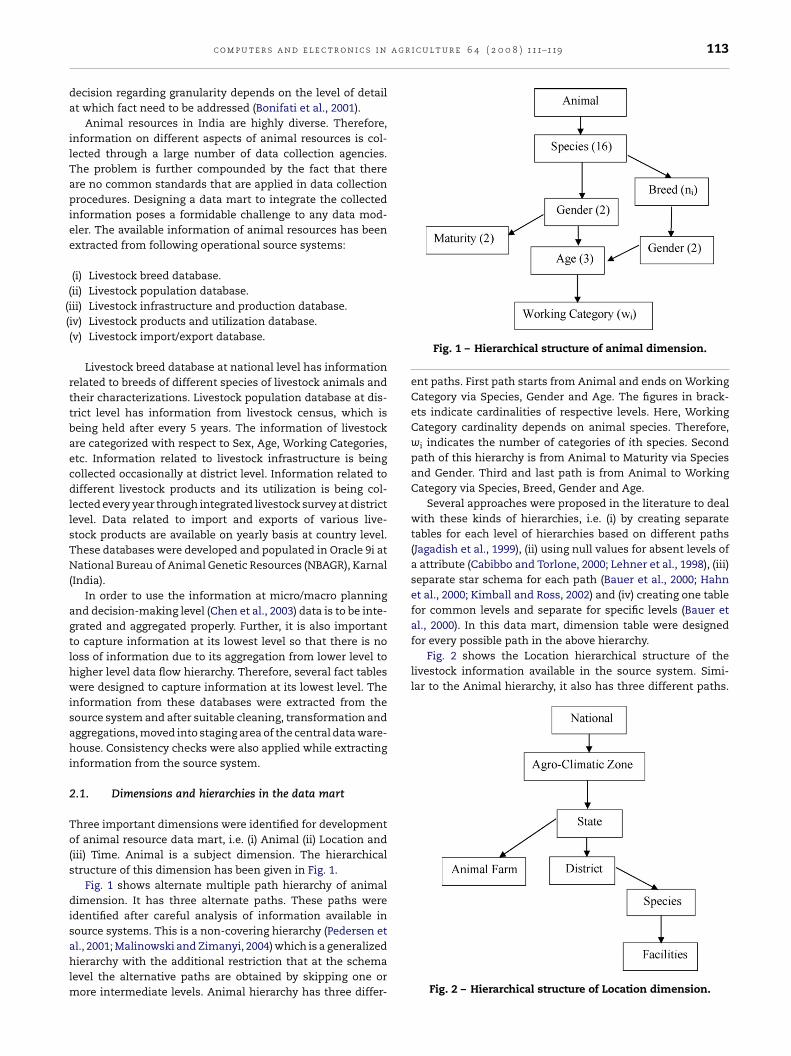
Designing of dimension models are followed by identifica-tion and designing of fact tables of the data mart. Initially,fact tables from single source data were identified. Then facttables, which were to be generated from multiple data sources,were identified. Keeping in view, the user requirements anddata availability at the source data, grain level of each fact tablewas decided. Declaration of grain level also provided informa-tion about the individual record level of each fact table. A goodand clear declaration of grain level for each fact table, made iteasy to choose appropriate dimensions, which can be associ-ated with a particular fact table. Logical fact diagram of eachselected fact table were prepared. The fact diagram showsnot only the specifics of a given fact table but also shows thecontext of the fact table in overall data mart. The fact table dia-gram provides information about the name of the fact table, itsgrain level and dimensions connected to this fact. This servesas introduction to the overall model. Fig. 3 shows fact dia-gram of livestock production fact table. In this case, measure is“quantity of livestock products” such as milk, meat, wool, egg,etc. These quantities are measured either in weight or in num-ber depending on the kind of product. For example, quantity
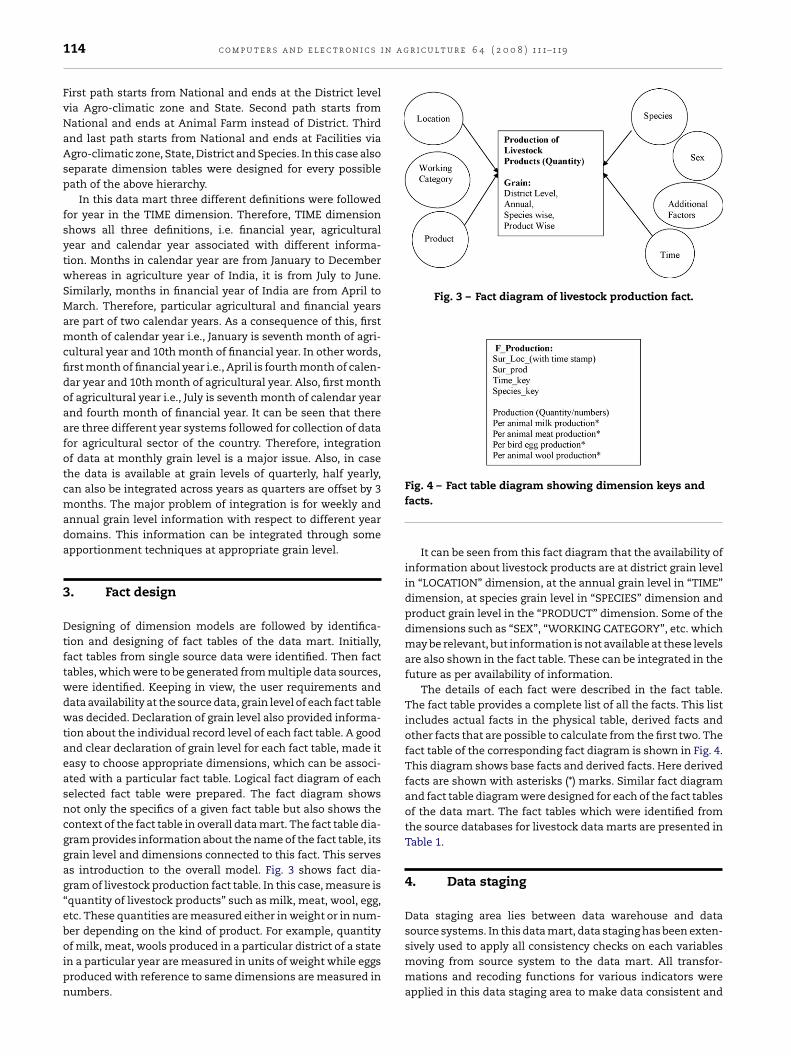
of milk, meat, wools produced in a particular district of a statein a particular year are measured in units of weight while eggsproduced with reference to same dimensions are measured innumbers.Fig. 4 – Fact table diagram showing dimension keys andfacts.
It can be seen from this fact diagram that the availability ofinformation about livestock products are at district grain levelin “LOCATION” dimension, at the annual grain level in “TIME”dimension, at species grain level in “SPECIES” dimension andproduct grain level in the “PRODUCT” dimension. Some of thedimensions such as “SEX”, “WORKING CATEGORY”, etc. whichmay be relevant, but information is not available at these levelsare also shown in the fact table. These can be integrated in thefuture as per availability of information.
The details of each fact were described in the fact table.The fact table provides a complete list of all the facts. This listincludes actual facts in the physical table, derived facts andother facts that are possible to calculate from the first two. Thefact table of the corresponding fact diagram is shown in Fig. 4.This diagram shows base facts and derived facts. Here derivedfacts are shown with asterisks (*) marks. Similar fact diagramand fact table diagram were designed for each of the fact tablesof the data mart. The fact tables which were identified fromthe source databases for livestock data marts are presented inTable 1.
4. Data staging
Data staging area lies between data warehouse and datasource systems. In this data mart, data staging has been exten-
sively used to apply all consistency checks on each variablesmoving from source system to the data mart. All transfor-mations and recoding functions for various indicators wereapplied in this data staging area to make data consistent and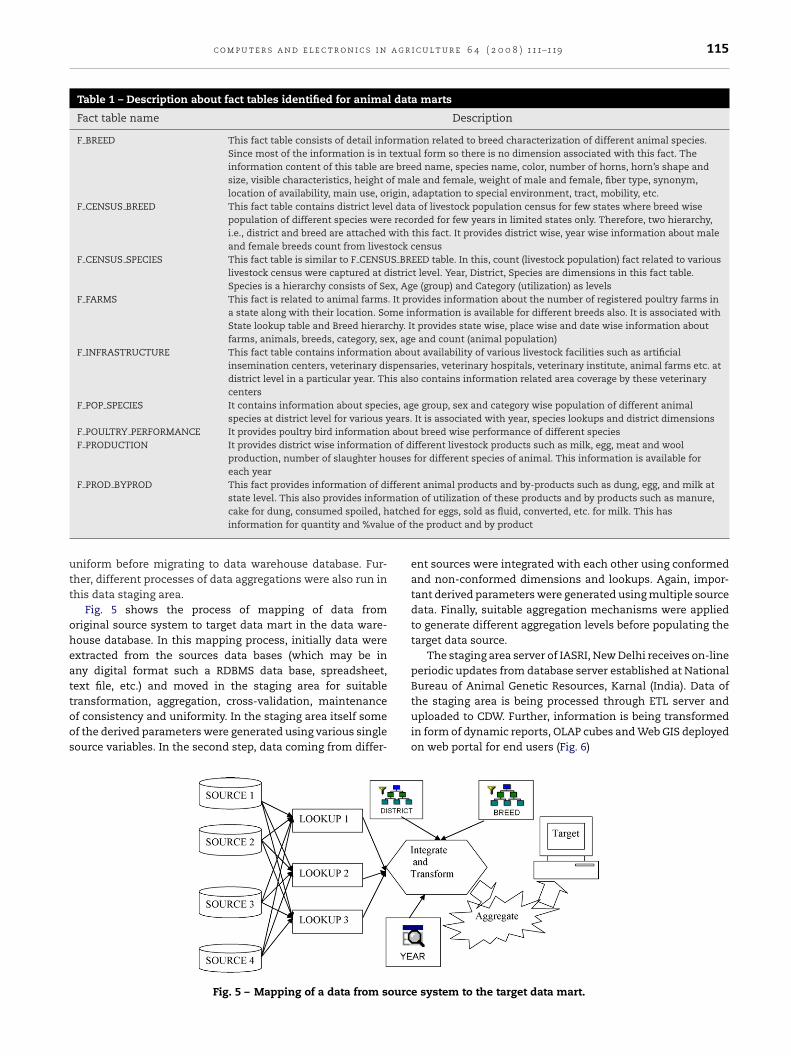
c o m p u t e r s a n d e l e c t r o n i c s i n a g r i c u l t u r e 6 4 ( 2 0 0 8 ) 111–119 115
Table 1 – Description about fact tables identified for animal data marts
Fact table name Description
F BREED This fact table consists of detail information related to breed characterization of different animal species.Since most of the information is in textual form so there is no dimension associated with this fact. Theinformation content of this table are breed name, species name, color, number of horns, horn’s shape andsize, visible characteristics, height of male and female, weight of male and female, fiber type, synonym,location of availability, main use, origin, adaptation to special environment, tract, mobility, etc.
F CENSUS BREED This fact table contains district level data of livestock population census for few states where breed wisepopulation of different species were recorded for few years in limited states only. Therefore, two hierarchy,i.e., district and breed are attached with this fact. It provides district wise, year wise information about maleand female breeds count from livestock census
F CENSUS SPECIES This fact table is similar to F CENSUS BREED table. In this, count (livestock population) fact related to variouslivestock census were captured at district level. Year, District, Species are dimensions in this fact table.Species is a hierarchy consists of Sex, Age (group) and Category (utilization) as levels
F FARMS This fact is related to animal farms. It provides information about the number of registered poultry farms ina state along with their location. Some information is available for different breeds also. It is associated withState lookup table and Breed hierarchy. It provides state wise, place wise and date wise information aboutfarms, animals, breeds, category, sex, age and count (animal population)
F INFRASTRUCTURE This fact table contains information about availability of various livestock facilities such as artificialinsemination centers, veterinary dispensaries, veterinary hospitals, veterinary institute, animal farms etc. atdistrict level in a particular year. This also contains information related area coverage by these veterinarycenters
F POP SPECIES It contains information about species, age group, sex and category wise population of different animalspecies at district level for various years. It is associated with year, species lookups and district dimensions
F POULTRY PERFORMANCE It provides poultry bird information about breed wise performance of different speciesF PRODUCTION It provides district wise information of different livestock products such as milk, egg, meat and wool
production, number of slaughter houses for different species of animal. This information is available foreach year
F PROD BYPROD This fact provides information of different animal products and by-products such as dung, egg, and milk atatio
atchee of t
utt
oheattoos
state level. This also provides informcake for dung, consumed spoiled, hinformation for quantity and %valu
niform before migrating to data warehouse database. Fur-her, different processes of data aggregations were also run inhis data staging area.
Fig. 5 shows the process of mapping of data fromriginal source system to target data mart in the data ware-ouse database. In this mapping process, initially data werextracted from the sources data bases (which may be inny digital format such a RDBMS data base, spreadsheet,ext file, etc.) and moved in the staging area for suitable
ransformation, aggregation, cross-validation, maintenancef consistency and uniformity. In the staging area itself somef the derived parameters were generated using various singleource variables. In the second step, data coming from differ-Fig. 5 – Mapping of a data from sourc
n of utilization of these products and by products such as manure,d for eggs, sold as fluid, converted, etc. for milk. This hashe product and by product
ent sources were integrated with each other using conformedand non-conformed dimensions and lookups. Again, impor-tant derived parameters were generated using multiple sourcedata. Finally, suitable aggregation mechanisms were appliedto generate different aggregation levels before populating thetarget data source.
The staging area server of IASRI, New Delhi receives on-lineperiodic updates from database server established at NationalBureau of Animal Genetic Resources, Karnal (India). Data of
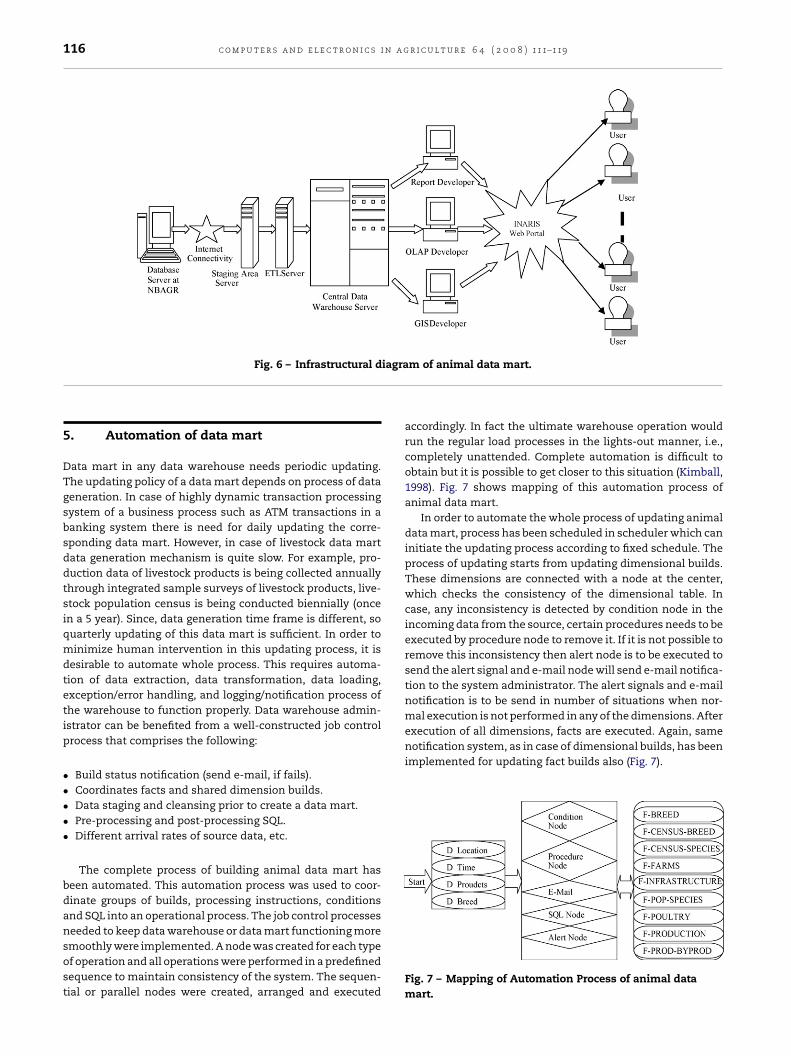
the staging area is being processed through ETL server anduploaded to CDW. Further, information is being transformedin form of dynamic reports, OLAP cubes and Web GIS deployedon web portal for end users (Fig. 6)e system to the target data mart.
116 c o m p u t e r s a n d e l e c t r o n i c s i n a g r i c u l t u r e 6 4 ( 2 0 0 8 ) 111–119
iagra
execution of all dimensions, facts are executed. Again, samenotification system, as in case of dimensional builds, has beenimplemented for updating fact builds also (Fig. 7).
Fig. 6 – Infrastructural d
5. Automation of data mart
Data mart in any data warehouse needs periodic updating.The updating policy of a data mart depends on process of datageneration. In case of highly dynamic transaction processingsystem of a business process such as ATM transactions in abanking system there is need for daily updating the corre-sponding data mart. However, in case of livestock data martdata generation mechanism is quite slow. For example, pro-duction data of livestock products is being collected annuallythrough integrated sample surveys of livestock products, live-stock population census is being conducted biennially (oncein a 5 year). Since, data generation time frame is different, soquarterly updating of this data mart is sufficient. In order tominimize human intervention in this updating process, it isdesirable to automate whole process. This requires automa-tion of data extraction, data transformation, data loading,exception/error handling, and logging/notification process ofthe warehouse to function properly. Data warehouse admin-istrator can be benefited from a well-constructed job controlprocess that comprises the following:
• Build status notification (send e-mail, if fails).• Coordinates facts and shared dimension builds.• Data staging and cleansing prior to create a data mart.• Pre-processing and post-processing SQL.• Different arrival rates of source data, etc.
The complete process of building animal data mart hasbeen automated. This automation process was used to coor-dinate groups of builds, processing instructions, conditionsand SQL into an operational process. The job control processesneeded to keep data warehouse or data mart functioning more
smoothly were implemented. A node was created for each typeof operation and all operations were performed in a predefinedsequence to maintain consistency of the system. The sequen-tial or parallel nodes were created, arranged and executedm of animal data mart.
accordingly. In fact the ultimate warehouse operation wouldrun the regular load processes in the lights-out manner, i.e.,completely unattended. Complete automation is difficult toobtain but it is possible to get closer to this situation (Kimball,1998). Fig. 7 shows mapping of this automation process ofanimal data mart.
In order to automate the whole process of updating animaldata mart, process has been scheduled in scheduler which caninitiate the updating process according to fixed schedule. Theprocess of updating starts from updating dimensional builds.These dimensions are connected with a node at the center,which checks the consistency of the dimensional table. Incase, any inconsistency is detected by condition node in theincoming data from the source, certain procedures needs to beexecuted by procedure node to remove it. If it is not possible toremove this inconsistency then alert node is to be executed tosend the alert signal and e-mail node will send e-mail notifica-tion to the system administrator. The alert signals and e-mailnotification is to be send in number of situations when nor-mal execution is not performed in any of the dimensions. After
Fig. 7 – Mapping of Automation Process of animal datamart.
c o m p u t e r s a n d e l e c t r o n i c s i n a g r i c u l t u r e 6 4 ( 2 0 0 8 ) 111–119 117
of m
6
Asosdiadrb
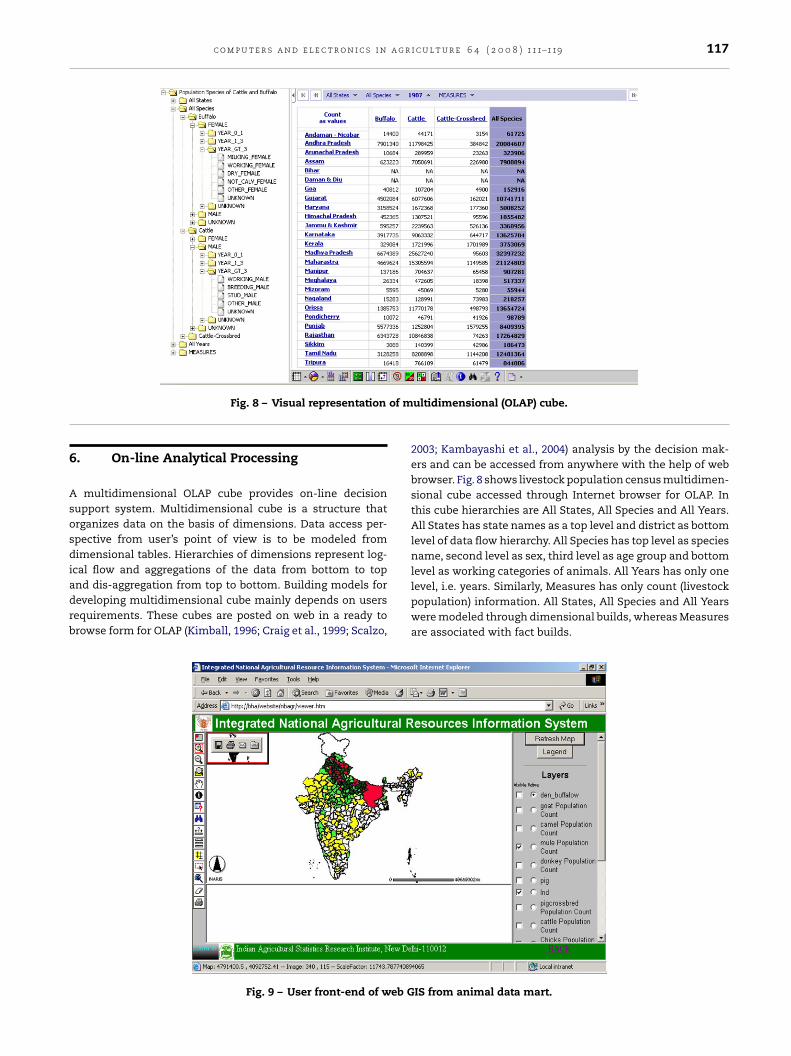
Fig. 8 – Visual representation
. On-line Analytical Processing
multidimensional OLAP cube provides on-line decisionupport system. Multidimensional cube is a structure thatrganizes data on the basis of dimensions. Data access per-pective from user’s point of view is to be modeled fromimensional tables. Hierarchies of dimensions represent log-
cal flow and aggregations of the data from bottom to top
nd dis-aggregation from top to bottom. Building models foreveloping multidimensional cube mainly depends on usersequirements. These cubes are posted on web in a ready torowse form for OLAP (Kimball, 1996; Craig et al., 1999; Scalzo,Fig. 9 – User front-end of web G
ultidimensional (OLAP) cube.
2003; Kambayashi et al., 2004) analysis by the decision mak-ers and can be accessed from anywhere with the help of webbrowser. Fig. 8 shows livestock population census multidimen-sional cube accessed through Internet browser for OLAP. Inthis cube hierarchies are All States, All Species and All Years.All States has state names as a top level and district as bottomlevel of data flow hierarchy. All Species has top level as speciesname, second level as sex, third level as age group and bottomlevel as working categories of animals. All Years has only one
level, i.e. years. Similarly, Measures has only count (livestockpopulation) information. All States, All Species and All Yearswere modeled through dimensional builds, whereas Measuresare associated with fact builds.IS from animal data mart.
i n a g
118 c o m p u t e r s a n d e l e c t r o n i c sThis on-line system has drag and drop option for creationof nested tables, drill up and drill down functionalities basedon hierarchies of various dimensions. System has simple cal-culation options on tabular data, hide and show option tohide certain undesirable rows or columns to be displayed onthe screen, graphical representation options such as line, bar,charts, three-dimensional graphs, etc. through single click of abutton, aggregations, segregations, slicing and dicing optionsare available with out any additional requirements for dataexploration tools.
The zero suppression option suppresses all rows/columnswith no information. It also has 80/20 options, which dis-play major rows/columns contributing to 80% of grand totalof respective row/column. This may be used to identify majorcontributor members of a particular level in dimensional hier-archy to total. It has option of exceptional highlights in whichwell-defined exceptions in the tabular information can behighlighted with different text and cell colors. The history ofa particular session of analysis is recorded and can be seenwhenever required by single click of a button. This will helpthe user to look into list of operations performed by him/her ina particular session. The find and search options are availablefor finding a particular information in tabular data of a cube.It also has help option to assist user in working with this deci-sion support system. The most important option in this is toexport visible data/graphs to number of commonly used fileformats.
Apart from this option, it has functionalities of disseminat-ing information through dynamic reports. In dynamic reports,a query is fired through web browser to the data warehousedatabase and pre-formatted reports are generated on-line inPDF/HTML format
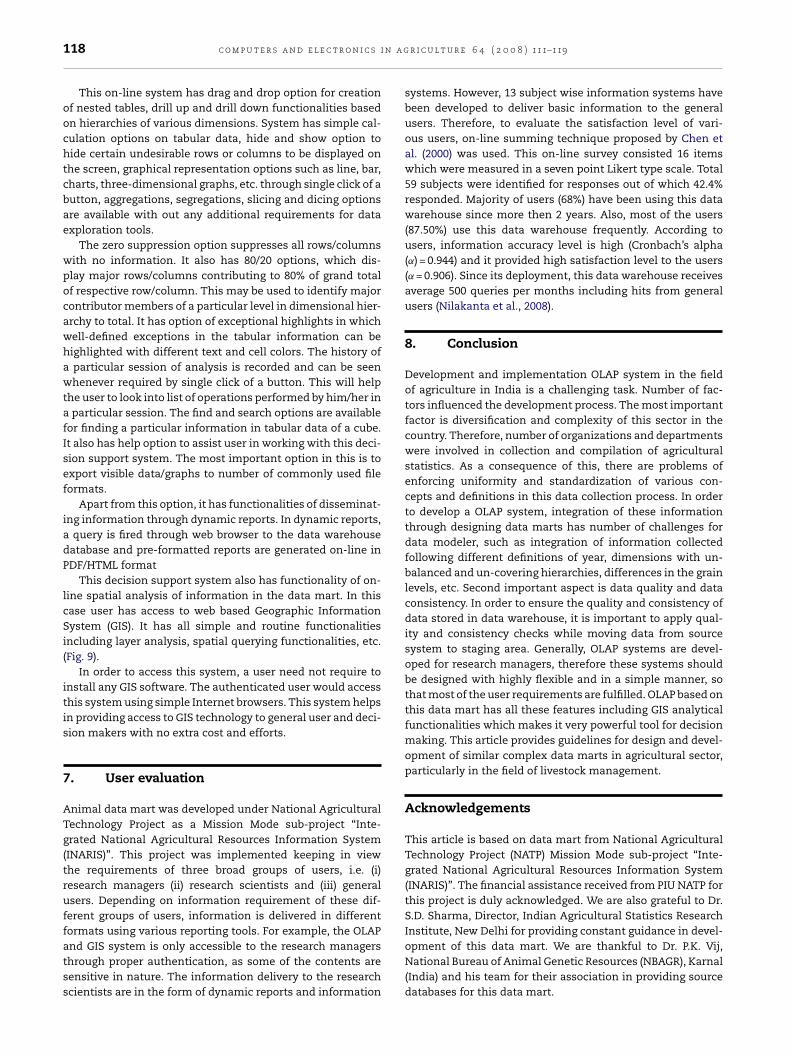
This decision support system also has functionality of on-line spatial analysis of information in the data mart. In thiscase user has access to web based Geographic InformationSystem (GIS). It has all simple and routine functionalitiesincluding layer analysis, spatial querying functionalities, etc.(Fig. 9).
In order to access this system, a user need not require toinstall any GIS software. The authenticated user would accessthis system using simple Internet browsers. This system helpsin providing access to GIS technology to general user and deci-sion makers with no extra cost and efforts.
7. User evaluation
Animal data mart was developed under National AgriculturalTechnology Project as a Mission Mode sub-project “Inte-grated National Agricultural Resources Information System(INARIS)”. This project was implemented keeping in viewthe requirements of three broad groups of users, i.e. (i)research managers (ii) research scientists and (iii) generalusers. Depending on information requirement of these dif-ferent groups of users, information is delivered in differentformats using various reporting tools. For example, the OLAP
and GIS system is only accessible to the research managersthrough proper authentication, as some of the contents aresensitive in nature. The information delivery to the researchscientists are in the form of dynamic reports and informationr i c u l t u r e 6 4 ( 2 0 0 8 ) 111–119
systems. However, 13 subject wise information systems havebeen developed to deliver basic information to the generalusers. Therefore, to evaluate the satisfaction level of vari-ous users, on-line summing technique proposed by Chen etal. (2000) was used. This on-line survey consisted 16 itemswhich were measured in a seven point Likert type scale. Total59 subjects were identified for responses out of which 42.4%responded. Majority of users (68%) have been using this datawarehouse since more then 2 years. Also, most of the users(87.50%) use this data warehouse frequently. According tousers, information accuracy level is high (Cronbach’s alpha(˛) = 0.944) and it provided high satisfaction level to the users(˛ = 0.906). Since its deployment, this data warehouse receivesaverage 500 queries per months including hits from generalusers (Nilakanta et al., 2008).
8. Conclusion
Development and implementation OLAP system in the fieldof agriculture in India is a challenging task. Number of fac-tors influenced the development process. The most importantfactor is diversification and complexity of this sector in thecountry. Therefore, number of organizations and departmentswere involved in collection and compilation of agriculturalstatistics. As a consequence of this, there are problems ofenforcing uniformity and standardization of various con-cepts and definitions in this data collection process. In orderto develop a OLAP system, integration of these informationthrough designing data marts has number of challenges fordata modeler, such as integration of information collectedfollowing different definitions of year, dimensions with un-balanced and un-covering hierarchies, differences in the grainlevels, etc. Second important aspect is data quality and dataconsistency. In order to ensure the quality and consistency ofdata stored in data warehouse, it is important to apply qual-ity and consistency checks while moving data from sourcesystem to staging area. Generally, OLAP systems are devel-oped for research managers, therefore these systems shouldbe designed with highly flexible and in a simple manner, sothat most of the user requirements are fulfilled. OLAP based onthis data mart has all these features including GIS analyticalfunctionalities which makes it very powerful tool for decisionmaking. This article provides guidelines for design and devel-opment of similar complex data marts in agricultural sector,particularly in the field of livestock management.
Acknowledgements
This article is based on data mart from National AgriculturalTechnology Project (NATP) Mission Mode sub-project “Inte-grated National Agricultural Resources Information System(INARIS)”. The financial assistance received from PIU NATP forthis project is duly acknowledged. We are also grateful to Dr.S.D. Sharma, Director, Indian Agricultural Statistics ResearchInstitute, New Delhi for providing constant guidance in devel-
opment of this data mart. We are thankful to Dr. P.K. Vij,National Bureau of Animal Genetic Resources (NBAGR), Karnal(India) and his team for their association in providing sourcedatabases for this data mart.
a g r
r
A
A
B
BB
C
C
C
C
G
H
H
H
Whiting, R., 2003. The Data Warehouse Advantage, Information
c o m p u t e r s a n d e l e c t r o n i c s i n
e f e r e n c e s
bdullah, A., Brobst, S., Umer, M., Khan, M.F., 2004. The case foran agri data warehouse: enabling analytical exploration ofintegrated agricultural data. In: Proceedings of the IASTEDInternational Conference on Databases and Applications (DBA2004), Innsbruck, Austria.
gosta, L., December 13, 2001. Top 10 Data WarehousingChallenges. Forrester Research.
auer, A., Hummer, W., Lehner, W., 2000. An alternative relationalOLAP modeling approach. In: Proceedings of the SecondInternational Conference on Data Warehouse and KnowledgeDiscovery, pp. 189–198.
ieber, M., 1998. Data Warehousing in Government, DM Rev.onifati, A., Cattaneo, F., Ceri, S., Fuggetta, A., Paraposchi, S.,
2001. Designing data marts for data warehouse. ACM Trans.Software Eng. Meth. 10 (4), 452–483.
abibbo, L., Torlone, R., 2000. The design and development oflogical system for OLAP. In: Proceedings of the SecondInternational Conference on Data Warehouse and KnowledgeDiscovery, pp. 1–10.
hen, R., Chen, C., Cheng, C., 2003. A web-based ERP data miningsystem for decision-making. Int. J. Comp. Appl. Technol. 17(3), 156–158.
hen, L.D., Soliman, K.S., Mao, E., Frolick, M.N., 2000. Measuringusers satisfaction with data warehouses: an exploratorystudy. Info. Manage. 37, 103–110.
raig, R.S., Vivona, J.A., Bercovitch, D., 1999. MicrosoftTechnologies. John Wiley & Sons, New York.
upta, A., Mumick, I.S., 1995. Maintenance of materialized views:problems, techniques, and applications. Data Eng. Bull.18 (2).
ahn, K., Sapia, C., Blaschka, M., 2000. Automatically generatingOLAP schemata from conceptual graphic models. In:Proceedings of Ninth International Conference onInformation and Knowledge Management and Third ACMInternational Workshop on Data Warehousing and OLAP,pp. 9–16.
arper, F.M., 2004. Data warehousing and the organization ofgovernmental databases. In: Digital Government: Principles
and Best Practices. IGI Publishing,pp. 236–247.offer, J.A., Prescott, M.B., McFadden, F.R., 2005. Modern DataBase Management. Pearson Education, Inc., Upper SaddleRiver, New Jersey.
i c u l t u r e 6 4 ( 2 0 0 8 ) 111–119 119
Inmon, W., 1995. What is a Data Warehouse? PRISM Tech. Top. 1(1).
Inmon, W., 2002. Building the Data Warehouse. John Wiley &Sons, Inc.
Jagadish, H., Lakshmanan, L., Srivastava, D., 1999. What canhierarchies do for data warehouse? In: Proceedings of the 25thVery Large Databases Conference, pp. 530–541.
Kambayashi, Y., Kumar, V., Mohania, M., Samtania, S., 2004.Recent advances and research problems in data warehouse.Lecture Notes in Computer Science. 1552, pp. 81–92.
Kelly, S., 1997. Data Warehousing in Action. John Wiley & Sons,Inc.
Kimball, R., 1996. The Data Warehouse Toolkit: PracticalTechnique for Building Data Warehouses. John Wiley & Sons,New York.
Kimball, R., 1998. The Data Warehouse Lifecycle Tool Kit. JohnWiley & Sons, New York.
Kimball, R., Ross, M., 2002. The Data Warehousing Toolkit. JohnWiley & Sons, New York.
Lehner, W., Albrecht, J., Wedekind, H., 1998. Normal forms ofmultidimensional databases. In: Proceedings of the 10thInternational Conference on Scientific and StatisticalDatabase Management, pp. 63–72.
Malinowski, E., Zimanyi, E., 2004. Hierarchies in amultidimensional model: from conceptual modeling to logicalrepresentation. Data Knowledge Eng. 59 (2), 348–377.
Nilakanta, S., Scheibe, K., Rai, A., 2008. Dimensional issues inagricultural data warehouse designs. Comput. Electron. Agric.60 (2), 263–278.
O’Neil, P., Graefe, G., 1995. Multi-table joins through bitmappedjoin indices. In: Proceedings of the SIGMOD Conference.
O’Neil, P., Quass, D., 1997. Improved Query Performance withVariant Indices. In: Proceedings of the SIGMOD Conference.
Pedersen, T., Jensen, C., Dyreson, C., 2001. A foundation forcapturing and querying complex multidimensional data.Inform. Syst. 26 (5), 383–423.
Rai, A., Dubey, V., Chaturvedi, K.K., Malhotra, P.K., 2007. Issues ofdesign and development of agricultural data warehouse inIndia. CSI Commun. 31 (1), 43–51.
Scalzo, B., 2003. Oracle DBA Guide to Data Warehousing and StarSchema. Prentice Hall, New York.
Week 949, pp 63–66.Yost, M., 2000. Data warehousing and decision support at the
national agricultural statistics service. Soc. Sci. Comput. Rev.18 (4), 434–441.