describing trends in conventional and unconventional ... · conventional and unconventional...
TRANSCRIPT
TRENDS IN CONVENTIONAL AND
UNCONVENTIONAL POLITICAL PARTICIPATION
IN EUROPE BETWEEN 1981 - 2008
Rik Linssen1, Hans Schmeets
1, Peer Scheepers
2 & Manfred te Grotenhuis
2
1 Department of Political Science
Faculty of Arts and Social Sciences
Maastricht University, the Netherlands
2 Department of Sociology
Faculty of Social Sciences
Radboud University Nijmegen, the Netherlands
Paper presented to the panel ‘The emergence of new types of political participation and its
consequences’ at the 6th ECPR General Conference, Reykjavik, 25-27 August, 2011
1
Abstract
Previous research on political participation suggests that western democracies are currently
suffering the yoke of mass citizen withdrawal from traditional channels of political
participation. Yet, a more optimistic view suggests a countervailing trend in political
participation and proposes that unconventional forms of political participation are on the rise.
Instead of withdrawal from politics, citizens increasingly employ unconventional means of
participation to exert pressure on political decision-making processes. However, most
research focused on the United States, whereas trends in both conventional and
unconventional political participation have rarely been studied cross-nationally in Europe.
Another important and usually overlooked problem in studies on political participation is the
comparability and equivalence of measurements across nations. We employ probabilistic
scale modeling techniques, using data on 205,763 individuals in 22 European countries
covering three decades. The aim of this paper is therefore twofold: a) to provide a description
of trends in both conventional and unconventional political participation in Europe in recent
decades that b) are comparable across years and nations. We find stable levels of
conventional and unconventional political participation in Europe in recent decades, neither
confirming mass citizen withdrawal from politics nor confirming a switch from conventional
to unconventional means of participation.
2
Introduction & research questions
The current view in both society and academia suggests that western democracies are
suffering the yoke of mass citizen withdrawal from channels of political participation.
Connecting citizens to the state by means of participation in the political decision-making
process is a prerequisite for proper democratic performance (Dahl, 1971). As the political
system in western democracies is equalitarian in principle these systems are based on
universal suffrage where each person should have equal influence (Verba, Nie, & Kim, 1978).
Consequently, democracies heavily depend on citizen pressure on the political decision-
making process. Citizens are expected to engage in collective (political) action and hold
political authorities accountable for their actions. This demonstrates that democracy does not
only depend on the form of its basic structure (Rawls, 1971) but also on the qualities and
attitudes of citizens (Kymlicka & Norman, 1994).
If democracy‟s wellbeing depends on actively engaged citizens, a disconnected
public threatens to drain the lifeblood out of democracy. Putnam (2000; 2007) argues that
democracy‟s wellbeing is currently threatened by a widespread decline in civic engagement.
Although Putnam focuses on the United States (US) the alleged decline in civic engagement
is reason for concern for institutions such as the World Bank (Ritzen, Easterly, & Woolcock,
2000), the Organization for Economic Cooperation and Development (OECD) (Healy, et al.,
2001) and the Council of Europe (2004, 2010). According to Putnam “the most visible
symptom” (Putnam, 2000, p. 23) of civic decline is citizen‟s withdrawal from politics,
exemplified by the half-empty ballot box during elections.
Yet, others find empirical evidence for countervailing trends in political participation
(Dalton, 2008; Inglehart, 1997; Norris, 2002). Contrasting to Putnam (2000), Norris (2002)
suggests that political participation is on the rise in the US as well as in Europe. Instead of
participating via traditional, institutionalized channels citizens urge political authorities to
represent their interests via alternative means. In the same vein, Dalton (2008) suggests a shift
in the repertoire of political activities employed by citizens. Instead of participating in
traditional acts such as voting, citizens have been more likely to engage in new forms of
political participation such as demonstrating in recent decades.
The bulk of other research on political participation originates from the US (e.g.
Brady, Verba, & Schlozman, 1995; Putnam, 2000; Rosenstone & Hansen, 1993). Trusting
that similar patterns will emerge in the European context, the patterns found in the US are
copied to the European case. However, as the specific culture of the US and the
individualistic values rooted in the constitution set a very specific cultural milieu, there may
very well be a case of American exceptionalism (Lipset, 1996). Or, as Norris notes: “civic ills
3
do not necessarily creep north over the Canadian border, let alone spread widely like a virus
throughout Western political systems“ (Norris, 2002, p. XI). However, trends in political
participation have rarely been empirically studied cross-nationally in Europe (exceptions are:
Jennings & van Deth, 1990; Marsh, 1990; Norris, 2002; Stolle & Hooghe, 2011). Therefore,
our research question reads: What have been the main trends in conventional and
unconventional political participation in Europe over the past decades?
We aim to provide a longitudinal and cross-national European perspective,
simultaneously including conventional and unconventional means of political participation.
The arguments that motivate our research question are fourfold. First, the current body of
cross-national research focuses on either conventional or unconventional political
participation separately. The alleged decline in political participation as put forward by
Putnam (2000) and the alternative explanation of a shifting repertoire towards increasing
unconventional political participation (Dalton, 2008; Inglehart, 1997; Norris, 2002) calls for
simultaneous analyses of trends in both conventional and unconventional political
participation. Second, the current literature produces contrasting theoretical expectations with
respect to trends in conventional and unconventional means of political participation (e.g.
Dalton, 2008; Norris, 2002; Putnam, 2000). That is, a widespread decline in participation
versus a shifting repertoire from conventional towards unconventional means of participation.
Third, a cross-national, longitudinal perspective on political participation focusing on Europe
is currently missing. Using both the European Values Studies (EVS) and European Social
Survey (ESS) datasets enables us to reconstruct a time-trend ranging from 1981 until 2008.
Fourth, the extent to which measurements of political participation in Europe are equivalent
cannot be taken for granted in cross-national research, but must be assessed empirically. As a
first step in accurately describing trends in political participation and building on Reeskens,
Quintelier, and Billiet (2009) we therefore focus on the equivalence of measurements of
conventional and unconventional political participation before estimating trends in
conventional and unconventional political participation.
In the following sections we provide a brief literature review on the definition of
political participation as well as previous research on trends in political participation. Next,
the data and methodology used to construct a cross-national equivalent index of political
participation are introduced to ultimately arrive at descriptions of trends in conventional and
unconventional political participation in Europe.
4
Defining political participation
Political participation can broadly be defined as acts employed by private citizens to influence
government decision-making, either directly or indirectly (Brady, 1999; van Deth, 2008).
This definition can include a wide variety of activities, ranging from voting and signing
petitions to demonstrating and volunteering. Several sub-dimensions classifying the
overarching concept of political participation have been proposed over time.
Early studies on political participation solely focused on voting and campaign
activities (Berelson, Lazarsfeld, & McPhee, 1954). Almond and Verba (1963) as well as
Verba, Nie, and Kim (1978) broadened the concept of political participation, including
activities not directly to be found within the setting of party politics but also communal
activities such as attending neighborhood meetings. Likewise, Dahl (1971) distinguished
between campaign and non-campaign participatory activities. Strictly speaking, these
activities are all conventional, traditional activities taking place via institutionalized routes
(Burt, 2002; Reeskens, et al., 2009). In the 1960s the range of political activities was
broadened with protesting, petitioning and even violent actions. These activities were
classified as „unconventional‟ (Barnes & Kaase, 1979) or „elite-challenging‟ (Marsh, 1990)
political participation. The classification between conventional and unconventional1 political
participation as proposed and empirically assessed by Barnes and Kaase (1979) became “the
primary focus of attention” (Dekker, Koopmans, & van den Broeck, 1997, p. 225).
Conventional political participation consists of legally embedded activities aimed at
influencing public officials. Conventional political participation therefore includes contacting
politicians and government officials, party membership and working for political parties, and
all activities directly related to the electoral process such as voting and campaigning (Barnes
& Kaase, 1979). Next to conventional participation, citizens can urge political authorities to
represent their interests via unconventional means of participation. These activities are not
structurally embedded in the political system and may be illegal. Unconventional political
participation includes boycotting, signing petitions, attending (un)lawful demonstrations,
1 Yet, labeling certain acts as “unconventional” remains controversial. Certain unconventional
acts such as petitioning or demonstrating have become generally accepted (Dalton, 2008; Norris,
Walgrave, & Van Aelst, 2005). Marien, Hooghe and Quintelier (2010) separate institutionalized forms
of political participation from non-institutionalized forms of political participation (which reflects the
distinction between conventional and unconventional political participation). Similarly, Stolle and
Hooghe (2011) note that unconventional means of participation are increasingly accepted. Therefore
they label unconventional acts as emerging forms of political participation.
5
occupying buildings, and political violence (Barnes & Kaase, 1979). The distinction between
conventional and unconventional political participation is (although labeled slightly different)
reflected in a wide array of studies (Barnes & Kaase, 1979; Brady, 1999; Dalton, 2008;
Hooghe & Dejaeghere, 2007; Inglehart, 1997; Marien, et al., 2010; Stolle & Hooghe, 2011).
Previous research
The existing body of literature provides an abundance of single-country studies on
conventional political participation, mostly focusing on the US (Brady, et al., 1995;
Rosenstone & Hansen, 1993; Schlozman, Verba, & Brady, 1995). In many cases, shortly after
each election, within-country trends are assessed on the basis of a wide variety of election
studies (e.g. Bousetta, 1997; Castenmiller & Kriesi, 1987; Parry & Moyser, 1990).
Longitudinal research on conventional political participation is often limited to
separate acts of participation such as voting (Franklin, 2004; Geys, 2006) or party
membership (Mair & van Biezen, 2001). Most studies take either a cross-national perspective
(Marien, et al., 2010) or a longitudinal perspective on unconventional political participation
(Inglehart, 1997) and analyze unconventional acts of participation separately, irrespective of
relevant developments in conventional participation.
Studies taking a longitudinal perspective and simultaneously analyzing conventional
as well as unconventional political participation are rather scarce (Jennings & van Deth, 1990;
Norris, 2002; Stolle & Hooghe, 2011; Verba, et al., 1978). The scope of these studies is either
rather small in the number of countries studied (cf. Jennings & van Deth, 1990; Stolle &
Hooghe, 2011; Verba, et al., 1978) or in the number of unconventional political activities
analyzed (Norris, 2002). Verba, Nie, and Kim (1978) compare merely seven countries and
include solely three western democracies (the Netherlands, Austria and the US). Similarly,
Jennings and Van Deth (1990) analyze trends in unconventional political participation but
restrict their analyses to trends in West-Germany, the United States and the Netherlands.
Stolle & Hooghe, (2011) analyze Germany, the United Kingdom (UK), the Netherlands, Italy,
Switzerland, and Finland. Despite the extensive scope of countries studied by Norris (2002)
the analyses are restricted to two unconventional activities (petition signing and
demonstrating) and two conventional activities (voter turnout and party membership).
However, none of these studies addressed the issue of equivalent measurements for political
participation across countries and over time.
6
Equivalence
In order to reach meaningful insights in trends in political participation, the modus operandi is
to compare different phenomena in similar contexts or to compare similar phenomena across
different contexts. It needs to be assured that similar political phenomena are being measured
(Przeworski & Teune, 2008) or, put differently, that measurements are equivalent.
Although Almond and Verba (1963) as well as more recently Van Deth (1986, 1998,
2009) drew attention to the problem of limited equivalence, Van Deth concluded: “yet,
despite the striking consensus about the problem, the number of proposals to deal with it are
rather limited, and attempts to handle equivalent indicators in comparative research are the
exceptions, not the rule” (1998, p. 2). These exceptions include Van Deth (1986) and
Reeskens, Quintelier, and Billiet (2009). Van Deth (1986) assessed equivalence of a political
participation scale consisting of items ranging from discussing politics to painting slogans on
walls in the UK, Germany, Austria, US, Italy, Switzerland and Finland. Based on the 2006
ESS, Reeskens, Quintelier, and Billiet (2009) assessed cross-sectional equivalence of items
referring to conventional and unconventional political participation at solely one point in
time. In all longitudinal studies on political participation, equivalence of measurements is left
unaddressed and taken for granted (Jennings & van Deth, 1990; Norris, et al., 2005; Stolle &
Hooghe, 2011; Verba, et al., 1978). In this contribution, aimed at charting trends in political
participation in Europe, we include assessments of equivalence within countries as well as
equivalence of measurements over time focusing on the most recent data available.
Data & Measurements
Data
To assess trends in conventional and unconventional participation in Europe we rely on data
from the EVS (EVS, 1981, 1990, 1999) and the ESS (ESS, 2002, 2004, 2006, 2008). For
conventional political participation we solely use ESS data since measurement of
conventional political participation in the EVS are incomparable over time and incomparable
with ESS data2. The EVS is an ongoing project to assess socio-cultural change and to monitor
2 The item wording concerning voting behavior is inconsistent over time in the EVS. In 1981 the
respondents were asked whether they considered themselves as close to a particular political party. In
1990 and 1999 respondents were asked which political party they would vote for if there were general
elections tomorrow. In the ESS respondents were asked to indicate which political party they had voted
for in the most recent parliamentary elections.
7
changes in values and norms across different cultures, using face-to-face interviews. The EVS
is conducted on behalf of the Inter-University Consortium for Political and Social Research
and covers three decades (1981-2010) of which we will use the first two decades (1981-
1999). The ESS is a cross-nationally comparable survey aimed to chart and explain the
interaction between Europe‟s changing institutions and the social and political beliefs and
behavior of European citizens. The European Commission and the European Science
Foundation fund the ESS. Using both the EVS and the ESS data enables us to describe trends
in unconventional political participation from 1981 onwards and trends in conventional
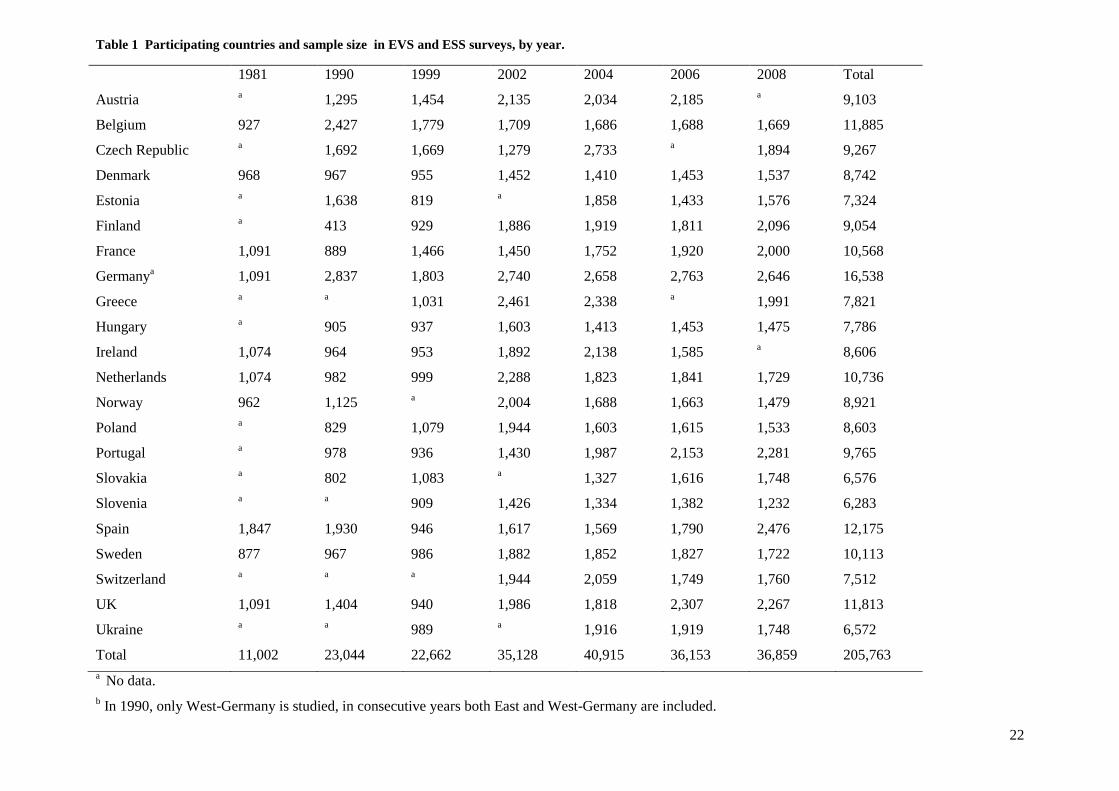
political participation from 2002 onwards in 22 European countries. An overview of sample
size and participating countries is provided in Table 1.
<< Table 1 sample size and participating countries >>
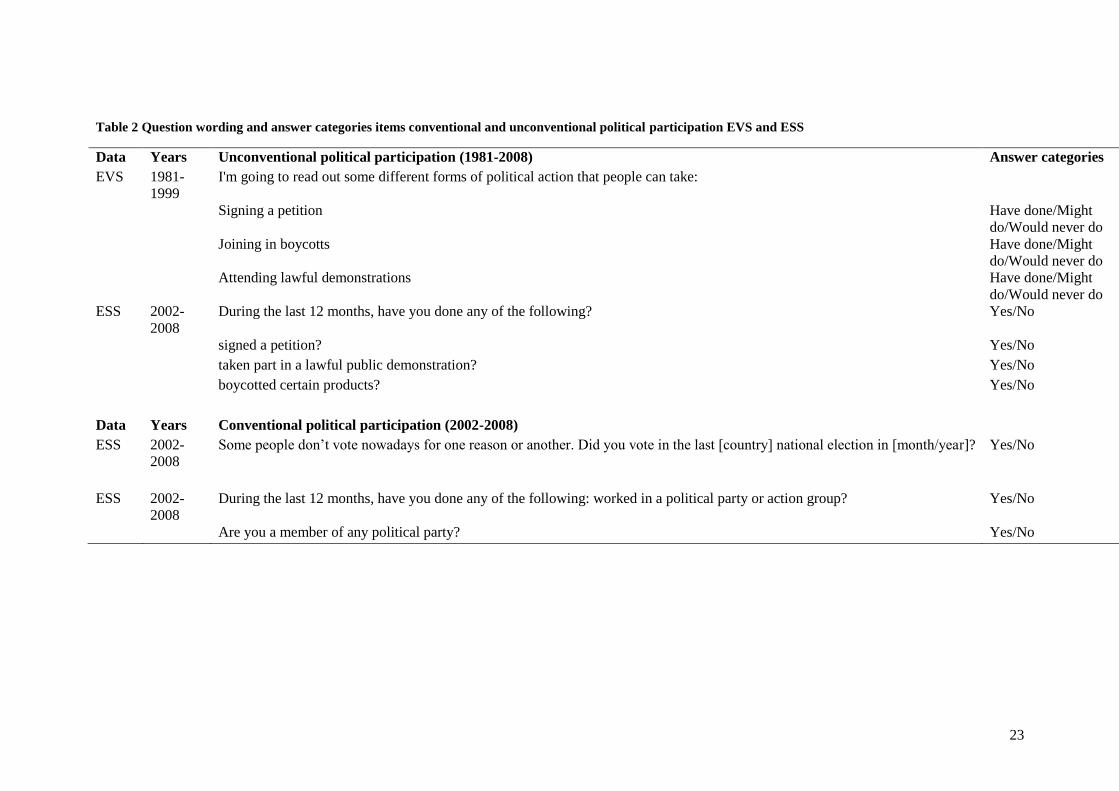
Measurements
Concerning political participation the EVS and the ESS included the items displayed in Table
2 in their core modules, which are implemented in every wave. The exact question wording
differs over the various datasets, as is shown in Table 2.
<< Table 2 questions, items and question wording >>
First, in the EVS respondents were asked to indicate whether they ever engaged in a
certain type of political action. In the ESS the respondents were asked to mention political
activities in which they engaged within a time-constraint of the past 12 months. Since the ESS
poses a time-wise constraint of twelve months it is likely that the latter item will result in
lower proportions of people engaging in a certain act. Second, for unconventional
participation3 the EVS inquires about “joining in boycotts” whereas the ESS specifically asks
whether people boycotted certain products. Joining in boycotts may be interpreted differently
as boycotting certain products. Joining in boycotts may be interpreted as a more activist act
referring to blocking buildings and roads whereas “boycotting certain products” refers to
refraining from buying certain products driven by political motives.
As a result of these differences in question wording, we split our data and analyze
two separate parts. Unconventional political participation can be studied before and after the
3 Also, the EVS includes a “might do” category on items referring to unconventional political
participation. To compare across time, the items for the EVS are dichotomized. Respondents who
indicate that they “might engage” in a certain act are combined with respondents who would never do a
certain act in order to measure actual participation.
8
turn of the millennium (from 1981 to 2008) based on combined EVS and ESS data.
Conventional political participation can be studied from the turn of the millennium onwards.
Hence, the trends displayed from 1981 to 1999 are based on the EVS and trends from the turn
of the millennium onwards are based on the ESS.
Methods
We employ Mokken scaling procedures (Mokken, 1971; van Schuur, 2003) to arrive at a
cross-nationally and longitudinally comparable model of political participation. By doing this
we aim to compare similar concepts (modes of political participation) across different
contexts (various European countries at different points in time). Mokken-scale analyses
depart from a set of dichotomous indicators (i.e. voting yes/no, boycotting yes/no, etc.). Item
Response Theory assumes that a scale can be represented as a line with items ranging from
easy to difficult and the proportion of respondents „correctly‟ answering the questions ordered
from low to high. Thus, some items (e.g. voting) may be easier -popular- activities compared
to others (e.g. being a member of a political party). The popularity of the items is expressed in
the proportion of respondents who engage in a particular political activity. The decisive
notion is that those who engage in less popular or difficult activities (members of political
parties) will probably also engage in easier or more popular activities (voting). On a more
theoretical note, implicitly or explicitly it is assumed that people specialize within either
conventional or unconventional modes of participation and that participation is cumulative
(Millbrath, 1965; Verba, et al., 1978; Zukin, 2006). Mokken-scaling procedures incorporate
the respective „difficulty‟ of certain acts of political participation (e.g. being a member of a
political party) vis-à-vis other, easier or more mainstream acts of political participation (e.g.
voting at national elections). By assessing the respective difficulty of acts of political
participation using Mokken-scaling procedures we acknowledge this cumulative nature of
participation.
The procedure provides the following scalability coefficients. The Hi parameter refers
to the association between a particular item and the rest scores of all other items. Dividing the
number of „incorrect‟ answers (Guttmann errors) in the observed data by the expected number
of „incorrect‟ under the null hypothesis (non-cumulative independent items) results in
Loevinger‟s Hi. Likewise, scale-H summates over all item pairs in the scale. This indicates
the strength of the scale as a whole. Scale-H parameters between 0.3 and 0.4 indicate weak
scales. Scale-H parameters higher than 0.4 and lower than 0.5 indicate moderate scales.
Finally, Scale-H parameters higher than 0.5 indicate strong scales (Sijtsma & Molenaar,
2002). By using probabilistic scale modeling techniques one is able to test the assumption of
9
monotone homogeneity. In the vein of Item Response Theory, this means that the probability
of a positive response to an item increases in concordance with the value of a subject‟s latent
trait. Applied to political participation this means we can test whether an individual engaging
in a difficult activity (being a member of a political party), thereby having a higher score on
the latent trait “political participation”, also engages in an easier activity (voting). Hence, if
the same item-order is found over time in each country, measurements are considered as
equivalent. A stricter test is the test for double monotonicity, implying that the item response
functions do not intersect. Here we test whether the order or difficulty is the same for
different subgroups (Sijtsma & Molenaar, 2002). Since only three items are used for both
conventional and unconventional political participation it is impossible by definition to do a
strict test on violations of the assumption of monotone homogeneity and double
monotonicity. In order to incorporate this notion we include reliability coefficient Rho as an
indicative check for monotone homogeneity and double monotonicity.
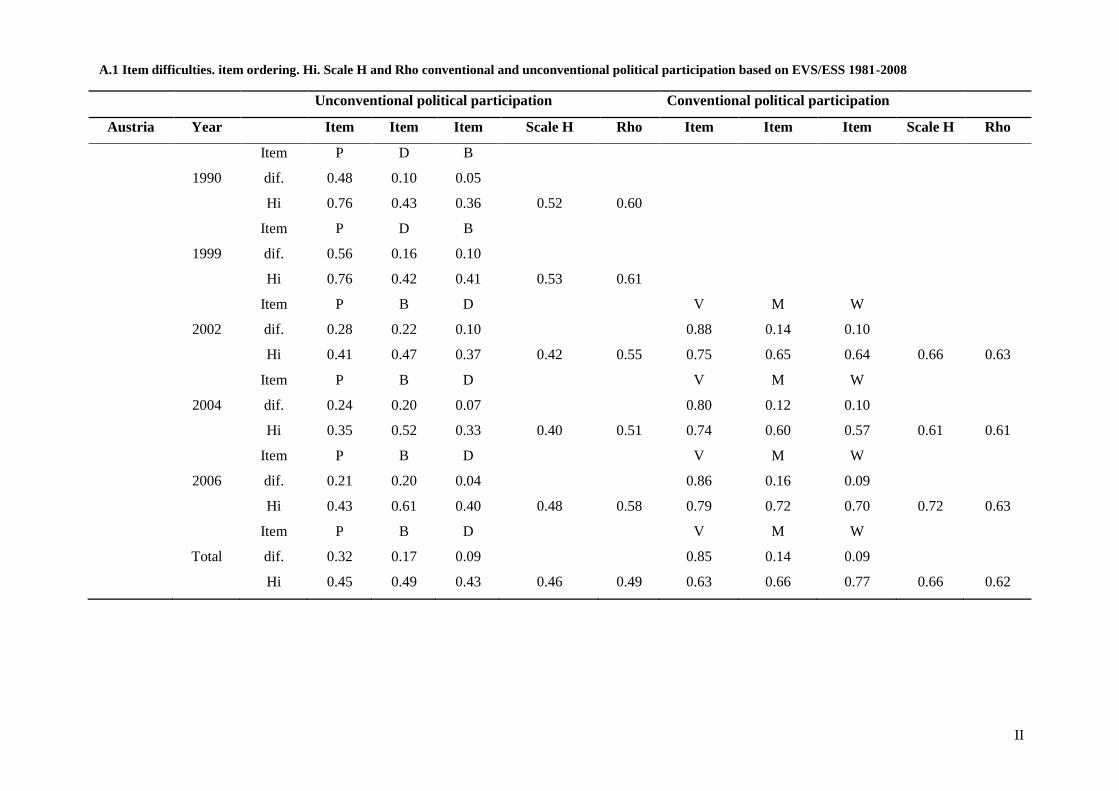
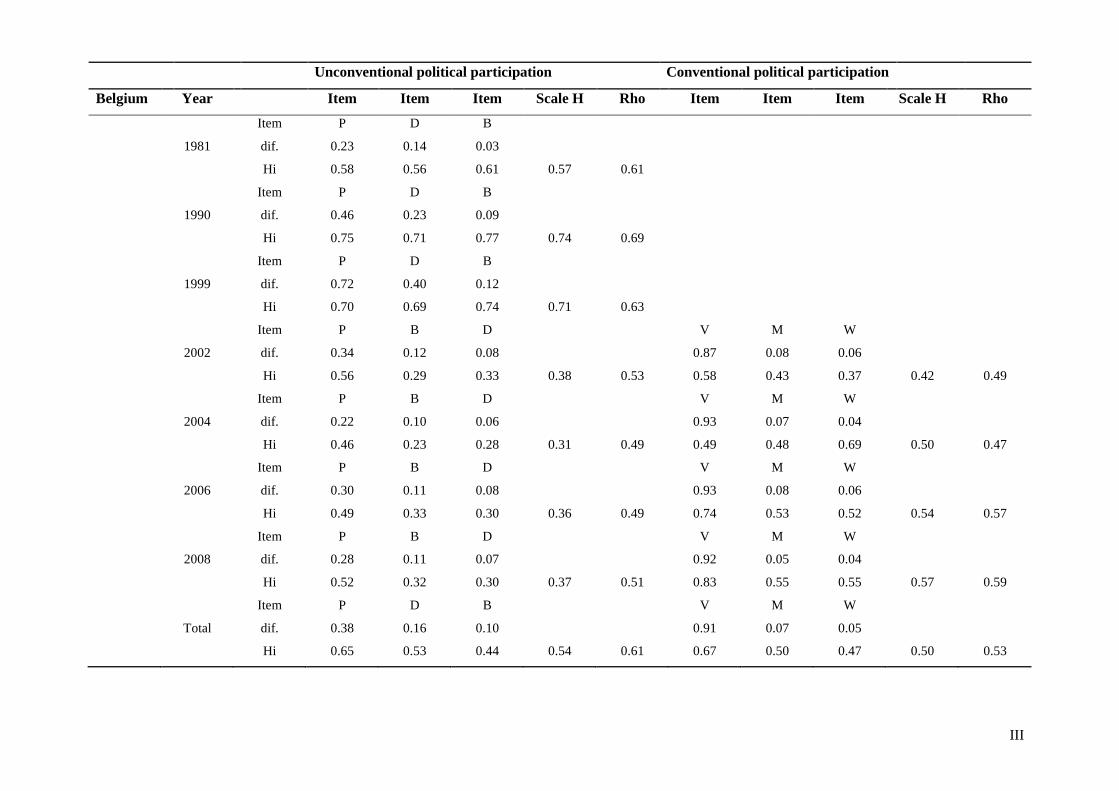
Equivalence
To assess the extent to which the scales for conventional and unconventional political
participation proposed are equivalent we use the following three-step analytical strategy.
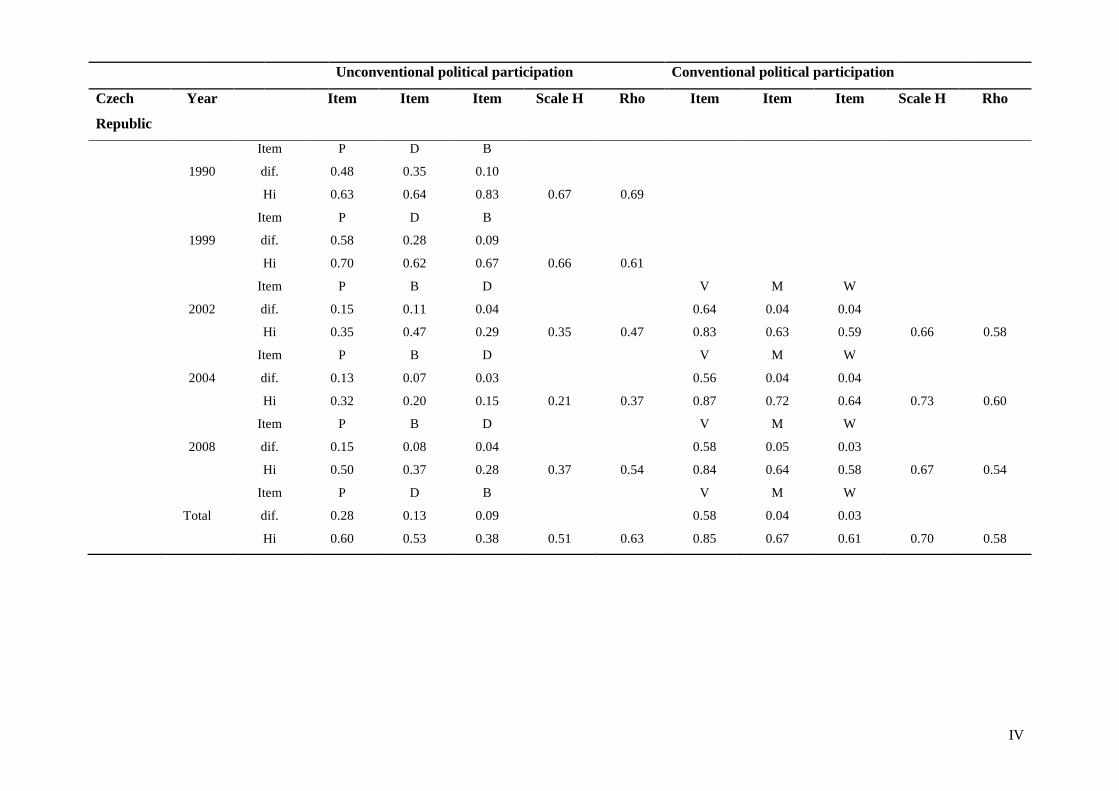
First, to assess the equivalence of scales we compare the general pattern in item ordering to
the item-ordering in each individual country-year combination, as shown in the row totals in
the Appendix. Second, to determine whether item ordering is consistent over time, we
scrutinize the row total for each country. These parameters represent a test of equivalence
across all years studied, for each country. If the country-year combination reflects the general
pattern, the measurements are equivalent. Third, we assess the quality of the scales based on
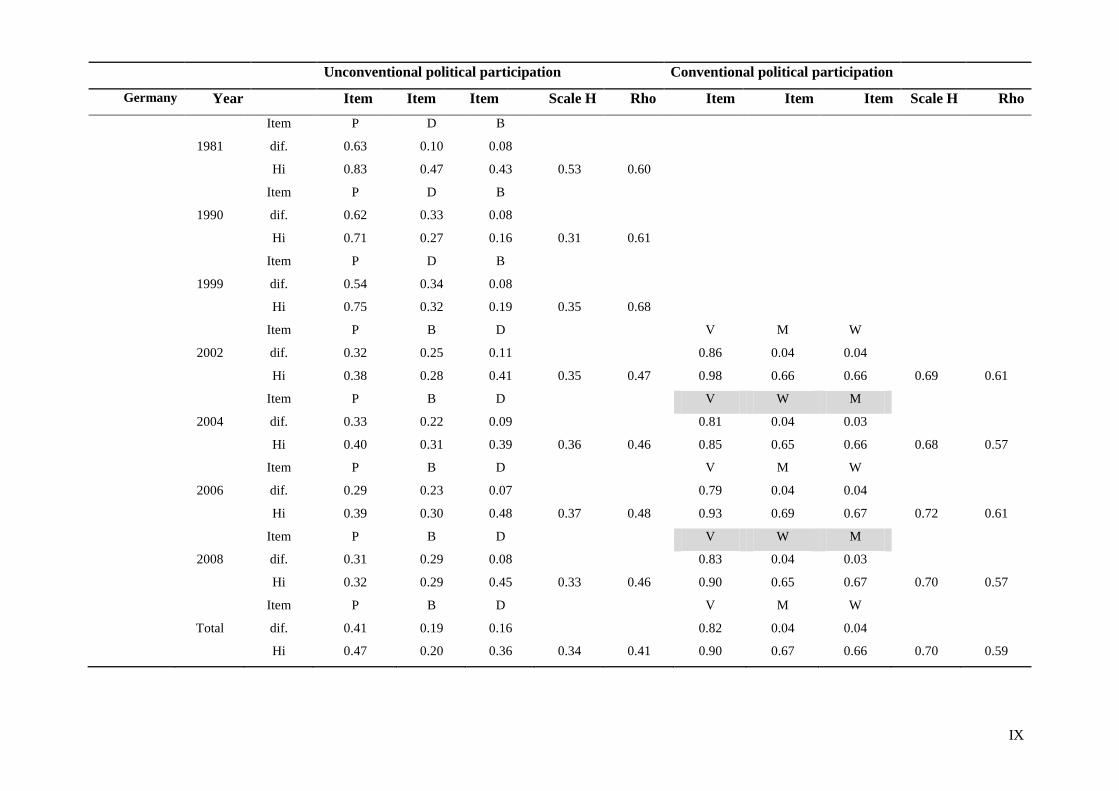
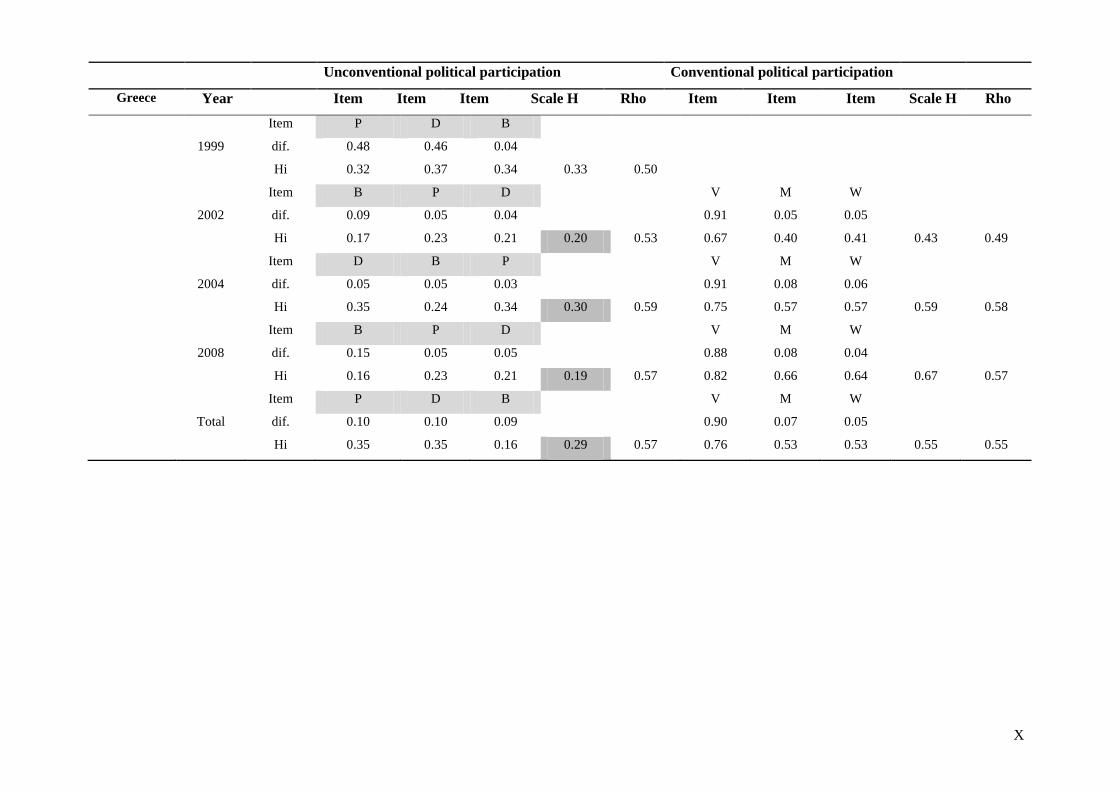
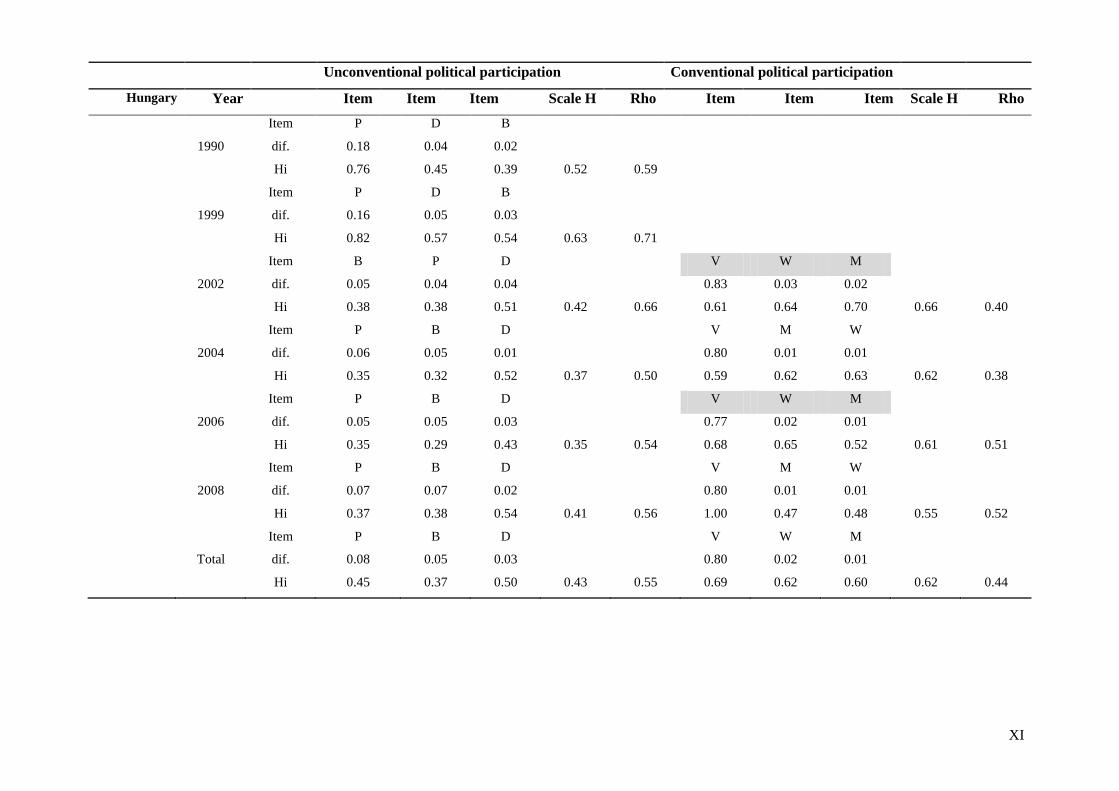
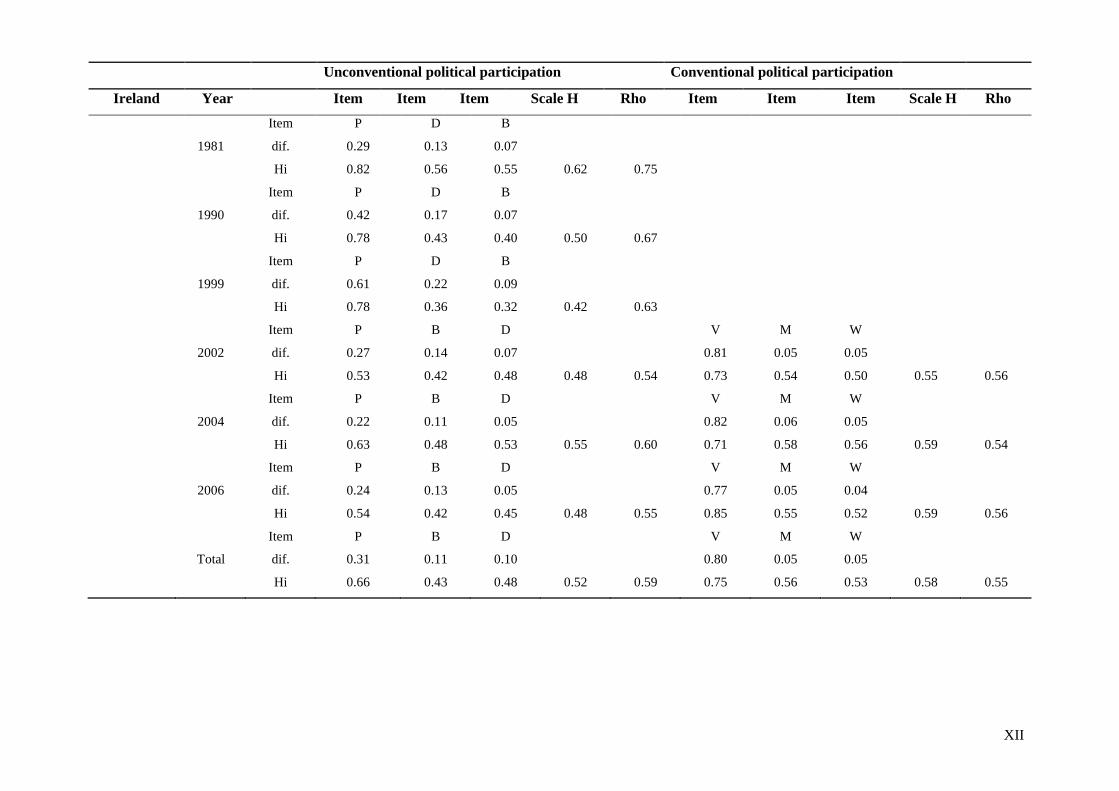
scalability parameters Hi, Scale-H, and Rho. Scales are classified as very weak if Scale-H is
below 0.3. On the basis of item-ordering, Hi-values, Scale-H and the values of Rho it will be
indicated for which countries the classification in conventional and unconventional political
participation as proposed here does not hold and is therefore non-equivalent. The relevant
parameters (i.c. exceptions to the general pattern and/or low scalability parameters) are
highlighted in the Appendix Table A.1.
Equivalence of scales over time and across countries: Unconventional
political participation
Let us first look at the general behavioral pattern, as shown in the row total at the bottom of
the table in the Appendix Table A.1. Petitioning is the most popular political activity. On
10
average, 30% of the respondents in the countries studied indicated that they had signed a
petition. Boycotting is a more difficult activity since 14% of the respondents indicated they
had used boycotting as a means of political participation. The least popular activity is
demonstrating. On average, 11% of the respondents attended a demonstration.
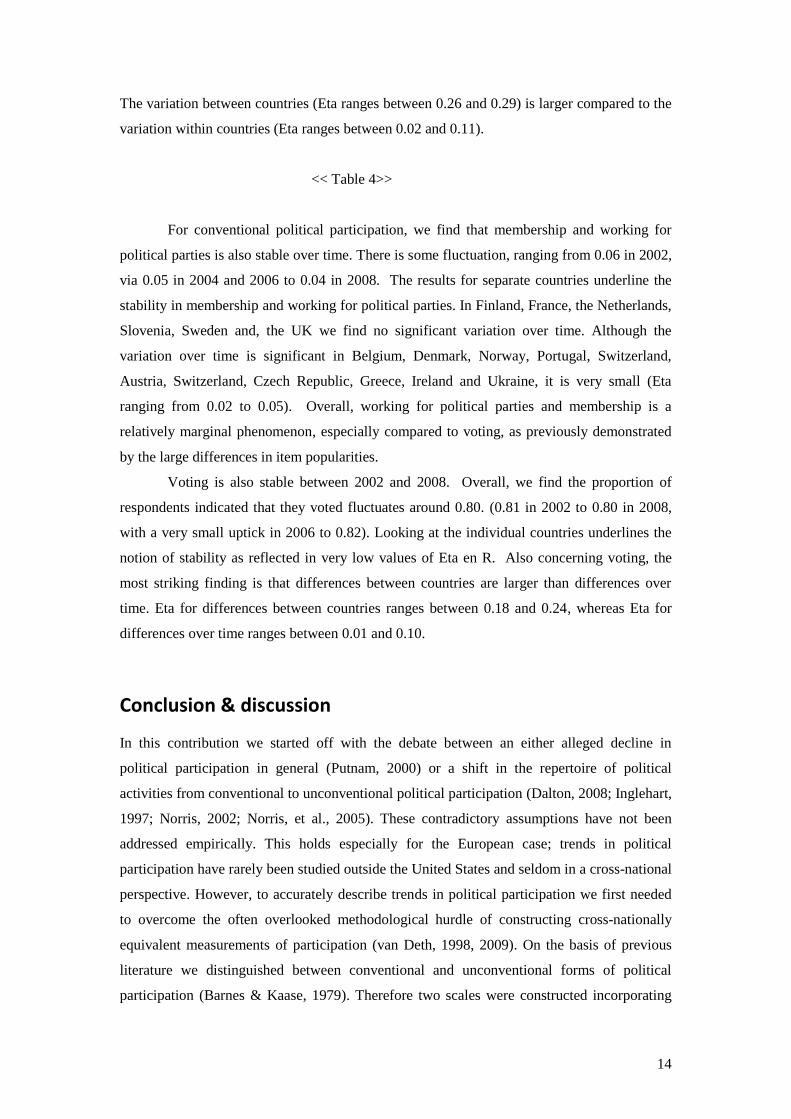
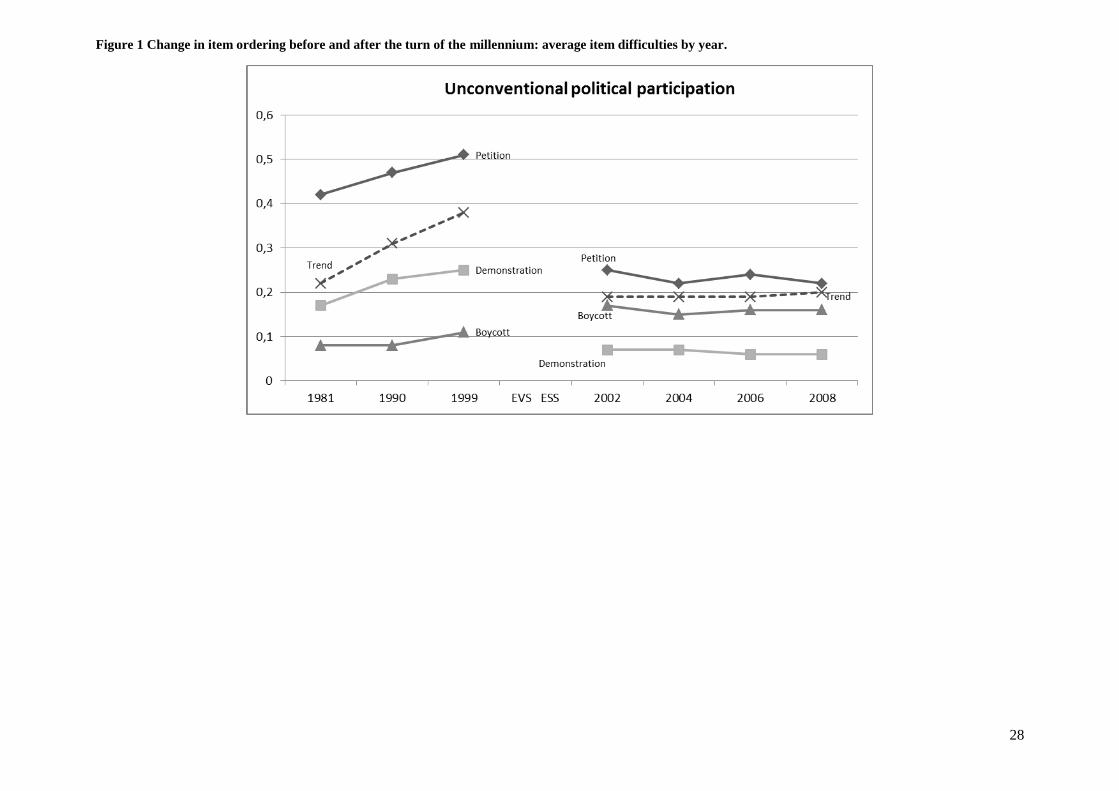
However, the ordering of items is different before the turn of the millennium
compared to after the turn of the millennium. Before the turn of the millennium the item
ordering is petitioning, demonstrating and boycotting, respectively, whereas after the turn of
the millennium the item ordering is petitioning, boycotting and demonstrating. Before the turn
of the millennium we find that demonstrating is more prevalent compared to boycotting,
whereas after the turn of the millennium boycotting is more popular. This pattern is found in
the majority of countries and graphically displayed in Figure 1. The switch in demonstrating
and boycotting before and after the turn of the millennium may be due to the aforementioned
difference in question wording between EVS and ESS. In the ESS respondents are asked
whether they engaged in a demonstration or a boycott the previous 12 months whereas in the
EVS respondents were asked whether they ever engaged in demonstrating or boycotting.
<< Figure 1 switch in item order >>
Notable exceptions to this behavioral pattern are Portugal, Spain, Greece, and
Ukraine. In Portugal, the ordering of items is consistent over time but inconsistent compared
to other countries; boycotting and demonstrating do not switch popularity after the turn of the
millennium as seen in other countries studied. This means that for Portugal the scale remains
equivalent over time but is incomparable to other countries. A similar interpretation holds for
the Ukraine, where the ordering of items is consistent over time but inconsistent compared to
other countries studied; demonstrating is more popular than petitioning and boycotting,
whereas in other countries petitioning is the most popular activity. However, this is due to
very close inter-item difficulties in Ukraine. In Spain and Greece the item ordering switches
continuously from 2002 onwards.
Since the order of demonstrating and boycotting changes after the turn of the
millennium consistently in most countries, we split our dataset and separately calculate
scalability parameters before and after the turn of the millennium. All in all, we find that the
EVS-waves provide good scales (Scale H 0.64) whereas the ESS-waves provide moderate
scales (Scale H 0.41), as shown in the bottom rows of the Appendix.
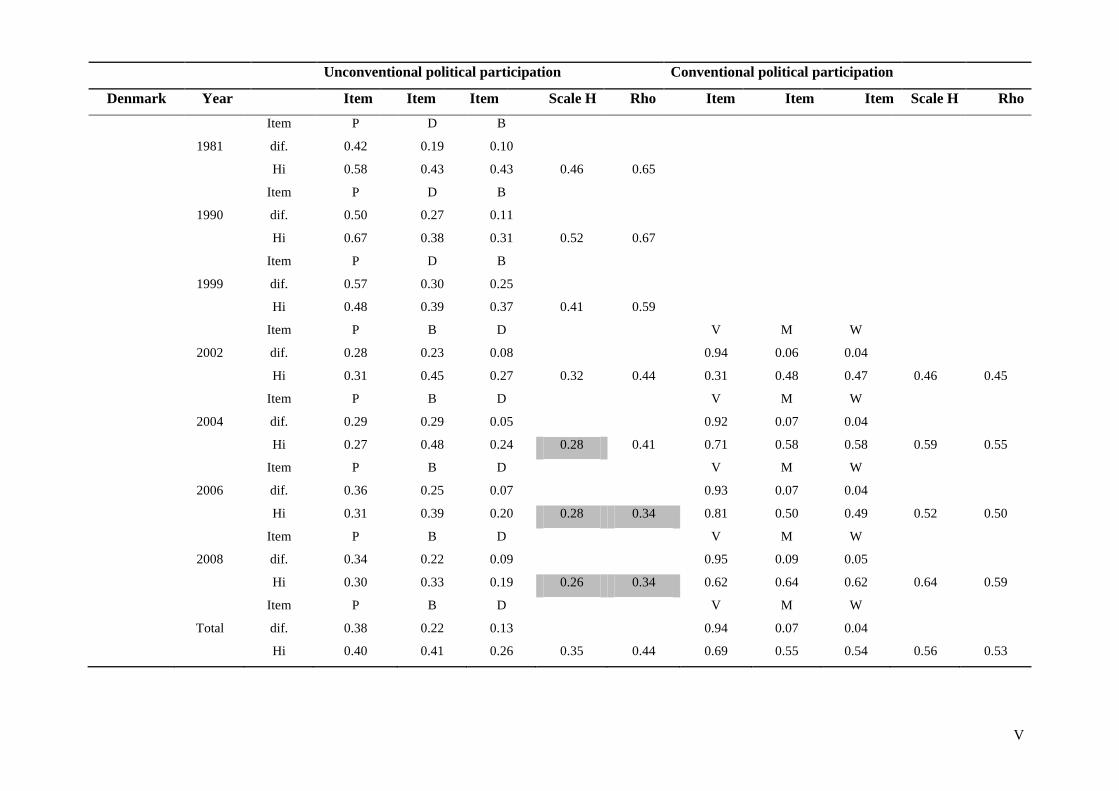
Although the overall picture indicates moderate to strong scales we find very weak
scales (Scale-H < 0.3) in Denmark, Estonia, Greece and Poland. Greece is below the 0.3
threshold in 2002 and 2008. The same holds for Denmark. However, in Denmark this is partly
due to very close inter-item difficulties for petitioning and boycotting (i.c. 0.29 and 0.29 in
11
2002). In addition, we find relatively low values of Rho for the 2006 and 2008 surveys in
Denmark. This means that the assumptions of monotone homogeneity and double
monotonicity are likely to be violated. This also holds for Poland in 2002 and 2006, where we
find low values of scalability coefficient Scale-H combined with relatively low values of Rho
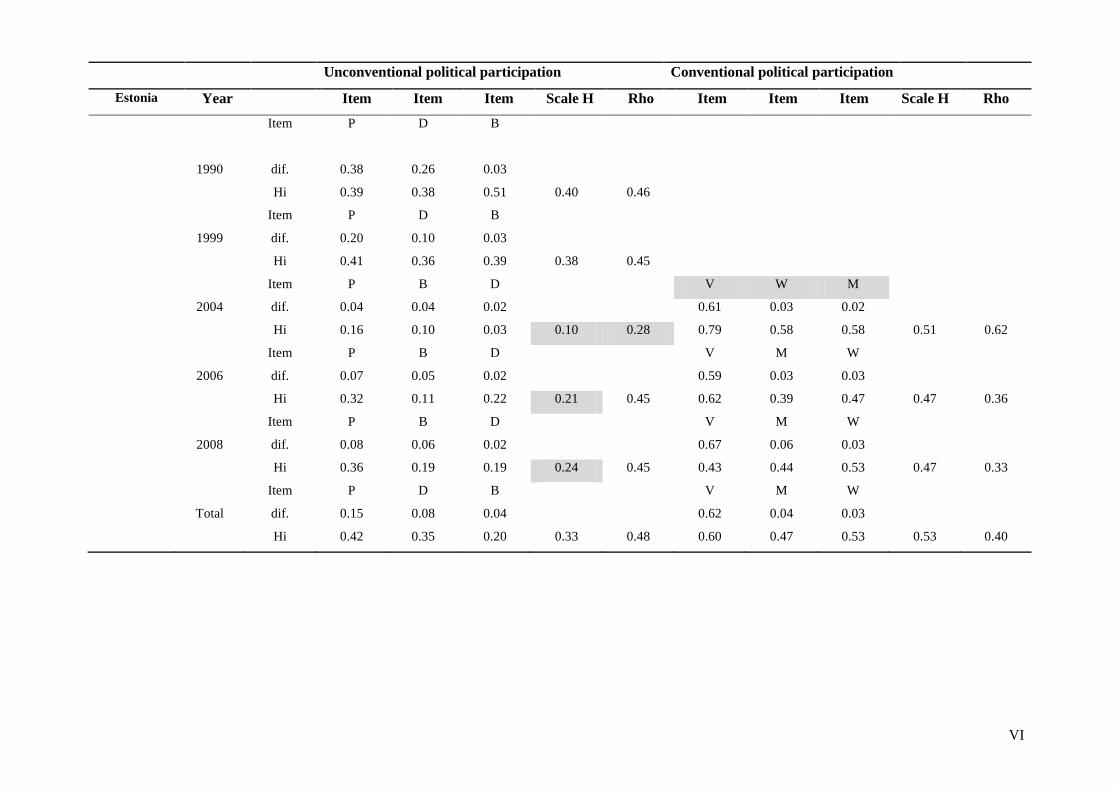
in 2002. In Estonia we also find very weak scales from 2004 onwards, which might also be
due to close inter-item difficulties. For instance, in Estonia in 2004 the item difficulties for
petitioning and boycotting are exactly the same. As a result, scalability coefficients scale-H
and Rho are also rather low and these measurements are considered as non-equivalent.
Summarizing, concerning unconventional political participation we find that
demonstrating is less popular after the turn of the millennium. Instead, boycotting is a more
prevalent unconventional political activity from 2002 onwards. On the basis of item ordering,
Spain, Portugal, the Ukraine and, Greece are non-equivalent since they deviate from the
general behavioral pattern. On the basis of scalability parameters Denmark and Estonia are
non-equivalent as scalability coefficients are weak. Greece is non-equivalent due to both
distinctive item ordering and low scalability coefficients.
Equivalence of scales over time and across countries: Conventional political
participation
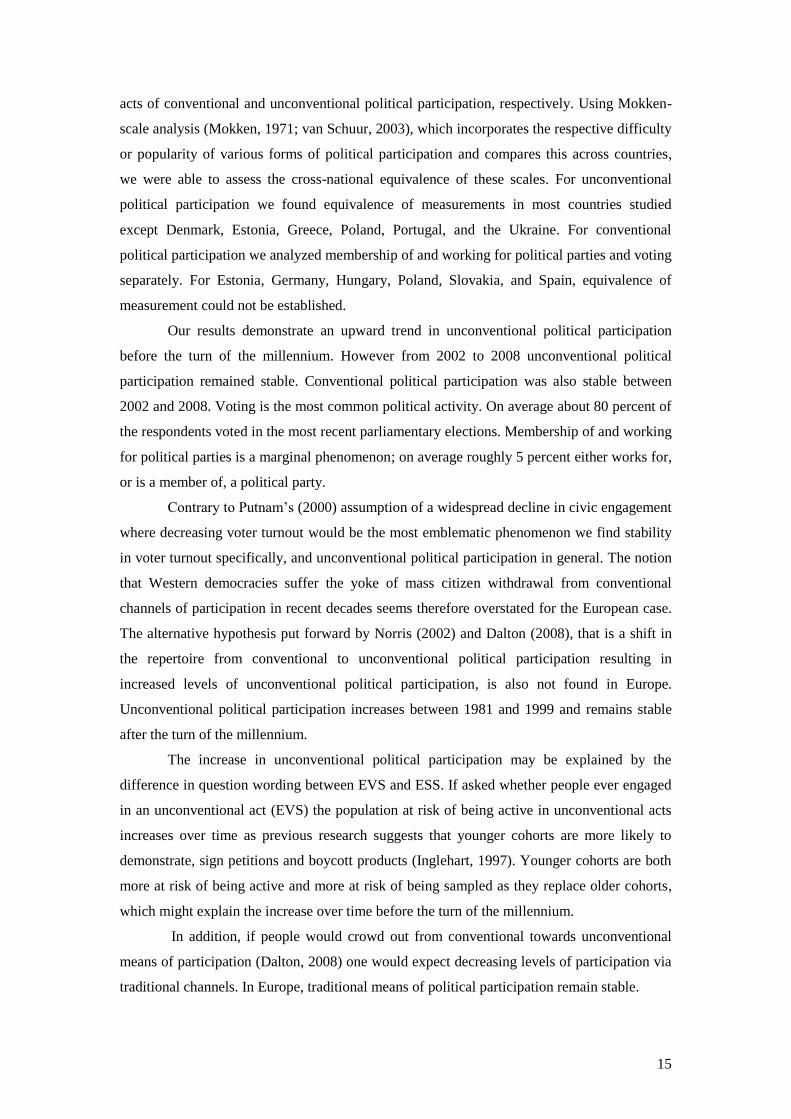
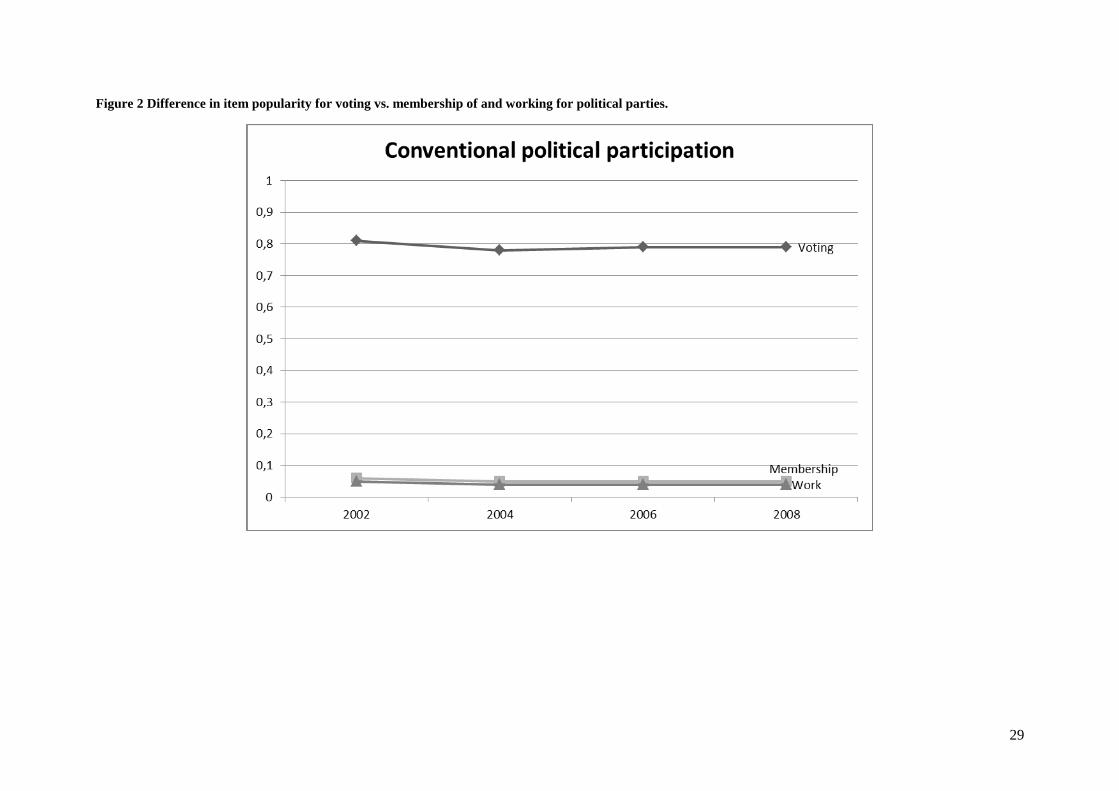
For conventional political participation we find that voting is by far the most popular activity
(See Figure 2). The general ordering of items from most popular to least popular is voting
(0.8), membership of a political party (0.5) and working for a political party (0.4).
Since voting is by far the most popular activity (see Figure 2), constructing a scale,
which includes the item voting, may distort the results since changes in the scale-score will be
disproportionally influenced by changes in the proportion of people who vote. Theoretically,
voting can be considered as a distinct activity compared to membership and working for
political parties as this is an activity employed once every few years. Membership and
working for political parties usually involves more prolonged commitments. It is therefore
that membership and working for political parties and voting are analyzed separately.
<< Figure 2 >>
The pattern voting, membership and working for political parties, exists in the vast
majority of countries. The notable exceptions to this item ordering are Germany, Hungary,
Estonia, Spain, Slovakia, and Poland. In Spain, Slovakia and Poland working for political
parties is consistently more popular compared to being a member of a political party.
12
Estonia, Hungary and Germany show less frequent anomalies to the general ordering of
voting, working for and membership of political parties. In Estonia in 2004 and Germany in
2004 and 2006 working for political parties is more popular compared to being a member of a
political party. However, inter-item difficulties for voting and membership are very close in
these cases. The same applies to Hungary in 2004 and 2006; due to very close inter-item
difficulties working for political parties is more popular compared to being a member of
political parties. Overall scalability-parameter scale-H indicates a good scale for conventional
political participation (scale-H 0.60). None of scale-H parameters in the country-year
combinations studied is below the 0.3 threshold.
Summarizing, concerning conventional political participation we argue that Germany,
Hungary, Estonia, Spain, Slovakia, and Poland are non-equivalent as the item ordering
deviates from the generally observed pattern.
On the basis of assessment of equivalence we turn to the analyses of trends in
political participation in Europe. For unconventional political participation we separate the
analyses before and after the turn of the millennium. The scale for unconventional political
participation is constructed using the average score on the items, petitioning, boycotting, and
demonstrating so that the scale represents the proportion of people engaging in
unconventional political participation. As mentioned, conventional political participation is
only analyzed after the turn of the millennium. Voting is analyzed separately for membership
of political parties and working for political parties a scale using the average score on both
items is used. By doing this the scales represent the proportion of people engaging in
conventional political participation.
Results
To analyze trends in conventional and unconventional political participation we employ
Analyses Of Variance (ANOVA). The results are presented in Table 3 and Table 4, which
display the average values on the relevant scales in each year of survey. A division is made
between those countries classified as equivalent and non-equivalent based on the assessment
of equivalence in the previous section. Since the empirical data clearly demonstrate that a
linear trend cannot always be fitted we provide both Eta (non-linear measure of association)
and R (linear measure of association). Measure of association Eta is reported in a separate
column (vertically) and in a separate row (horizontally). The estimate of Eta in the column
assesses the extent to which political participation varies over time. The estimate of Eta in the
rows (horizontally) tests the extent to which political participation varies over countries.
Since some countries did not participate in some EVS or ESS waves, Eta measuring
13
differences across countries is only calculated for countries who participated in all EVS or
ESS waves. For the same reason of limited data availability in certain countries, some
measures of association cannot be calculated (see footnotes for Table 3 and Table 4).
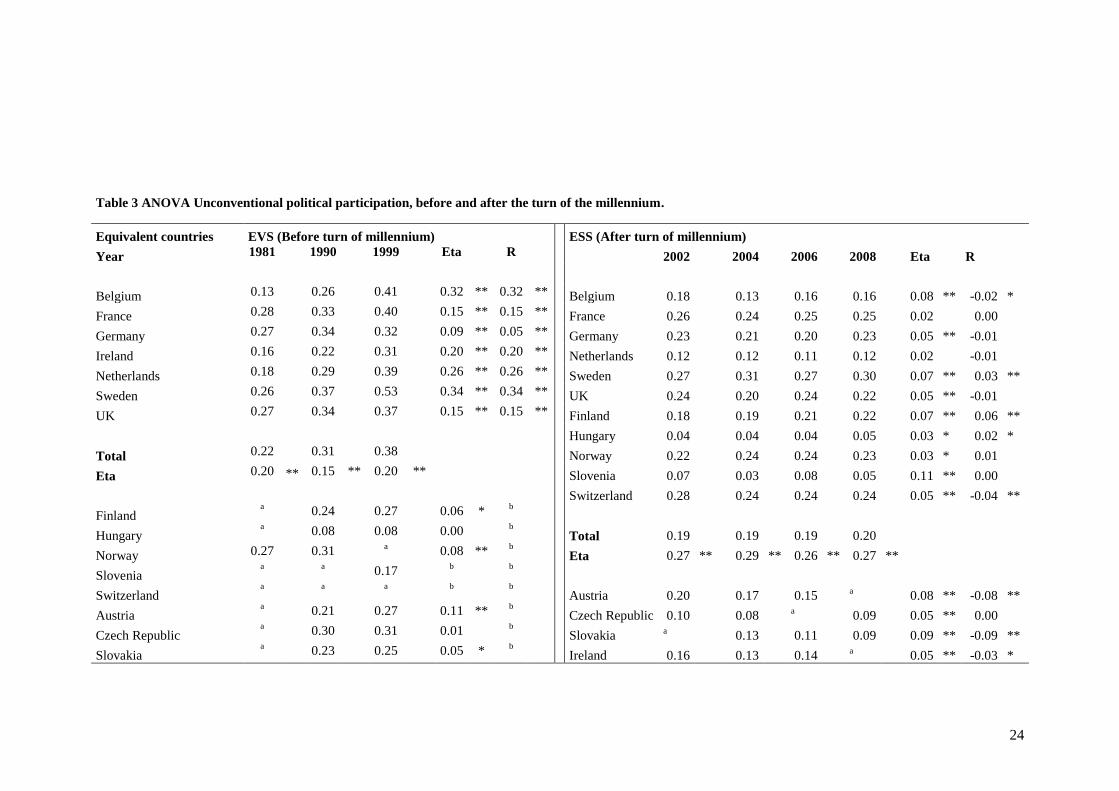
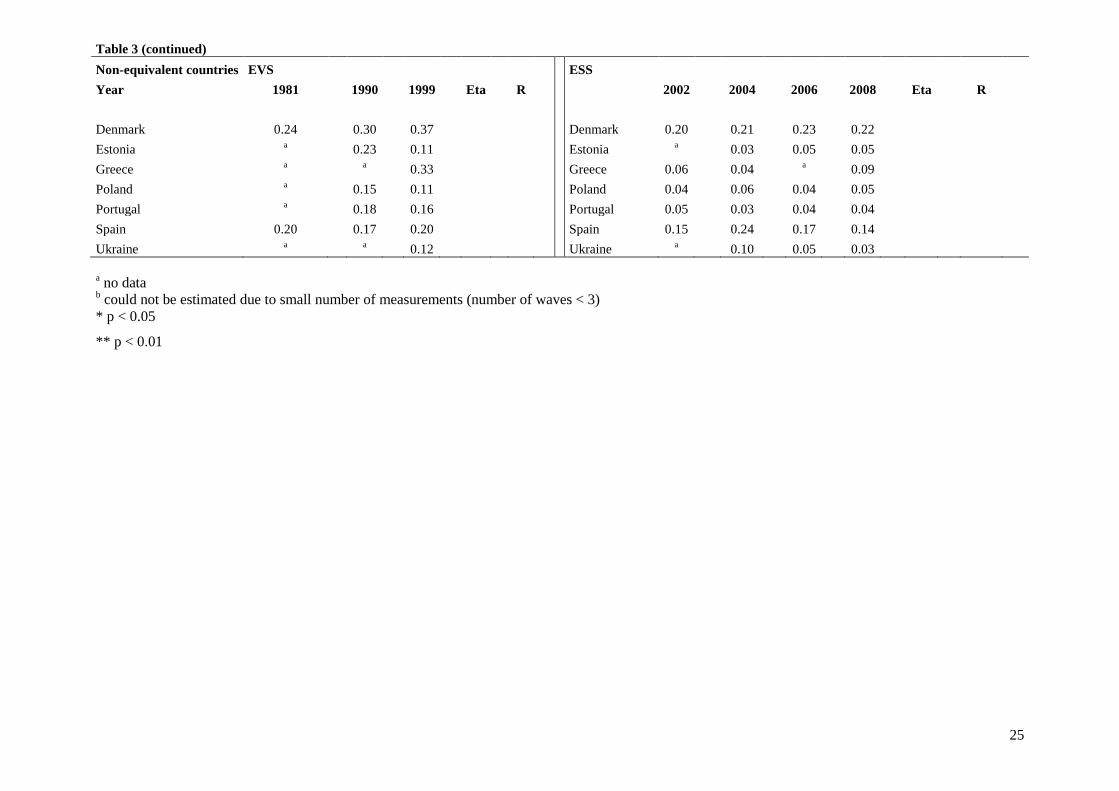
<< Table 3>>
As demonstrated in Table 3, unconventional participation increases before the turn of
the millennium. Overall, we find an increase in unconventional political participation
(ranging from 0.22 in 1981 to 0.38 in 1999). Unconventional political participation heavily
increases in Belgium and Sweden (R and Eta are 0.32 and 0.34 respectively). Sweden is the
most active country studied; in 1999 a majority of the Swedish population reported that they
engaged in either a boycott, demonstration or petition. The French, Dutch, Irish, and Britons
also demonstrate increased unconventional political activism between 1981 and 1999. This is
however a less sharp increase compared to Belgium and Sweden (Eta and R range between
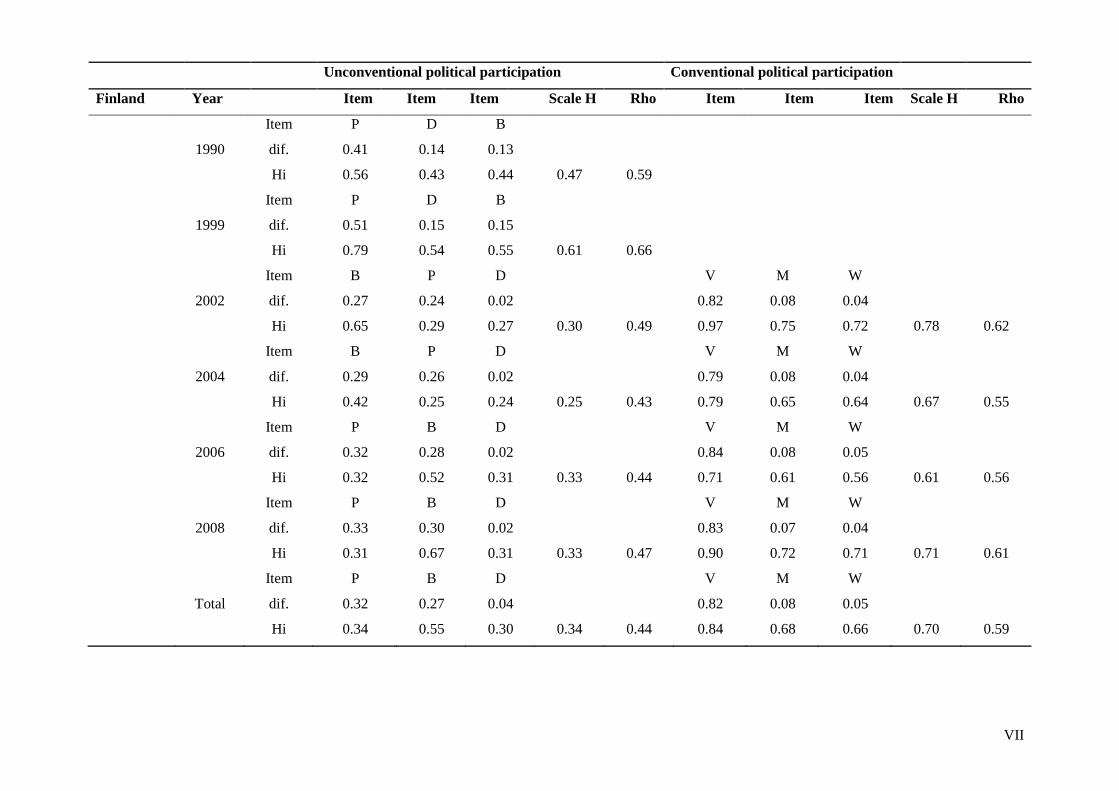
0.15 and 0.26). Germany (Eta = 0.09), Finland (Eta = 0.08), Norway (Eta = 0.08), Slovakia
(Eta = 0.05) and Austria (Eta = 0.11) demonstrated very weak, though significant, increased
levels of unconventional participation before the turn of the millennium.
Although unconventional political participation is increasing before the turn of the
millennium, after the turn of the millennium levels of unconventional political participation
are characterized by stability. Note that the question to respondents in the ESS-dataset
provides a time-wise constraint. After the turn of the millennium respondents were asked in
the ESS-dataset whether they engaged in political activities during the past 12 months,
whereas in the EVS-dataset respondents were asked whether they ever participated in
unconventional political activities. Overall, unconventional political participation remains
stable from the turn of the millennium onwards (ranging from 0.19 in 2002 to 0.20 in 2008).
This is also reflected in the measures of association. Although parameters Eta and R are
significant they do not show a pronounced increase or decrease in participation. Instead
conventional political participation remains stable. Eta ranges from 0.02 in France to 0.11 in
Slovenia. After the turn of the millennium, unconventional political participation remains
stable. This is also reflected in Figure 1 where the trend in unconventional political
participation is plotted.
Looking at unconventional political participation both before and after the turn of the
millennium, the most striking finding is that differences between countries are larger than
differences over time. For example, in 2008, one in every four French respondents engaged
in unconventional acts against one in every twenty Slovenian respondents. After the turn of
the millennium this is also shown in the differences between countries as measured by Eta.
14
The variation between countries (Eta ranges between 0.26 and 0.29) is larger compared to the
variation within countries (Eta ranges between 0.02 and 0.11).
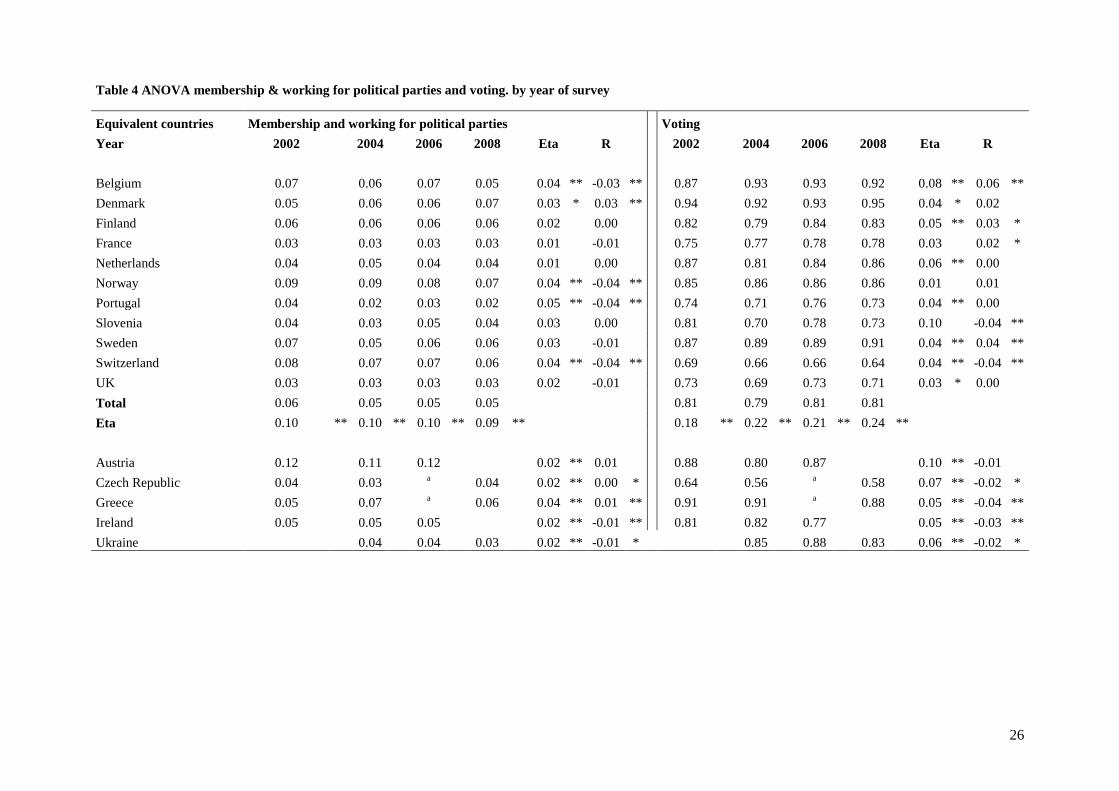
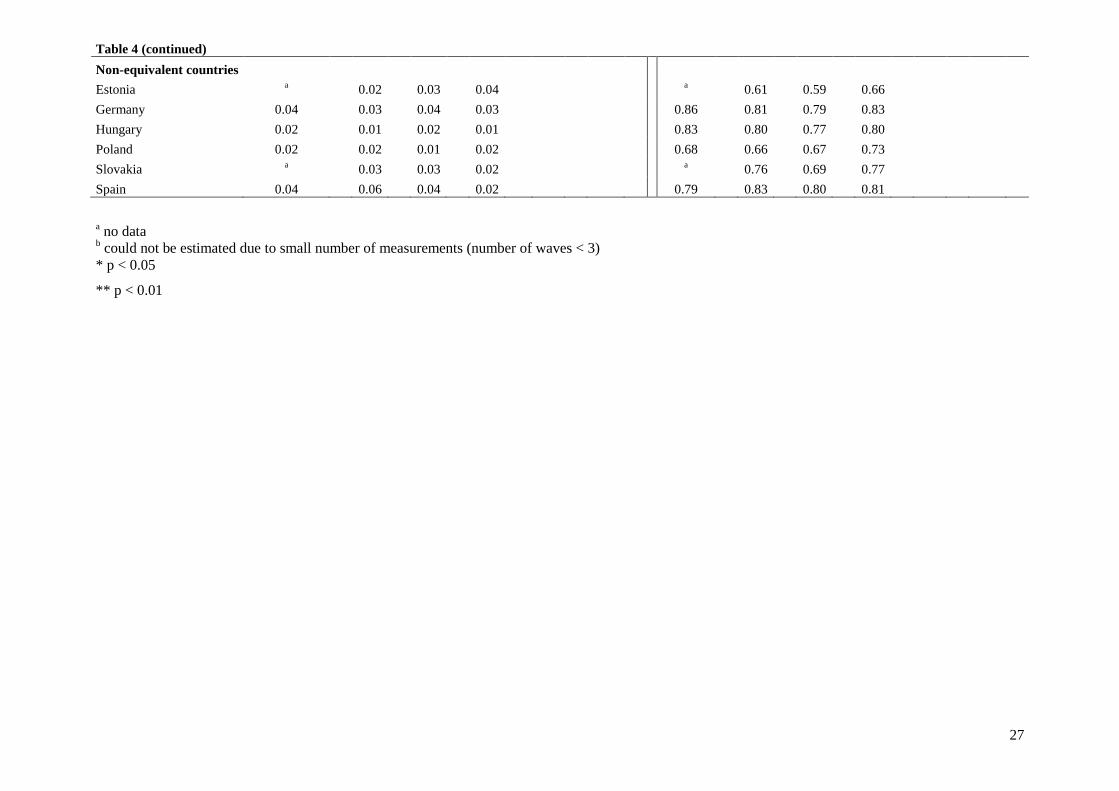
<< Table 4>>
For conventional political participation, we find that membership and working for
political parties is also stable over time. There is some fluctuation, ranging from 0.06 in 2002,
via 0.05 in 2004 and 2006 to 0.04 in 2008. The results for separate countries underline the
stability in membership and working for political parties. In Finland, France, the Netherlands,
Slovenia, Sweden and, the UK we find no significant variation over time. Although the
variation over time is significant in Belgium, Denmark, Norway, Portugal, Switzerland,
Austria, Switzerland, Czech Republic, Greece, Ireland and Ukraine, it is very small (Eta
ranging from 0.02 to 0.05). Overall, working for political parties and membership is a
relatively marginal phenomenon, especially compared to voting, as previously demonstrated
by the large differences in item popularities.
Voting is also stable between 2002 and 2008. Overall, we find the proportion of
respondents indicated that they voted fluctuates around 0.80. (0.81 in 2002 to 0.80 in 2008,
with a very small uptick in 2006 to 0.82). Looking at the individual countries underlines the
notion of stability as reflected in very low values of Eta en R. Also concerning voting, the
most striking finding is that differences between countries are larger than differences over
time. Eta for differences between countries ranges between 0.18 and 0.24, whereas Eta for
differences over time ranges between 0.01 and 0.10.
Conclusion & discussion
In this contribution we started off with the debate between an either alleged decline in
political participation in general (Putnam, 2000) or a shift in the repertoire of political
activities from conventional to unconventional political participation (Dalton, 2008; Inglehart,
1997; Norris, 2002; Norris, et al., 2005). These contradictory assumptions have not been
addressed empirically. This holds especially for the European case; trends in political
participation have rarely been studied outside the United States and seldom in a cross-national
perspective. However, to accurately describe trends in political participation we first needed
to overcome the often overlooked methodological hurdle of constructing cross-nationally
equivalent measurements of participation (van Deth, 1998, 2009). On the basis of previous
literature we distinguished between conventional and unconventional forms of political
participation (Barnes & Kaase, 1979). Therefore two scales were constructed incorporating
15
acts of conventional and unconventional political participation, respectively. Using Mokken-
scale analysis (Mokken, 1971; van Schuur, 2003), which incorporates the respective difficulty
or popularity of various forms of political participation and compares this across countries,
we were able to assess the cross-national equivalence of these scales. For unconventional
political participation we found equivalence of measurements in most countries studied
except Denmark, Estonia, Greece, Poland, Portugal, and the Ukraine. For conventional
political participation we analyzed membership of and working for political parties and voting
separately. For Estonia, Germany, Hungary, Poland, Slovakia, and Spain, equivalence of
measurement could not be established.
Our results demonstrate an upward trend in unconventional political participation
before the turn of the millennium. However from 2002 to 2008 unconventional political
participation remained stable. Conventional political participation was also stable between
2002 and 2008. Voting is the most common political activity. On average about 80 percent of
the respondents voted in the most recent parliamentary elections. Membership of and working
for political parties is a marginal phenomenon; on average roughly 5 percent either works for,
or is a member of, a political party.
Contrary to Putnam‟s (2000) assumption of a widespread decline in civic engagement
where decreasing voter turnout would be the most emblematic phenomenon we find stability
in voter turnout specifically, and unconventional political participation in general. The notion
that Western democracies suffer the yoke of mass citizen withdrawal from conventional
channels of participation in recent decades seems therefore overstated for the European case.
The alternative hypothesis put forward by Norris (2002) and Dalton (2008), that is a shift in
the repertoire from conventional to unconventional political participation resulting in
increased levels of unconventional political participation, is also not found in Europe.
Unconventional political participation increases between 1981 and 1999 and remains stable
after the turn of the millennium.
The increase in unconventional political participation may be explained by the
difference in question wording between EVS and ESS. If asked whether people ever engaged
in an unconventional act (EVS) the population at risk of being active in unconventional acts
increases over time as previous research suggests that younger cohorts are more likely to
demonstrate, sign petitions and boycott products (Inglehart, 1997). Younger cohorts are both
more at risk of being active and more at risk of being sampled as they replace older cohorts,
which might explain the increase over time before the turn of the millennium.
In addition, if people would crowd out from conventional towards unconventional
means of participation (Dalton, 2008) one would expect decreasing levels of participation via
traditional channels. In Europe, traditional means of political participation remain stable.
16
Yet, there are large cross-national differences. In short, differences between countries
are larger than differences over time for both conventional and unconventional political
participation. As political participation is embedded in the nation state, which determines
legal conditions, political actors and the strength of political institutions (Newton & Giebler,
2008; van der Meer, 2009) country-specific characteristics seem to be more important in
shaping political participation than changes over time. Szreter (2002) notes that the
institutional setting has a „critical facilitating‟ role in the opportunity to participate. Similarly,
Kriesi (2008) claims that political participation research underestimates the impact of
institutions. These mixed findings in trends in political participation indicatively support the
claim that the institutional setting has a critical facilitating role in channeling participation
and that more attention needs to be paid to the effects of the institutional setting and other
country-specific factors. Explaining cross-national differences and trends in conventional and
unconventional political participation involves formulating and testing hypotheses concerning
this institutional setting. Further research needs to address these issues.
Drawbacks of this study lie in the comparability of the different data sources.
Dissimilar sampling strategies and differences question wordings may pose a risk when
interpreting results over time. This is demonstrated in the lower scalability-coefficients for
unconventional political participation. Ideally, we would include a longer time trend.
However, data availability and especially data comparability, demonstrated by the
assessments of equivalence over time which resulted in excluding countries from further
analyses, advise against this approach.
The scope of political activities studied is rather limited and one can imagine that
newer methods of political participation are on the rise, especially in the context of increased
possibilities for communication through the internet. Still, the trends depicted here are, to our
knowledge, among the most extensive in terms of time-span as well as the variety of
countries.
17
Literature
Almond, G. A., & Verba, S. (1963). The civic culture; political attitudes and democracy in
five nations. Princeton, N.J.,: Princeton University Press.
Barnes, S. H., & Kaase, M. (1979). Political action: Mass participation in five western
democracies. Beverly Hills, CA: Sage.
Berelson, B., Lazarsfeld, P. F., & McPhee, W. N. (1954). Voting: A Study of Opinion
Formation in a Presidential Campaign. Chicago: University of Chicago press.
Bousetta, H. (1997). Citizenship and political participation in France and the Netherlands:
Reflections on two local cases. New Community, 23(2), 215-231.
Brady, H. E. (1999). Political Participation. In J. P. Robinson, P. R. Shaver & L. Wrightsman
(Eds.), Measures of political attitudes (pp. 737-801). San Diego, CA: Academic
Press.
Brady, H. E., Verba, S., & Schlozman, K. L. (1995). Beyond Ses - a Resource Model of
Political-Participation. American Political Science Review, 89(2), 271-294.
Burt, S. (2002). The concept of political participation. In J. Everitt & B. O'Neill (Eds.),
Citizen politics. Research and theory in Canadian political behavior (pp. 232-246).
New York: Oxford University Press.
Castenmiller, J., & Kriesi, H. (1987). De ontwikkeling van politiek protest in Nederland sinds
de jaren zeventig. Acta politica, 22(1).
Council of Europe (2004). A new strategy for social cohesion: European Comitte for Social
Cohesion (CDCS).
Council of Europe (2010). New Strategy and Council of Europe Action Plan for Social
Cohesion: European Comitte for Social Cohesion (CDCS).
Dahl, R. A. (1971). Polyarchy; participation and opposition. New Haven: Yale University
Press.
18
Dalton, R. J. (2008). Citizenship norms and the expansion of political participation. Political
Studies, 56(1), 76-98.
Dekker, P., Koopmans, R., & van den Broeck, A. (1997). Voluntary associations, social
movements and individual political behaviour in Western Europe. In J. W. van Deth
(Ed.), Private groups and public life: Social participation, voluntary associations and
political involvement in representative democracies. London: Routledge.
ESS (2002). European Social Survey Round 1 Data (2002). In Norwegian Social Science
Data Services (Ed.). Norway: Data Archive and distributor of ESS data.
ESS (2004). European Social Survey Round 1 Data (2002). In Norwegian Social Science
Data Services (Ed.). Norway: Data Archive and distributor of ESS data.
ESS (2006). European Social Survey Round 1 Data (2002). In Norwegian Social Science
Data Services (Ed.). Norway: Data Archive and distributor of ESS data.
ESS (2008). European Social Survey Round 1 Data (2002). In Norwegian Social Science
Data Services (Ed.). Norway: Data Archive and distributor of ESS data.
EVS (1981). European Values Study 1981- Integrated Dataset. In Leibniz-Institute for the
Social Sciences (Ed.). Leibniz: GESIS/ZACAT.
EVS (1990). European Values Study 1990- Integrated Dataset. In Leibniz-Institute for the
Social Sciences (Ed.). Leibniz: GESIS/ZACAT.
EVS (1999). European Values Study 1999- Integrated Dataset. In Leibniz-Institute for the
Social Sciences (Ed.). Leibniz: GESIS/ZACAT.
Franklin, M. N. (2004). Voter turnout and the dynamics of electoral competition in
established democracies since 1945. Cambridge: Cambridge University Press.
Geys, B. (2006). Explaining voter turnout: A review of aggregate-level research. Electoral
Studies, 25(4), 637-663.
Healy, T., Côté, S., Helliwell, J. F., Field, S., Centre for Educational Research and
Innovation., & Organisation for Economic Co-operation and Development. (2001).
19
The well-being of nations : the role of human and social capital. Paris: Organisation
for Economic Co-operation and Development.
Hooghe, M., & Dejaeghere, Y. (2007). Does the 'monitorial citizen' exist? An empirical
investigation into the occurrence of postmodern forms of citizenship in the Nordic
countries. Scandinavian Political Studies, 30(2), 249-271.
Inglehart, R. (1997). Modernization and postmodernization : cultural, economic, and political
change in 43 societies. Princeton, N.J.: Princeton University Press.
Jennings, M. K., & van Deth, J. W. (1990). Continuities in political action : a longitudinal
study of political orientations in three western democracies. Berlin: W. de Gruyter.
Kriesi, H. (2008). Political mobilisation, political participation and the power of the vote West
European Politics 31(1), 147-168.
Kymlicka, W., & Norman, W. (1994). Return of the Citizen - a Survey of Recent Work on
Citizenship Theory. Ethics, 104(2), 352-381.
Lipset, S. M. (1996). American exceptionalism : a double-edged sword. New York: W.W.
Norton.
Mair, P., & van Biezen, I. (2001). Party membership in twenty European democracies, 1980-
2000. Party Politics, 7(1), 5-21.
Marien, S., Hooghe, M., & Quintelier, E. (2010). Inequalities in Non-institutionalised Forms
of Political Participation: A Multi-level Analysis of 25 countries. Political Studies,
58(1), 187-213.
Marsh, A. (1990). Political action in Europe and the USA. London: MacMillan.
Millbrath, L. (1965). Political participation: How and why do people get in- volved in
politics? Chicago: Rand McNally.
Mokken, R. J. (1971). A theory and procedure of scale analysis with applications in political
research. The Hague,: Mouton.
20
Newton, K., & Giebler, H. (2008). Patterns of participation: Political and social
participation in 22 nations. Berlin: WZB
Norris, P. (2002). Democratic Phoenix : reinventing political activism. Cambridge:
Cambridge University Press.
Norris, P., Walgrave, S., & Van Aelst, P. (2005). Who demonstrates? Antistate rebels,
conventional participants, or everyone? Comparative Politics, 37(2), 189-+.
Parry, G., & Moyser, G. (1990). A Map of Political-Participation in Britain. Government and
Opposition, 25(2), 147-169.
Przeworski, A., & Teune, H. (2008). Equivalence in Cross-National Research. In C. Roberts
& R. Jowell (Eds.), Attitude measurement volume 4: Expanding measurement
horizons. Los Angeles: Sage.
Putnam, R. D. (2000). Bowling alone : the collapse and revival of American community. New
York: Simon & Schuster.
Putnam, R. D. (2007). E pluribus unum: Diversity and community in the twenty-first century
the 2006 Johan Skytte Prize Lecture. Scandinavian Political Studies, 30(2), 137-174.
Rawls, J. (1971). A theory of justice. Cambridge, Mass.,: Belknap Press of Harvard University
Press.
Reeskens, T., Quintelier, E., & Billiet, J. (2009, 16-17 January). Assesing the cross-cultural
equivalence of political participation in the European Social Survey. Paper presented
at the Cinefogo WP 11 Workshop: Methodological challenges in cross-national
participation research, the Hague, the Netherlands.
Ritzen, J. M. M., Easterly, W., & Woolcock, M. J. V. (2000). On "good" politicians and
"bad" policies : social cohesion, institutions, and growth. Washington, D.C.: World
Bank.
Rosenstone, S. J., & Hansen, J. M. (1993). Mobilization, participation, and democracy in
America. New York: Maxwell Macmillan International.
21
Schlozman, K. L., Verba, S., & Brady, H. E. (1995). Participations Not a Paradox - the View
from American Activists. British Journal of Political Science, 25, 1-36.
Sijtsma, K., & Molenaar, W. (2002). Introduction to nonparametric item response theory.
Thousand Oaks: Sage.
Stolle, D., & Hooghe, M. (2011). Shifting Inequalities? Patterns of exclusion and inclusion in
emerging forms of political participation. European Societies, 13(1), 119-142.
Szreter, S. (2002). The state of social capital: Bringing back in power, politics, and history.
Theory and Society, 31(5), 573-621.
van der Meer, T. (2009). States of freely associating citizens. Unpublished PhD Thesis,
ICS/Radboud University Nijmegen, Nijmegen.
van Deth, J. W. (1986). A note on measuring political participation in comparative research.
Quality and Quantity 20(2), 261-272.
van Deth, J. W. (1998). Comparative politics. The problem of equivalence. London:
Routledge.
van Deth, J. W. (2008). Political participation. In L. L. Kaid & C. Holtz-Bacha (Eds.),
Encyclopedia of political communication (Vol. 2). London: Sage.
van Deth, J. W. (2009). Estabilishing equivalence. In T. Landman & N. Robinson (Eds.), The
Sage Handbook of Comparative Politics, (pp. 84-100). London: Sage.
van Schuur, W. H. (2003). Mokken scale analysis: Between the Guttman scale and parametric
item response theory. Political Analysis, 11(2), 139-163.
Verba, S., Nie, N. H., & Kim, J.-o. (1978). Participation and political equality : a seven-
nation comparison. Cambridge: Cambridge University Press.
Zukin, C. (2006). A new engagement? : political participation, civic life, and the changing
American citizen. Oxford ; New York: Oxford University Press.
22
Table 1 Participating countries and sample size in EVS and ESS surveys, by year.
1981 1990 1999 2002 2004 2006 2008 Total
Austria a 1,295 1,454 2,135 2,034 2,185
a 9,103
Belgium 927 2,427 1,779 1,709 1,686 1,688 1,669 11,885
Czech Republic a 1,692 1,669 1,279 2,733
a 1,894 9,267
Denmark 968 967 955 1,452 1,410 1,453 1,537 8,742
Estonia a 1,638 819
a 1,858 1,433 1,576 7,324
Finland a 413 929 1,886 1,919 1,811 2,096 9,054
France 1,091 889 1,466 1,450 1,752 1,920 2,000 10,568
Germanya 1,091 2,837 1,803 2,740 2,658 2,763 2,646 16,538
Greece a
a 1,031 2,461 2,338
a 1,991 7,821
Hungary a 905 937 1,603 1,413 1,453 1,475 7,786
Ireland 1,074 964 953 1,892 2,138 1,585 a 8,606
Netherlands 1,074 982 999 2,288 1,823 1,841 1,729 10,736
Norway 962 1,125 a 2,004 1,688 1,663 1,479 8,921
Poland a 829 1,079 1,944 1,603 1,615 1,533 8,603
Portugal a 978 936 1,430 1,987 2,153 2,281 9,765
Slovakia a 802 1,083
a 1,327 1,616 1,748 6,576
Slovenia a
a 909 1,426 1,334 1,382 1,232 6,283
Spain 1,847 1,930 946 1,617 1,569 1,790 2,476 12,175
Sweden 877 967 986 1,882 1,852 1,827 1,722 10,113
Switzerland a
a
a 1,944 2,059 1,749 1,760 7,512
UK 1,091 1,404 940 1,986 1,818 2,307 2,267 11,813
Ukraine a
a 989
a 1,916 1,919 1,748 6,572
Total 11,002 23,044 22,662 35,128 40,915 36,153 36,859 205,763
a No data.
b In 1990, only West-Germany is studied, in consecutive years both East and West-Germany are included.
23
Table 2 Question wording and answer categories items conventional and unconventional political participation EVS and ESS
Data Years Unconventional political participation (1981-2008) Answer categories
EVS 1981-
1999
I'm going to read out some different forms of political action that people can take:
Signing a petition Have done/Might
do/Would never do
Joining in boycotts Have done/Might
do/Would never do
Attending lawful demonstrations Have done/Might
do/Would never do
ESS 2002-
2008
During the last 12 months, have you done any of the following? Yes/No
signed a petition? Yes/No
taken part in a lawful public demonstration? Yes/No
boycotted certain products? Yes/No
Data Years Conventional political participation (2002-2008)
ESS 2002-
2008
Some people don‟t vote nowadays for one reason or another. Did you vote in the last [country] national election in [month/year]? Yes/No
ESS 2002-
2008
During the last 12 months, have you done any of the following: worked in a political party or action group? Yes/No
Are you a member of any political party? Yes/No
24
Table 3 ANOVA Unconventional political participation, before and after the turn of the millennium.
Equivalent countries EVS (Before turn of millennium) ESS (After turn of millennium)
Year 1981
1990 1999 Eta R
2002
2004
2006
2008
Eta
R
Belgium 0.13
0.26 0.41 0.32 ** 0.32 **
Belgium 0.18
0.13
0.16
0.16
0.08 ** -0.02 *
France 0.28
0.33 0.40 0.15 ** 0.15 **
France 0.26
0.24
0.25
0.25
0.02
0.00
Germany 0.27
0.34 0.32 0.09 ** 0.05 **
Germany 0.23
0.21
0.20
0.23
0.05 ** -0.01
Ireland 0.16
0.22 0.31 0.20 ** 0.20 **
Netherlands 0.12
0.12
0.11
0.12
0.02
-0.01
Netherlands 0.18
0.29 0.39 0.26 ** 0.26 **
Sweden 0.27 0.31 0.27 0.30 0.07 ** 0.03 **
Sweden 0.26
0.37 0.53 0.34 ** 0.34 **
UK 0.24 0.20 0.24 0.22 0.05 ** -0.01
UK 0.27
0.34 0.37 0.15 ** 0.15 **
Finland 0.18 0.19 0.21 0.22 0.07 ** 0.06 **
Hungary 0.04 0.04 0.04 0.05 0.03 * 0.02 *
Total 0.22
0.31 0.38
Norway 0.22 0.24 0.24 0.23 0.03 * 0.01
Eta 0.20 ** 0.15 ** 0.20 **
Slovenia 0.07 0.03 0.08 0.05 0.11 ** 0.00
Switzerland 0.28 0.24 0.24 0.24 0.05 ** -0.04 **
Finland a
0.24 0.27 0.06 *
b
Hungary a
0.08 0.08 0.00
b
Total 0.19 0.19 0.19 0.20
Norway 0.27
0.31 a 0.08 **
b
Eta 0.27 ** 0.29 ** 0.26 ** 0.27 **
Slovenia a
a 0.17
b
b
Switzerland a
a
a
b
b
Austria 0.20 0.17 0.15 a 0.08 ** -0.08 **
Austria a
0.21 0.27 0.11 **
b
Czech Republic 0.10 0.08 a 0.09 0.05 ** 0.00
Czech Republic a
0.30 0.31 0.01
b
Slovakia a 0.13 0.11 0.09 0.09 ** -0.09 **
Slovakia a
0.23 0.25 0.05 *
b
Ireland 0.16 0.13 0.14 a 0.05 ** -0.03 *
25
Table 3 (continued)
Non-equivalent countries EVS ESS
Year 1981
1990
1999
Eta
R
2002
2004
2006
2008
Eta
R
Denmark 0.24
0.30
0.37
Denmark 0.20
0.21
0.23
0.22
Estonia a
0.23
0.11
Estonia a
0.03
0.05
0.05
Greece a
a
0.33
Greece 0.06
0.04
a
0.09
Poland a
0.15
0.11
Poland 0.04
0.06
0.04
0.05
Portugal a
0.18
0.16
Portugal 0.05
0.03
0.04
0.04
Spain 0.20
0.17
0.20
Spain 0.15
0.24
0.17
0.14
Ukraine a
a
0.12
Ukraine a
0.10
0.05
0.03
a no data
b could not be estimated due to small number of measurements (number of waves < 3)
* p < 0.05
** p < 0.01
26
Table 4 ANOVA membership & working for political parties and voting. by year of survey
Equivalent countries Membership and working for political parties Voting
Year 2002
2004
2006
2008 Eta
R
2002
2004
2006
2008
Eta
R
Belgium 0.07
0.06
0.07
0.05 0.04 ** -0.03 ** 0.87
0.93
0.93
0.92
0.08 ** 0.06 **
Denmark 0.05
0.06
0.06
0.07 0.03 * 0.03 ** 0.94
0.92
0.93
0.95
0.04 * 0.02
Finland 0.06
0.06
0.06
0.06 0.02
0.00
0.82
0.79
0.84
0.83
0.05 ** 0.03 *
France 0.03
0.03
0.03
0.03 0.01
-0.01
0.75
0.77
0.78
0.78
0.03
0.02 *
Netherlands 0.04
0.05
0.04
0.04 0.01
0.00
0.87
0.81
0.84
0.86
0.06 ** 0.00
Norway 0.09
0.09
0.08
0.07 0.04 ** -0.04 ** 0.85
0.86
0.86
0.86
0.01
0.01
Portugal 0.04
0.02
0.03
0.02 0.05 ** -0.04 ** 0.74
0.71
0.76
0.73
0.04 ** 0.00
Slovenia 0.04
0.03
0.05
0.04 0.03
0.00
0.81
0.70
0.78
0.73
0.10
-0.04 **
Sweden 0.07
0.05
0.06
0.06 0.03
-0.01
0.87
0.89
0.89
0.91
0.04 ** 0.04 **
Switzerland 0.08
0.07
0.07
0.06 0.04 ** -0.04 ** 0.69
0.66
0.66
0.64
0.04 ** -0.04 **
UK 0.03
0.03
0.03
0.03 0.02
-0.01
0.73
0.69
0.73
0.71
0.03 * 0.00
Total 0.06
0.05
0.05
0.05
0.81
0.79
0.81
0.81
Eta 0.10 ** 0.10 ** 0.10 ** 0.09 **
0.18 ** 0.22 ** 0.21 ** 0.24 **
Austria 0.12
0.11
0.12
0.02 ** 0.01
0.88
0.80
0.87
0.10 ** -0.01
Czech Republic 0.04
0.03
a
0.04 0.02 ** 0.00 * 0.64
0.56
a
0.58
0.07 ** -0.02 *
Greece 0.05
0.07
a
0.06 0.04 ** 0.01 ** 0.91
0.91
a
0.88
0.05 ** -0.04 **
Ireland 0.05
0.05
0.05
0.02 ** -0.01 ** 0.81
0.82
0.77
0.05 ** -0.03 **
Ukraine
0.04
0.04
0.03 0.02 ** -0.01 *
0.85
0.88
0.83
0.06 ** -0.02 *
27
Table 4 (continued)
Non-equivalent countries
Estonia a
0.02
0.03
0.04 a
0.61
0.59
0.66
Germany 0.04
0.03
0.04
0.03 0.86
0.81
0.79
0.83
Hungary 0.02
0.01
0.02
0.01 0.83
0.80
0.77
0.80
Poland 0.02
0.02
0.01
0.02 0.68
0.66
0.67
0.73
Slovakia a
0.03
0.03
0.02 a
0.76
0.69
0.77
Spain 0.04
0.06
0.04
0.02 0.79
0.83
0.80
0.81
a no data
b could not be estimated due to small number of measurements (number of waves < 3)
* p < 0.05
** p < 0.01
28
Figure 1 Change in item ordering before and after the turn of the millennium: average item difficulties by year.
29
Figure 2 Difference in item popularity for voting vs. membership of and working for political parties.

I
Appendix
II
A.1 Item difficulties. item ordering. Hi. Scale H and Rho conventional and unconventional political participation based on EVS/ESS 1981-2008
Unconventional political participation Conventional political participation
Austria Year Item Item Item Scale H Rho Item Item Item Scale H Rho
Item P D B
1990 dif. 0.48 0.10 0.05
Hi 0.76 0.43 0.36 0.52 0.60
Item P D B
1999 dif. 0.56 0.16 0.10
Hi 0.76 0.42 0.41 0.53 0.61
Item P B D V M W
2002 dif. 0.28 0.22 0.10 0.88 0.14 0.10
Hi 0.41 0.47 0.37 0.42 0.55 0.75 0.65 0.64 0.66 0.63
Item P B D V M W
2004 dif. 0.24 0.20 0.07 0.80 0.12 0.10
Hi 0.35 0.52 0.33 0.40 0.51 0.74 0.60 0.57 0.61 0.61
Item P B D V M W
2006 dif. 0.21 0.20 0.04 0.86 0.16 0.09
Hi 0.43 0.61 0.40 0.48 0.58 0.79 0.72 0.70 0.72 0.63
Item P B D V M W
Total dif. 0.32 0.17 0.09 0.85 0.14 0.09
Hi 0.45 0.49 0.43 0.46 0.49 0.63 0.66 0.77 0.66 0.62
III
Unconventional political participation Conventional political participation
Belgium Year Item Item Item Scale H Rho Item Item Item Scale H Rho
Item P D B
1981 dif. 0.23 0.14 0.03
Hi 0.58 0.56 0.61 0.57 0.61
Item P D B
1990 dif. 0.46 0.23 0.09
Hi 0.75 0.71 0.77 0.74 0.69
Item P D B
1999 dif. 0.72 0.40 0.12
Hi 0.70 0.69 0.74 0.71 0.63
Item P B D V M W
2002 dif. 0.34 0.12 0.08 0.87 0.08 0.06
Hi 0.56 0.29 0.33 0.38 0.53 0.58 0.43 0.37 0.42 0.49
Item P B D V M W
2004 dif. 0.22 0.10 0.06 0.93 0.07 0.04
Hi 0.46 0.23 0.28 0.31 0.49 0.49 0.48 0.69 0.50 0.47
Item P B D V M W
2006 dif. 0.30 0.11 0.08 0.93 0.08 0.06
Hi 0.49 0.33 0.30 0.36 0.49 0.74 0.53 0.52 0.54 0.57
Item P B D V M W
2008 dif. 0.28 0.11 0.07 0.92 0.05 0.04
Hi 0.52 0.32 0.30 0.37 0.51 0.83 0.55 0.55 0.57 0.59
Item P D B V M W
Total dif. 0.38 0.16 0.10 0.91 0.07 0.05
Hi 0.65 0.53 0.44 0.54 0.61 0.67 0.50 0.47 0.50 0.53
IV
Unconventional political participation Conventional political participation
Czech
Republic
Year Item Item Item Scale H Rho Item Item Item Scale H Rho
Item P D B
1990 dif. 0.48 0.35 0.10
Hi 0.63 0.64 0.83 0.67 0.69
Item P D B
1999 dif. 0.58 0.28 0.09
Hi 0.70 0.62 0.67 0.66 0.61
Item P B D V M W
2002 dif. 0.15 0.11 0.04 0.64 0.04 0.04
Hi 0.35 0.47 0.29 0.35 0.47 0.83 0.63 0.59 0.66 0.58
Item P B D V M W
2004 dif. 0.13 0.07 0.03 0.56 0.04 0.04
Hi 0.32 0.20 0.15 0.21 0.37 0.87 0.72 0.64 0.73 0.60
Item P B D V M W
2008 dif. 0.15 0.08 0.04 0.58 0.05 0.03
Hi 0.50 0.37 0.28 0.37 0.54 0.84 0.64 0.58 0.67 0.54
Item P D B V M W
Total dif. 0.28 0.13 0.09 0.58 0.04 0.03
Hi 0.60 0.53 0.38 0.51 0.63 0.85 0.67 0.61 0.70 0.58
V
Unconventional political participation Conventional political participation
Denmark Year Item Item Item Scale H Rho Item Item Item Scale H Rho
Item P D B
1981 dif. 0.42 0.19 0.10
Hi 0.58 0.43 0.43 0.46 0.65
Item P D B
1990 dif. 0.50 0.27 0.11
Hi 0.67 0.38 0.31 0.52 0.67
Item P D B
1999 dif. 0.57 0.30 0.25
Hi 0.48 0.39 0.37 0.41 0.59
Item P B D V M W
2002 dif. 0.28 0.23 0.08 0.94 0.06 0.04
Hi 0.31 0.45 0.27 0.32 0.44 0.31 0.48 0.47 0.46 0.45
Item P B D V M W
2004 dif. 0.29 0.29 0.05 0.92 0.07 0.04
Hi 0.27 0.48 0.24 0.28 0.41 0.71 0.58 0.58 0.59 0.55
Item P B D V M W
2006 dif. 0.36 0.25 0.07 0.93 0.07 0.04
Hi 0.31 0.39 0.20 0.28 0.34 0.81 0.50 0.49 0.52 0.50
Item P B D V M W
2008 dif. 0.34 0.22 0.09 0.95 0.09 0.05
Hi 0.30 0.33 0.19 0.26 0.34 0.62 0.64 0.62 0.64 0.59
Item P B D V M W
Total dif. 0.38 0.22 0.13 0.94 0.07 0.04
Hi 0.40 0.41 0.26 0.35 0.44 0.69 0.55 0.54 0.56 0.53
VI
Unconventional political participation Conventional political participation
Estonia Year Item Item Item Scale H Rho Item Item Item Scale H Rho
Item P D B
1990 dif. 0.38 0.26 0.03
Hi 0.39 0.38 0.51 0.40 0.46
Item P D B
1999 dif. 0.20 0.10 0.03
Hi 0.41 0.36 0.39 0.38 0.45
Item P B D V W M
2004 dif. 0.04 0.04 0.02 0.61 0.03 0.02
Hi 0.16 0.10 0.03 0.10 0.28 0.79 0.58 0.58 0.51 0.62
Item P B D V M W
2006 dif. 0.07 0.05 0.02 0.59 0.03 0.03
Hi 0.32 0.11 0.22 0.21 0.45 0.62 0.39 0.47 0.47 0.36
Item P B D V M W
2008 dif. 0.08 0.06 0.02 0.67 0.06 0.03
Hi 0.36 0.19 0.19 0.24 0.45 0.43 0.44 0.53 0.47 0.33
Item P D B V M W
Total dif. 0.15 0.08 0.04 0.62 0.04 0.03
Hi 0.42 0.35 0.20 0.33 0.48 0.60 0.47 0.53 0.53 0.40
VII
Unconventional political participation Conventional political participation
Finland Year Item Item Item Scale H Rho Item Item Item Scale H Rho
Item P D B
1990 dif. 0.41 0.14 0.13
Hi 0.56 0.43 0.44 0.47 0.59
Item P D B
1999 dif. 0.51 0.15 0.15
Hi 0.79 0.54 0.55 0.61 0.66
Item B P D V M W
2002 dif. 0.27 0.24 0.02 0.82 0.08 0.04
Hi 0.65 0.29 0.27 0.30 0.49 0.97 0.75 0.72 0.78 0.62
Item B P D V M W
2004 dif. 0.29 0.26 0.02 0.79 0.08 0.04
Hi 0.42 0.25 0.24 0.25 0.43 0.79 0.65 0.64 0.67 0.55
Item P B D V M W
2006 dif. 0.32 0.28 0.02 0.84 0.08 0.05
Hi 0.32 0.52 0.31 0.33 0.44 0.71 0.61 0.56 0.61 0.56
Item P B D V M W
2008 dif. 0.33 0.30 0.02 0.83 0.07 0.04
Hi 0.31 0.67 0.31 0.33 0.47 0.90 0.72 0.71 0.71 0.61
Item P B D V M W
Total dif. 0.32 0.27 0.04 0.82 0.08 0.05
Hi 0.34 0.55 0.30 0.34 0.44 0.84 0.68 0.66 0.70 0.59

VIII
Unconventional political participation Conventional political participation
France Year Item Item Item Scale H Rho Item Item Item Scale H Rho
Item P D B
1981 dif. 0.45 0.27 0.12
Hi 0.66 0.37 0.36 0.44 0.67
Item P D B
1990 dif. 0.53 0.33 0.13
Hi 0.79 0.41 0.33 0.46 0.73
Item P D B
1999 dif. 0.67 0.39 0.13
Hi 0.72 0.31 0.26 0.36 0.67
Item P B D V M W
2002 dif. 0.34 0.26 0.17 0.75 0.05 0.03
Hi 0.45 0.48 0.36 0.43 0.57 0.53 0.47 0.61 0.53 0.33
Item P B D V M W
2004 dif. 0.31 0.30 0.12 0.77 0.04 0.02
Hi 0.43 0.51 0.35 0.42 0.56 0.40 0.57 0.79 0.61 0.30
Item P B D V M W
2006 dif. 0.33 0.27 0.14 0.78 0.04 0.02
Hi 0.45 0.42 0.31 0.39 0.51 0.61 0.64 0.67 0.65 0.45
Item P B D V M W
2008 dif. 0.33 0.28 0.14 0.78 0.04 0.02
Hi 0.44 0.46 0.34 0.41 0.54 0.82 0.78 0.77 0.78 0.56
Item P B D V M W
Total dif. 0.41 0.23 0.20 0.77 0.04 0.02
Hi 0.52 0.42 0.29 0.41 0.52 0.60 0.63 0.71 0.65 0.42
IX
Unconventional political participation Conventional political participation
Germany Year Item Item Item Scale H Rho Item Item Item Scale H Rho
Item P D B
1981 dif. 0.63 0.10 0.08
Hi 0.83 0.47 0.43 0.53 0.60
Item P D B
1990 dif. 0.62 0.33 0.08
Hi 0.71 0.27 0.16 0.31 0.61
Item P D B
1999 dif. 0.54 0.34 0.08
Hi 0.75 0.32 0.19 0.35 0.68
Item P B D V M W
2002 dif. 0.32 0.25 0.11 0.86 0.04 0.04
Hi 0.38 0.28 0.41 0.35 0.47 0.98 0.66 0.66 0.69 0.61
Item P B D V W M
2004 dif. 0.33 0.22 0.09 0.81 0.04 0.03
Hi 0.40 0.31 0.39 0.36 0.46 0.85 0.65 0.66 0.68 0.57
Item P B D V M W
2006 dif. 0.29 0.23 0.07 0.79 0.04 0.04
Hi 0.39 0.30 0.48 0.37 0.48 0.93 0.69 0.67 0.72 0.61
Item P B D V W M
2008 dif. 0.31 0.29 0.08 0.83 0.04 0.03
Hi 0.32 0.29 0.45 0.33 0.46 0.90 0.65 0.67 0.70 0.57
Item P B D V M W
Total dif. 0.41 0.19 0.16 0.82 0.04 0.04
Hi 0.47 0.20 0.36 0.34 0.41 0.90 0.67 0.66 0.70 0.59
X
Unconventional political participation Conventional political participation
Greece Year Item Item Item Scale H Rho Item Item Item Scale H Rho
Item P D B
1999 dif. 0.48 0.46 0.04
Hi 0.32 0.37 0.34 0.33 0.50
Item B P D V M W
2002 dif. 0.09 0.05 0.04 0.91 0.05 0.05
Hi 0.17 0.23 0.21 0.20 0.53 0.67 0.40 0.41 0.43 0.49
Item D B P V M W
2004 dif. 0.05 0.05 0.03 0.91 0.08 0.06
Hi 0.35 0.24 0.34 0.30 0.59 0.75 0.57 0.57 0.59 0.58
Item B P D V M W
2008 dif. 0.15 0.05 0.05 0.88 0.08 0.04
Hi 0.16 0.23 0.21 0.19 0.57 0.82 0.66 0.64 0.67 0.57
Item P D B V M W
Total dif. 0.10 0.10 0.09 0.90 0.07 0.05
Hi 0.35 0.35 0.16 0.29 0.57 0.76 0.53 0.53 0.55 0.55
XI
Unconventional political participation Conventional political participation
Hungary Year Item Item Item Scale H Rho Item Item Item Scale H Rho
Item P D B
1990 dif. 0.18 0.04 0.02
Hi 0.76 0.45 0.39 0.52 0.59
Item P D B
1999 dif. 0.16 0.05 0.03
Hi 0.82 0.57 0.54 0.63 0.71
Item B P D V W M
2002 dif. 0.05 0.04 0.04 0.83 0.03 0.02
Hi 0.38 0.38 0.51 0.42 0.66 0.61 0.64 0.70 0.66 0.40
Item P B D V M W
2004 dif. 0.06 0.05 0.01 0.80 0.01 0.01
Hi 0.35 0.32 0.52 0.37 0.50 0.59 0.62 0.63 0.62 0.38
Item P B D V W M
2006 dif. 0.05 0.05 0.03 0.77 0.02 0.01
Hi 0.35 0.29 0.43 0.35 0.54 0.68 0.65 0.52 0.61 0.51
Item P B D V M W
2008 dif. 0.07 0.07 0.02 0.80 0.01 0.01
Hi 0.37 0.38 0.54 0.41 0.56 1.00 0.47 0.48 0.55 0.52
Item P B D V W M
Total dif. 0.08 0.05 0.03 0.80 0.02 0.01
Hi 0.45 0.37 0.50 0.43 0.55 0.69 0.62 0.60 0.62 0.44
XII
Unconventional political participation Conventional political participation
Ireland Year Item Item Item Scale H Rho Item Item Item Scale H Rho
Item P D B
1981 dif. 0.29 0.13 0.07
Hi 0.82 0.56 0.55 0.62 0.75
Item P D B
1990 dif. 0.42 0.17 0.07
Hi 0.78 0.43 0.40 0.50 0.67
Item P D B
1999 dif. 0.61 0.22 0.09
Hi 0.78 0.36 0.32 0.42 0.63
Item P B D V M W
2002 dif. 0.27 0.14 0.07 0.81 0.05 0.05
Hi 0.53 0.42 0.48 0.48 0.54 0.73 0.54 0.50 0.55 0.56
Item P B D V M W
2004 dif. 0.22 0.11 0.05 0.82 0.06 0.05
Hi 0.63 0.48 0.53 0.55 0.60 0.71 0.58 0.56 0.59 0.54
Item P B D V M W
2006 dif. 0.24 0.13 0.05 0.77 0.05 0.04
Hi 0.54 0.42 0.45 0.48 0.55 0.85 0.55 0.52 0.59 0.56
Item P B D V M W
Total dif. 0.31 0.11 0.10 0.80 0.05 0.05
Hi 0.66 0.43 0.48 0.52 0.59 0.75 0.56 0.53 0.58 0.55

XIII
Unconventional political participation Conventional political participation
Netherlands Year Item Item Item Scale H Rho Item Item Item Scale H Rho
Item P D B
1981 dif. 0.35 0.13 0.07
Hi 0.69 0.46 0.46 0.52 0.66
Item P D B
1990 dif. 0.51 0.26 0.08
Hi 0.83 0.42 0.32 0.47 0.73
Item P D B
1999 dif. 0.61 0.32 0.22
Hi 0.68 0.42 0.39 0.47 0.66
Item P B D V M W
2002 dif. 0.23 0.11 0.03 0.87 0.05 0.03
Hi 0.49 0.44 0.48 0.47 0.50 0.80 0.60 0.56 0.61 0.55
Item P B D V M W
2004 dif. 0.23 0.09 0.04 0.81 0.06 0.04
Hi 0.46 0.33 0.34 0.38 0.44 0.84 0.65 0.63 0.67 0.56
Item P B D V M W
2006 dif. 0.21 0.10 0.03 0.84 0.05 0.04
Hi 0.47 0.38 0.44 0.43 0.47 0.73 0.53 0.49 0.54 0.52
Item P B D V M W
2008 dif. 0.23 0.10 0.03 0.86 0.05 0.03
Hi 0.44 0.37 0.41 0.40 0.43 0.90 0.53 0.49 0.56 54.00
Item P B D V M W
Total dif. 0.30 0.10 0.09 0.84 0.05 0.03
Hi 0.62 0.40 0.49 0.50 0.56 0.81 0.58 0.54 0.60 0.54
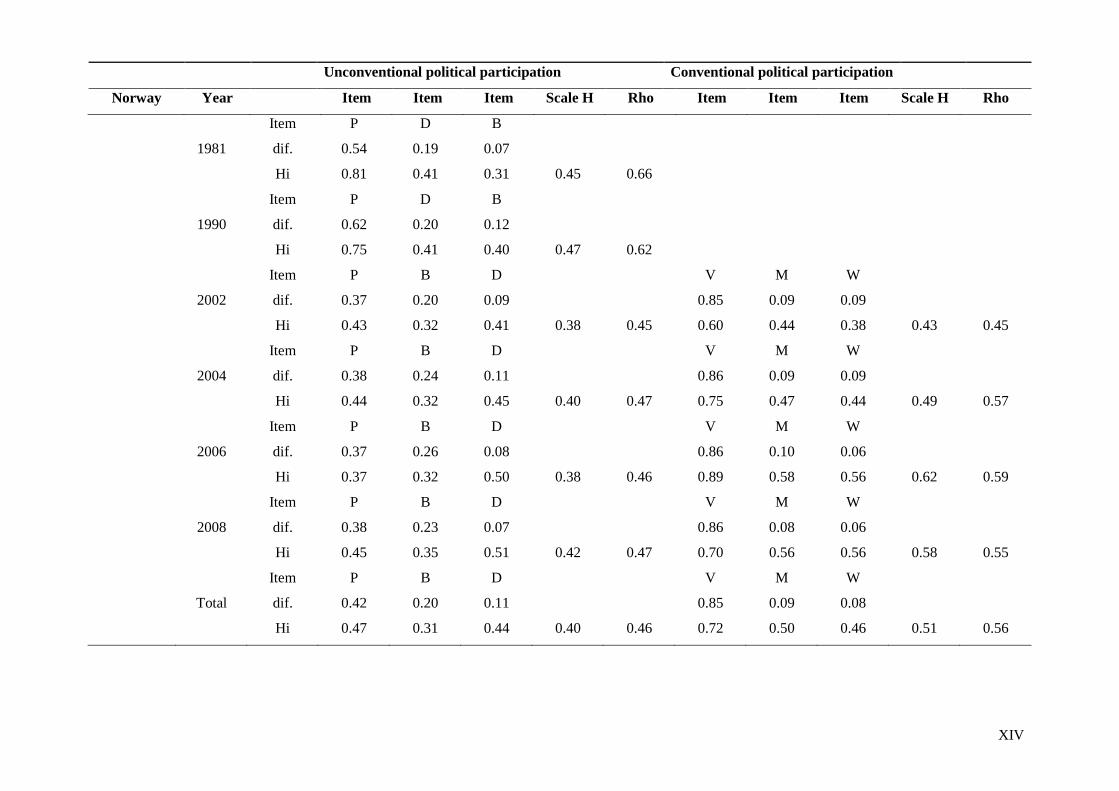
XIV
Unconventional political participation Conventional political participation
Norway Year Item Item Item Scale H Rho Item Item Item Scale H Rho
Item P D B
1981 dif. 0.54 0.19 0.07
Hi 0.81 0.41 0.31 0.45 0.66
Item P D B
1990 dif. 0.62 0.20 0.12
Hi 0.75 0.41 0.40 0.47 0.62
Item P B D V M W
2002 dif. 0.37 0.20 0.09 0.85 0.09 0.09
Hi 0.43 0.32 0.41 0.38 0.45 0.60 0.44 0.38 0.43 0.45
Item P B D V M W
2004 dif. 0.38 0.24 0.11 0.86 0.09 0.09
Hi 0.44 0.32 0.45 0.40 0.47 0.75 0.47 0.44 0.49 0.57
Item P B D V M W
2006 dif. 0.37 0.26 0.08 0.86 0.10 0.06
Hi 0.37 0.32 0.50 0.38 0.46 0.89 0.58 0.56 0.62 0.59
Item P B D V M W
2008 dif. 0.38 0.23 0.07 0.86 0.08 0.06
Hi 0.45 0.35 0.51 0.42 0.47 0.70 0.56 0.56 0.58 0.55
Item P B D V M W
Total dif. 0.42 0.20 0.11 0.85 0.09 0.08
Hi 0.47 0.31 0.44 0.40 0.46 0.72 0.50 0.46 0.51 0.56
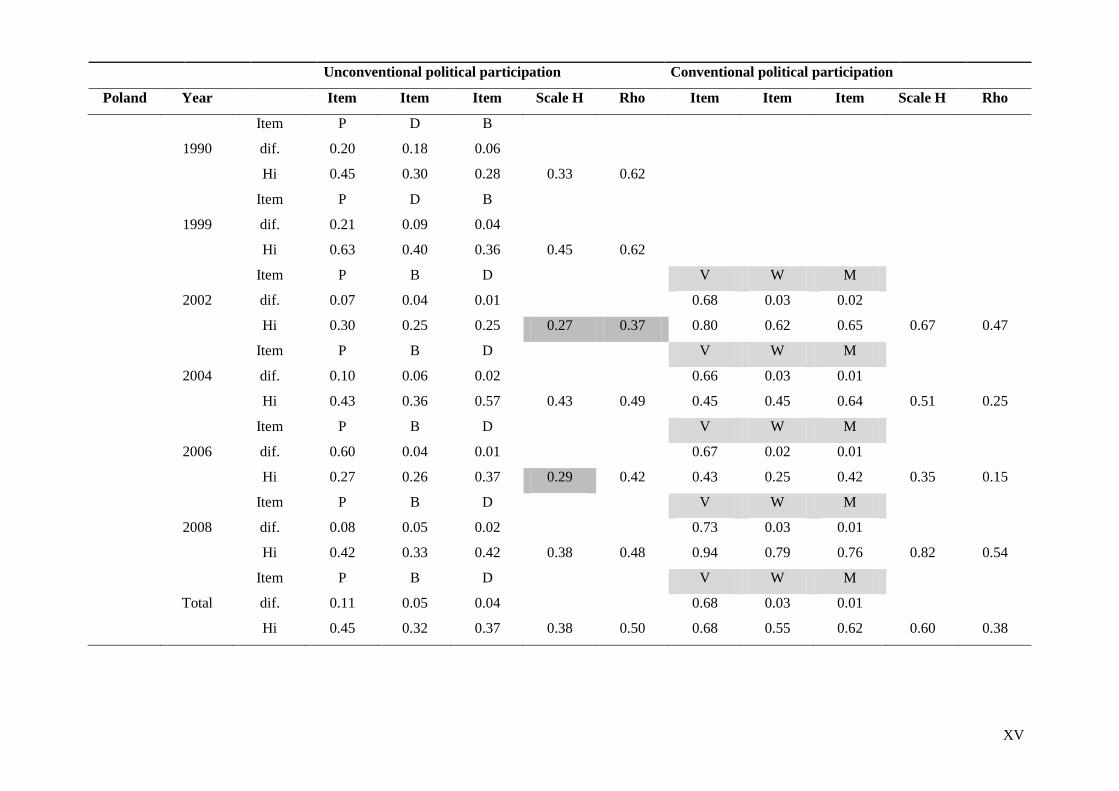
XV
Unconventional political participation Conventional political participation
Poland Year Item Item Item Scale H Rho Item Item Item Scale H Rho
Item P D B
1990 dif. 0.20 0.18 0.06
Hi 0.45 0.30 0.28 0.33 0.62
Item P D B
1999 dif. 0.21 0.09 0.04
Hi 0.63 0.40 0.36 0.45 0.62
Item P B D V W M
2002 dif. 0.07 0.04 0.01 0.68 0.03 0.02
Hi 0.30 0.25 0.25 0.27 0.37 0.80 0.62 0.65 0.67 0.47
Item P B D V W M
2004 dif. 0.10 0.06 0.02 0.66 0.03 0.01
Hi 0.43 0.36 0.57 0.43 0.49 0.45 0.45 0.64 0.51 0.25
Item P B D V W M
2006 dif. 0.60 0.04 0.01 0.67 0.02 0.01
Hi 0.27 0.26 0.37 0.29 0.42 0.43 0.25 0.42 0.35 0.15
Item P B D V W M
2008 dif. 0.08 0.05 0.02 0.73 0.03 0.01
Hi 0.42 0.33 0.42 0.38 0.48 0.94 0.79 0.76 0.82 0.54
Item P B D V W M
Total dif. 0.11 0.05 0.04 0.68 0.03 0.01
Hi 0.45 0.32 0.37 0.38 0.50 0.68 0.55 0.62 0.60 0.38
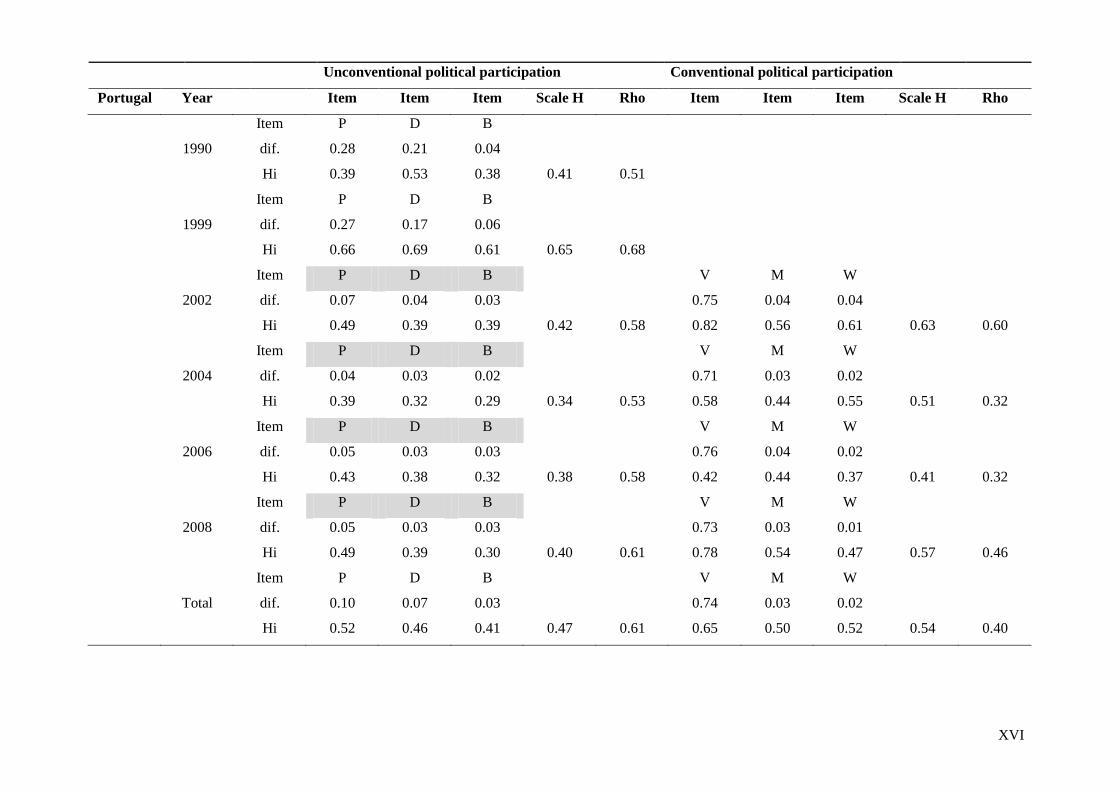
XVI
Unconventional political participation Conventional political participation
Portugal Year Item Item Item Scale H Rho Item Item Item Scale H Rho
Item P D B
1990 dif. 0.28 0.21 0.04
Hi 0.39 0.53 0.38 0.41 0.51
Item P D B
1999 dif. 0.27 0.17 0.06
Hi 0.66 0.69 0.61 0.65 0.68
Item P D B V M W
2002 dif. 0.07 0.04 0.03 0.75 0.04 0.04
Hi 0.49 0.39 0.39 0.42 0.58 0.82 0.56 0.61 0.63 0.60
Item P D B V M W
2004 dif. 0.04 0.03 0.02 0.71 0.03 0.02
Hi 0.39 0.32 0.29 0.34 0.53 0.58 0.44 0.55 0.51 0.32
Item P D B V M W
2006 dif. 0.05 0.03 0.03 0.76 0.04 0.02
Hi 0.43 0.38 0.32 0.38 0.58 0.42 0.44 0.37 0.41 0.32
Item P D B V M W
2008 dif. 0.05 0.03 0.03 0.73 0.03 0.01
Hi 0.49 0.39 0.30 0.40 0.61 0.78 0.54 0.47 0.57 0.46
Item P D B V M W
Total dif. 0.10 0.07 0.03 0.74 0.03 0.02
Hi 0.52 0.46 0.41 0.47 0.61 0.65 0.50 0.52 0.54 0.40
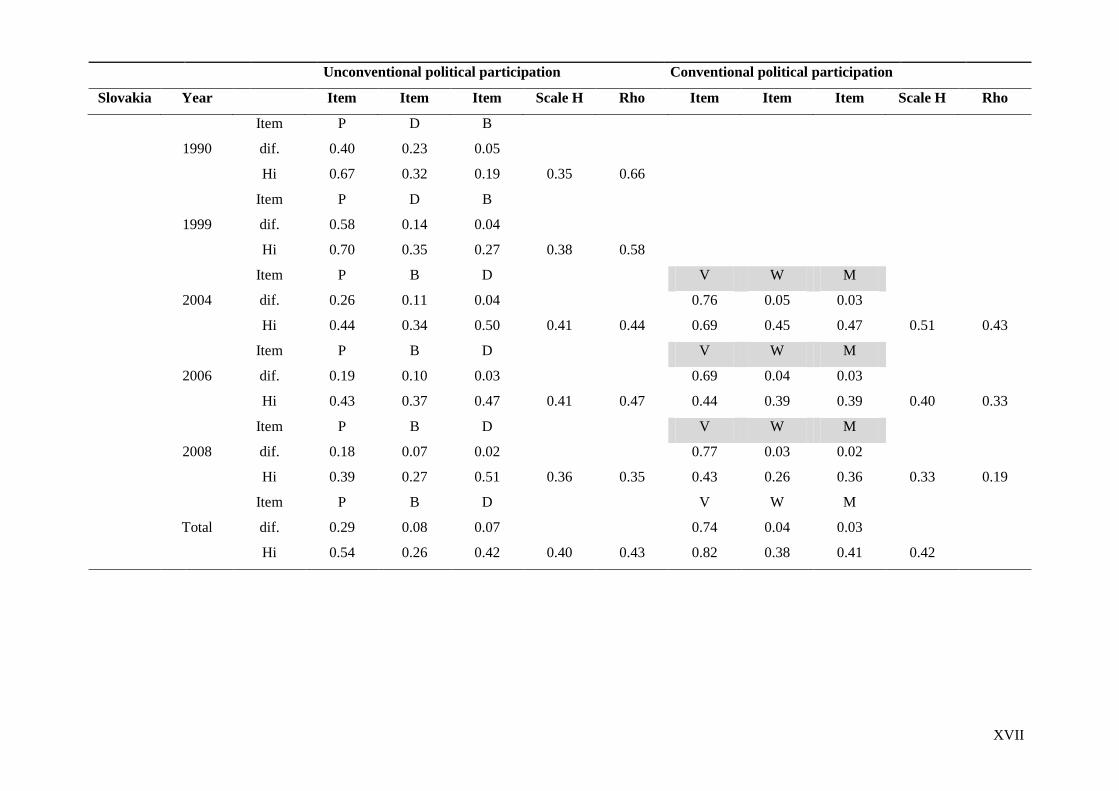
XVII
Unconventional political participation Conventional political participation
Slovakia Year Item Item Item Scale H Rho Item Item Item Scale H Rho
Item P D B
1990 dif. 0.40 0.23 0.05
Hi 0.67 0.32 0.19 0.35 0.66
Item P D B
1999 dif. 0.58 0.14 0.04
Hi 0.70 0.35 0.27 0.38 0.58
Item P B D V W M
2004 dif. 0.26 0.11 0.04 0.76 0.05 0.03
Hi 0.44 0.34 0.50 0.41 0.44 0.69 0.45 0.47 0.51 0.43
Item P B D V W M
2006 dif. 0.19 0.10 0.03 0.69 0.04 0.03
Hi 0.43 0.37 0.47 0.41 0.47 0.44 0.39 0.39 0.40 0.33
Item P B D V W M
2008 dif. 0.18 0.07 0.02 0.77 0.03 0.02
Hi 0.39 0.27 0.51 0.36 0.35 0.43 0.26 0.36 0.33 0.19
Item P B D V W M
Total dif. 0.29 0.08 0.07 0.74 0.04 0.03
Hi 0.54 0.26 0.42 0.40 0.43 0.82 0.38 0.41 0.42
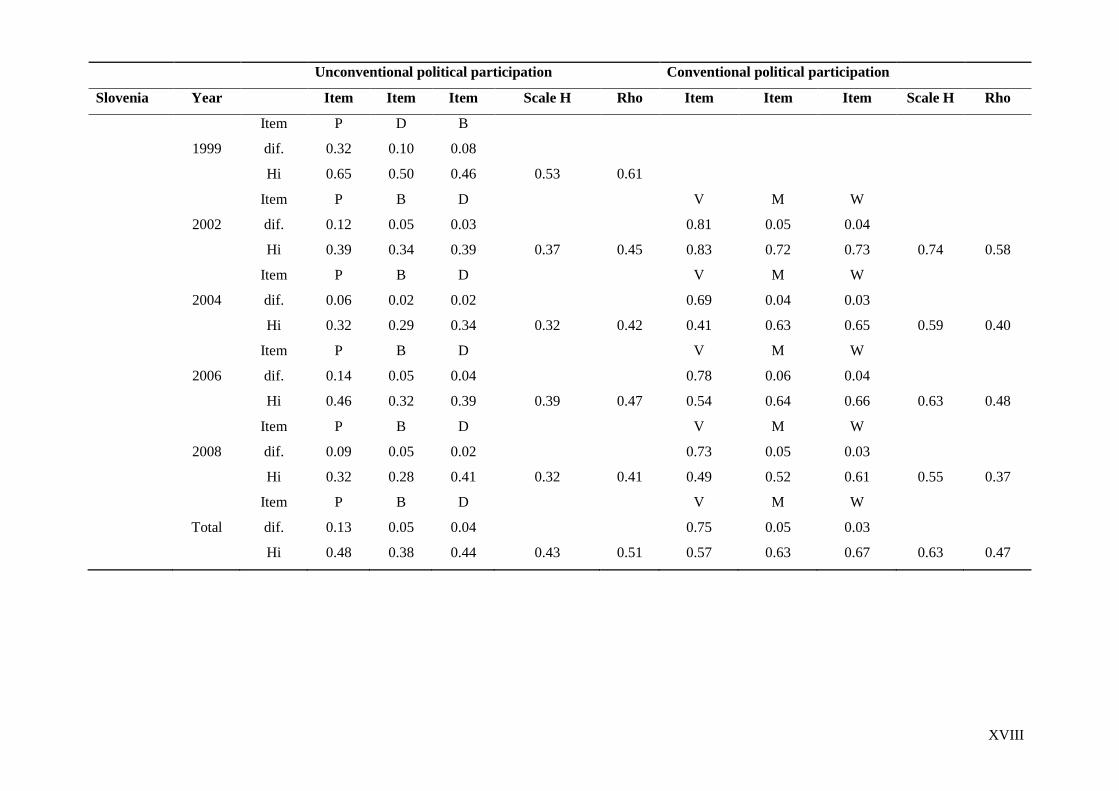
XVIII
Unconventional political participation Conventional political participation
Slovenia Year Item Item Item Scale H Rho Item Item Item Scale H Rho
Item P D B
1999 dif. 0.32 0.10 0.08
Hi 0.65 0.50 0.46 0.53 0.61
Item P B D V M W
2002 dif. 0.12 0.05 0.03 0.81 0.05 0.04
Hi 0.39 0.34 0.39 0.37 0.45 0.83 0.72 0.73 0.74 0.58
Item P B D V M W
2004 dif. 0.06 0.02 0.02 0.69 0.04 0.03
Hi 0.32 0.29 0.34 0.32 0.42 0.41 0.63 0.65 0.59 0.40
Item P B D V M W
2006 dif. 0.14 0.05 0.04 0.78 0.06 0.04
Hi 0.46 0.32 0.39 0.39 0.47 0.54 0.64 0.66 0.63 0.48
Item P B D V M W
2008 dif. 0.09 0.05 0.02 0.73 0.05 0.03
Hi 0.32 0.28 0.41 0.32 0.41 0.49 0.52 0.61 0.55 0.37
Item P B D V M W
Total dif. 0.13 0.05 0.04 0.75 0.05 0.03
Hi 0.48 0.38 0.44 0.43 0.51 0.57 0.63 0.67 0.63 0.47
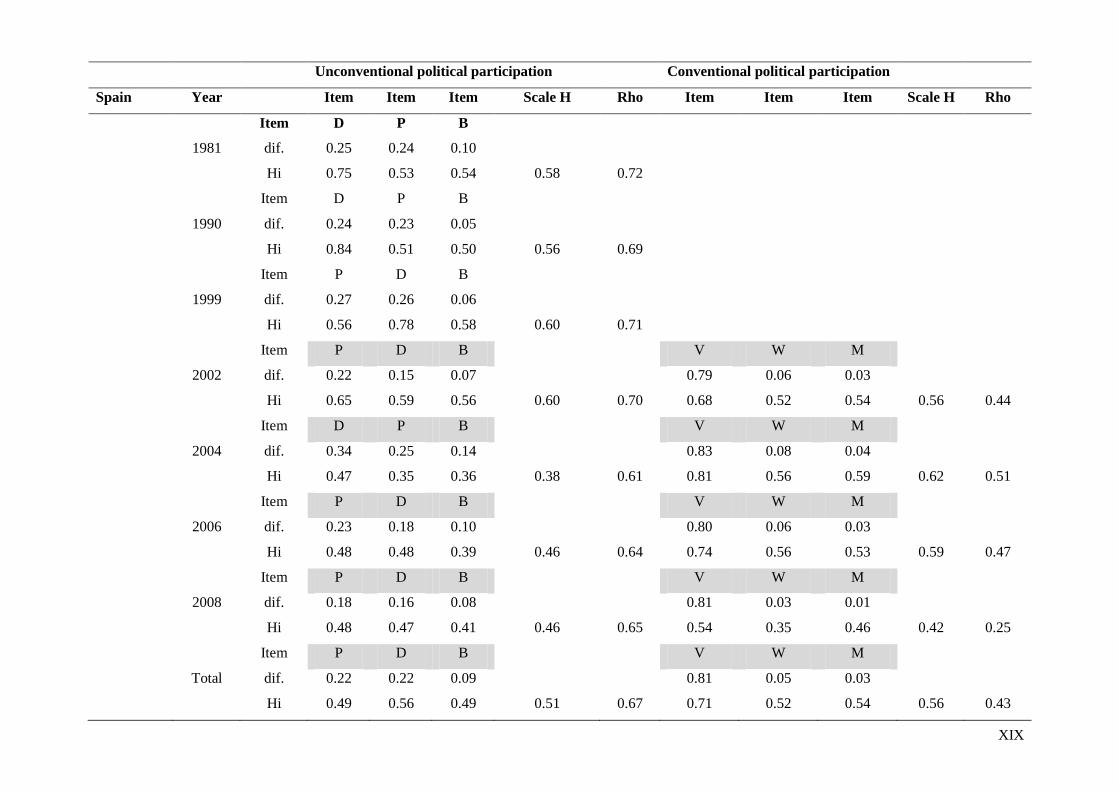
XIX
Unconventional political participation Conventional political participation
Spain Year Item Item Item Scale H Rho Item Item Item Scale H Rho
Item D P B
1981 dif. 0.25 0.24 0.10
Hi 0.75 0.53 0.54 0.58 0.72
Item D P B
1990 dif. 0.24 0.23 0.05
Hi 0.84 0.51 0.50 0.56 0.69
Item P D B
1999 dif. 0.27 0.26 0.06
Hi 0.56 0.78 0.58 0.60 0.71
Item P D B V W M
2002 dif. 0.22 0.15 0.07 0.79 0.06 0.03
Hi 0.65 0.59 0.56 0.60 0.70 0.68 0.52 0.54 0.56 0.44
Item D P B V W M
2004 dif. 0.34 0.25 0.14 0.83 0.08 0.04
Hi 0.47 0.35 0.36 0.38 0.61 0.81 0.56 0.59 0.62 0.51
Item P D B V W M
2006 dif. 0.23 0.18 0.10 0.80 0.06 0.03
Hi 0.48 0.48 0.39 0.46 0.64 0.74 0.56 0.53 0.59 0.47
Item P D B V W M
2008 dif. 0.18 0.16 0.08 0.81 0.03 0.01
Hi 0.48 0.47 0.41 0.46 0.65 0.54 0.35 0.46 0.42 0.25
Item P D B V W M
Total dif. 0.22 0.22 0.09 0.81 0.05 0.03
Hi 0.49 0.56 0.49 0.51 0.67 0.71 0.52 0.54 0.56 0.43
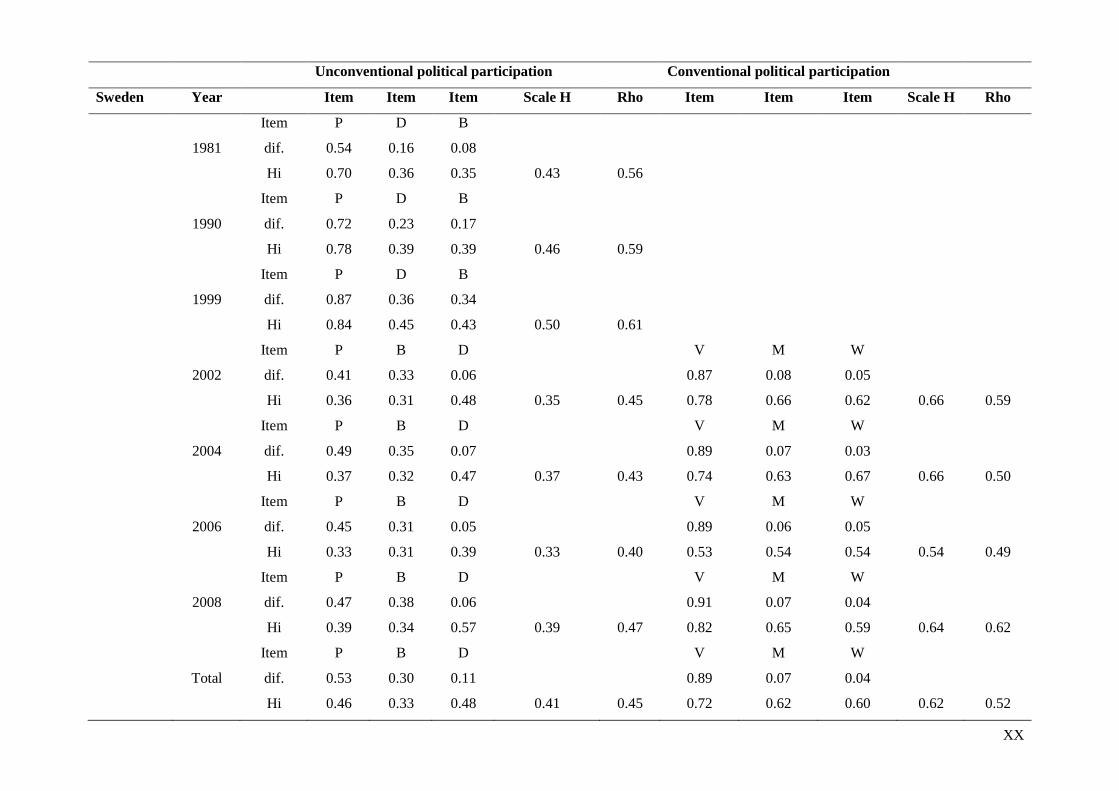
XX
Unconventional political participation Conventional political participation
Sweden Year Item Item Item Scale H Rho Item Item Item Scale H Rho
Item P D B
1981 dif. 0.54 0.16 0.08
Hi 0.70 0.36 0.35 0.43 0.56
Item P D B
1990 dif. 0.72 0.23 0.17
Hi 0.78 0.39 0.39 0.46 0.59
Item P D B
1999 dif. 0.87 0.36 0.34
Hi 0.84 0.45 0.43 0.50 0.61
Item P B D V M W
2002 dif. 0.41 0.33 0.06 0.87 0.08 0.05
Hi 0.36 0.31 0.48 0.35 0.45 0.78 0.66 0.62 0.66 0.59
Item P B D V M W
2004 dif. 0.49 0.35 0.07 0.89 0.07 0.03
Hi 0.37 0.32 0.47 0.37 0.43 0.74 0.63 0.67 0.66 0.50
Item P B D V M W
2006 dif. 0.45 0.31 0.05 0.89 0.06 0.05
Hi 0.33 0.31 0.39 0.33 0.40 0.53 0.54 0.54 0.54 0.49
Item P B D V M W
2008 dif. 0.47 0.38 0.06 0.91 0.07 0.04
Hi 0.39 0.34 0.57 0.39 0.47 0.82 0.65 0.59 0.64 0.62
Item P B D V M W
Total dif. 0.53 0.30 0.11 0.89 0.07 0.04
Hi 0.46 0.33 0.48 0.41 0.45 0.72 0.62 0.60 0.62 0.52
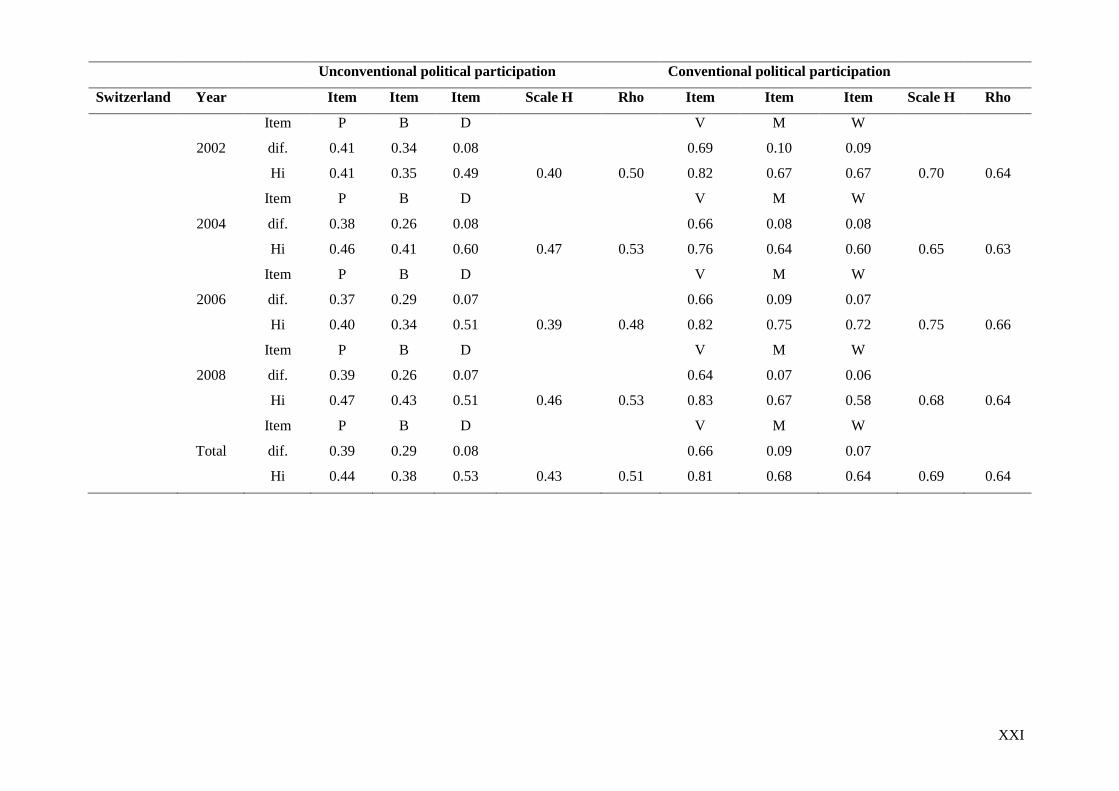
XXI
Unconventional political participation Conventional political participation
Switzerland Year Item Item Item Scale H Rho Item Item Item Scale H Rho
Item P B D V M W
2002 dif. 0.41 0.34 0.08 0.69 0.10 0.09
Hi 0.41 0.35 0.49 0.40 0.50 0.82 0.67 0.67 0.70 0.64
Item P B D V M W
2004 dif. 0.38 0.26 0.08 0.66 0.08 0.08
Hi 0.46 0.41 0.60 0.47 0.53 0.76 0.64 0.60 0.65 0.63
Item P B D V M W
2006 dif. 0.37 0.29 0.07 0.66 0.09 0.07
Hi 0.40 0.34 0.51 0.39 0.48 0.82 0.75 0.72 0.75 0.66
Item P B D V M W
2008 dif. 0.39 0.26 0.07 0.64 0.07 0.06
Hi 0.47 0.43 0.51 0.46 0.53 0.83 0.67 0.58 0.68 0.64
Item P B D V M W
Total dif. 0.39 0.29 0.08 0.66 0.09 0.07
Hi 0.44 0.38 0.53 0.43 0.51 0.81 0.68 0.64 0.69 0.64
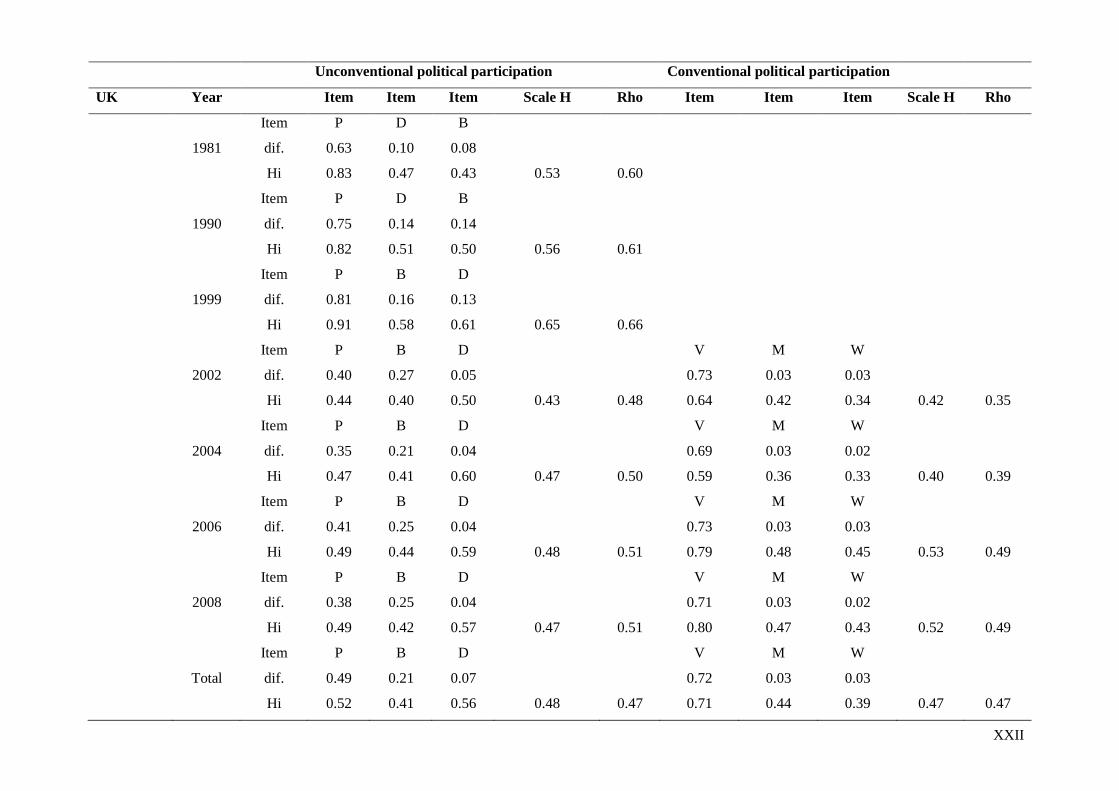
XXII
Unconventional political participation Conventional political participation
UK Year Item Item Item Scale H Rho Item Item Item Scale H Rho
Item P D B
1981 dif. 0.63 0.10 0.08
Hi 0.83 0.47 0.43 0.53 0.60
Item P D B
1990 dif. 0.75 0.14 0.14
Hi 0.82 0.51 0.50 0.56 0.61
Item P B D
1999 dif. 0.81 0.16 0.13
Hi 0.91 0.58 0.61 0.65 0.66
Item P B D V M W
2002 dif. 0.40 0.27 0.05 0.73 0.03 0.03
Hi 0.44 0.40 0.50 0.43 0.48 0.64 0.42 0.34 0.42 0.35
Item P B D V M W
2004 dif. 0.35 0.21 0.04 0.69 0.03 0.02
Hi 0.47 0.41 0.60 0.47 0.50 0.59 0.36 0.33 0.40 0.39
Item P B D V M W
2006 dif. 0.41 0.25 0.04 0.73 0.03 0.03
Hi 0.49 0.44 0.59 0.48 0.51 0.79 0.48 0.45 0.53 0.49
Item P B D V M W
2008 dif. 0.38 0.25 0.04 0.71 0.03 0.02
Hi 0.49 0.42 0.57 0.47 0.51 0.80 0.47 0.43 0.52 0.49
Item P B D V M W
Total dif. 0.49 0.21 0.07 0.72 0.03 0.03
Hi 0.52 0.41 0.56 0.48 0.47 0.71 0.44 0.39 0.47 0.47
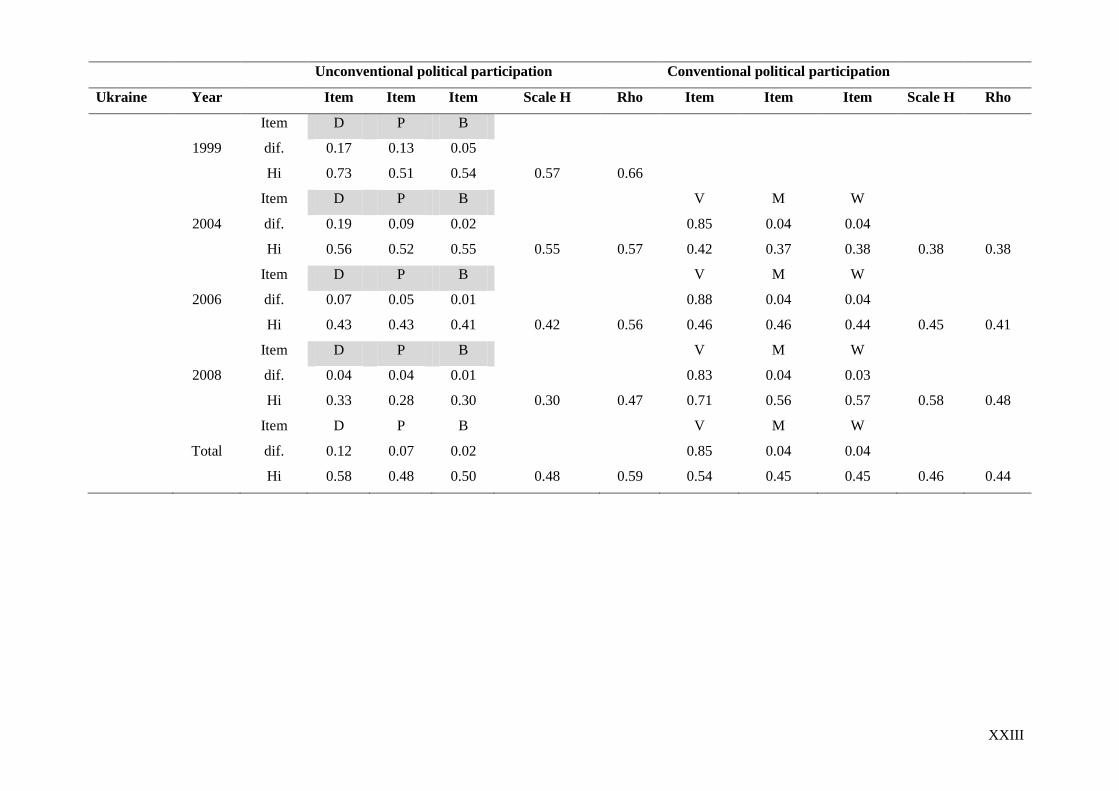
XXIII
Unconventional political participation Conventional political participation
Ukraine Year Item Item Item Scale H Rho Item Item Item Scale H Rho
Item D P B
1999 dif. 0.17 0.13 0.05
Hi 0.73 0.51 0.54 0.57 0.66
Item D P B V M W
2004 dif. 0.19 0.09 0.02 0.85 0.04 0.04
Hi 0.56 0.52 0.55 0.55 0.57 0.42 0.37 0.38 0.38 0.38
Item D P B V M W
2006 dif. 0.07 0.05 0.01 0.88 0.04 0.04
Hi 0.43 0.43 0.41 0.42 0.56 0.46 0.46 0.44 0.45 0.41
Item D P B V M W
2008 dif. 0.04 0.04 0.01 0.83 0.04 0.03
Hi 0.33 0.28 0.30 0.30 0.47 0.71 0.56 0.57 0.58 0.48
Item D P B V M W
Total dif. 0.12 0.07 0.02 0.85 0.04 0.04
Hi 0.58 0.48 0.50 0.48 0.59 0.54 0.45 0.45 0.46 0.44
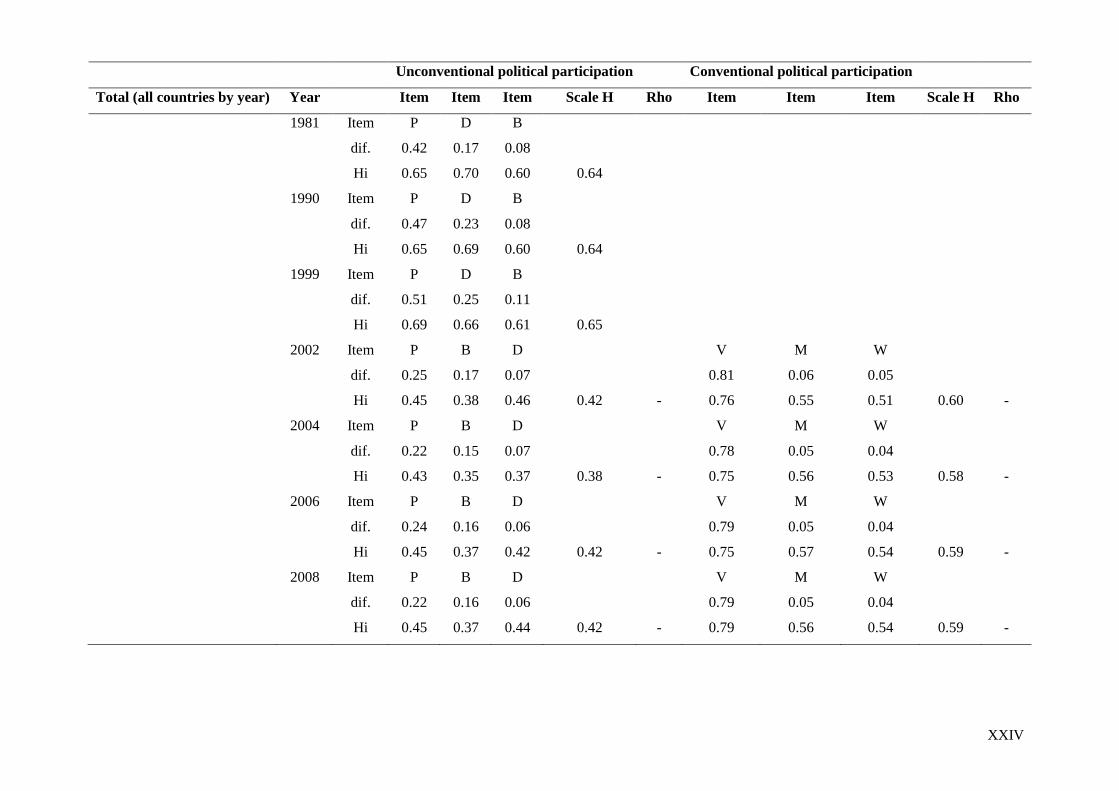
XXIV
Unconventional political participation Conventional political participation
Total (all countries by year) Year Item Item Item Scale H Rho Item Item Item Scale H Rho
1981 Item P D B
dif. 0.42 0.17 0.08
Hi 0.65 0.70 0.60 0.64
1990 Item P D B
dif. 0.47 0.23 0.08
Hi 0.65 0.69 0.60 0.64
1999 Item P D B
dif. 0.51 0.25 0.11
Hi 0.69 0.66 0.61 0.65
2002 Item P B D V M W
dif. 0.25 0.17 0.07 0.81 0.06 0.05
Hi 0.45 0.38 0.46 0.42 - 0.76 0.55 0.51 0.60 -
2004 Item P B D V M W
dif. 0.22 0.15 0.07 0.78 0.05 0.04
Hi 0.43 0.35 0.37 0.38 - 0.75 0.56 0.53 0.58 -
2006 Item P B D V M W
dif. 0.24 0.16 0.06 0.79 0.05 0.04
Hi 0.45 0.37 0.42 0.42 - 0.75 0.57 0.54 0.59 -
2008 Item P B D V M W
dif. 0.22 0.16 0.06 0.79 0.05 0.04
Hi 0.45 0.37 0.44 0.42 - 0.79 0.56 0.54 0.59 -
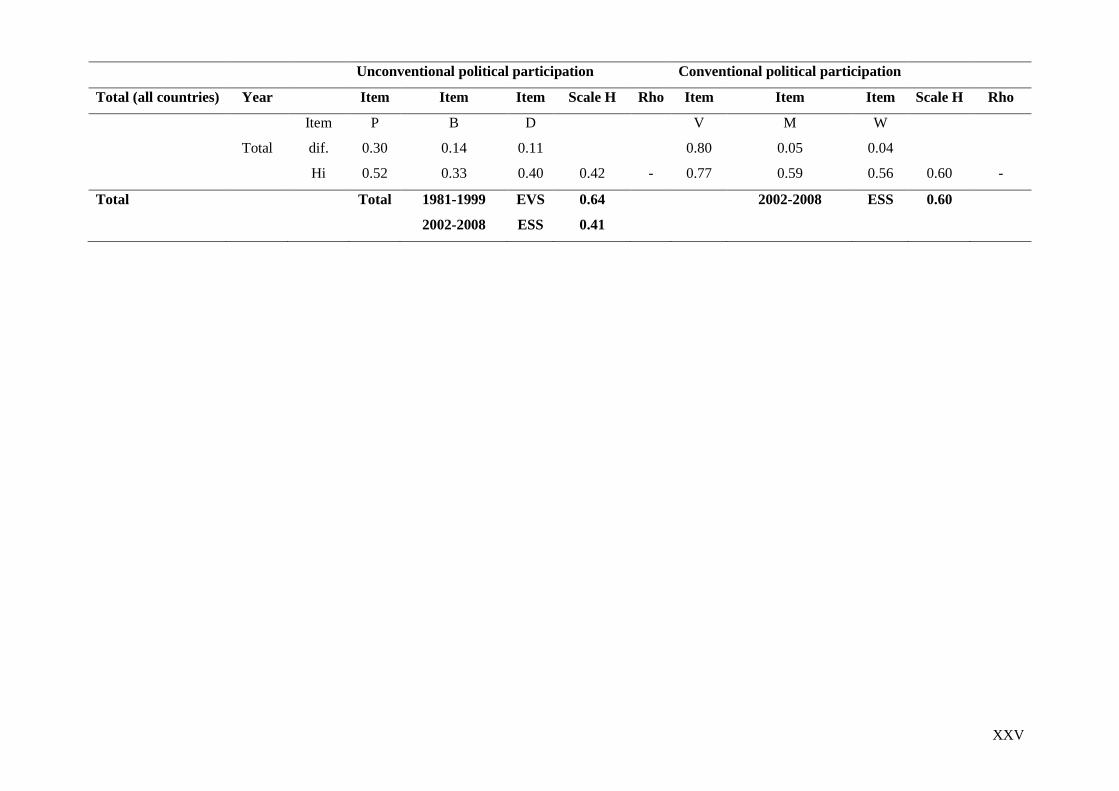
XXV
Unconventional political participation Conventional political participation
Total (all countries) Year Item Item Item Scale H Rho Item Item Item Scale H Rho
Item P B D V M W
Total dif. 0.30 0.14 0.11 0.80 0.05 0.04
Hi 0.52 0.33 0.40 0.42 - 0.77 0.59 0.56 0.60 -
Total Total 1981-1999 EVS 0.64 2002-2008 ESS 0.60
2002-2008 ESS 0.41