depth-mediated reversal of the effects of climate … · depth-mediated reversal of the effects of...
TRANSCRIPT
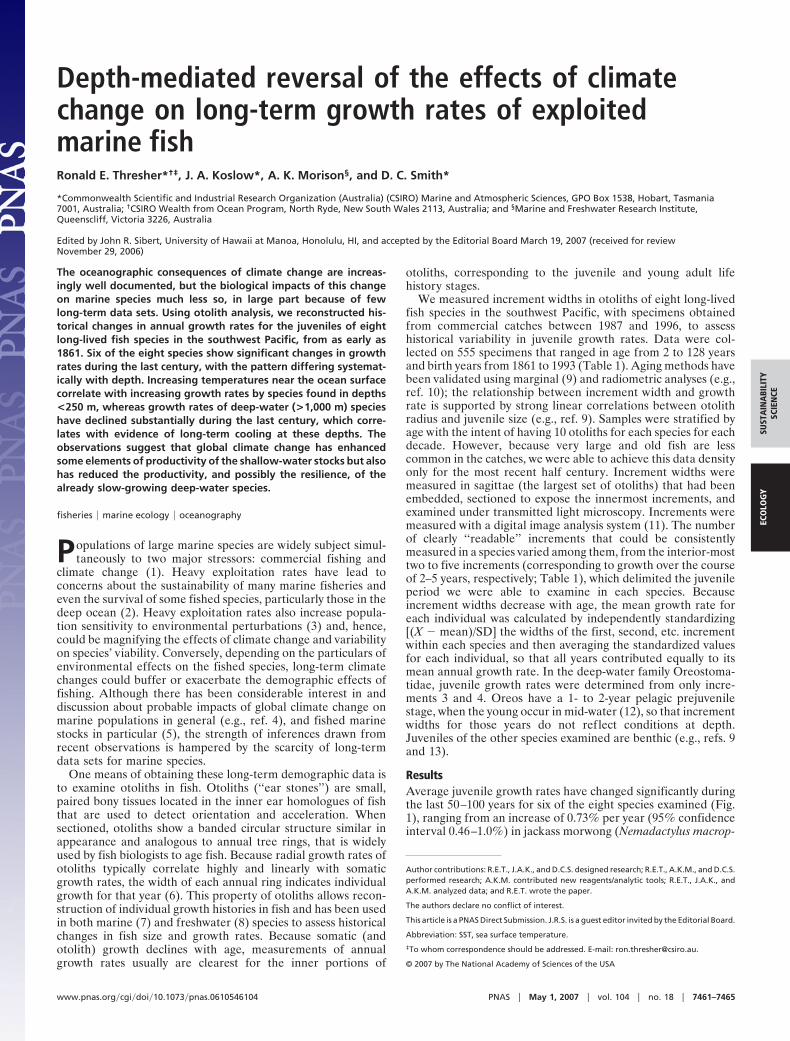
Depth-mediated reversal of the effects of climatechange on long-term growth rates of exploitedmarine fishRonald E. Thresher*†‡, J. A. Koslow*, A. K. Morison§, and D. C. Smith*
*Commonwealth Scientific and Industrial Research Organization (Australia) (CSIRO) Marine and Atmospheric Sciences, GPO Box 1538, Hobart, Tasmania7001, Australia; †CSIRO Wealth from Ocean Program, North Ryde, New South Wales 2113, Australia; and §Marine and Freshwater Research Institute,Queenscliff, Victoria 3226, Australia
Edited by John R. Sibert, University of Hawaii at Manoa, Honolulu, HI, and accepted by the Editorial Board March 19, 2007 (received for reviewNovember 29, 2006)
The oceanographic consequences of climate change are increas-ingly well documented, but the biological impacts of this changeon marine species much less so, in large part because of fewlong-term data sets. Using otolith analysis, we reconstructed his-torical changes in annual growth rates for the juveniles of eightlong-lived fish species in the southwest Pacific, from as early as1861. Six of the eight species show significant changes in growthrates during the last century, with the pattern differing systemat-ically with depth. Increasing temperatures near the ocean surfacecorrelate with increasing growth rates by species found in depths<250 m, whereas growth rates of deep-water (>1,000 m) specieshave declined substantially during the last century, which corre-lates with evidence of long-term cooling at these depths. Theobservations suggest that global climate change has enhancedsome elements of productivity of the shallow-water stocks but alsohas reduced the productivity, and possibly the resilience, of thealready slow-growing deep-water species.
fisheries � marine ecology � oceanography
Populations of large marine species are widely subject simul-taneously to two major stressors: commercial fishing and
climate change (1). Heavy exploitation rates have lead toconcerns about the sustainability of many marine fisheries andeven the survival of some fished species, particularly those in thedeep ocean (2). Heavy exploitation rates also increase popula-tion sensitivity to environmental perturbations (3) and, hence,could be magnifying the effects of climate change and variabilityon species’ viability. Conversely, depending on the particulars ofenvironmental effects on the fished species, long-term climatechanges could buffer or exacerbate the demographic effects offishing. Although there has been considerable interest in anddiscussion about probable impacts of global climate change onmarine populations in general (e.g., ref. 4), and fished marinestocks in particular (5), the strength of inferences drawn fromrecent observations is hampered by the scarcity of long-termdata sets for marine species.
One means of obtaining these long-term demographic data isto examine otoliths in fish. Otoliths (‘‘ear stones’’) are small,paired bony tissues located in the inner ear homologues of fishthat are used to detect orientation and acceleration. Whensectioned, otoliths show a banded circular structure similar inappearance and analogous to annual tree rings, that is widelyused by fish biologists to age fish. Because radial growth rates ofotoliths typically correlate highly and linearly with somaticgrowth rates, the width of each annual ring indicates individualgrowth for that year (6). This property of otoliths allows recon-struction of individual growth histories in fish and has been usedin both marine (7) and freshwater (8) species to assess historicalchanges in fish size and growth rates. Because somatic (andotolith) growth declines with age, measurements of annualgrowth rates usually are clearest for the inner portions of
otoliths, corresponding to the juvenile and young adult lifehistory stages.
We measured increment widths in otoliths of eight long-livedfish species in the southwest Pacific, with specimens obtainedfrom commercial catches between 1987 and 1996, to assesshistorical variability in juvenile growth rates. Data were col-lected on 555 specimens that ranged in age from 2 to 128 yearsand birth years from 1861 to 1993 (Table 1). Aging methods havebeen validated using marginal (9) and radiometric analyses (e.g.,ref. 10); the relationship between increment width and growthrate is supported by strong linear correlations between otolithradius and juvenile size (e.g., ref. 9). Samples were stratified byage with the intent of having 10 otoliths for each species for eachdecade. However, because very large and old fish are lesscommon in the catches, we were able to achieve this data densityonly for the most recent half century. Increment widths weremeasured in sagittae (the largest set of otoliths) that had beenembedded, sectioned to expose the innermost increments, andexamined under transmitted light microscopy. Increments weremeasured with a digital image analysis system (11). The numberof clearly ‘‘readable’’ increments that could be consistentlymeasured in a species varied among them, from the interior-mosttwo to five increments (corresponding to growth over the courseof 2–5 years, respectively; Table 1), which delimited the juvenileperiod we were able to examine in each species. Becauseincrement widths decrease with age, the mean growth rate foreach individual was calculated by independently standardizing[(X � mean)/SD] the widths of the first, second, etc. incrementwithin each species and then averaging the standardized valuesfor each individual, so that all years contributed equally to itsmean annual growth rate. In the deep-water family Oreostoma-tidae, juvenile growth rates were determined from only incre-ments 3 and 4. Oreos have a 1- to 2-year pelagic prejuvenilestage, when the young occur in mid-water (12), so that incrementwidths for those years do not reflect conditions at depth.Juveniles of the other species examined are benthic (e.g., refs. 9and 13).
ResultsAverage juvenile growth rates have changed significantly duringthe last 50–100 years for six of the eight species examined (Fig.1), ranging from an increase of 0.73% per year (95% confidenceinterval 0.46–1.0%) in jackass morwong (Nemadactylus macrop-
Author contributions: R.E.T., J.A.K., and D.C.S. designed research; R.E.T., A.K.M., and D.C.S.performed research; A.K.M. contributed new reagents/analytic tools; R.E.T., J.A.K., andA.K.M. analyzed data; and R.E.T. wrote the paper.
The authors declare no conflict of interest.
This article is a PNAS Direct Submission. J.R.S. is a guest editor invited by the Editorial Board.
Abbreviation: SST, sea surface temperature.
‡To whom correspondence should be addressed. E-mail: [email protected].
© 2007 by The National Academy of Sciences of the USA
www.pnas.org�cgi�doi�10.1073�pnas.0610546104 PNAS � May 1, 2007 � vol. 104 � no. 18 � 7461–7465
SUST
AIN
ABI
LITY
SCIE
NCE
ECO
LOG
Y
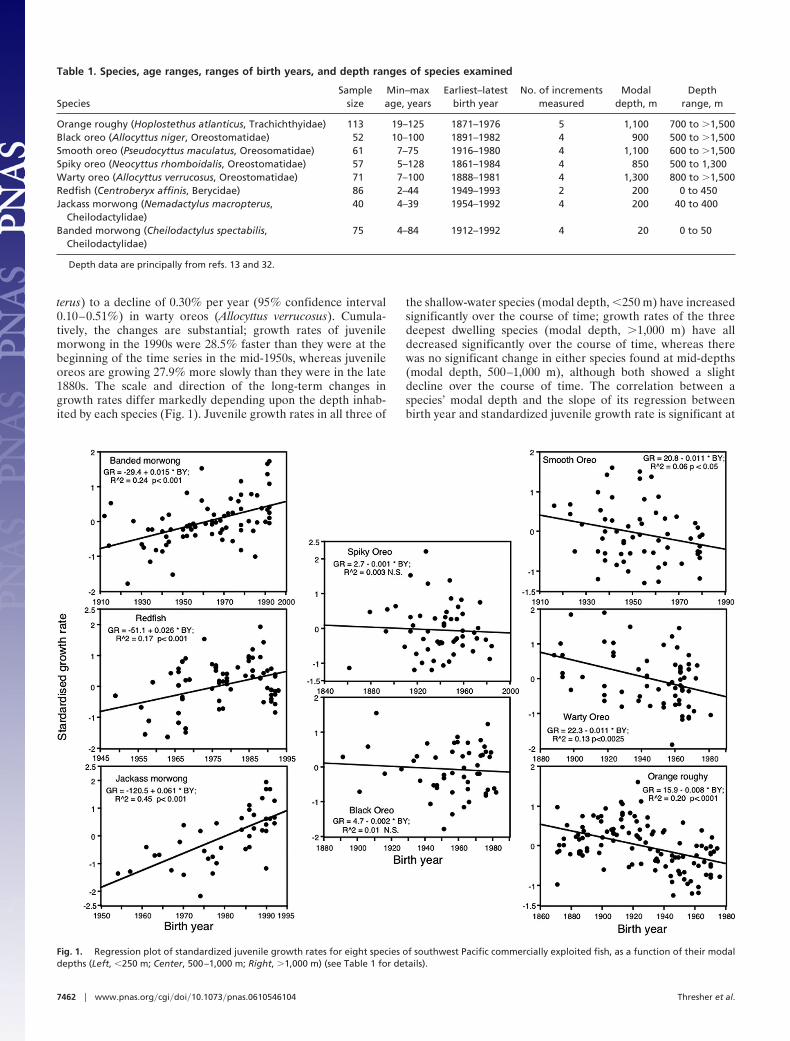
terus) to a decline of 0.30% per year (95% confidence interval0.10–0.51%) in warty oreos (Allocyttus verrucosus). Cumula-tively, the changes are substantial; growth rates of juvenilemorwong in the 1990s were 28.5% faster than they were at thebeginning of the time series in the mid-1950s, whereas juvenileoreos are growing 27.9% more slowly than they were in the late1880s. The scale and direction of the long-term changes ingrowth rates differ markedly depending upon the depth inhab-ited by each species (Fig. 1). Juvenile growth rates in all three of
the shallow-water species (modal depth, �250 m) have increasedsignificantly over the course of time; growth rates of the threedeepest dwelling species (modal depth, �1,000 m) have alldecreased significantly over the course of time, whereas therewas no significant change in either species found at mid-depths(modal depth, 500–1,000 m), although both showed a slightdecline over the course of time. The correlation between aspecies’ modal depth and the slope of its regression betweenbirth year and standardized juvenile growth rate is significant at
Table 1. Species, age ranges, ranges of birth years, and depth ranges of species examined
SpeciesSample
sizeMin–maxage, years
Earliest–latestbirth year
No. of incrementsmeasured
Modaldepth, m
Depthrange, m
Orange roughy (Hoplostethus atlanticus, Trachichthyidae) 113 19–125 1871–1976 5 1,100 700 to �1,500Black oreo (Allocyttus niger, Oreostomatidae) 52 10–100 1891–1982 4 900 500 to �1,500Smooth oreo (Pseudocyttus maculatus, Oreosomatidae) 61 7–75 1916–1980 4 1,100 600 to �1,500Spiky oreo (Neocyttus rhomboidalis, Oreostomatidae) 57 5–128 1861–1984 4 850 500 to 1,300Warty oreo (Allocyttus verrucosus, Oreostomatidae) 71 7–100 1888–1981 4 1,300 800 to �1,500Redfish (Centroberyx affinis, Berycidae) 86 2–44 1949–1993 2 200 0 to 450Jackass morwong (Nemadactylus macropterus,
Cheilodactylidae)40 4–39 1954–1992 4 200 40 to 400
Banded morwong (Cheilodactylus spectabilis,Cheilodactylidae)
75 4–84 1912–1992 4 20 0 to 50
Depth data are principally from refs. 13 and 32.
Fig. 1. Regression plot of standardized juvenile growth rates for eight species of southwest Pacific commercially exploited fish, as a function of their modaldepths (Left, �250 m; Center, 500–1,000 m; Right, �1,000 m) (see Table 1 for details).
7462 � www.pnas.org�cgi�doi�10.1073�pnas.0610546104 Thresher et al.
P � 0.02. Because the length of the time series for each speciesdiffers substantially [from 39 years for jackass morwong to 123years in spiky oreo (Neocyttus rhomboidalis)], a more robustcomparison would involve only the years in common to allspecies. However, for all eight species, this constitutes only 22years (1954–1976), during which time juvenile growth rateschange significantly for only one species (redfish, Centroberyxaffinis), which almost certainly reflects both the short time spansampled and small sample sizes (�25) for that period for mostspecies. A longer-term comparison is made possible by excludingthe two shortest-lived species (jackass morwong and redfish),which increases the overlap period for the remaining six speciesto 61 years (1915–1976). For this overlap period, the correlationbetween each species’ modal depth and the slope of its growthrate/birth year regression is significant at P � 0.025.
Apparently greater growth rates in older fish can be an artifactcaused by increased longevity by faster growing fish (the ‘‘RosaLee phenomenon,’’ ref. 14). The Rosa Lee phenomenon couldexplain our observations for deep-water species, but not theincreasing growth rates in shallow-water species nor the corre-lation between growth rate and depth. Growth rates in fish arestrongly affected by food ration and temperature (15). Fastergrowth in the shallow-water species could reflect decliningpopulation sizes, as the result of commercial exploitation, andconsequent increased food for the remaining fish. Data onhistorical population sizes for the three shallow-water species aresparse (16), but those available do not support this hypothesis asthe principal cause of faster juvenile growth. The abundance ofjackass morwong has declined more or less steadily since theearly 1900s (16), whereas exploitation rates, at least, for redfishwere very high in the 1940s and since 1970, but low during theintervening 20� years (13). Banded morwong were not fishedsignificantly until the 1990s (J. Lyle, personal communication).Nonetheless, juvenile growth rates for all three species haveincreased steadily during the last 50 years. Growth rates of thejuveniles of the deep-water species all began decreasing wellbefore the onset of commercial fishing.
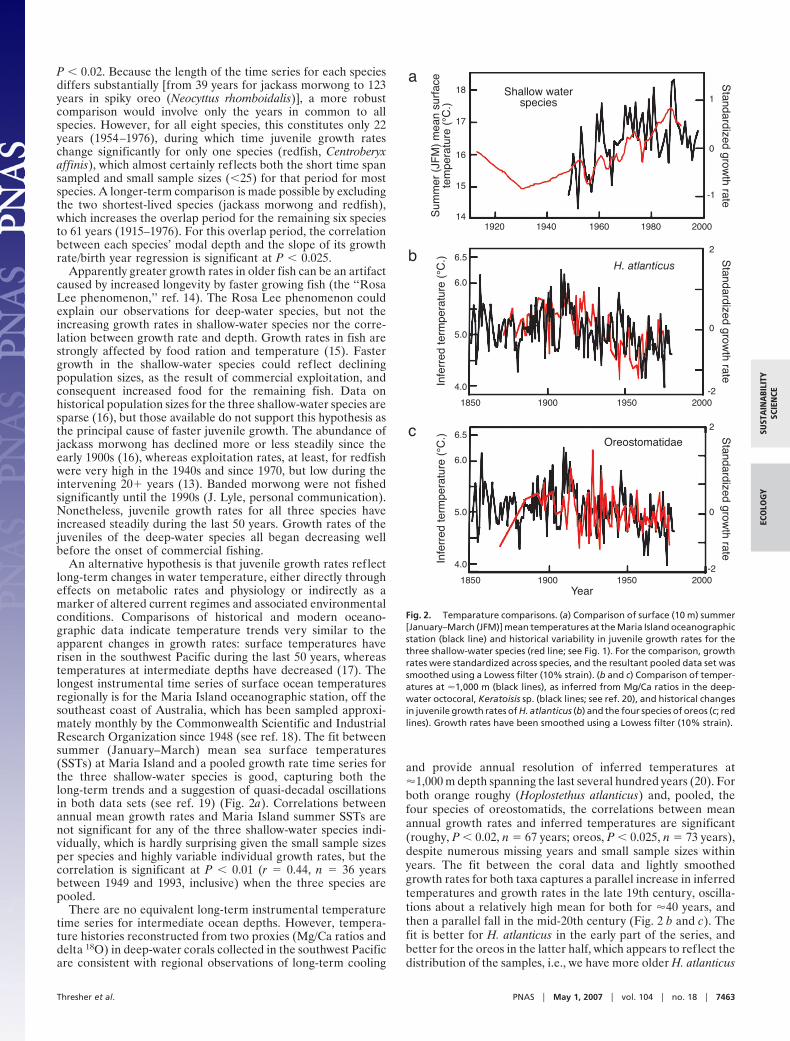
An alternative hypothesis is that juvenile growth rates reflectlong-term changes in water temperature, either directly througheffects on metabolic rates and physiology or indirectly as amarker of altered current regimes and associated environmentalconditions. Comparisons of historical and modern oceano-graphic data indicate temperature trends very similar to theapparent changes in growth rates: surface temperatures haverisen in the southwest Pacific during the last 50 years, whereastemperatures at intermediate depths have decreased (17). Thelongest instrumental time series of surface ocean temperaturesregionally is for the Maria Island oceanographic station, off thesoutheast coast of Australia, which has been sampled approxi-mately monthly by the Commonwealth Scientific and IndustrialResearch Organization since 1948 (see ref. 18). The fit betweensummer (January–March) mean sea surface temperatures(SSTs) at Maria Island and a pooled growth rate time series forthe three shallow-water species is good, capturing both thelong-term trends and a suggestion of quasi-decadal oscillationsin both data sets (see ref. 19) (Fig. 2a). Correlations betweenannual mean growth rates and Maria Island summer SSTs arenot significant for any of the three shallow-water species indi-vidually, which is hardly surprising given the small sample sizesper species and highly variable individual growth rates, but thecorrelation is significant at P � 0.01 (r � 0.44, n � 36 yearsbetween 1949 and 1993, inclusive) when the three species arepooled.
There are no equivalent long-term instrumental temperaturetime series for intermediate ocean depths. However, tempera-ture histories reconstructed from two proxies (Mg/Ca ratios anddelta 18O) in deep-water corals collected in the southwest Pacificare consistent with regional observations of long-term cooling
and provide annual resolution of inferred temperatures at�1,000 m depth spanning the last several hundred years (20). Forboth orange roughy (Hoplostethus atlanticus) and, pooled, thefour species of oreostomatids, the correlations between meanannual growth rates and inferred temperatures are significant(roughy, P � 0.02, n � 67 years; oreos, P � 0.025, n � 73 years),despite numerous missing years and small sample sizes withinyears. The fit between the coral data and lightly smoothedgrowth rates for both taxa captures a parallel increase in inferredtemperatures and growth rates in the late 19th century, oscilla-tions about a relatively high mean for both for �40 years, andthen a parallel fall in the mid-20th century (Fig. 2 b and c). Thefit is better for H. atlanticus in the early part of the series, andbetter for the oreos in the latter half, which appears to reflect thedistribution of the samples, i.e., we have more older H. atlanticus
Shallow waterspecies
H. atlanticus
18
17
16
15
14
6.5
6.0
5.0
4.0
1920 1940 1960 1980 2000
2000195019001850
-1
0
1
2
0
-2
Standardized grow
th rateS
tandardized growth rate
Sum
mer
(JF
M)
mea
n su
rfac
ete
mpe
ratu
re (
°C.)
Infe
rred
term
pera
ture
(°C
.)Oreostomatidae
6.5
6.0
5.0
4.0
200019501900Year
1850
2
0
-2
Standardized grow
th rate
Infe
rred
term
pera
ture
(°C
.)
a
b
c
Fig. 2. Temparature comparisons. (a) Comparison of surface (10 m) summer[January–March (JFM)] mean temperatures at the Maria Island oceanographicstation (black line) and historical variability in juvenile growth rates for thethree shallow-water species (red line; see Fig. 1). For the comparison, growthrates were standardized across species, and the resultant pooled data set wassmoothed using a Lowess filter (10% strain). (b and c) Comparison of temper-atures at �1,000 m (black lines), as inferred from Mg/Ca ratios in the deep-water octocoral, Keratoisis sp. (black lines; see ref. 20), and historical changesin juvenile growth rates of H. atlanticus (b) and the four species of oreos (c; redlines). Growth rates have been smoothed using a Lowess filter (10% strain).
Thresher et al. PNAS � May 1, 2007 � vol. 104 � no. 18 � 7463
SUST
AIN
ABI
LITY
SCIE
NCE
ECO
LOG
Y

than oreos, but because we were sampling four species, muchhigher sample sizes for the oreos later in the series.
DiscussionThe correlations for both shallow and deep-water species suggestthat water temperature has been a primary factor in determiningjuvenile growth rates in these species. If so, then long-termtemperature reconstructions allow a longer-term perspective onpossible changes in these growth rates for both fish groups. Forthe shallow-water species, summer mean SSTs at Maria Islandand the mean annual growth rates of the fish both correlatesignificantly with global surface temperature anomalies (r �0.11, n � 55 years, P � 0.02, and r � 0.38, n � 36 years, P � 0.03,respectively; Fig. 3 Upper). The link between global and regionalwarming is apparently mediated by a poleward shift in SouthPacific zonal winds, which has strengthened the warm, polewardflowing East Australian Current and increased temperate SSTsregionally (21). Extrapolating the relationship between fishgrowth rates and the historical global temperature records to the
full record suggests that growth rates have been increasing sincethe early 1900s. The coral records allow a similar assessment fordeep-water taxa (Fig. 3 Lower). Data from recent corals whosegrowth spans the last 300 years indicate that the temperaturedecline since the mid-1800s, matched by declining fish growthrates, is part of a much-longer downward trend in temperaturesat intermediate depths. If so, then modern growth rates ofjuvenile orange roughy and deep-water oreostomatids could bemuch less than they were in the 1700s.
Slower growth in fishes has been correlated with a variety of lifehistory traits, including higher mortality as the result of predationand starvation (22); reduced food availability as the result of gapelimitations (23); usually, but not always, shorter life spans (13, 24);increased age at sexual maturity and/or smaller size at maturity (25)and, because of the relationship between size and fecundity (e.g.,ref. 26), reduced age-specific fecundity (24). Greater growth rateswould have an opposite effect, up to species-specific physiologicallimits. Growth rate and age at sexual maturity are key determinantsof stock productivity, suggesting that faster juvenile growth inmodern populations of the shallow-water species may have helpedbuffer them from effects of exploitation. Conversely, decreasinggrowth rates suggest populations of orange roughy and the oreosare less productive than they have been in the past (27), which couldhelp explain why these fisheries often have been difficult to sustain(28). More broadly, depth-mediated changes in growth rates similarto those we document for southwest Pacific fishes could be wide-spread (e.g., ref. 29), given the role of temperature in determiningpoikilotherm growth rates and globally increasing SSTs (30). Long-term trends in temperatures at intermediate depths appear to begeographically more variable, decreasing across much of the South-ern Hemisphere (13) and in mid-latitude areas in the NorthernHemisphere, but increasing in lower-latitude portions of both theAtlantic and Pacific Oceans (30, 31). Modeling suggests that, withincreasing global warning, temperatures at intermediate depths arelikely to rise near globally (W. Cai, personal communication),suggesting that, over the course of time, the decrease in growth ratesfor the deep-water species could slow and even be reversed. Finally,we note that the close association between environmental temper-ature and fish growth rates we observed strongly indicates nophysiological or ecological (e.g., changes in geographic or depthdistributions) compensation for changing temperatures, which isconsistent with previous studies indicating a slow ecological re-sponse to global climate change in long-lived marine species (4).
We thank N. Bax, S. Rintoul, and two anonymous referees for commentson the manuscript; Wenju Cai for data on the modeled effects of climatechange on temperatures at intermediate depths; N. Klaer and J. Lyle forinformation on historical stock sizes; M. Clark and R. Tilzey forinformation on depth ranges; and the Australian Fisheries Research andDevelopment Corporation for their support of the project.
1. Department for Environment, Food, and Rural Affairs (DEFRA) (2005)Marine Fish and Fisheries (DEFRA, London).
2. Devine JA, Baker KD, Haedrich RL (2006) Nature 439:29.3. Hsieh C-H, Reiss CS, Hunter JR, Beddington JR, May RM, Sugihara G (2006)
Nature 443:859–862.4. Allison PL, Low PJ, Ellis JR, Reynolds JD (2005) Science 308:1912–1915.5. Drinkwater KF, Loeng H, Megrey BA, Bailey N, Cook RM, eds (2005) ICES
J Mar Sci 7:1203–1542.6. Casselman JM (1990) Trans Am Fish Soc 119:673–688.7. Boehlert GW, Yoklavich MM, Chelton DB (1989) Fish Bull 87:791–806.8. Pereira DL, Anderson CS, Radomski PJ, Sak T, Stevens A (1995) Can Spec
Publ Fish Aquat Sci 121:709–717.9. Mace PM, Feanaughty JM, Coburn RP, Doonan IJ (1990) N Z J Mar Freshwater
Res 24:105–119.10. Stewart BD, Fenton GE, Smith DC, Short SA (1995) Mar Biol 123:29–38.11. Morison AK, Robertson SG, Smith DC (1998) North Am J Fish Manage 18:587–
598.12. James GD, Inada T, Nakamura I (1988) N Z J Zool 15:291–326.
13. Kailola PJ, Williams MJ, Stewart PC, Reichelt RE, McNee A, Grieve C (1993)Australian Fisheries Resources (Bureau of Resource Science, Canberra, ACT,Australia).
14. Ricker WE (1969) J Fish Res Board Can 26:479–541.15. Hazell JR (1993) in The Physiology of Fishes, ed Evans DH (CRC, Boca Raton,
FL), pp 427–468.16. Klaer N (2006) PhD Thesis (Univ of Canberra, Canberra, Australia).17. Gillie SH (2002) Science 295:1275–1277.18. Harris GP, Nilsson C, Clementson L, Thomas D (1987) Aust J Mar Freshwater
Res 38:569–590.19. Thresher RE (2002) Int J Clim 22:901–915.20. Thresher RE, Rintoul SR, Koslow JA, Weidman C, Adkins J, Proctor C (2004)
Geophys Res Lett 31:L07212.21. Cai W, Shi G, Cowen T, Bi D, Ribbe J (2005) Geophys Res Lett
32:L23706.22. Beamish R, Mahnken C, Neville CM (2004) Trans Am Fish Soc 133:26–33.23. Mittelbach GC (1981) Ecology 62:1370–1386.24. Fischer T (2003) Berichte Polar Meeresforch 454:1–101.
Fig. 3. Comparison of long-term temperature records with growth rates forpooled shallow-water species (Upper) and orange roughy (Lower). (Upper)Global surface temperature anomaly (green line), Maria island SST record (blackline), and Lowess-filtered juvenile growth rates (red line). (Lower) Multicenturytemperaturevariabilityat�1,000m,determinedfromMg/Caratios in tworecentdeep-water corals (greenandblack lines;Keratoisis spp.,Octocoralidae) collectedat the Cascade Plateau (southwest Pacific), and Lowess-filtered juvenile orangeroughy growth rates (red line).
7464 � www.pnas.org�cgi�doi�10.1073�pnas.0610546104 Thresher et al.

25. Garrod DJ (1988) in Fish Population Dynamics, ed Gulland JA (Wiley, NewYork), 2nd Ed, pp 185–218.
26. Conroy AM, Pankhurst NW (1989) N Z J Mar Freshwater Res 23:525–527.
27. Christie GC, Regier HA (1988) Can J Fish Aquat Sci 45:301–314.28. Clark M (2001) Fish Res 51:123–135.29. Ratz H-C, Lloret J (2005) ICES J Mar Sci 62:1310–1321.
30. Levitus S, Antonov JI, Boyer TP, Stephens C (2000) Science 287:2225–2229.31. Fukasawa M, Freeland H, Perkin R, Watanabe T, Uchida H, Nishina A (2004)
Nature 427:825–827.32. Anderson OF, Bagley NW, Hurst RJ, Francis MP, Clark MR, McMillan PJ
(1998) Atlas of New Zealand Fish and Squid Distributions from ResearchBottom Trawls (Natl Inst of Water and Atmos Res, Auckland, New Zealand),Tech Rep 42.
Thresher et al. PNAS � May 1, 2007 � vol. 104 � no. 18 � 7465
SUST
AIN
ABI
LITY
SCIE
NCE
ECO
LOG
Y