denitrification kinetics in biomass- and biochar … · denitrification kinetics in biomass- and...
TRANSCRIPT
RESEARCH ARTICLE
Denitrification kinetics in biomass- and biochar-amended soilsof different landscape positions
Rajesh Chintala & Rachel K Owen & Thomas E Schumacher & Kurt A Spokas &Louis M McDonald & Sandeep Kumar & David E Clay & Douglas D Malo & Bruce Bleakley
Received: 24 April 2014 /Accepted: 21 October 2014 /Published online: 5 November 2014# Springer-Verlag Berlin Heidelberg 2014
Abstract Knowledge of how biochar impacts soil denitrifi-cation kinetics as well as the mechanisms of interactions isessential in order to better predict the nitrous oxide (N2O)mitigation capacity of biochar additions. This study had mul-tiple experiments in which the effect of three biochar materialsproduced from corn stover (Zea mays L.), ponderosa pinewood residue (Pinus ponderosa Douglas ex Lawson and C.Lawson), switchgrass (Panicum virgatum L.), and their cor-responding biomass materials (corn stover, ponderosa pinewood residue, and switchgrass) on cumulative N2O emissionsand total denitrification in soils from two different landscapepositions (crest and footslope) were studied under varyingwater-filled pore space (40, 70, and 90 %WFPS). CumulativeN2O emissions were reduced by 30 to 70 % in both crest andfootslope soils. The effect of biochars and biomass treatmentson cumulative N2O emissions and total denitrification wereonly observed at ≥40 % WFPS. The denitrification enzymeactivity (DEA) kinetic parameters, Ks (half-saturation
constant), and Vmax (maximum DEA rate) were both signifi-cantly reduced by biochar treatments, with reductions of 70–80 % in footslope soil and 80–90 % in the crest soil. Theactivation energy (Ea) and enthalpy of activation of DEA(ΔH) were both increased with biochar application. Thetrends in DEA rate constants (Ks and Vmax) were correlatedby the trends of thermodynamic parameters (activation energyEa and enthalpy of activation ΔH) for denitrifying enzymeactivity (DEA). The rate constant Vmax/Ks evaluated the ca-pacity of biochars to mitigate the denitrification process.Denitrifying enzyme kinetic parameters can be useful in eval-uating the ability of biochars to mitigate N2O gas losses fromsoil.
Keywords Nitrification .Michaelis-Menten . Activationenergy . Enthalpy . Nitrous oxide . Arrhenius
Introduction
Current agricultural practices are responsible for terrestrialproduction of nitrous oxide (N2O) which has 320 times theglobal warming potential of CO2 on a mass basis (Cayuelaet al. 2013; IPCC 2007; Paustian 2004; Ravishankara et al.2009). A majority of N2O emissions originate from agricul-ture due to the incorporation of nitrogen (N)-based agricultur-al inputs including fertilizers, manures, and crop residues intosoils (Mosier et al. 1998; Williams et al. 2011). Farmingoperations in the Midwestern US region account for 25 to33 % of N2O emissions in the USA every year (Li et al. 1996;Mummey et al. 1998).
Nitrous oxide (N2O) is produced by multiple biologicalpathways including microbial nitrification, denitrification,and nitrifier denitrification which can happen simultaneouslyin the complex soil environment (Wrage et al. 2005; Prasad2014). For a majority of soils, microbial denitrification is
Responsible editor: Philippe Garrigues
Electronic supplementary material The online version of this article(doi:10.1007/s11356-014-3762-2) contains supplementary material,which is available to authorized users.
R. Chintala (*) :R. K. Owen : T. E. Schumacher : S. Kumar :D. E. Clay :D. D. MaloDepartment of Plant Science, South Dakota State University, SNP247, Box 21040C, Brookings, SD 57006, USAe-mail: [email protected]
K. A. SpokasUSDA-ARS, Saint Paul, MN, USA
L. M. McDonaldDepartment of Plant and Soil Sciences, West Virginia University,Morgantown, WV, USA
B. BleakleyDepartment of Biology & Microbiology, South Dakota StateUniversity, Brookings, SD, USA
Environ Sci Pollut Res (2015) 22:5152–5163DOI 10.1007/s11356-014-3762-2
believed to be the principle pathway of N2O production,which is favored in anaerobic conditions (Cavigelli andRobertson 2001; Hoffmann et al. 2000) and is regulated byseveral factors: climate (Kessel et al. 2013), soil pH (Yama-moto et al. 2014; Zaman and Nguyen 2010), soil texture (Guet al. 2013), organic residue quality (i.e., C/N ratio) (Huanget al. 2004), crop type (Dalal et al. 2003), soil water content(Klemedtsson et al. 1988), O2 partial pressure (Ball et al.2008; Beare et al. 2009; Hernandez-Ramirez et al. 2009), aswell as the type and application rate of N-based agriculturalinputs (Jarecki et al. 2009; Thornton et al. 1996; Venterea et al.2005).
Most recent investigations have observed that biocharcould be an effective soil amendment to mitigate N2O emis-sions (e.g., Van Zwieten et al. 2010; Yanai et al. 2007).Biochars have been found to influence the soil pH (Enderset al. 2012), availability of nitrate (Cayuela et al. 2013),organic carbon (Pendergast-Miller et al. 2011), soil aeration(Kinney et al. 2012), and microbial activity (Lehmann et al.2011) which could ultimately impact the enzymatic pathwaysthat produce N2O in soil. The effect of biochar on N2Oemissions may also be influenced by highly heterogeneoussoil properties including spatial and temporal variability inmicrobial communities and anaerobic microsites (Ball 2013;Robertson and Tiedje 1987). There is high variability inproperties and behavior of biochars in soil which depend onthe parameters of their production process, aging (surfaceoxidation/alteration), and feedstock type (Spokas 2013;Spokas and Reicosky 2009; Zheng et al. 2013). The spatialvariability of soils combined with the complex behavior ofbiochar materials obscure the understanding of biochar’s in-terference with the denitrification process and its potential tobe optimized as agricultural soil amendment (Lehmann et al.2011).
The study of biochar’s influence on denitrification ki-netics would help to predict their long-term impact andprovide the basis to design biochar as an effective N2Omitigation tool. However, there have been limited studiesinto the impact of biochar on the fundamental enzymaticreactions in soil (Cayuela et al. 2013; Lehmann et al. 2011).In this context, this study focused on three objectives: (1)quantify the effect of four biochars (activated corn stoverbiochar, non-activated corn stover biochar, non-activatedponderosa wood residue biochar, and non-activated switch-grass biochar) and their corresponding biomass feedstockson cumulative nitrous oxide (N2O) emissions in two soilsfrom contrasting landscape positions; (2) quantify the effectof water-filled pore space on cumulative N2O emissionsand total denitrification of soils with incorporated biocharsand biomass; and (3) determine the kinetic and thermody-namic parameters including half saturation constant (Ks),denitrification enzyme activity (DEA) rate (Vmax), activa-tion energy (Ea), and enthalpy (ΔH) for the denitrification
enzyme activity in selected soils amended with both bio-chars and original biomass feedstocks.
Materials and methods
Biomass, biochars, and soils used for incubation studies
Biomass materials (corn stover (CS), ponderosa pine woodresidue (WC), and switchgrass (SG)) widely varied by C/Nvalues which ranged from 445 to 61 (Chintala et al. 2014)(Table S1). Biochars were created from corn stover (Zea maysL.; designated as CSB), ponderosa pine wood chips (Pinusponderosa Douglas ex Lawson and C. Lawson; WCB), andswitchgrass (Panicum virgatum L.; SGB). Biochars wereproduced using carbon optimized gasification, which is atwo-stage continuous patent pending process in which thereactor temperature ramps from 150 to 850 °C with residencetime of 4 h (Biochar Solutions, Inc, Carbondale, CO, USA).These biochars were highly alkaline (pH ranged from 9.3 to10.8; water to solid ratio 1:10) with high ash content (rangedfrom 379 to 652 g kg−1) and C/N values (ranged from 110 to167) (Table S2) (Chintala et al. 2014). In addition, corn stoverbiochar was chemically activated by heating at 200 °C thesolution of (1:1) biochar with concentrated (12.1 N) hydro-chloric acid (Chintala et al. 2013). All biochar materials werehomogenized and ground to pass through a 2-mm sieve beforeuse.
Composite soil surface samples (0–15 cm) were collectedfrom the crest and footslope positions of an agricultural land-scape (under corn-soybean rotation) which was located nearBrookings, SD, USA (44° 12′ 36″ N and 96° 44′ 23.9″ W).Soil from the crest position represented the Maddock soilseries (sandy, mixed, frigid Entic Hapludolls) and thefootslope position represented the Brookings soil series(fine-silty, mixed, superactive, frigid Pachic Hapludolls)(USDA 2005). The footslope soil was a clay loam with pH6.1, organic matter 34 g kg−1 soil, and nitrate—N 13 mg kg−1
soil. Crest soil was a silt loamwith an acidic pH of 5.2, organicmatter 16 g kg−1 soil, and nitrate—N 17 mg kg−1 soils(Table S3) (Chintala et al. 2014). These soils were air-dried,crushed, and passed through a 2-mm sieve, then stored atroom temperature (25 °C) until used for incubation studies.
Incubations—cumulative N2O emissions
A soil incubation study was conducted to determine the effectof three biomass feedstocks (corn stover (CS), Ponderosa pinewood chips (WC), and switchgrass (SG)) and their corre-sponding biochars (activated corn stover biochar (ACB),non-activated corn stover biochar (CSB), non-activatedponderosa pine wood residue biochar (WCB), and non-activated switchgrass biochar (SGB)) at different application
Environ Sci Pollut Res (2015) 22:5152–5163 5153
rates on cumulative N2O emissions over a period of 112 days.The air-dried soil of 40 g was placed into 125-mL serum vials(Wheaton Science Products, Millville, NJ, USA) and sealedwith butyl rubber septa. Amendments (biochars and biomass)were applied based on equivalent carbon basis at three ratesincluding 10, 30, and 50 g kg−1. All the serum vials with soiland amendment were pre-incubated for 2 weeks at 60 %water-filled pore space (WFPS) for reactivation of the soilmicrobial populations. The bulk density of the soils in theserum vials was approximately 1.2 Mg m−3. These incuba-tions were conducted under aerobic conditions to simulate theactual surface soil conditions in the field. After 2 weeks, anappropriate volume of potassium nitrate solution was added atthe rate of 150 mg N kg−1 and also to achieve 90 % WFPS insoil-amendment mixture. All the treatments were maintainedat 90%WFPS and temperature of 30±1 °C during incubation.Oxygen levels were monitored and did not drop below 15 %in serum vials during the incubation period (Spokas andReicosky 2009). All the treatments had three replications.Gas samples of 5 mL were taken from the headspace of serumvials on 1, 2, 3, 4, 5, 6, 7, 21, 28, 42, 56, 70, 84, 98, and112 days after addition of potassium nitrate to soil-amendmentmixtures. The gas samples were collected with gas-tight sy-ringes and transferred to helium-flushed and pre-evacuated20-mL headspace vials. Gas samples were analyzed for ni-trous oxide (N2O) concentration within a week using a gaschromatograph (Schimadzu GC-2014, Japan) with 63Ni-elec-tron capture detector, which was calibrated daily with appro-priate traceable gas standards (Scotty Analyzed Gases, AirLiquide America Specialty Gases LLC, Plumsteadville, PA,USA). Inorganic N (NO3
−-N and NH4+-N) was determined in
the soils before and after incubation study by extracting 20 gof soil with 1 M KCl (solid and solution ratio 1:2) using flowinjection analysis (Quick Chem FIA+, 8000 series, LatchatInstruments, USA) (Gillam et al. 2008).
Incubations—abiotic N2O emissions
This experiment was conducted to determine the productionof N2O due to chemo-denitrification (abiotic process). Fortygrams of soils of different landscape positions (footslope andcrest soils) were placed into triplicate 125-mL serum bottles.These soils were added with appropriate volume of double-distilled water to achieve 70 % WFPS. Biochar (ACB, CSB,WCB, and SGB) and biomass (CS, WC, and SG) were ap-plied to the soil at a rate of 20 g kg−1 soil. Serum bottles withtreatments were autoclaved twice for 1 h at 121 °C and103 kPa (Cayuela et al. 2013). The autoclaved serum bottleswere cooled overnight. An appropriate volume of sterilized(autoclaved) potassium nitrate solution was injected at75 mg N kg−1 soil and to attain 90 %WFPS. Sterilized serumvials were incubated at 30±1 °C for 1 h with oxygen levels≥15 % (Cayuela et al. 2013). The gas samples were collected
from headspace of serum vials to analyze for N2O concentra-tion using gas chromatography described previously.
Effect of water-filled pore space on cumulative N2Oemissions and total denitrification
To determine the impact of soil water-filled pore space(WFPS) and its interaction effect with amendments on cumu-lative N2O emissions and total denitrification potential, theamendments (four biochars and three biomass types) wereapplied at the rate of 20 g kg−1 (2 % w/w air-dried basis) tothe soils (40 g) in triplicate 125-mL serum vials. The bulkdensity of soil and amendment mixtures in serum vials wasapproximately 1.2 Mg m−3. The soil-amendment mixtureswere pre-incubated for 2 weeks at 40, 70, and 90 % WFPS,temperature of 30±1 °C, and oxygen levels ≥15 % to reducerandom greenhouse gas production pulses (Muhr et al. 2008).Following this pre-incubation, potassium nitrate solution wasadded to serum vials at 100 mg N kg−1 soil. Additionaldistilled water was added to achieve 40, 70, and 90 % water-filled pore space (WFPS) in soil-amendment mixtures. Allthese serum vials were kept airtight with butyl rubber septaand incubated for a week (oxygen levels ≥15 %) at tempera-ture of 30±1 °C either with or without acetylene (10 % v/vheadspace of serum vial). Acetylene (C2H2) was added to oneset of serum vials with treatments to block the last step ofdenitrification (conversion of N2O to N2) (Weier et al. 1993;Wrage et al. 2001). After 1 week (168 h), gas samples werecollected from the incubations for determining the N2O con-centrations. Nitrous oxide (N2O) concentrations from serumbottles without C2H2 treatment were considered as cumulativeN2O emissions. The N2O concentrations in the C2H2 treat-ments provided the total denitrification potential (i.e., N2O+N2) (Ryden et al. 1979; Gillam et al. 2008). All the treatmentsof this study were conducted with three replications.
Effect of biochars and biomass additions on denitrificationenzyme activity kinetics
Soils (40 g) were placed into 125-mL serum vials and mixedseparately with treatments of biochar (ACB, CSB, WCB, andSGB) and biomass (CS,WC, and SG) at the application rate of20 g kg−1 soil. Soil-amendment mixtures were incubated inserum bottles (oxygen levels ≥15 %) treated with C2H2 (10 %v/v) at 90 % WFPS and 30±1 °C. Glucose (5 mL of 2 mMglucose solution) and nitrogen (three application rates—KNO3 solution at 50,100, and 150 mg N kg−1 soil) wereadded to serum vials. Gas samples were collected for measur-ing N2O concentrations (denitrification) from the headspaceof serum vials at 0, 24, 48, 64, 88, 112, and 136 h afterapplication of potassium nitrate solution. The kinetic param-eters (Ks and Vmax) for the denitrification enzyme activity(DEA) were determined by linearized plots of Michaelis-
5154 Environ Sci Pollut Res (2015) 22:5152–5163
Menten equation (Eq. 1).
Michaelis‐Menten equation : V ¼ Vmax � S.Ks þ S ð1Þ
where V=DEA rate, S=nitrate concentration, Vmax=DEArate at saturating levels of S (maximum denitrification poten-tial), and Ks=half saturation constant at Vmax/2. Lineweaver-Burk, Eadie-Hofstee, and Hanes-Woolf plots were used tomodel the DEA versus time (Halwachs 1978).
Thermodynamic parameters (activation energy (Ea) andenthalpy of activation (ΔH)) for DEA were calculated attemperatures varying from 10 to 30 °C using the Arrheniusequation (Eq. 2) (Cuhel et al. 2010; Laidler 1987).
Arrhenius equation : k ¼ Aexp −Ea
.RT
� �ð2Þ
Enthalpy of activation : ΔH ¼ Ea−RT ð3Þ
where k=reaction rate constant, A=Arrhenius constant,Ea=activation energy, R=universal gas constant, and T=ab-solute temperature.
Statistical analyses
Analysis of variance (ANOVA) was performed using the SASStatistical Package (version 9.2, Raleigh, NC, USA) to
determine statistically significant effects of treatments on de-nitrification parameters. The significance of treatments wasassessed at 95% confidence level (α=0.05). The separation ofmeans was calculated between treatments by a Holm-adjustedFisher’s LSD test (Holm 1979). Spearman’s rank correlationcoefficients were used to determine the relationship betweenVmax/Ks and DEA.
Results and discussion
Effect of biochars and biomass additions on cumulative N2Oemissions
Application of biochars (ACB, CSB, WCB, and SGB) andtheir corresponding biomass feedstocks (CS, WC, and SG) atapplication rates of 10, 30, and 50 g kg−1 soil significantlyaffected the cumulative N2O emissions in soils of differentlandscape positions during the incubation period of 112 daysat 90 % WFPS and 30±1 °C (Table 1). The response ofcumulative N2O emissions to the type and application rate ofadded amendments was varied with soil type. CumulativeN2O emissions were relatively lower in footslope soil com-pared to the crest soil. This is not surprising, since inorganic Nlevels (as primary denitrification regulator) also followed thistrend (Table S1). However, previous studies have attributedthis enhancement of N2O emissions due to increased activityof heterotrophic denitrifying bacteria as the availability oforganic C and nitrogen substrates increased in soil (Aulakhand Rennie 1987;Weier et al. 1993; Gillam et al. 2008). But in
Table 1 Effect of biochars and their corresponding biomass feedstocks on cumulative N2O emissions (mg N2O-N kg−1 soil) and mitigation values (%)in footslope (Brookings) and crest (Maddock) soils for incubation period of 112 days (at 90 % WFPS and 30±1 °C)
Footslope soil Crest soil
Application rate (g kg−1 soil) Application rate (g kg−1 soil)
10 30 50 10 30 50
N2O % N2O % N2O % N2O % N2O % N2O %
Control 192±8.1a 307±19a
ACB 137±7.6dA −28 90±2.6cD −53 88±4.3bD −53 227±15dB −26 127±10dC −58 123±5.1dC −59CSB 102±8.8fB −46 69±1.6fC −64 71±4.1cC −63 144±11fA −52 102±9.1eB −66 106±2.3eB −65WCB 126±10eC −34 82±7.7dD −57 89±7.2bD −53 218±13eA −28 133±6.5cB −56 124±4.5dC −59SGB 106±1.4fB −44 73±2.9eD −62 65±8.8dE −65 141±11fA −54 96±5.7fC −68 100±4.0fC −67CS 186±1.5bC −3 128±8.4bD −33 129±2.7aD −32 260±12bA −15 199±6.8aB −35 202±2.1bB −34WC 180±2.7cD −6 139±9.6aE −27 135±6.1aE −29 247±14cA −19 187±3.0bC −38 192±3.7cB −37SG 188±3.2bC −2 135±5.3aD −29 132±1.4aD −31 269±14bA −12 191±6.9bC −37 211±6.2aB −31
Each value is mean of triplicate incubations shown with standard error. Significant differences by Holm-adjusted Fisher’s LSD test at α=0.05within a row are represented by uppercase letters, and lowercase letters indicate the within in a column
ACB activated corn stover biochar, CSB corn stover biochar, WCB ponderosa pine wood biochar, SGB switchgrass biochar, CS corn stover, WCponderosa pine wood residue, SG switchgrass
Environ Sci Pollut Res (2015) 22:5152–5163 5155
this study, the low pH of crest soil (5.20) may also reduce theactivity of N2O-reductase and increase N2O emissions (Flessaet al. 1998). Moreover, the fine texture (clay loam) and higherorganic matter of footslope soil may have higher surfaceinteraction with N substrates and also affect the diffusivityof N2O in the soil.
Incorporation of biochars and their biomass feedstocksreduced the cumulative N2O emissions in both soils (Table 1).In the footslope position, the biochars mitigated the cumula-tive N2O emissions to an extent ranging from 28 to 65 %compared to non-treated soils at all application rates. Theincorporation of biomass feedstocks also had a significantmitigation effect (ranging from 27 to 33 %) at applicationrates of 30 and 50 g kg−1 soil. In the crest soil, the incorpora-tion of biochars reduced the cumulative N2O emissions rang-ing from 26 to 68 %. Whereas the incorporation of biomassfeedstocks mitigated the N2O emissions ranging from 12 to38 % of the observed N2O emissions. However, there were nosignificant difference between application rates of both bio-chars and biomass feedstocks. The chemically activated cornstover biochar (ACB) was less effective in reducing N2Oproduction than the non-activated biochars (CSB, WCB, andSGB). This could be attributed to the oxidation of the surfacemoieties during the acid activation. However, since the bio-char was activated with HCl, would have resulted with anacidic biochar which suggested that pH alterations alone donot fully explain biochar’s N2O mitigation potential.
At the start of the incubation study, the inorganic N content(NO3
−-N and NH4+-N) was significantly higher with biochar
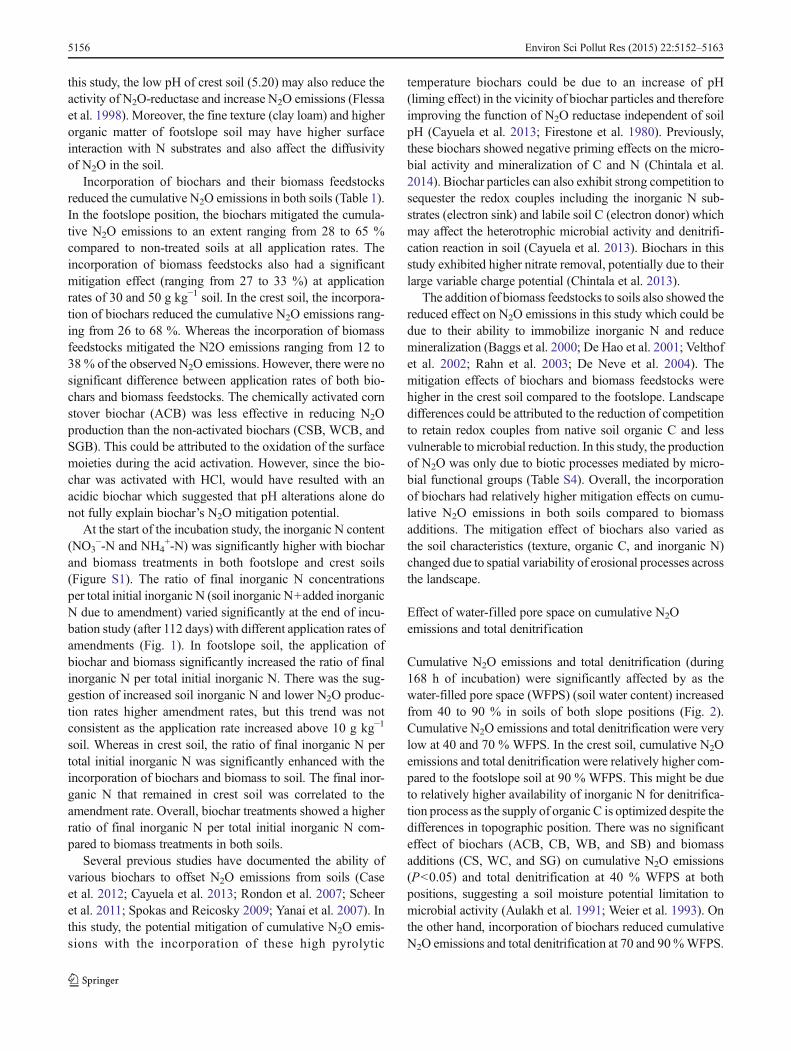
and biomass treatments in both footslope and crest soils(Figure S1). The ratio of final inorganic N concentrationsper total initial inorganic N (soil inorganic N+added inorganicN due to amendment) varied significantly at the end of incu-bation study (after 112 days) with different application rates ofamendments (Fig. 1). In footslope soil, the application ofbiochar and biomass significantly increased the ratio of finalinorganic N per total initial inorganic N. There was the sug-gestion of increased soil inorganic N and lower N2O produc-tion rates higher amendment rates, but this trend was notconsistent as the application rate increased above 10 g kg−1
soil. Whereas in crest soil, the ratio of final inorganic N pertotal initial inorganic N was significantly enhanced with theincorporation of biochars and biomass to soil. The final inor-ganic N that remained in crest soil was correlated to theamendment rate. Overall, biochar treatments showed a higherratio of final inorganic N per total initial inorganic N com-pared to biomass treatments in both soils.
Several previous studies have documented the ability ofvarious biochars to offset N2O emissions from soils (Caseet al. 2012; Cayuela et al. 2013; Rondon et al. 2007; Scheeret al. 2011; Spokas and Reicosky 2009; Yanai et al. 2007). Inthis study, the potential mitigation of cumulative N2O emis-sions with the incorporation of these high pyrolytic
temperature biochars could be due to an increase of pH(liming effect) in the vicinity of biochar particles and thereforeimproving the function of N2O reductase independent of soilpH (Cayuela et al. 2013; Firestone et al. 1980). Previously,these biochars showed negative priming effects on the micro-bial activity and mineralization of C and N (Chintala et al.2014). Biochar particles can also exhibit strong competition tosequester the redox couples including the inorganic N sub-strates (electron sink) and labile soil C (electron donor) whichmay affect the heterotrophic microbial activity and denitrifi-cation reaction in soil (Cayuela et al. 2013). Biochars in thisstudy exhibited higher nitrate removal, potentially due to theirlarge variable charge potential (Chintala et al. 2013).
The addition of biomass feedstocks to soils also showed thereduced effect on N2O emissions in this study which could bedue to their ability to immobilize inorganic N and reducemineralization (Baggs et al. 2000; De Hao et al. 2001; Velthofet al. 2002; Rahn et al. 2003; De Neve et al. 2004). Themitigation effects of biochars and biomass feedstocks werehigher in the crest soil compared to the footslope. Landscapedifferences could be attributed to the reduction of competitionto retain redox couples from native soil organic C and lessvulnerable to microbial reduction. In this study, the productionof N2O was only due to biotic processes mediated by micro-bial functional groups (Table S4). Overall, the incorporationof biochars had relatively higher mitigation effects on cumu-lative N2O emissions in both soils compared to biomassadditions. The mitigation effect of biochars also varied asthe soil characteristics (texture, organic C, and inorganic N)changed due to spatial variability of erosional processes acrossthe landscape.
Effect of water-filled pore space on cumulative N2Oemissions and total denitrification
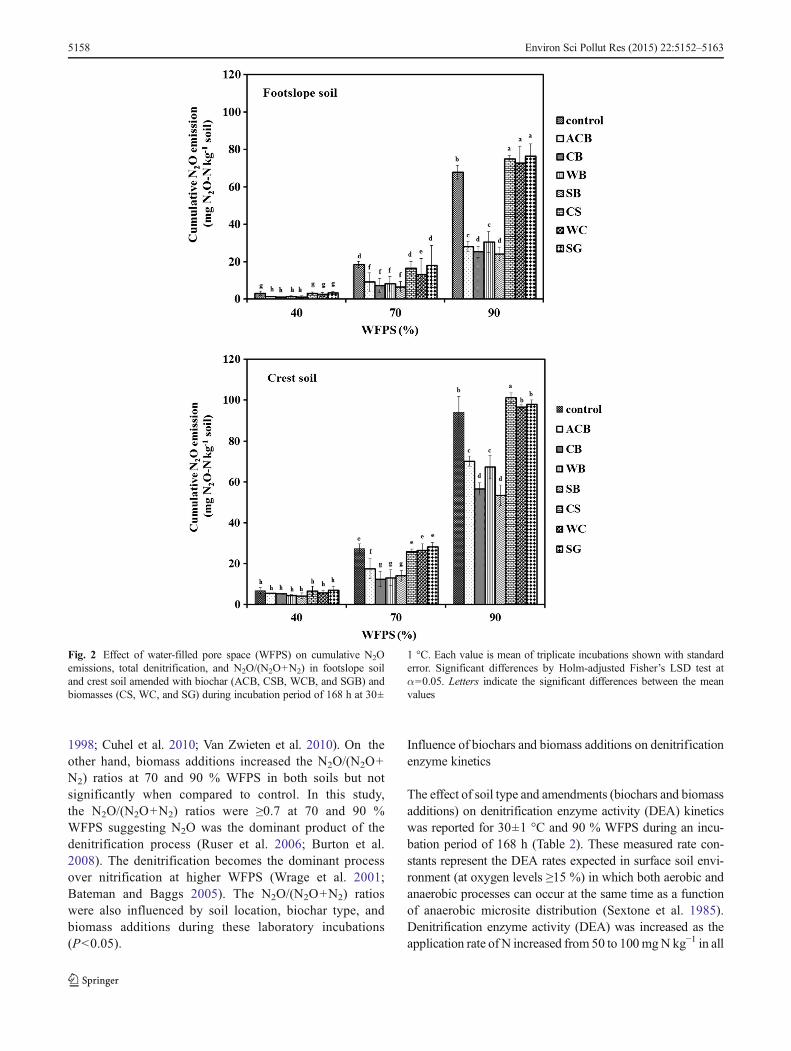
Cumulative N2O emissions and total denitrification (during168 h of incubation) were significantly affected by as thewater-filled pore space (WFPS) (soil water content) increasedfrom 40 to 90 % in soils of both slope positions (Fig. 2).Cumulative N2O emissions and total denitrification were verylow at 40 and 70 % WFPS. In the crest soil, cumulative N2Oemissions and total denitrification were relatively higher com-pared to the footslope soil at 90 % WFPS. This might be dueto relatively higher availability of inorganic N for denitrifica-tion process as the supply of organic C is optimized despite thedifferences in topographic position. There was no significanteffect of biochars (ACB, CB, WB, and SB) and biomassadditions (CS, WC, and SG) on cumulative N2O emissions(P<0.05) and total denitrification at 40 % WFPS at bothpositions, suggesting a soil moisture potential limitation tomicrobial activity (Aulakh et al. 1991; Weier et al. 1993). Onthe other hand, incorporation of biochars reduced cumulativeN2O emissions and total denitrification at 70 and 90%WFPS.
5156 Environ Sci Pollut Res (2015) 22:5152–5163
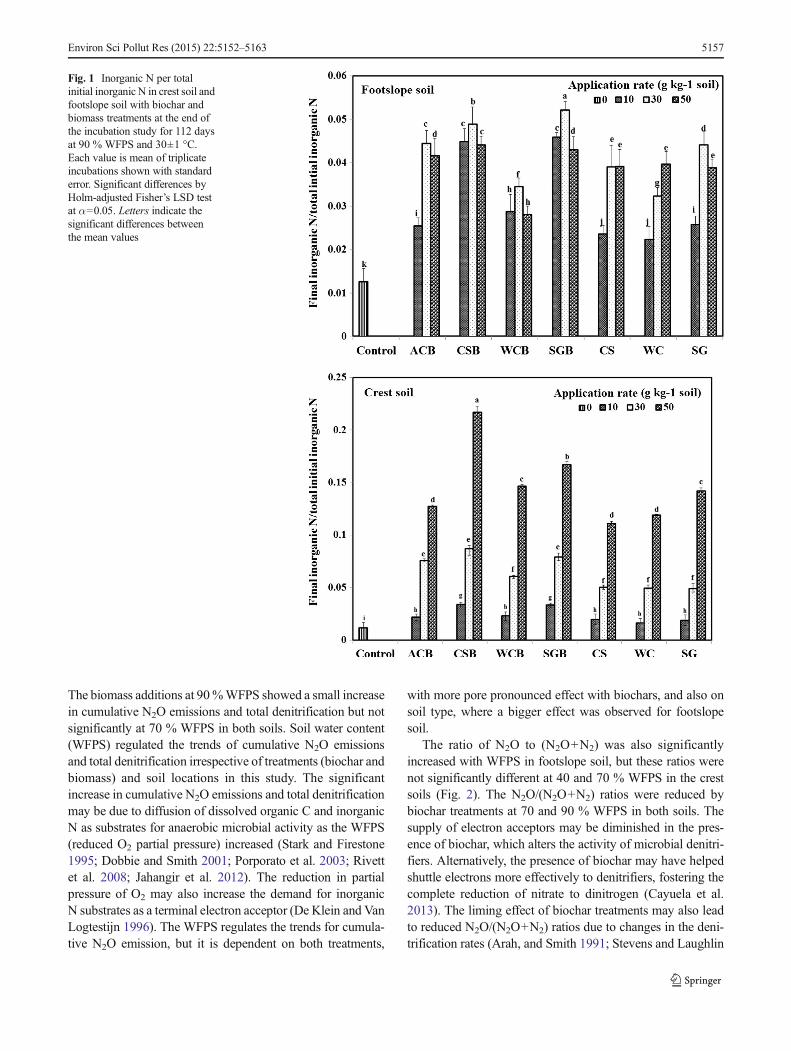
The biomass additions at 90%WFPS showed a small increasein cumulative N2O emissions and total denitrification but notsignificantly at 70 % WFPS in both soils. Soil water content(WFPS) regulated the trends of cumulative N2O emissionsand total denitrification irrespective of treatments (biochar andbiomass) and soil locations in this study. The significantincrease in cumulative N2O emissions and total denitrificationmay be due to diffusion of dissolved organic C and inorganicN as substrates for anaerobic microbial activity as the WFPS(reduced O2 partial pressure) increased (Stark and Firestone1995; Dobbie and Smith 2001; Porporato et al. 2003; Rivettet al. 2008; Jahangir et al. 2012). The reduction in partialpressure of O2 may also increase the demand for inorganicN substrates as a terminal electron acceptor (De Klein and VanLogtestijn 1996). The WFPS regulates the trends for cumula-tive N2O emission, but it is dependent on both treatments,
with more pore pronounced effect with biochars, and also onsoil type, where a bigger effect was observed for footslopesoil.
The ratio of N2O to (N2O+N2) was also significantlyincreased with WFPS in footslope soil, but these ratios werenot significantly different at 40 and 70 % WFPS in the crestsoils (Fig. 2). The N2O/(N2O+N2) ratios were reduced bybiochar treatments at 70 and 90 % WFPS in both soils. Thesupply of electron acceptors may be diminished in the pres-ence of biochar, which alters the activity of microbial denitri-fiers. Alternatively, the presence of biochar may have helpedshuttle electrons more effectively to denitrifiers, fostering thecomplete reduction of nitrate to dinitrogen (Cayuela et al.2013). The liming effect of biochar treatments may also leadto reduced N2O/(N2O+N2) ratios due to changes in the deni-trification rates (Arah, and Smith 1991; Stevens and Laughlin
Fig. 1 Inorganic N per totalinitial inorganic N in crest soil andfootslope soil with biochar andbiomass treatments at the end ofthe incubation study for 112 daysat 90 % WFPS and 30±1 °C.Each value is mean of triplicateincubations shown with standarderror. Significant differences byHolm-adjusted Fisher’s LSD testat α=0.05. Letters indicate thesignificant differences betweenthe mean values
Environ Sci Pollut Res (2015) 22:5152–5163 5157
1998; Cuhel et al. 2010; Van Zwieten et al. 2010). On theother hand, biomass additions increased the N2O/(N2O+N2) ratios at 70 and 90 % WFPS in both soils but notsignificantly when compared to control. In this study,the N2O/(N2O+N2) ratios were ≥0.7 at 70 and 90 %WFPS suggesting N2O was the dominant product of thedenitrification process (Ruser et al. 2006; Burton et al.2008). The denitrification becomes the dominant processover nitrification at higher WFPS (Wrage et al. 2001;Bateman and Baggs 2005). The N2O/(N2O+N2) ratioswere also influenced by soil location, biochar type, andbiomass additions during these laboratory incubations(P<0.05).
Influence of biochars and biomass additions on denitrificationenzyme kinetics
The effect of soil type and amendments (biochars and biomassadditions) on denitrification enzyme activity (DEA) kineticswas reported for 30±1 °C and 90 % WFPS during an incu-bation period of 168 h (Table 2). These measured rate con-stants represent the DEA rates expected in surface soil envi-ronment (at oxygen levels ≥15 %) in which both aerobic andanaerobic processes can occur at the same time as a functionof anaerobic microsite distribution (Sextone et al. 1985).Denitrification enzyme activity (DEA) was increased as theapplication rate of N increased from 50 to 100mgN kg−1 in all
Fig. 2 Effect of water-filled pore space (WFPS) on cumulative N2Oemissions, total denitrification, and N2O/(N2O+N2) in footslope soiland crest soil amended with biochar (ACB, CSB, WCB, and SGB) andbiomasses (CS, WC, and SG) during incubation period of 168 h at 30±
1 °C. Each value is mean of triplicate incubations shown with standarderror. Significant differences by Holm-adjusted Fisher’s LSD test atα=0.05. Letters indicate the significant differences between the meanvalues
5158 Environ Sci Pollut Res (2015) 22:5152–5163
treatments. But there was no significant difference between100 and 150 mg N kg−1. The values of Ks and Vmax of theDEA were higher in the footslope soil than the crest soil,which may be related to the abundance of labile C at thefootslope which can induce the positive priming effect inrelatively short time to support the growth of the denitrifiercommunity. The incorporation of biochars (ACB, CSB,WCB, and SGB) significantly reduced the Ks and Vmax valuesin soils of both landscape positions. The biomass additionsalso reduced DEA rates, but not as great as the biochars. Thelow Ks in the biochar treatments suggest that there is a higherchemical affinity for inorganic-N substrate and enzymaticinhibition which may reduce the DEA rate (Vmax). Thesepatterns of rate constants were also supported by the trendsin thermodynamic parameters (activation energy (Ea) and
enthalpy of activation (ΔH)) of DEA which were calculatedbased on its positive response as the soil temperature increasedfrom 10 to 30 °C at 90 % WFPS. The activation energy (Ea)and enthalpy (ΔH) of DEAwere increased with the incorpo-ration of biochars. On the other hand, the addition of biomassmaterials did not show any significant effect on Ea andΔH ofDEA in soils (Table 2). The increase in Ea and ΔH values ofsoils amended with biochars indicated the increase in amountof energy required for the denitrification process. In otherwords, it takes more energy for the microbes to produceN2O in biochar-amended soil suggesting a decrease in thenitrate availability, which was observed in the final extractionvalues. The rate constants (Ks and Vmax) were inversely cor-related to the energies of reactions (Ea and ΔH) as a functionof soil and biochar type.
Fig. 2 continued.
Environ Sci Pollut Res (2015) 22:5152–5163 5159

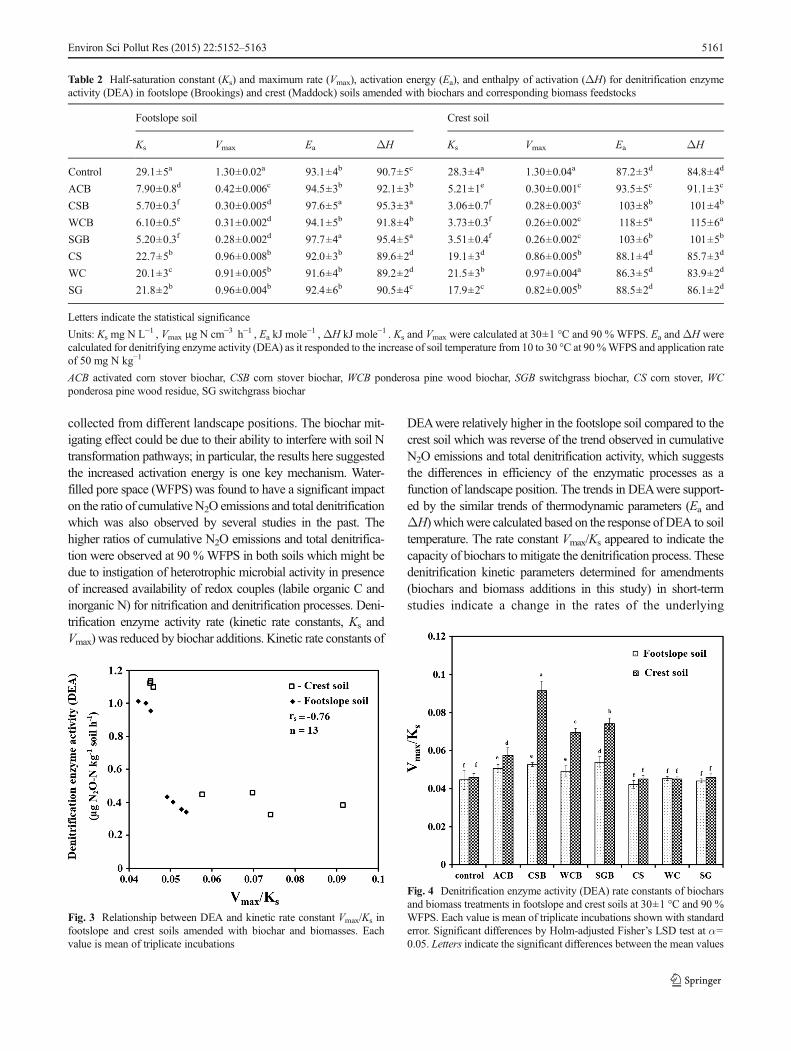
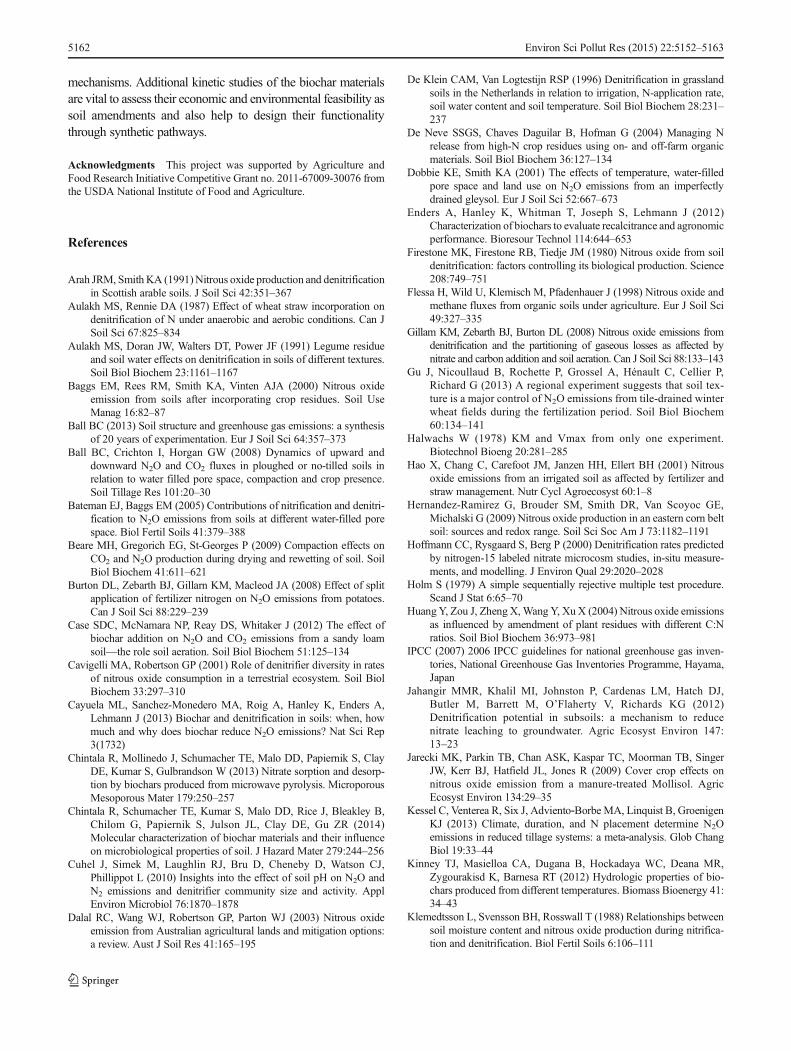
The rate constant Vmax/Ks values were plotted against DEAof biochar and biomass treatments in both soils (Fig. 3). Therewas a significant negative correlation (P<0.05) between theratio of the rate constants (Vmax/Ks) and DEA values (rs=−0.76). Therefore, the Vmax/Ks values of amendments (biocharsand biomass additions) indicate their mitigating capacity bygoverning the DEA kinetics. Higher Vmax/Ks values of theamendments indicate a higher capacity to reduce the rate ofdenitrification process. The Vmax/Ks values of biochar andbiomass treatments were given by soil position in Fig. 4.The incorporation of biochars yielded relatively higher Vmax/Ks values of DEA in the crest position compared to footslopewhich was correlated with the previously observed highermitigation effect on cumulative denitrification. This observa-tion indicates higher mitigation effect of biochars on
denitrification rate in the crest soil compared to footslope soil.The Vmax/Ks values of DEA in biomass treatments (CS, WC,and SG) were inconsistent across locations and also did notpossess significant differences with the corresponding controltreatments. Herbaceous biochars (CSB and SGB) showedrelatively higher Vmax/Ks values of DEA compared to woodspecies biochar (WCB) in the crest soil, but it was not signif-icant in the footslope soil.
Conclusions
Cumulative laboratory N2O emissions were significantly re-duced by the incorporation of biochars and biomass to soils
Fig. 2 continued.
5160 Environ Sci Pollut Res (2015) 22:5152–5163
collected from different landscape positions. The biochar mit-igating effect could be due to their ability to interfere with soil Ntransformation pathways; in particular, the results here suggestedthe increased activation energy is one key mechanism. Water-filled pore space (WFPS) was found to have a significant impacton the ratio of cumulative N2O emissions and total denitrificationwhich was also observed by several studies in the past. Thehigher ratios of cumulative N2O emissions and total denitrifica-tion were observed at 90 %WFPS in both soils which might bedue to instigation of heterotrophic microbial activity in presenceof increased availability of redox couples (labile organic C andinorganic N) for nitrification and denitrification processes. Deni-trification enzyme activity rate (kinetic rate constants, Ks andVmax) was reduced by biochar additions. Kinetic rate constants of
DEAwere relatively higher in the footslope soil compared to thecrest soil which was reverse of the trend observed in cumulativeN2O emissions and total denitrification activity, which suggeststhe differences in efficiency of the enzymatic processes as afunction of landscape position. The trends in DEAwere support-ed by the similar trends of thermodynamic parameters (Ea andΔH) whichwere calculated based on the response of DEA to soiltemperature. The rate constant Vmax/Ks appeared to indicate thecapacity of biochars to mitigate the denitrification process. Thesedenitrification kinetic parameters determined for amendments(biochars and biomass additions in this study) in short-termstudies indicate a change in the rates of the underlying
Table 2 Half-saturation constant (Ks) and maximum rate (Vmax), activation energy (Ea), and enthalpy of activation (ΔH) for denitrification enzymeactivity (DEA) in footslope (Brookings) and crest (Maddock) soils amended with biochars and corresponding biomass feedstocks
Footslope soil Crest soil
Ks Vmax Ea ΔH Ks Vmax Ea ΔH
Control 29.1±5a 1.30±0.02a 93.1±4b 90.7±5c 28.3±4a 1.30±0.04a 87.2±3d 84.8±4d
ACB 7.90±0.8d 0.42±0.006c 94.5±3b 92.1±3b 5.21±1e 0.30±0.001c 93.5±5c 91.1±3c
CSB 5.70±0.3f 0.30±0.005d 97.6±5a 95.3±3a 3.06±0.7f 0.28±0.003c 103±8b 101±4b
WCB 6.10±0.5e 0.31±0.002d 94.1±5b 91.8±4b 3.73±0.3f 0.26±0.002c 118±5a 115±6a
SGB 5.20±0.3f 0.28±0.002d 97.7±4a 95.4±5a 3.51±0.4f 0.26±0.002c 103±6b 101±5b
CS 22.7±5b 0.96±0.008b 92.0±3b 89.6±2d 19.1±3d 0.86±0.005b 88.1±4d 85.7±3d
WC 20.1±3c 0.91±0.005b 91.6±4b 89.2±2d 21.5±3b 0.97±0.004a 86.3±5d 83.9±2d
SG 21.8±2b 0.96±0.004b 92.4±6b 90.5±4c 17.9±2c 0.82±0.005b 88.5±2d 86.1±2d
Letters indicate the statistical significance
Units: Ks mg N L−1 , Vmax μg N cm−3 h−1 , Ea kJ mole−1 ,ΔH kJ mole−1 . Ks and Vmax were calculated at 30±1 °C and 90 % WFPS. Ea andΔH werecalculated for denitrifying enzyme activity (DEA) as it responded to the increase of soil temperature from 10 to 30 °C at 90%WFPS and application rateof 50 mg N kg−1
ACB activated corn stover biochar, CSB corn stover biochar, WCB ponderosa pine wood biochar, SGB switchgrass biochar, CS corn stover, WCponderosa pine wood residue, SG switchgrass biochar
Fig. 3 Relationship between DEA and kinetic rate constant Vmax/Ks infootslope and crest soils amended with biochar and biomasses. Eachvalue is mean of triplicate incubations
Fig. 4 Denitrification enzyme activity (DEA) rate constants of biocharsand biomass treatments in footslope and crest soils at 30±1 °C and 90 %WFPS. Each value is mean of triplicate incubations shown with standarderror. Significant differences by Holm-adjusted Fisher’s LSD test at α=0.05. Letters indicate the significant differences between the mean values
Environ Sci Pollut Res (2015) 22:5152–5163 5161
mechanisms. Additional kinetic studies of the biochar materialsare vital to assess their economic and environmental feasibility assoil amendments and also help to design their functionalitythrough synthetic pathways.
Acknowledgments This project was supported by Agriculture andFood Research Initiative Competitive Grant no. 2011-67009-30076 fromthe USDA National Institute of Food and Agriculture.
References
Arah JRM, Smith KA (1991)Nitrous oxide production and denitrificationin Scottish arable soils. J Soil Sci 42:351–367
Aulakh MS, Rennie DA (1987) Effect of wheat straw incorporation ondenitrification of N under anaerobic and aerobic conditions. Can JSoil Sci 67:825–834
Aulakh MS, Doran JW, Walters DT, Power JF (1991) Legume residueand soil water effects on denitrification in soils of different textures.Soil Biol Biochem 23:1161–1167
Baggs EM, Rees RM, Smith KA, Vinten AJA (2000) Nitrous oxideemission from soils after incorporating crop residues. Soil UseManag 16:82–87
Ball BC (2013) Soil structure and greenhouse gas emissions: a synthesisof 20 years of experimentation. Eur J Soil Sci 64:357–373
Ball BC, Crichton I, Horgan GW (2008) Dynamics of upward anddownward N2O and CO2 fluxes in ploughed or no-tilled soils inrelation to water filled pore space, compaction and crop presence.Soil Tillage Res 101:20–30
Bateman EJ, Baggs EM (2005) Contributions of nitrification and denitri-fication to N2O emissions from soils at different water-filled porespace. Biol Fertil Soils 41:379–388
Beare MH, Gregorich EG, St-Georges P (2009) Compaction effects onCO2 and N2O production during drying and rewetting of soil. SoilBiol Biochem 41:611–621
Burton DL, Zebarth BJ, Gillarn KM, Macleod JA (2008) Effect of splitapplication of fertilizer nitrogen on N2O emissions from potatoes.Can J Soil Sci 88:229–239
Case SDC, McNamara NP, Reay DS, Whitaker J (2012) The effect ofbiochar addition on N2O and CO2 emissions from a sandy loamsoil—the role soil aeration. Soil Biol Biochem 51:125–134
Cavigelli MA, Robertson GP (2001) Role of denitrifier diversity in ratesof nitrous oxide consumption in a terrestrial ecosystem. Soil BiolBiochem 33:297–310
Cayuela ML, Sanchez-Monedero MA, Roig A, Hanley K, Enders A,Lehmann J (2013) Biochar and denitrification in soils: when, howmuch and why does biochar reduce N2O emissions? Nat Sci Rep3(1732)
Chintala R, Mollinedo J, Schumacher TE, Malo DD, Papiernik S, ClayDE, Kumar S, Gulbrandson W (2013) Nitrate sorption and desorp-tion by biochars produced from microwave pyrolysis. MicroporousMesoporous Mater 179:250–257
Chintala R, Schumacher TE, Kumar S, Malo DD, Rice J, Bleakley B,Chilom G, Papiernik S, Julson JL, Clay DE, Gu ZR (2014)Molecular characterization of biochar materials and their influenceon microbiological properties of soil. J Hazard Mater 279:244–256
Cuhel J, Simek M, Laughlin RJ, Bru D, Cheneby D, Watson CJ,Phillippot L (2010) Insights into the effect of soil pH on N2O andN2 emissions and denitrifier community size and activity. ApplEnviron Microbiol 76:1870–1878
Dalal RC, Wang WJ, Robertson GP, Parton WJ (2003) Nitrous oxideemission from Australian agricultural lands and mitigation options:a review. Aust J Soil Res 41:165–195
De Klein CAM, Van Logtestijn RSP (1996) Denitrification in grasslandsoils in the Netherlands in relation to irrigation, N-application rate,soil water content and soil temperature. Soil Biol Biochem 28:231–237
De Neve SSGS, Chaves Daguilar B, Hofman G (2004) Managing Nrelease from high-N crop residues using on- and off-farm organicmaterials. Soil Biol Biochem 36:127–134
Dobbie KE, Smith KA (2001) The effects of temperature, water-filledpore space and land use on N2O emissions from an imperfectlydrained gleysol. Eur J Soil Sci 52:667–673
Enders A, Hanley K, Whitman T, Joseph S, Lehmann J (2012)Characterization of biochars to evaluate recalcitrance and agronomicperformance. Bioresour Technol 114:644–653
Firestone MK, Firestone RB, Tiedje JM (1980) Nitrous oxide from soildenitrification: factors controlling its biological production. Science208:749–751
Flessa H, Wild U, Klemisch M, Pfadenhauer J (1998) Nitrous oxide andmethane fluxes from organic soils under agriculture. Eur J Soil Sci49:327–335
Gillam KM, Zebarth BJ, Burton DL (2008) Nitrous oxide emissions fromdenitrification and the partitioning of gaseous losses as affected bynitrate and carbon addition and soil aeration. Can J Soil Sci 88:133–143
Gu J, Nicoullaud B, Rochette P, Grossel A, Hénault C, Cellier P,Richard G (2013) A regional experiment suggests that soil tex-ture is a major control of N2O emissions from tile-drained winterwheat fields during the fertilization period. Soil Biol Biochem60:134–141
Halwachs W (1978) KM and Vmax from only one experiment.Biotechnol Bioeng 20:281–285
Hao X, Chang C, Carefoot JM, Janzen HH, Ellert BH (2001) Nitrousoxide emissions from an irrigated soil as affected by fertilizer andstraw management. Nutr Cycl Agroecosyst 60:1–8
Hernandez-Ramirez G, Brouder SM, Smith DR, Van Scoyoc GE,Michalski G (2009) Nitrous oxide production in an eastern corn beltsoil: sources and redox range. Soil Sci Soc Am J 73:1182–1191
Hoffmann CC, Rysgaard S, Berg P (2000) Denitrification rates predictedby nitrogen-15 labeled nitrate microcosm studies, in-situ measure-ments, and modelling. J Environ Qual 29:2020–2028
Holm S (1979) A simple sequentially rejective multiple test procedure.Scand J Stat 6:65–70
Huang Y, Zou J, Zheng X,Wang Y, XuX (2004) Nitrous oxide emissionsas influenced by amendment of plant residues with different C:Nratios. Soil Biol Biochem 36:973–981
IPCC (2007) 2006 IPCC guidelines for national greenhouse gas inven-tories, National Greenhouse Gas Inventories Programme, Hayama,Japan
Jahangir MMR, Khalil MI, Johnston P, Cardenas LM, Hatch DJ,Butler M, Barrett M, O’Flaherty V, Richards KG (2012)Denitrification potential in subsoils: a mechanism to reducenitrate leaching to groundwater. Agric Ecosyst Environ 147:13–23
Jarecki MK, Parkin TB, Chan ASK, Kaspar TC, Moorman TB, SingerJW, Kerr BJ, Hatfield JL, Jones R (2009) Cover crop effects onnitrous oxide emission from a manure-treated Mollisol. AgricEcosyst Environ 134:29–35
Kessel C, Venterea R, Six J, Adviento‐Borbe MA, Linquist B, GroenigenKJ (2013) Climate, duration, and N placement determine N2Oemissions in reduced tillage systems: a meta‐analysis. Glob ChangBiol 19:33–44
Kinney TJ, Masielloa CA, Dugana B, Hockadaya WC, Deana MR,Zygourakisd K, Barnesa RT (2012) Hydrologic properties of bio-chars produced from different temperatures. Biomass Bioenergy 41:34–43
Klemedtsson L, Svensson BH, Rosswall T (1988) Relationships betweensoil moisture content and nitrous oxide production during nitrifica-tion and denitrification. Biol Fertil Soils 6:106–111
5162 Environ Sci Pollut Res (2015) 22:5152–5163
Laidler KJ (1987) Chemical kinetics. Harper & Row, New YorkLehmann J, Rillig MC, Thies J, Masiello CA, HockadayWC, Crowley D
(2011) Biochar effects on soil biota—a review. Soil Biol Biochem43:1812–1836
Li C, Narayanan V, Hariss R (1996) Model estimates of nitrous oxideemissions from agricultural lands in the United States. GlobBiogeochem Cycles 10:297–306
Moraghan JT, Buresh RJ (1977) Chemical reduction of nitrite and nitrousoxide by ferrous iron. Soil Sci Soc Am J 41:47–50
Mosier AR, Kroeze C, Nevison C, Oenema O, Seitzinger SP, vanCleemput O (1998) Closing the global N2O budget: nitrous oxideemissions through the agricultural nitrogen cycle. Nutr CyclAgroecosyst 52:225–248
Muhr J, Goldberg SD, Borken W, Gebauer G (2008) Repeated drying-rewetting cycles and their effects on the emission of CO2, N2O, andCH4 in a forest soil. J Plant Nut Soil Sci 171:719–728
Mummey D, Smith J, Bluhm G (1998) Assessment of alternative soilmanagement practices on N2O emissions from U.S. agriculture.Agric Ecosyst Environ 70:79–87
Paustian K (2004) Agricultural mitigation of greenhouse gases: scienceand policy options. In. Council on Agricultural Science andTechnology (CAST) p120
Pendergast-Miller MT, Duvall M, Sohi SP (2011) Localization of nitratein the rhizosphere of biochar-amended soils. Soil Biol Biochem 43:2243–2246
Peterson SO, Regina K, Pollinger A, Rigler E, Valli L, Yamulki S, EsalaM, Fabbri C, Syvasalo E, Vinther FP (2006) Nitrous oxide emis-sions from organic and conventional crop rotations in five Europeancountries. Agric Ecosyst Environ 112:200–206
Porporato A, Odorico PD, Laio F, Rodriguez-Iturbe I (2003) Hydrologiccontrols on soil carbon and nitrogen cycles. I. Modelling scheme.Adv Water Resour 26:45–58
Prasad R (2014) Using nitrogen and phosphorus budgets as effective toolsfor assessing nitrogen and phosphorus losses from agricultural sys-tems. Ph.D. Diss., Univ. of Florida, Gainesville
Rahn C, Bending GD, Turner MK, Lillywhite R (2003)Management of N mineralization from crop residues of highN content using amendment materials of varying quality. SoilUse Manag 19:193–200
Ravishankara AR, John SD, Robert WP (2009) Nitrous oxide(N2O): the dominant ozone-depleting substance emitted inthe 21st century. Science 326:123–125
Rivett MO, Buss SR, Morgan P, Smith JWN, Bemment CD (2008)Nitrate attenuation in groundwater: a review of biogeochemicalcontrolling processes. Adv Water Resour 42:4215–4232
Robertson GP, Tiedje JM (1987) Nitrous oxide sources in aerobic soils:nitrification, denitrification and other biological processes. Soil BiolBiochem 19:187–193
Rondon MA, Lehmann J, Ramirez J, Hurtado M (2007) Biologicalnitrogen fixation by common beans (Phaseolus vulgaris L.) in-creases with bio-char additions. Biol Fertil Soils 43:699–708
Ruser R, Flessa H, Schilling R, Beese F, Munch J (2006) Effect of crop-specific field management and N fertilization on N2O emissionsfrom fine-loamy soil. Soil Biol Biochem 38:263–274
Ryden JC, Lund LJ, Focht DD (1979) Direct measurement ofdenitrification losses from soils: I. Laboratory evaluation ofacetylene inhibition of nitrous oxide reduction. Soil Sci SocAm J 43:104–110
Samarkin VA, Madigan MT, Bowles MW, Casciotti KL, Priscu JC,McKay CP, Joye SB (2010) Abiotic nitrous oxide emission fromthe hypersaline Don Juan Pond in Antarctica. Nat Geosci 3:341–344
Scheer C, Grace P, Rowlings D, Kimber S, Van Zwieten L (2011) Effectof biochar amendment on the soil-atmosphere exchange of green-house gases from an intensive subtropical pasture in northern NewSouth Wales, Australia. Plant Soil 345:47–58
Sextone AJ, Revsbech NP, Parkin TB, Tiedje JM (1985) Direct measure-ment of oxygen profiles and denitrification rates in soil aggregates.Soil Sci Soc Am J 49:645–651
Spokas KA (2013) Impact of biochar field aging on laboratory green-house gas production potentials. GCB Bioenergy 5:165–176
Spokas KA, ReicoskyDC (2009) Impacts of sixteen different biochars onsoil greenhouse gas production. Ann Environ Sci 3:179–193
Stark JM, Firestone MK (1995) Mechanisms for soil-moisture effects onthe activity of nitrifying bacteria. Appl Environ Microbiol 61:218–220
Stevens RJ, Laughlin RJ (1998) Measurement of nitrous oxide and di-nitrogen emissions from agricultural soils. Nutr Cycl Agroecosyst52:131–139
Thornton FC, Bock BR, Tyler DD (1996) Soil emissions of nitric oxideand nitrous oxide from injected anhydrous ammonia and urea. SoilSci Soc Am J 25:1378–1384
U.S. Department of Agriculture (2005) Natural Resources ConservationService (2005) National Soil Survey Handbook, Title 430 - VI, U.S.Department of Agriculture, Natural Resources ConservationService, Washington, DC
Van Zwieten L, Kimber S,Morris S, Downie A, Berger E, Rust J, Sheer C(2010) Influence of biochars on flux of N2O and CO2 from ferrosol.Aust J Soil Res 48:555–568
Velthof GL, Kuikman P, Oenema O (2002) Nitrous oxide emission fromsoils amended with crop residues. Nutr Cycl Agroecosyst 62:249–261
Venterea RT, Burger M, Spokas KA (2005) Nitrogen oxide and methaneemissions under varying tillage and fertilizer management. JEnviron Qual 34:1467–1477
Weier KL, Doran JW, Power JF, Wal te rs DT (1993)Denitrification and the dinitrogen/nitrous oxide ratio as af-fected by soil water, available carbon, and nitrate. Soil SciSoc Am J 57:66–72
Williams JD, Long DS, Wuest SB (2011) Capture of plateau runoff byglobal positioning system-guided seed drill operation. J Soil WaterConserv 66:355–361
Wrage N, Velthof GL, van Beusichem ML, Oenema O (2001) Role ofnitrifier denitrification in the production of nitrous oxide. Soil BiolBiochem 33:1723–1732
Wrage N, van Groeningen JW, Oenema O, Baggs EM (2005)Distinguishing between soil sources of N2O using a new 15 N-and 18O-enrichment method. Rapid Commun Mass Spectrom 19:3298–3306
Yamamoto A, Akiyama H, Naokawa T, Miyazaki Y, Honda Y,Sano Y, Nakajima Y, Yagi K, K. (2014) Lime-nitrogen ap-plication affects nitrification, denitrification, and N2O emis-sion in an acidic tea soil. Biol Fertility Soils, In press:
Yanai Y, Toyota K, Okazaki M (2007) Effects of charcoal addition onN2O emissions from soil resulting from rewetting air-dried soil inshort-term laboratory experiments. Soil Sci Plant Nutr 53:181–188
Zaman M, Nguyen ML (2010) Effect of lime or zeolite on N2O and N2
emissions from a pastoral soil treated with urine or nitrate-N fertil-izer under field conditions. Agric Ecosyst Environ 136:254–261
Zheng H,Wang Z, Deng X, Zhao J, Luo Y, Novak JM, Herbert S, Xing B(2013) Characteristics and nutrient values of biochars producedfrom giant reed at different temperatures. Bioresour Technol 130:463–471
Environ Sci Pollut Res (2015) 22:5152–5163 5163