demonstration and evaluation of superpave …docs.trb.org/00972208.pdffig. 5 superpave virgin mix...
TRANSCRIPT
Demonstration and Evaluation of SUPERPAVE Technologies
Final Evaluation Report for CT Route 2
Prepared by: Donald A. Larsen, P.E.
October 2003
Report No. 2219-F-02-7
Research Project: SPR-2219
Connecticut Department of Transportation Bureau of Engineering and Highway Operations
Research and Materials
Keith R. Lane, P.E. Director of Research and Materials
James M. Sime, P.E. Manager of Research
A Project in Cooperation with the U.S. Department of Transportation Federal Highway Administration
ii
Disclaimer
The contents of this report reflect the views of the authors who
are responsible for the facts and accuracy of the data presented herein.
The contents do not necessarily reflect the official views or policies
of the Connecticut Department of Transportation or the Federal Highway
Administration. The report does not constitute a standard,
specification, or regulation.
iii
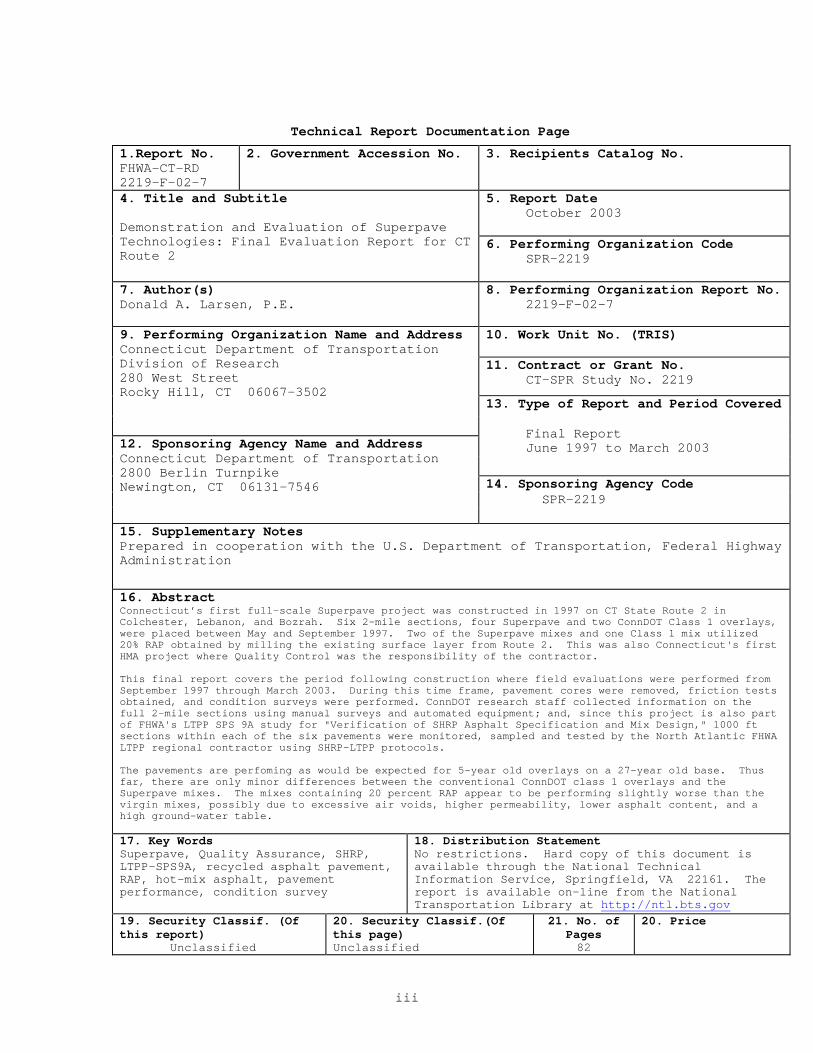
Technical Report Documentation Page
1.Report No. FHWA-CT-RD 2219-F-02-7
2. Government Accession No. 3. Recipients Catalog No.
5. Report Date October 2003
4. Title and Subtitle
Demonstration and Evaluation of Superpave Technologies: Final Evaluation Report for CT Route 2
6. Performing Organization Code SPR-2219
7. Author(s) Donald A. Larsen, P.E.
8. Performing Organization Report No. 2219-F-02-7
10. Work Unit No. (TRIS) 11. Contract or Grant No. CT-SPR Study No. 2219
9. Performing Organization Name and Address Connecticut Department of Transportation Division of Research 280 West Street Rocky Hill, CT 06067-3502
13. Type of Report and Period Covered Final Report June 1997 to March 2003
14. Sponsoring Agency Code SPR-2219
12. Sponsoring Agency Name and Address Connecticut Department of Transportation 2800 Berlin Turnpike Newington, CT 06131-7546
15. Supplementary Notes Prepared in cooperation with the U.S. Department of Transportation, Federal Highway Administration
16. Abstract Connecticut’s first full-scale Superpave project was constructed in 1997 on CT State Route 2 in Colchester, Lebanon, and Bozrah. Six 2-mile sections, four Superpave and two ConnDOT Class 1 overlays, were placed between May and September 1997. Two of the Superpave mixes and one Class 1 mix utilized 20% RAP obtained by milling the existing surface layer from Route 2. This was also Connecticut's first HMA project where Quality Control was the responsibility of the contractor. This final report covers the period following construction where field evaluations were performed from September 1997 through March 2003. During this time frame, pavement cores were removed, friction tests obtained, and condition surveys were performed. ConnDOT research staff collected information on the full 2-mile sections using manual surveys and automated equipment; and, since this project is also part of FHWA's LTPP SPS 9A study for "Verification of SHRP Asphalt Specification and Mix Design," 1000 ft sections within each of the six pavements were monitored, sampled and tested by the North Atlantic FHWA LTPP regional contractor using SHRP-LTPP protocols. The pavements are perfoming as would be expected for 5-year old overlays on a 27-year old base. Thus far, there are only minor differences between the conventional ConnDOT class 1 overlays and the Superpave mixes. The mixes containing 20 percent RAP appear to be performing slightly worse than the virgin mixes, possibly due to excessive air voids, higher permeability, lower asphalt content, and a high ground-water table. 17. Key Words Superpave, Quality Assurance, SHRP, LTPP-SPS9A, recycled asphalt pavement, RAP, hot-mix asphalt, pavement performance, condition survey
18. Distribution Statement No restrictions. Hard copy of this document is available through the National Technical Information Service, Springfield, VA 22161. The report is available on-line from the National Transportation Library at http://ntl.bts.gov
19. Security Classif. (Of this report) Unclassified
20. Security Classif.(Of this page) Unclassified
21. No. of Pages 82
20. Price
iv
Acknowledgments The author gratefully acknowledges the following people for
providing assistance during the post-construction and testing phases of
this study: Ms. Anne-Marie H. McDonnell, Mr. Jeffery J. Scully, Mr.
Eric Feldblum and Ms. Erika Smith of the Research Division; Mr. Nelio
Rodrigues, Mr. Fred Nashold, Mr. Mark Tice, Mr. David Howley and other
personnel in the Materials Testing Division; Mr. Bradley Overturf, Mr.
Matthew Herboldt and other staff in the Data Services Section. Finally,
the assistance of all who provided constructive input and review
comments for this report is gratefully appreciated.
Special thanks are offered to Dr. Charles E. Dougan, P.E., former
Director of Research and Materials, whose vision based on his many years
of experience leading ConnDOT’s Division of Research, led to the
establishment of this SUPERPAVE research study.
ConnDOT Maintenance personnel from the Colchester Maintenance
Garage provided lane closures and traffic protection for the duration of
the field data collection.
v
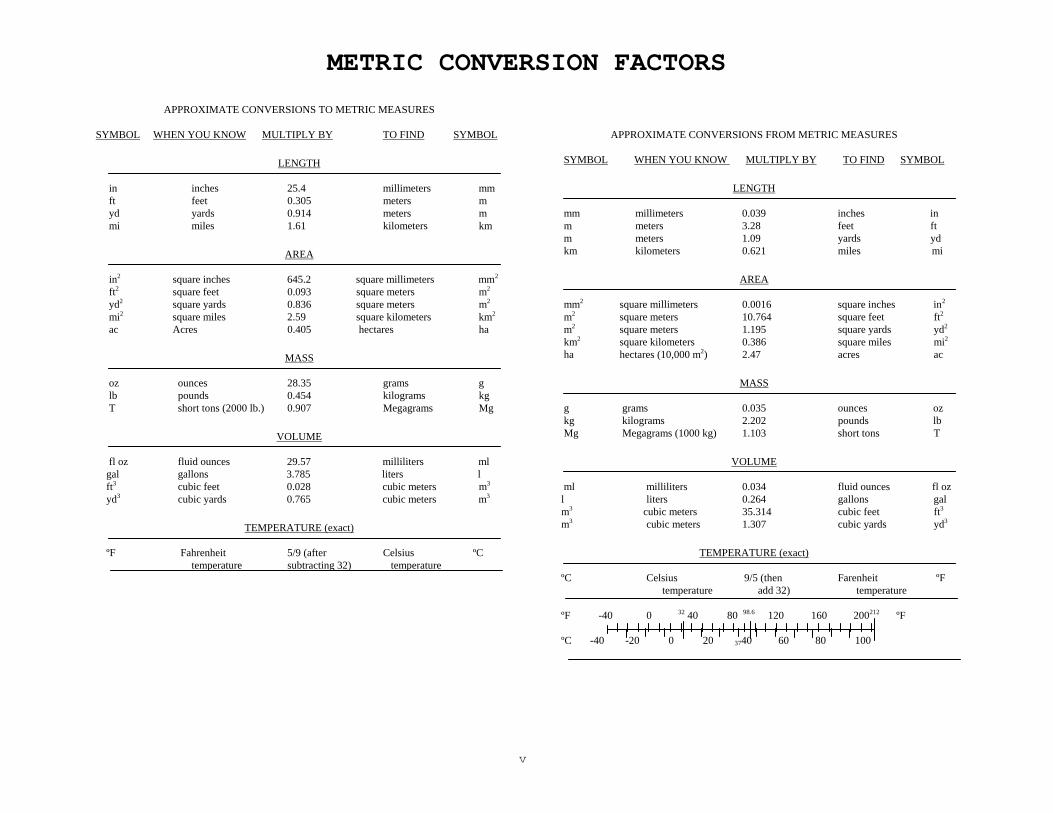
METRIC CONVERSION FACTORS
APPROXIMATE CONVERSIONS TO METRIC MEASURES SYMBOL WHEN YOU KNOW MULTIPLY BY TO FIND SYMBOL
LENGTH in inches 25.4 millimeters mm ft feet 0.305 meters m yd yards 0.914 meters m mi miles 1.61 kilometers km
AREA in2 square inches 645.2 square millimeters mm2 ft2 square feet 0.093 square meters m2 yd2 square yards 0.836 square meters m2 mi2 square miles 2.59 square kilometers km2 ac Acres 0.405 hectares ha
MASS oz ounces 28.35 grams g lb pounds 0.454 kilograms kg T short tons (2000 lb.) 0.907 Megagrams Mg
VOLUME fl oz fluid ounces 29.57 milliliters ml gal gallons 3.785 liters l ft3 cubic feet 0.028 cubic meters m3 yd3 cubic yards 0.765 cubic meters m3
TEMPERATURE (exact) ºF Fahrenheit 5/9 (after Celsius ºC temperature subtracting 32) temperature
APPROXIMATE CONVERSIONS FROM METRIC MEASURES
SYMBOL WHEN YOU KNOW MULTIPLY BY TO FIND SYMBOL
LENGTH mm millimeters 0.039 inches in m meters 3.28 feet ft m meters 1.09 yards yd km kilometers 0.621 miles mi
AREA mm2 square millimeters 0.0016 square inches in2 m2 square meters 10.764 square feet ft2 m2 square meters 1.195 square yards yd2 km2 square kilometers 0.386 square miles mi2 ha hectares (10,000 m2) 2.47 acres ac
MASS g grams 0.035 ounces oz kg kilograms 2.202 pounds lb Mg Megagrams (1000 kg) 1.103 short tons T
VOLUME ml milliliters 0.034 fluid ounces fl oz l liters 0.264 gallons gal m3 cubic meters 35.314 cubic feet ft3 m3 cubic meters 1.307 cubic yards yd3
TEMPERATURE (exact) ºC Celsius 9/5 (then Farenheit ºF temperature add 32) temperature
ºF -40 0 32 40 80 98.6 120 160 200212 ºF ºC -40 -20 0 20 3740 60 80 100
vi
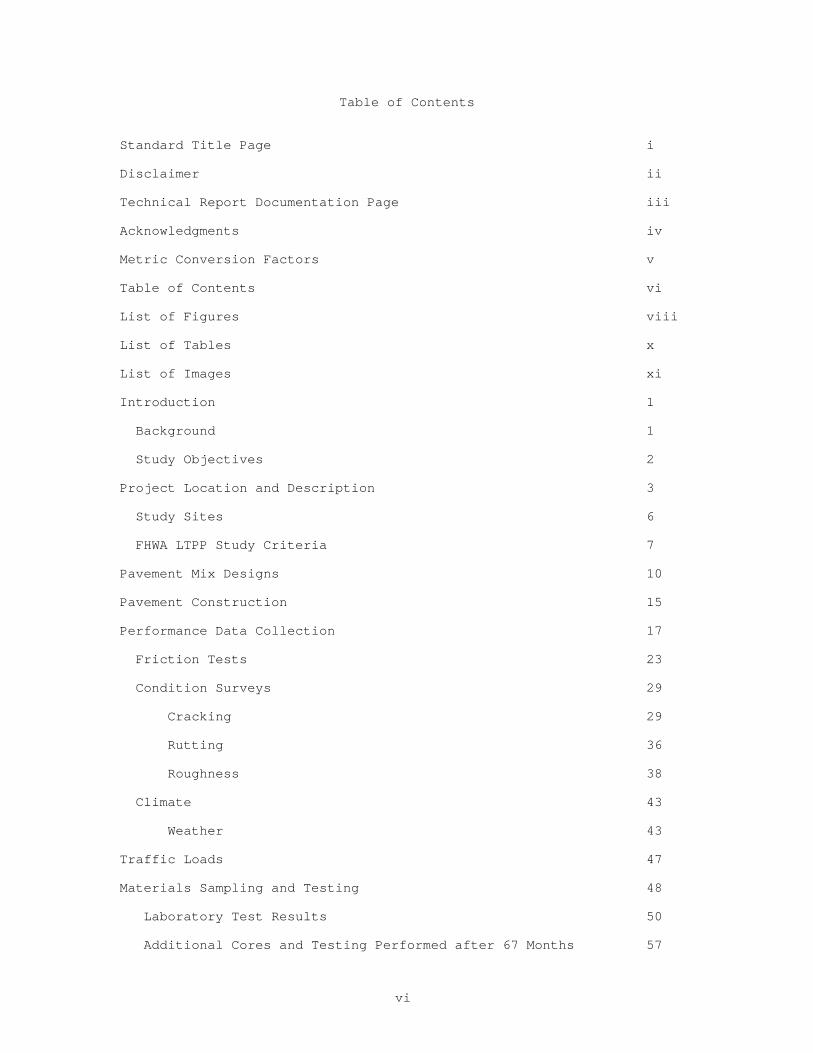
Table of Contents
Standard Title Page i
Disclaimer ii
Technical Report Documentation Page iii
Acknowledgments iv
Metric Conversion Factors v
Table of Contents vi
List of Figures viii
List of Tables x
List of Images xi
Introduction 1
Background 1
Study Objectives 2
Project Location and Description 3
Study Sites 6
FHWA LTPP Study Criteria 7
Pavement Mix Designs 10
Pavement Construction 15
Performance Data Collection 17
Friction Tests 23
Condition Surveys 29
Cracking 29
Rutting 36
Roughness 38
Climate 43
Weather 43
Traffic Loads 47
Materials Sampling and Testing 48
Laboratory Test Results 50
Additional Cores and Testing Performed after 67 Months 57
vii
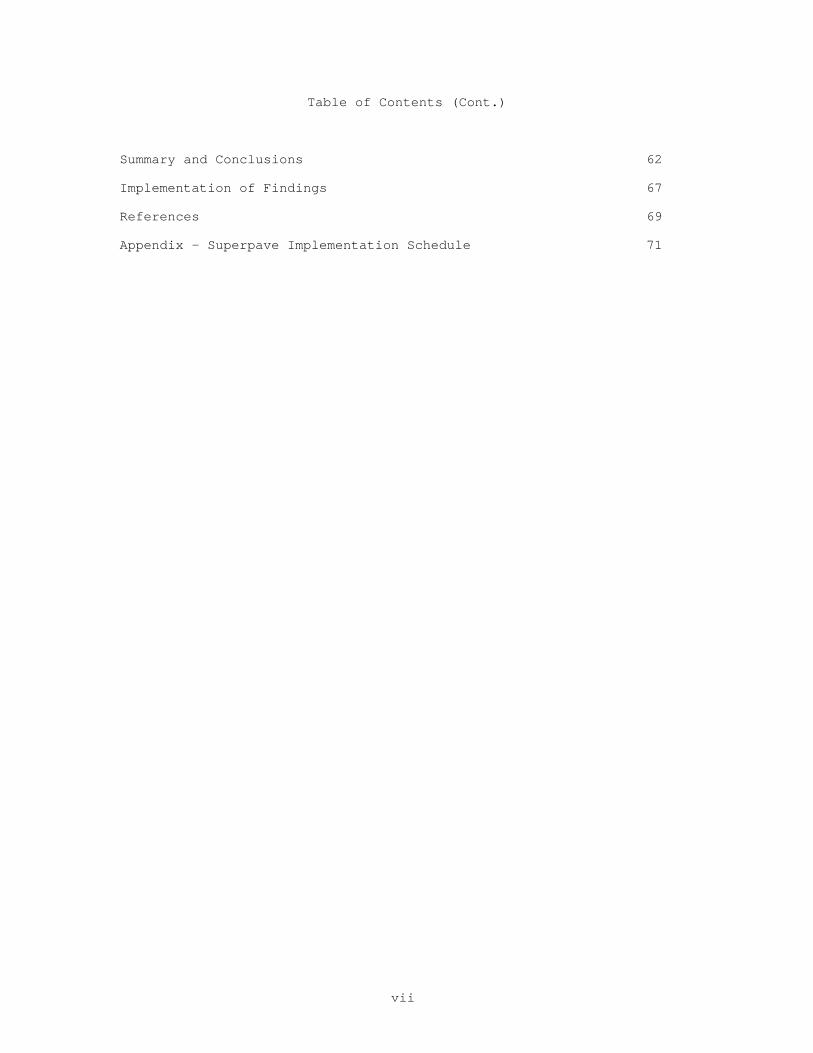
Table of Contents (Cont.)
Summary and Conclusions 62
Implementation of Findings 67
References 69
Appendix – Superpave Implementation Schedule 71
viii
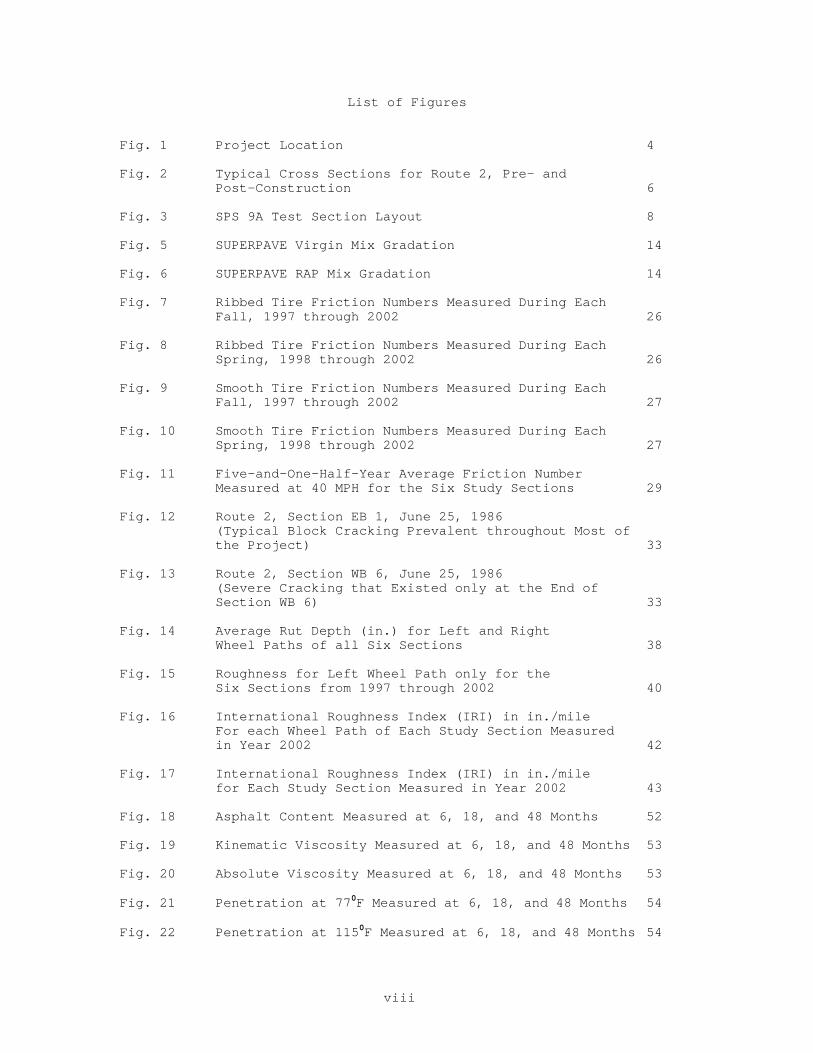
List of Figures
Fig. 1 Project Location 4
Fig. 2 Typical Cross Sections for Route 2, Pre- and Post-Construction 6
Fig. 3 SPS 9A Test Section Layout 8
Fig. 5 SUPERPAVE Virgin Mix Gradation 14
Fig. 6 SUPERPAVE RAP Mix Gradation 14
Fig. 7 Ribbed Tire Friction Numbers Measured During Each Fall, 1997 through 2002 26
Fig. 8 Ribbed Tire Friction Numbers Measured During Each Spring, 1998 through 2002 26
Fig. 9 Smooth Tire Friction Numbers Measured During Each Fall, 1997 through 2002 27
Fig. 10 Smooth Tire Friction Numbers Measured During Each Spring, 1998 through 2002 27
Fig. 11 Five-and-One-Half-Year Average Friction Number Measured at 40 MPH for the Six Study Sections 29
Fig. 12 Route 2, Section EB 1, June 25, 1986 (Typical Block Cracking Prevalent throughout Most of
the Project) 33
Fig. 13 Route 2, Section WB 6, June 25, 1986 (Severe Cracking that Existed only at the End of Section WB 6) 33
Fig. 14 Average Rut Depth (in.) for Left and Right Wheel Paths of all Six Sections 38
Fig. 15 Roughness for Left Wheel Path only for the Six Sections from 1997 through 2002 40
Fig. 16 International Roughness Index (IRI) in in./mile For each Wheel Path of Each Study Section Measured
in Year 2002 42
Fig. 17 International Roughness Index (IRI) in in./mile for Each Study Section Measured in Year 2002 43
Fig. 18 Asphalt Content Measured at 6, 18, and 48 Months 52 Fig. 19 Kinematic Viscosity Measured at 6, 18, and 48 Months 53 Fig. 20 Absolute Viscosity Measured at 6, 18, and 48 Months 53 Fig. 21 Penetration at 770F Measured at 6, 18, and 48 Months 54 Fig. 22 Penetration at 1150F Measured at 6, 18, and 48 Months 54
ix
List of Figures (Cont.)
Fig. 23 Air Voids Measured at 6, 18, and 48 Months (Specification Limits Indicated) 55
Fig. 24 Voids in the Mineral Aggregate Measured at 6, 18, and 48 Months (Lower Specification Limit Indicated) 56
Fig. 25 Voids Filled with Asphalt Measured at 6, 18, and 48 Months (Specification Limits Indicated) 56
x
List of Tables
Table 1 Section Study Parameters 9
Table 2 Superpave Master Range and Aggregate Requirements 11
Table 3 Asphalts Used in Recycled Mixes 12
Table 4 Percentage of Anti-strip Agent Used in Each Mix 16
Table 5 Date and Weather Conditions at Time of Paving the 1000-ft LTPP Monitoring Sections 16
Table 6 Summary of Mixture Laydown Data 17
Table 7 Pre-construction Data Collection Required for ConnDOT Research and/or FHWA LTPP SPS 9A 18
Table 8 During-construction Data Collection Required for
ConnDOT Research and/or FHWA LTPP SPS 9A 20 Table 9 Post-construction Data Collection Required for ConnDOT
Research and/or FHWA LTPP SPS 9A 20 Table 10 Historical Pavement Friction Data, Route 2 24
Table 11 Pavement Texture Measurements 29
Table 12 Distress Observed within 500-ft LTPP Sections (September 2002) 30
Table 13 Transverse Cracking (Two-Mile Sections), March 2003 31
Table 14 Longitudinal Construction-Joint Cracks, March 2003 35 Table 15 Approximate Percent of Project Section Containing
Longitudinal Cracks Within the Travel Lanes (March 2003) 36
Table 16 Wheel Path Rut Depths (inches) by Year within the
500-ft LTPP Sections, Measured by LTPP Contractor 37 Table 17 Wheel Path Rut Depths (inches) by Year, Measured by ConnDOT 38
Table 18 International Roughness Index (IRI) for all Sections, Both Wheel Paths, Measured by ConnDOT 39
Table 18b Comparison of Differences in Roughness by Section Before and After Adjustment 41
Table 19 Roughness at 500-ft LTPP Sections Measured by LTPP Contractor (in./mile) 41
Table 20 Weather Data: Temperatures (Norwich, CT) 44
Table 21 Temperature Data for Hartford, CT (Bradley International Airport) 1997 through 2002 45
xi
List of Tables (Cont.)
Table 22 Precipitation Data: Number of Days per Month
with 0.10 in. or More of Precipitation (Norwich, CT) 46
Table 23 Five-Year Traffic Volumes and ESALs for Route 2, Lebanon, CT 1998-2002 48
Table 24 SPS 9A Project – ConnDOT Laboratory Tests on Pavement Cores At Time = 0, 12, 18, 24, & 48 Months 49 Table 25 Dates of Core Removal by Section 50
Table 26 Results of Laboratory Tests on Core Extractions for Forensic Study of Deteriorated Sections within WB 5 and WB 6 61
List of Images
Image #1 Route 2, Bozrah/Lebanon Town Line, Facing East in Westbound Directiion, Shortly after Paving (September 1997) 9
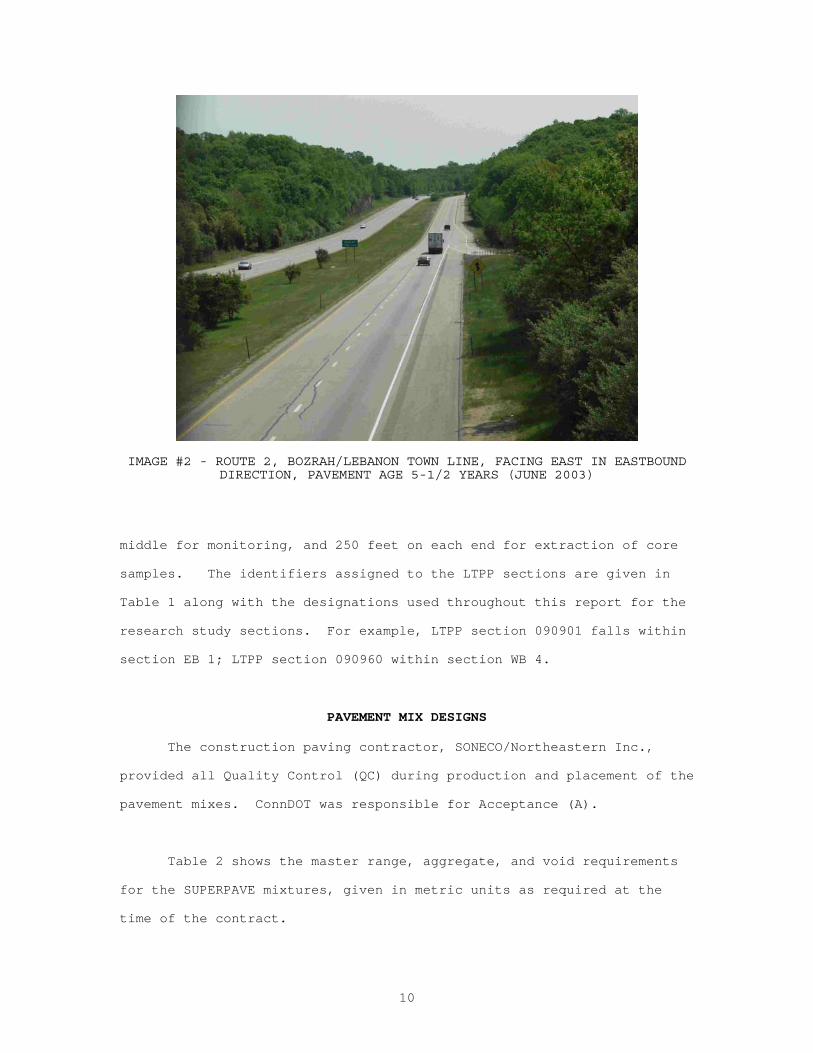
Image #2 Route 2, Bozrah/Lebanon Town Line, Facing East
In Eastbound Direction, Pavement at Age 5.5 Years (June 2003) 10
Image #3 Route 2 Eastbound Prior to Construction (August 1996) 19 Image #4 Route 2 Westbound at the Colchester/Lebanon Town Line Just Prior to Milling (May 1997) 19 Image #5 Cracks Evident Through Both Surface and Milled
Pavement (May 1997) 32 Image #6 Surface Condition in Section WB 5, Milepoint 29, June 2003 57 Image #7 Section WB 5, Closeup of Deteriorated Section with Cracking and Raveling 58 Image #8 Six-inch Pavement Core from Typical Portion of
Section WB 5 59 Image #9 Six-inch Pavement Core from Deteriorated Portion
of Section WB 5 59
1
Demonstration and Evaluation of Superpave Technologies Final Evaluation Report for CT Route 2
INTRODUCTION
Background
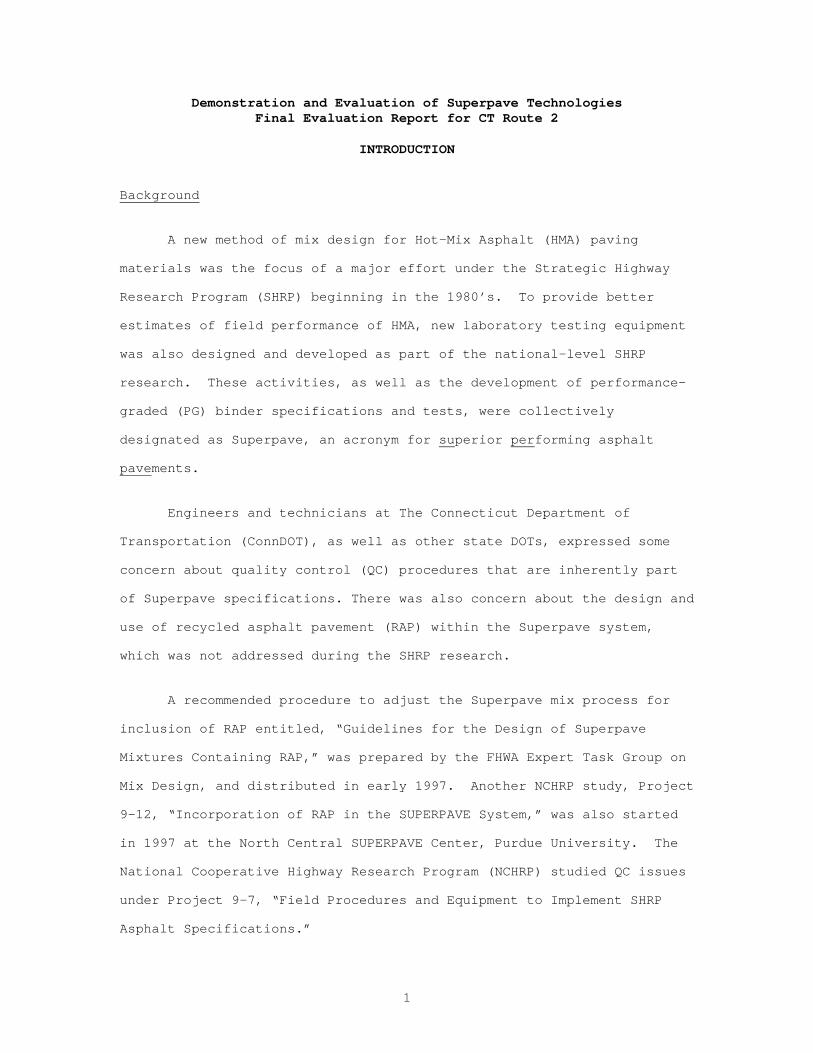
A new method of mix design for Hot-Mix Asphalt (HMA) paving
materials was the focus of a major effort under the Strategic Highway
Research Program (SHRP) beginning in the 1980’s. To provide better
estimates of field performance of HMA, new laboratory testing equipment
was also designed and developed as part of the national-level SHRP
research. These activities, as well as the development of performance-
graded (PG) binder specifications and tests, were collectively
designated as Superpave, an acronym for superior performing asphalt
pavements.
Engineers and technicians at The Connecticut Department of
Transportation (ConnDOT), as well as other state DOTs, expressed some
concern about quality control (QC) procedures that are inherently part
of Superpave specifications. There was also concern about the design and
use of recycled asphalt pavement (RAP) within the Superpave system,
which was not addressed during the SHRP research.
A recommended procedure to adjust the Superpave mix process for
inclusion of RAP entitled, “Guidelines for the Design of Superpave
Mixtures Containing RAP,” was prepared by the FHWA Expert Task Group on
Mix Design, and distributed in early 1997. Another NCHRP study, Project
9-12, “Incorporation of RAP in the SUPERPAVE System,” was also started
in 1997 at the North Central SUPERPAVE Center, Purdue University. The
National Cooperative Highway Research Program (NCHRP) studied QC issues
under Project 9-7, “Field Procedures and Equipment to Implement SHRP
Asphalt Specifications.”
2
The results from the above-cited studies were not available in
1996 when ConnDOT proposed its first full-scale field application of
Superpave. However, limited field trials had been conducted previously
in Connecticut to identify potential placement problems. The early work
on a few lower volume secondary roadways demonstrated that HMA producers
could formulate and place Superpave mixes using local resources.
Armed with knowledge of design and construction techniques, but
with concern about RAP and QC, Connecticut’s first full-scale Superpave
project was constructed on CT Route 2 between April and September 1997.
A construction report [1] published in December 1997 documents various
aspects of the Superpave design, production, quality control testing,
acceptance testing, and placement.
The Route 2 project was, and continues to be, part of the FHWA
Long-Term Pavement Performance (LTPP) Special Pavement Study #9A
“Verification of SHRP Asphalt Specification and Mix Design.” As such,
it is anticipated that the FHWA North Atlantic Region Contractor
(Stantec) will continue to collect field monitoring and performance data
through approximately 2007. These data are entered into a national
database and once having gone through quality checks are distributed via
the DataPave program for use by various interested research parties.
Study Objectives
The objectives of the ConnDOT research study as published in the study
proposal [2] dated February 1996 were:
1. to assess the quality assurance procedures set forth in NCHRP
Project 9-7; and,
2. to evaluate the performance of Superpave mixes using both virgin
and recycled aggregates.
3
Additional benefits accrued from the study included:
1. local contractor experience with design, placement, and lab
testing of Superpave;
2. participation in FHWA’s LTPP Special Pavement Study #9A;
3. provision of a showcase project for the New England states in
conjunction with FHWA Demonstration Project #90, “SUPERPAVE
Asphalt Mix Design and Field Management;”
4. development and assessment of Superpave special provisions for
ConnDOT; and,
5. ConnDOT’s first experience with contractor-provided quality
control (QC).
It should be noted that the NCHRP Project 9-7 report was not
available until after the Special Provisions for the Route 2 project
were published. Therefore, objective #1 could not be met in its
entirety during this study.
PROJECT LOCATION AND DESCRIPTION
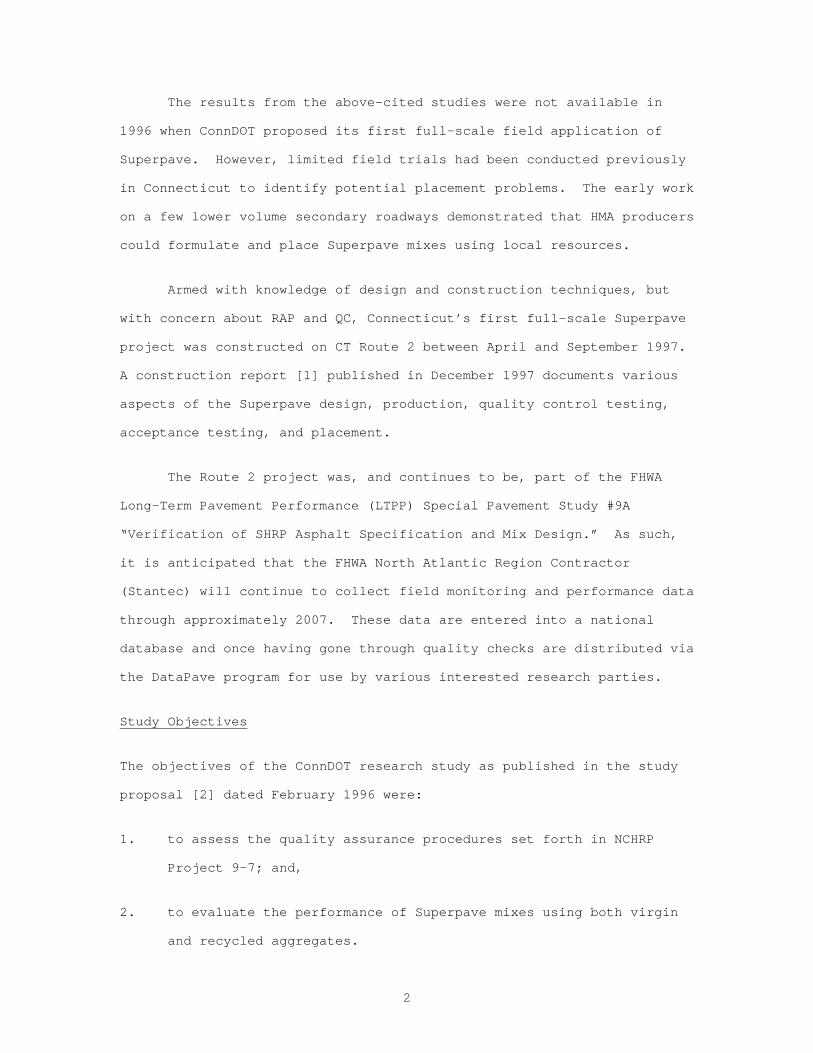
Figure 1 shows the location of the project on Route 2 in eastern
Connecticut. At this location, Route 2 is a four-lane, median-divided
highway, functionally classified as a principal arterial. It is also
designated as part of the National Highway System (NHS). This location
was selected because it met FHWA criteria established for participation
4
FIGURE 1. PROJECT LOCATION
in the FHWA LTPP Special Pavement Study 9A. The purpose of the SPS 9A
study is to verify the performance of the SUPERPAVE System. The
criteria used to select the site included projected traffic and 18,000
Project Termini
5
lb. equivalent single axle loads, horizontal and vertical curvature,
grade, consistency within cuts and fills, absence of major drainage
structures within test sections, and other LTPP specified requirements.
According to the LTPP study design, each participating project, of which
there were supposed to be 35 studied in North America, must have at
least three sections: a control section containing a standard agency
mix design, a SUPERPAVE design using a performance graded (PG) asphalt
with 98 percent reliability, and a SUPERPAVE section with PG asphalt
offering 50 percent reliability.
Route 2 was originally constructed in 1970 as a full-depth hot-mix
asphalt (HMA) pavement. It was composed of a 10-inch subbase, a 4-inch
calcium chloride stabilized base, six inches of plant mix HMA base, and
four inches of surface course containing ConnDOT Class 1 HMA. Class 1
is a mix with 100 percent of the aggregate passing the ¾ in. sieve. In
1986, Route 2 was overlaid with ConnDOT Class 114 (a semi open-graded
HMA mix) to a depth of two inches.
The section of Route 2 selected for the SUPERPAVE study begins in the
town of Colchester and runs easterly for a distance of six miles through
the town of Lebanon and into Bozrah. When originally constructed in
1970, Route 2 consisted of two 12-ft wide travel lanes, a 12-ft wide
outside shoulder, and a 3-ft wide inside shoulder. Truck climbing lanes
existed throughout the westbound direction and for the final 2.5 miles
of the eastbound direction. All the truck climbing lanes were
eliminated during the SUPERPAVE construction project in 1997. The 1997
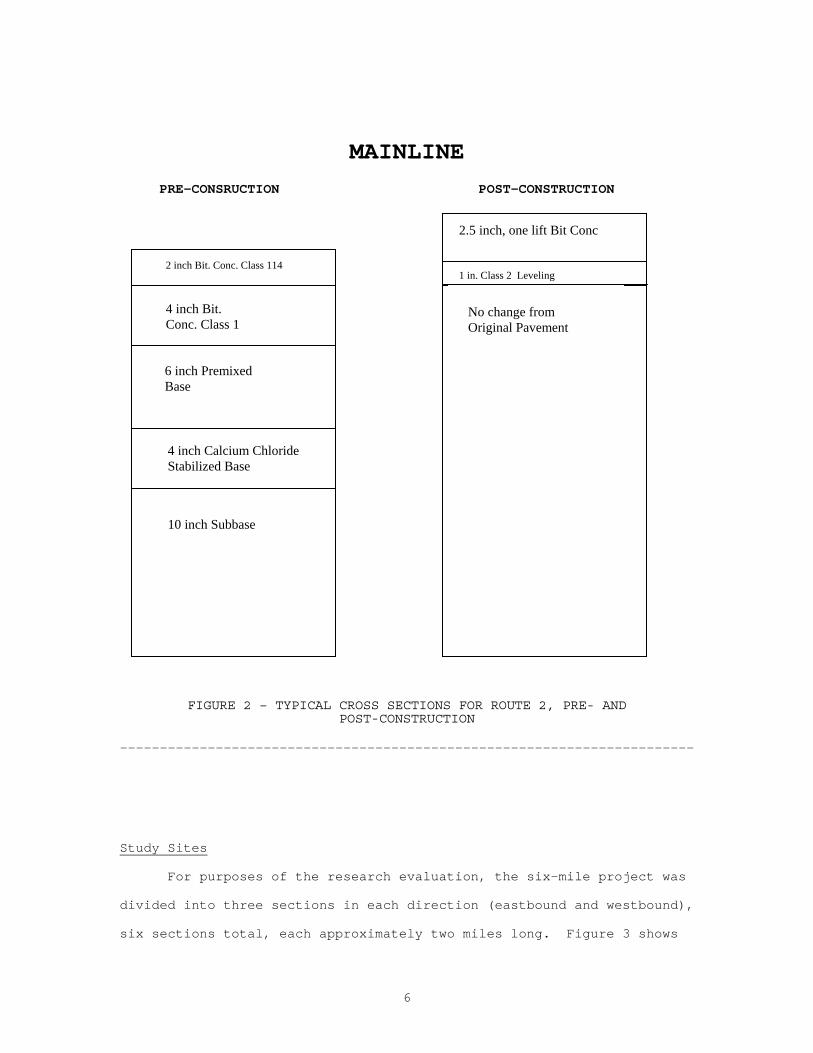
project design (see Figure 2) for Route 2 called for removal of the two
inches of Class 114 surface, placement of a one-inch layer of ConnDOT
Class 2 leveling course, and placement of a top course of 2.5 inches of
various HMA designs. The top course was placed as a single lift to meet
the testing requirements of SPS 9A.
6
MAINLINE PRE-CONSRUCTION POST-CONSTRUCTION
FIGURE 2 – TYPICAL CROSS SECTIONS FOR ROUTE 2, PRE- AND POST-CONSTRUCTION
------------------------------------------------------------------------
Study Sites
For purposes of the research evaluation, the six-mile project was
divided into three sections in each direction (eastbound and westbound),
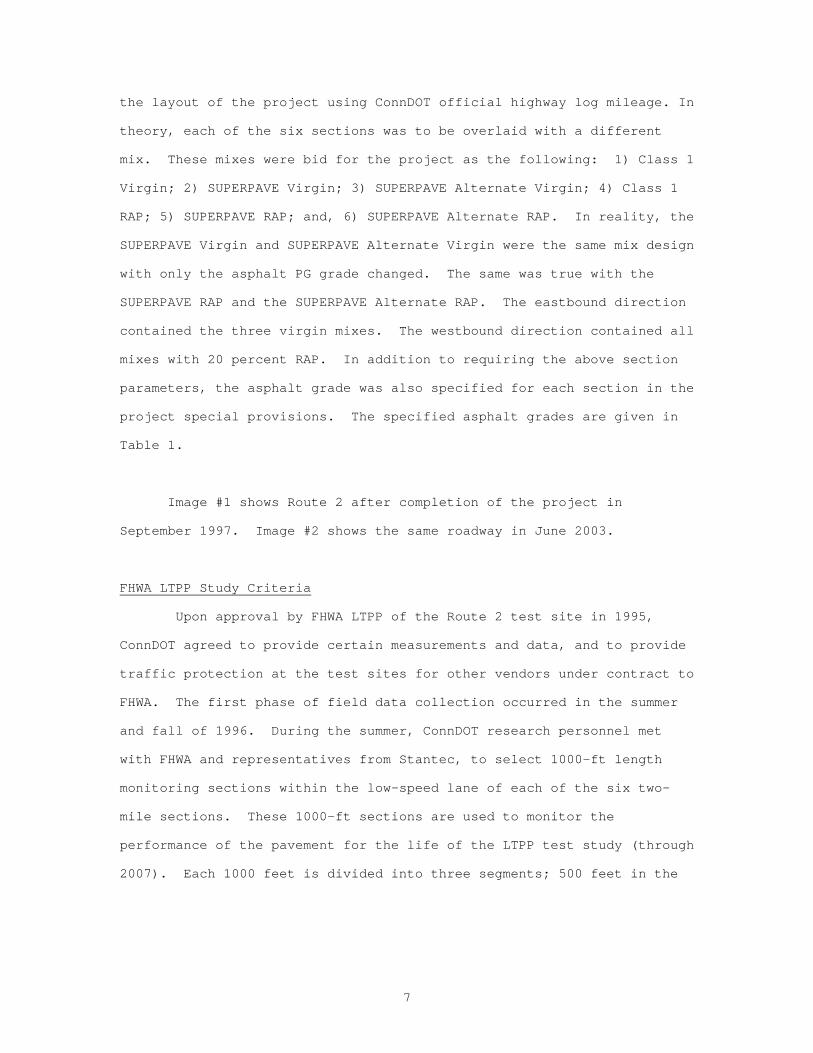
six sections total, each approximately two miles long. Figure 3 shows
4 inch Bit. Conc. Class 1
2 inch Bit. Conc. Class 114
6 inch Premixed Base
4 inch Calcium Chloride Stabilized Base
10 inch Subbase
2.5 inch, one lift Bit Conc
1 in. Class 2 Leveling
No change from Original Pavement
7
the layout of the project using ConnDOT official highway log mileage. In
theory, each of the six sections was to be overlaid with a different
mix. These mixes were bid for the project as the following: 1) Class 1
Virgin; 2) SUPERPAVE Virgin; 3) SUPERPAVE Alternate Virgin; 4) Class 1
RAP; 5) SUPERPAVE RAP; and, 6) SUPERPAVE Alternate RAP. In reality, the
SUPERPAVE Virgin and SUPERPAVE Alternate Virgin were the same mix design
with only the asphalt PG grade changed. The same was true with the
SUPERPAVE RAP and the SUPERPAVE Alternate RAP. The eastbound direction
contained the three virgin mixes. The westbound direction contained all
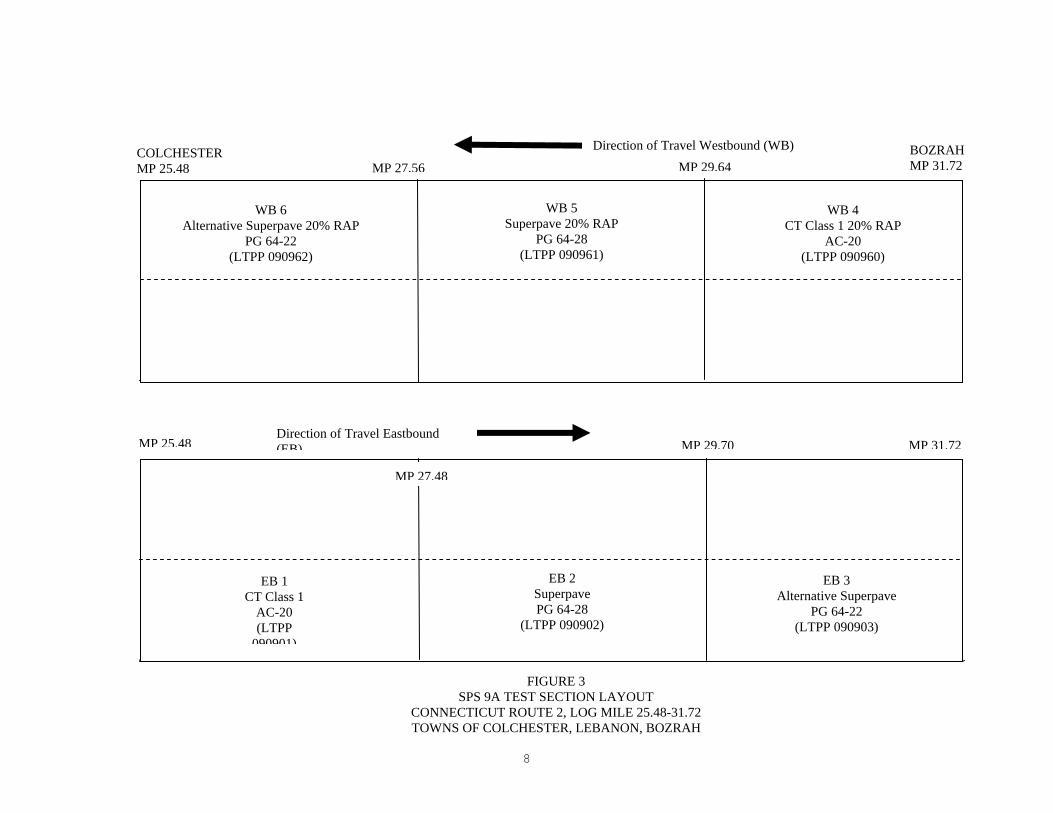
mixes with 20 percent RAP. In addition to requiring the above section
parameters, the asphalt grade was also specified for each section in the
project special provisions. The specified asphalt grades are given in
Table 1.
Image #1 shows Route 2 after completion of the project in
September 1997. Image #2 shows the same roadway in June 2003.
FHWA LTPP Study Criteria
Upon approval by FHWA LTPP of the Route 2 test site in 1995,
ConnDOT agreed to provide certain measurements and data, and to provide
traffic protection at the test sites for other vendors under contract to
FHWA. The first phase of field data collection occurred in the summer
and fall of 1996. During the summer, ConnDOT research personnel met
with FHWA and representatives from Stantec, to select 1000-ft length
monitoring sections within the low-speed lane of each of the six two-
mile sections. These 1000-ft sections are used to monitor the
performance of the pavement for the life of the LTPP test study (through
2007). Each 1000 feet is divided into three segments; 500 feet in the
8
Direction of Travel Eastbound (EB)
Direction of Travel Westbound (WB)
EB 1 CT Class 1
AC-20 (LTPP
090901)
EB 2 Superpave PG 64-28
(LTPP 090902)
EB 3 Alternative Superpave
PG 64-22 (LTPP 090903)
WB 4 CT Class 1 20% RAP
AC-20 (LTPP 090960)
WB 6 Alternative Superpave 20% RAP
PG 64-22 (LTPP 090962)
WB 5 Superpave 20% RAP
PG 64-28 (LTPP 090961)
COLCHESTER MP 25.48
MP 31.72MP 25.48
MP 27.56 MP 29.64BOZRAH MP 31.72
MP 27.48
MP 29.70
FIGURE 3 SPS 9A TEST SECTION LAYOUT
CONNECTICUT ROUTE 2, LOG MILE 25.48-31.72 TOWNS OF COLCHESTER, LEBANON, BOZRAH
9
TABLE 1 STUDY SECTION PARAMETERS
IMAGE #1 - ROUTE 2, BOZRAH/LEBANON TOWN LINE, FACING EAST IN WESTBOUND DIRECTION, SHORTLY AFTER PAVING (SEPTEMBER 1997)
STUDY SECTION DESIGNATION
LTPP SECTION DESIGNATION
TYPE OF PAVEMENT CONNDOT LOG MILEAGE
SECTION LENGTH (MI)
FINAL ASPHALT GRADE DESIRED
EB 1 090901 Class 1 Virgin 25.48-27.48
2.00 AC-20
EB 2 090902 SUPERPAVE Virgin 27.48-29.70
2.22 PG 64-28
EB 3 090903 SUPERPAVE Alternate Virgin
29.70-31.72
2.02 PG 64-22
WB 4 090960 Class 1 RAP 31.72-29.64
2.08 AC-20
WB 5 090961 SUPERPAVE RAP 29.64-27.56
2.08 PG 64-28
WB 6 090962 SUPERPAVE Alternate RAP
27.56-25.48
2.08 PG 64-22
10
IMAGE #2 - ROUTE 2, BOZRAH/LEBANON TOWN LINE, FACING EAST IN EASTBOUND DIRECTION, PAVEMENT AGE 5-1/2 YEARS (JUNE 2003)
middle for monitoring, and 250 feet on each end for extraction of core
samples. The identifiers assigned to the LTPP sections are given in
Table 1 along with the designations used throughout this report for the
research study sections. For example, LTPP section 090901 falls within
section EB 1; LTPP section 090960 within section WB 4.
PAVEMENT MIX DESIGNS
The construction paving contractor, SONECO/Northeastern Inc.,
provided all Quality Control (QC) during production and placement of the
pavement mixes. ConnDOT was responsible for Acceptance (A).
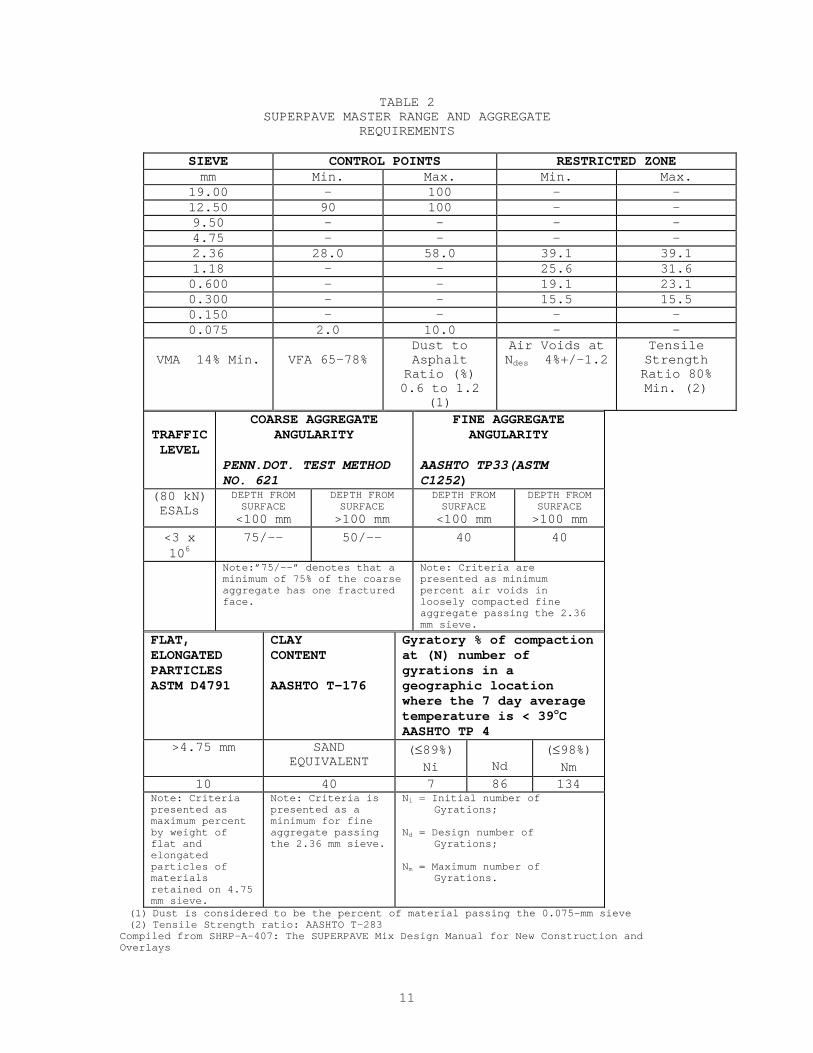
Table 2 shows the master range, aggregate, and void requirements
for the SUPERPAVE mixtures, given in metric units as required at the
time of the contract.
11
TABLE 2 SUPERPAVE MASTER RANGE AND AGGREGATE
REQUIREMENTS
SIEVE CONTROL POINTS RESTRICTED ZONE mm Min. Max. Min. Max.
19.00 - 100 - - 12.50 90 100 - - 9.50 - - - - 4.75 - - - - 2.36 28.0 58.0 39.1 39.1 1.18 - - 25.6 31.6 0.600 - - 19.1 23.1 0.300 - - 15.5 15.5 0.150 - - - - 0.075 2.0 10.0 - -
VMA 14% Min.
VFA 65-78%
Dust to Asphalt Ratio (%) 0.6 to 1.2
(1)
Air Voids at Ndes 4%+/-1.2
Tensile Strength Ratio 80% Min. (2)
TRAFFIC LEVEL
COARSE AGGREGATE ANGULARITY
PENN.DOT. TEST METHOD NO. 621
FINE AGGREGATE ANGULARITY
AASHTO TP33(ASTM C1252)
(80 kN) ESALs
DEPTH FROM SURFACE <100 mm
DEPTH FROM SURFACE >100 mm
DEPTH FROM SURFACE <100 mm
DEPTH FROM SURFACE >100 mm
<3 x 10⁶
75/-- 50/-- 40 40
Note:”75/--” denotes that a minimum of 75% of the coarse aggregate has one fractured face.
Note: Criteria are presented as minimum percent air voids in loosely compacted fine aggregate passing the 2.36 mm sieve.
FLAT, ELONGATED PARTICLES ASTM D4791
CLAY CONTENT AASHTO T-176
Gyratory % of compaction at (N) number of gyrations in a geographic location where the 7 day average temperature is < 39oC AASHTO TP 4
>4.75 mm SAND EQUIVALENT
(≤89%) Ni
Nd
(≤98%) Nm
10 40 7 86 134 Note: Criteria presented as maximum percent by weight of flat and elongated particles of materials retained on 4.75 mm sieve.
Note: Criteria is presented as a minimum for fine aggregate passing the 2.36 mm sieve.
Ni = Initial number of Gyrations; Nd = Design number of Gyrations; Nm = Maximum number of Gyrations.
(1) Dust is considered to be the percent of material passing the 0.075-mm sieve (2) Tensile Strength ratio: AASHTO T-283
Compiled from SHRP-A-407: The SUPERPAVE Mix Design Manual for New Construction and Overlays
12
The Connecticut Advanced Pavement Laboratory (CAP Lab) at the
University of Connecticut, under contract to SONECO, was responsible for
the pavement mix design. Their designs were based upon a maximum
average 7-day air temperature of less than 102oF, a traffic level of
less than 3 million 80-kN ESALs, and Gyratory Mix Compaction of Ni = 7,
Nd = 86, and Nm = 134 as defined in Table 2. The weather data used for
the design was obtained from National Weather Service records for
Colchester, Connecticut. The selected PG asphalts of 64-28 and 64-22
provided 98 percent and 50 percent reliability for the low temperatures.
For the high temperatures, the PG 64 asphalt approaches 100 percent
reliability, while PG 58 would have provided 98 percent reliability.
For the virgin sections, the requested binders, namely AC-20, PG 64-28,
and PG 64-22 were used. However, for the RAP designs, the binders used
were AC-10 for the Class 1 mix, PG 58-34 for the SUPERPAVE RAP section,
and PG 58-28 for the Alternate SUPERPAVE RAP section. These PG binders
were selected to offset the aging effects of the existing asphalt binder
already attached to the RAP. All asphalt cement was supplied and
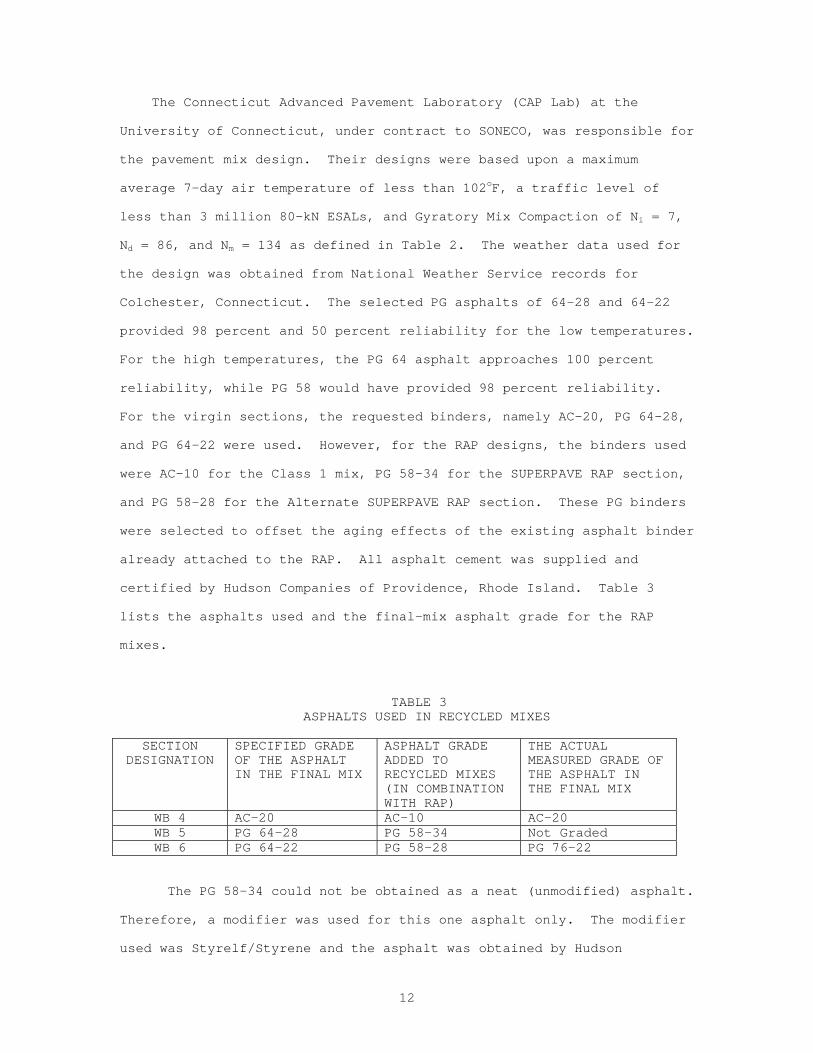
certified by Hudson Companies of Providence, Rhode Island. Table 3
lists the asphalts used and the final-mix asphalt grade for the RAP
mixes.
TABLE 3 ASPHALTS USED IN RECYCLED MIXES
SECTION DESIGNATION
SPECIFIED GRADE OF THE ASPHALT IN THE FINAL MIX
ASPHALT GRADE ADDED TO RECYCLED MIXES (IN COMBINATION WITH RAP)
THE ACTUAL MEASURED GRADE OF THE ASPHALT IN THE FINAL MIX
WB 4 AC-20 AC-10 AC-20 WB 5 PG 64-28 PG 58-34 Not Graded WB 6 PG 64-22 PG 58-28 PG 76-22
The PG 58-34 could not be obtained as a neat (unmodified) asphalt.
Therefore, a modifier was used for this one asphalt only. The modifier
used was Styrelf/Styrene and the asphalt was obtained by Hudson
13
Companies from Petro-Canada in Toronto, Ontario. It was determined that
this product would increase the cost of the two miles of pavement in
Section WB 5 by as much as $60,000(US). This cost increase was not
anticipated or approved by ConnDOT. Therefore, a compromise was reached
to pave only one day with the more expensive asphalt, and to use the PG
58-28, as in Section WB 6, for the rest of Section WB 5. The
construction project stations where PG 58-34 was used were from station
160+20 to 192+60 (log mile 28.69-28.07) westbound, which is a length of
3240 feet. The 1000-ft monitoring section for WB 5 (LTPP section
090961) is located within this area.
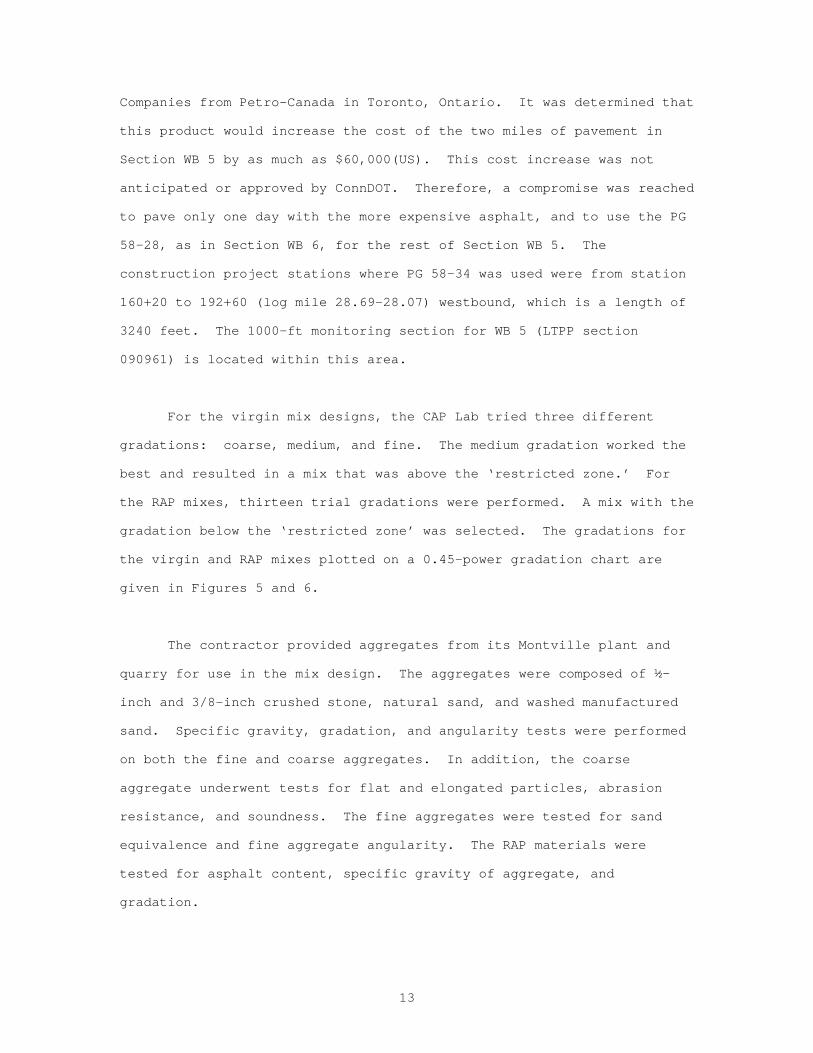
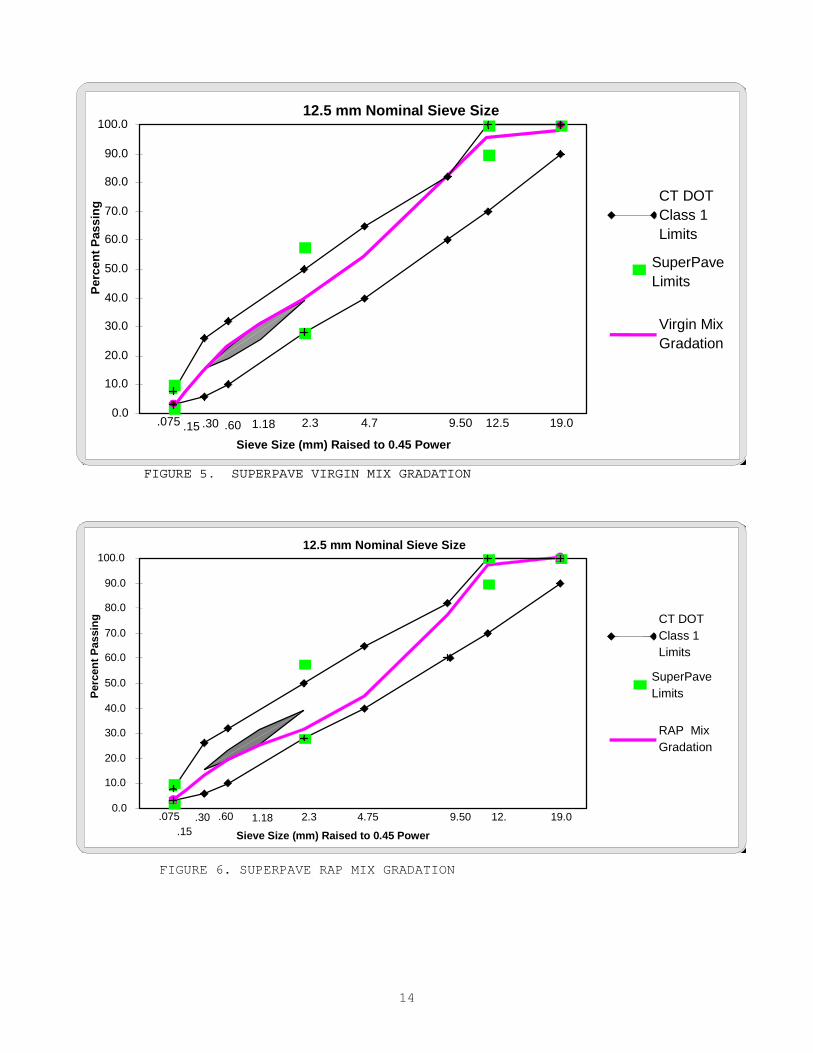
For the virgin mix designs, the CAP Lab tried three different
gradations: coarse, medium, and fine. The medium gradation worked the
best and resulted in a mix that was above the ‘restricted zone.’ For
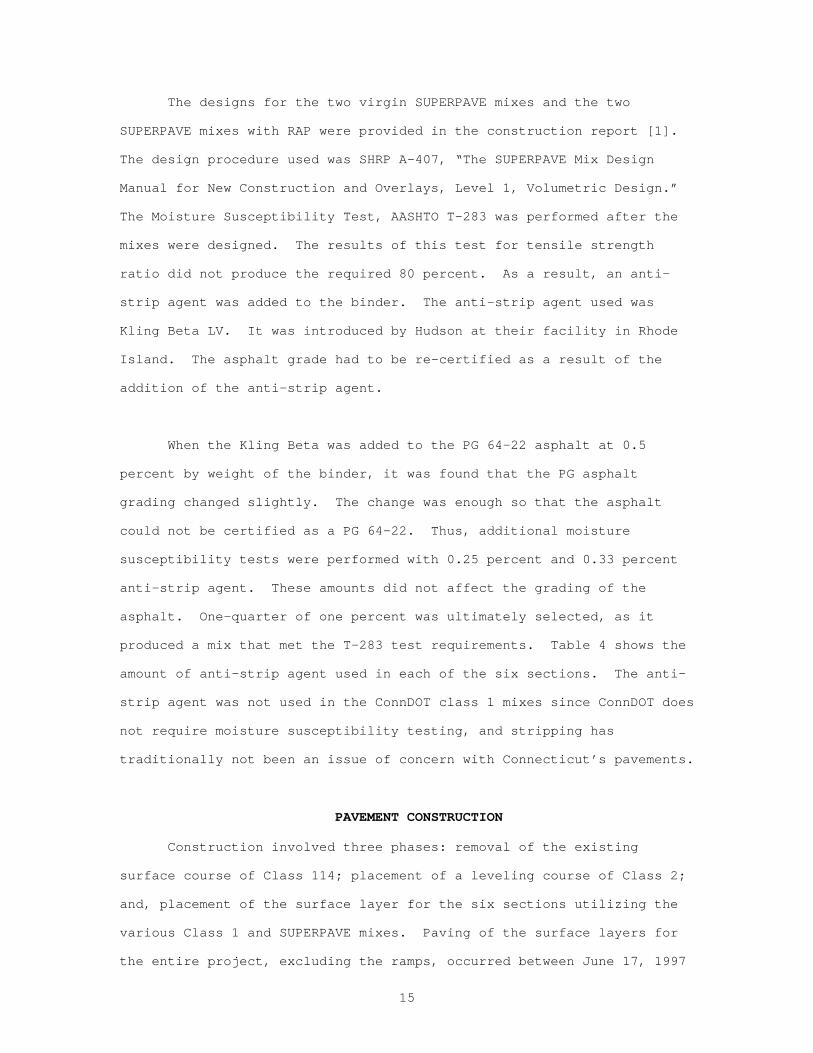
the RAP mixes, thirteen trial gradations were performed. A mix with the
gradation below the ‘restricted zone’ was selected. The gradations for
the virgin and RAP mixes plotted on a 0.45-power gradation chart are
given in Figures 5 and 6.
The contractor provided aggregates from its Montville plant and
quarry for use in the mix design. The aggregates were composed of ½-
inch and 3/8-inch crushed stone, natural sand, and washed manufactured
sand. Specific gravity, gradation, and angularity tests were performed
on both the fine and coarse aggregates. In addition, the coarse
aggregate underwent tests for flat and elongated particles, abrasion
resistance, and soundness. The fine aggregates were tested for sand
equivalence and fine aggregate angularity. The RAP materials were
tested for asphalt content, specific gravity of aggregate, and
gradation.
14
FIGURE 5. SUPERPAVE VIRGIN MIX GRADATION
FIGURE 6. SUPERPAVE RAP MIX GRADATION
FIGURE 6. SUPERPAVE RAP MIX GRADATION
12.5 mm Nominal Sieve Size
0.0
10.0
20.0
30.0
40.0
50.0
60.0
70.0
80.0
90.0
100.0
Sieve Size (mm) Raised to 0.45 Power
Perc
ent P
assi
ng
.075 1.18 .60 .30 .15
2.3 4.75 9.50 12. 19.0
CT DOT Class 1 Limits
SuperPave Limits
RAP Mix Gradation
12.5 mm Nominal Sieve Size
0.0
10.0
20.0
30.0
40.0
50.0
60.0
70.0
80.0
90.0
100.0
Sieve Size (mm) Raised to 0.45 Power
Perc
ent P
assi
ng
.075 1.18 .60 .30 .15 2.3 4.7 9.50 12.5 19.0
CT DOT Class 1 Limits
SuperPave Limits
Virgin Mix Gradation
15
The designs for the two virgin SUPERPAVE mixes and the two
SUPERPAVE mixes with RAP were provided in the construction report [1].
The design procedure used was SHRP A-407, “The SUPERPAVE Mix Design
Manual for New Construction and Overlays, Level 1, Volumetric Design.”
The Moisture Susceptibility Test, AASHTO T-283 was performed after the
mixes were designed. The results of this test for tensile strength
ratio did not produce the required 80 percent. As a result, an anti-
strip agent was added to the binder. The anti-strip agent used was
Kling Beta LV. It was introduced by Hudson at their facility in Rhode
Island. The asphalt grade had to be re-certified as a result of the
addition of the anti-strip agent.
When the Kling Beta was added to the PG 64-22 asphalt at 0.5
percent by weight of the binder, it was found that the PG asphalt
grading changed slightly. The change was enough so that the asphalt
could not be certified as a PG 64-22. Thus, additional moisture
susceptibility tests were performed with 0.25 percent and 0.33 percent
anti-strip agent. These amounts did not affect the grading of the
asphalt. One-quarter of one percent was ultimately selected, as it
produced a mix that met the T-283 test requirements. Table 4 shows the
amount of anti-strip agent used in each of the six sections. The anti-
strip agent was not used in the ConnDOT class 1 mixes since ConnDOT does
not require moisture susceptibility testing, and stripping has
traditionally not been an issue of concern with Connecticut’s pavements.
PAVEMENT CONSTRUCTION
Construction involved three phases: removal of the existing
surface course of Class 114; placement of a leveling course of Class 2;
and, placement of the surface layer for the six sections utilizing the
various Class 1 and SUPERPAVE mixes. Paving of the surface layers for
the entire project, excluding the ramps, occurred between June 17, 1997
16
TABLE 4 PERCENTAGE OF ANTI-STRIP AGENT USED IN EACH MIX
SECTION DESIGNATION TYPE OF PAVEMENT PERCENT OF ANTI-STRIP AGENT USED
EB 1 Class 1 Virgin * 0 EB 2 SUPERPAVE Virgin 0.25 EB 3 SUPERPAVE Alternate
Virgin 0.25
WB 4 Class 1 RAP * 0 WB 5** SUPERPAVE RAP 0.375 WB 6 SUPERPAVE Alternate
RAP 0.375
*AASHTO T-283 not required by ConnDOT for HMA mixes. ** Most of Section WB 5 used the same mix as section WB 6; only 3240 ft, including the 1000 ft LTPP monitoring section, contained the PG 58-34 with modifier.
and September 9, 1997. Paving of the 1000-ft monitoring sections was
performed on the dates indicated in Table 5. Paving was generally
performed from left to right (i.e., left shoulder and high speed lane in
the first pass, low-speed lane in the second pass, and right shoulder in
the third pass.) This resulted in paving widths of approximately 14 ft,
13 ft, and 11-15 ft, for each pass, respectively.
TABLE 5 DATE AND WEATHER CONDITIONS AT TIME OF PAVING
THE 1000-FT LTPP MONITORING SECTIONS
SPS9A LTPP SECTION DESIGNATION
TYPE OF SURFACE PAVEMENT
DATE PAVING OCCURRED
AIR TEMPERATURE AND WEATHER
090901 Class 1 Virgin 06/23/97 80°F, Sunny 090902 SUPERPAVE Virgin 07/15/97 90°F, Sunny 090903 SUPERPAVE Alternate
Virgin 06/28/97 80°F, Sunny
090960 Class 1 RAP 08/07/97 73°F, Sunny 090961 SUPERPAVE RAP 09/08/97 65°F, Cloudy 090962 SUPERPAVE Alternate
RAP 08/12/97 73°F, Cloudy
Table 6 contains other pertinent information about the surface-
layer paving for each 1000-ft monitoring section. Included in the
Table, is pavement temperature immediately behind the paver, type of
rollers used, asphalt modifiers (other than anti-strip agents), asphalt
17
content, air voids, voids in the mineral aggregate (VMA), and percent
maximum theoretical density achieved in the field.
TABLE 6 SUMMARY OF MIXTURE LAYDOWN DATA
LTPP SECTION
MODIFIER PERCENT ASPHALT
AIR VOIDS
VMA FIELD DENSITY (PERCENT MAXIMUM
THEORETICAL)
MAT TEMP.
OF BEHIND PAVER
BREAKDOWN ROLLER
INTERMEDIATE ROLLER
FINAL ROLLER
090901 None 5.4 4.4 16.8 92.8 270-315
Hyster C766A
None Hyster C350C
090902 None 5.3 3.6 14.4 93.3 240-295
Hyster C766A
None Hyster C350C
090903 None 5.3 3.3 13.7 92.7 270-285
Hyster C766A
None Hyster C350C
090960 None 5.0 2.8 13.9 92.9 265-280
Hyster C766A
None Hyster C350C
090961 Styrelf 4.8 4.8 14.9 92.1 300-325
Hyster C766A
Caterpiller CB-614
Hyster C350C
090962 None 5.0 4.8 15.5 91.0 275-280
Hyster C766A
None Hyster C350C
In Section WB 4, there were a couple of areas where the surface
layer was removed and replaced within a few days of paving. These
occurred between construction project stations 63+90 to 64+68 (log mile
30.51-30.49) in the low-speed lane and between station 89+38 to 90+38
(log mile 30.03-30.01) in the high speed lane. These areas were not
within the 1000-ft LTPP monitoring sections. The reason for removal was
lack of density and immediate raveling. There appeared to be uncoated
material and/or RAP material not homogeneously mixed with virgin
material, delivered from two trucks.
PERFORMANCE DATA COLLECTION
“Pre-construction” data, i.e., data collected prior to the
Superpave construction, (material samples, tests, and road condition
measurements) were collected during September 1996 and April 1997, as
indicated in Table 7. These data were collected primarily for the LTPP
study for entry into the LTPP database.
18
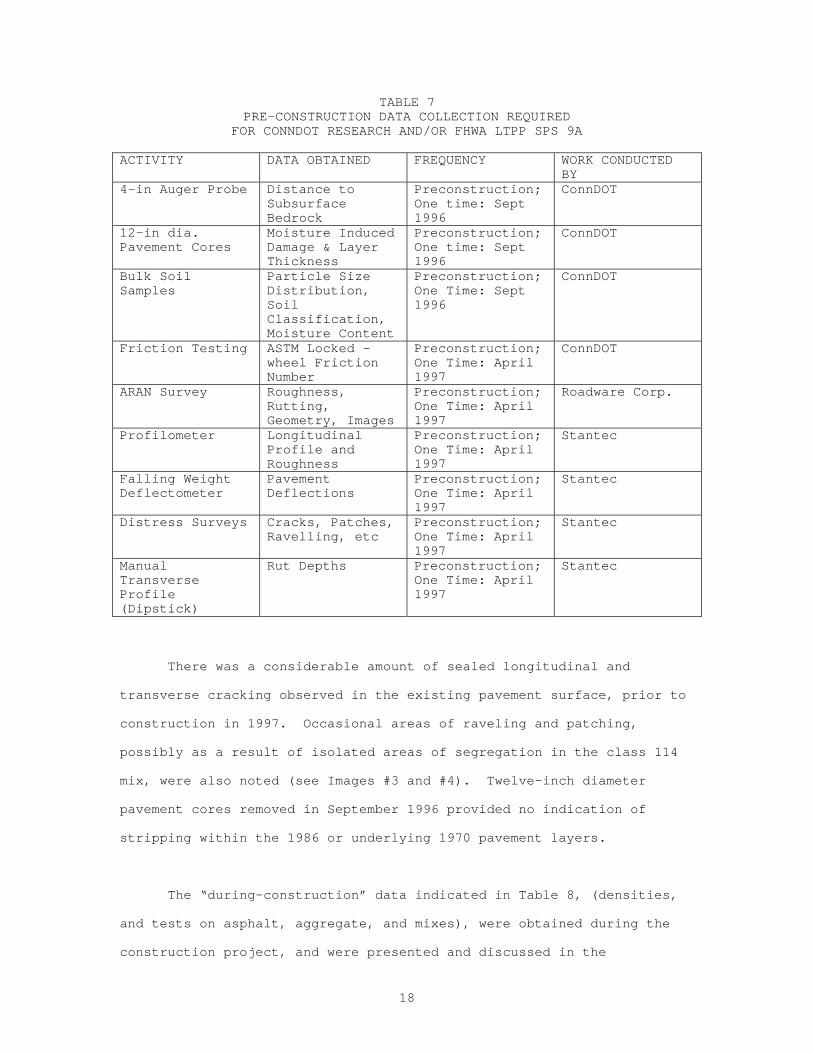
TABLE 7 PRE-CONSTRUCTION DATA COLLECTION REQUIRED
FOR CONNDOT RESEARCH AND/OR FHWA LTPP SPS 9A
ACTIVITY DATA OBTAINED FREQUENCY WORK CONDUCTED BY
4-in Auger Probe Distance to Subsurface Bedrock
Preconstruction; One time: Sept 1996
ConnDOT
12-in dia. Pavement Cores
Moisture Induced Damage & Layer Thickness
Preconstruction; One time: Sept 1996
ConnDOT
Bulk Soil Samples
Particle Size Distribution, Soil Classification, Moisture Content
Preconstruction; One Time: Sept 1996
ConnDOT
Friction Testing ASTM Locked –wheel Friction Number
Preconstruction; One Time: April 1997
ConnDOT
ARAN Survey Roughness, Rutting, Geometry, Images
Preconstruction; One Time: April 1997
Roadware Corp.
Profilometer Longitudinal Profile and Roughness
Preconstruction; One Time: April 1997
Stantec
Falling Weight Deflectometer
Pavement Deflections
Preconstruction; One Time: April 1997
Stantec
Distress Surveys Cracks, Patches, Ravelling, etc
Preconstruction; One Time: April 1997
Stantec
Manual Transverse Profile (Dipstick)
Rut Depths Preconstruction; One Time: April 1997
Stantec
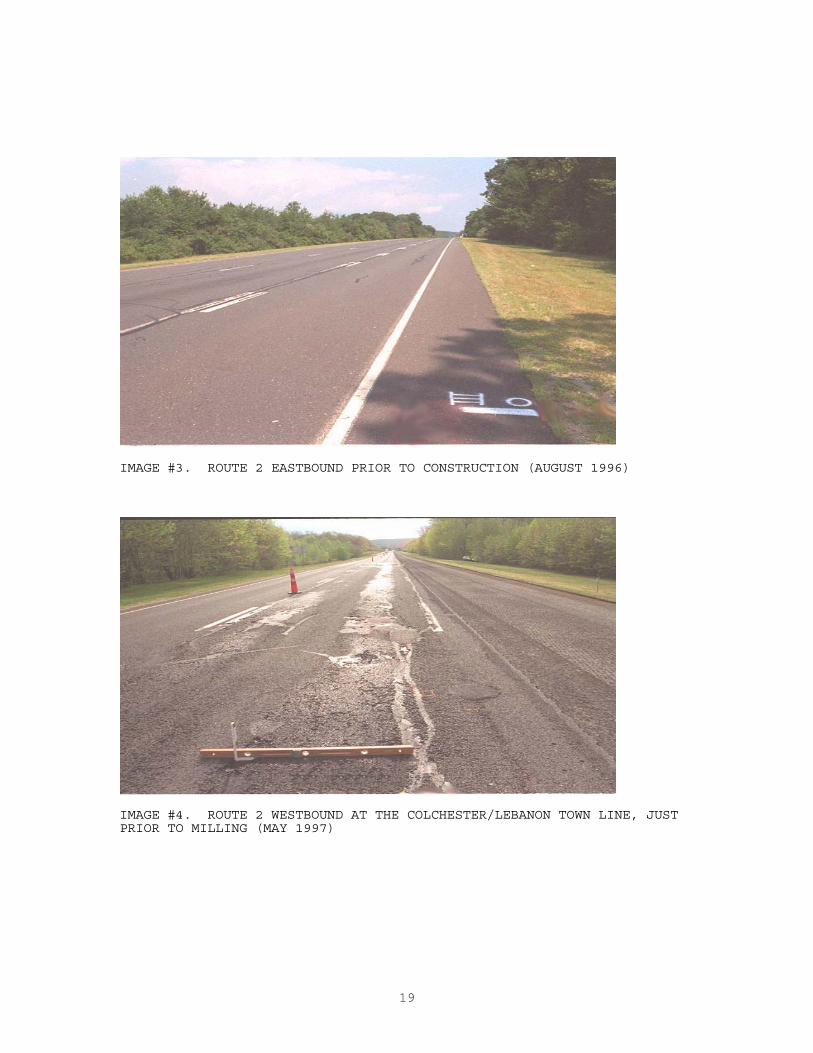
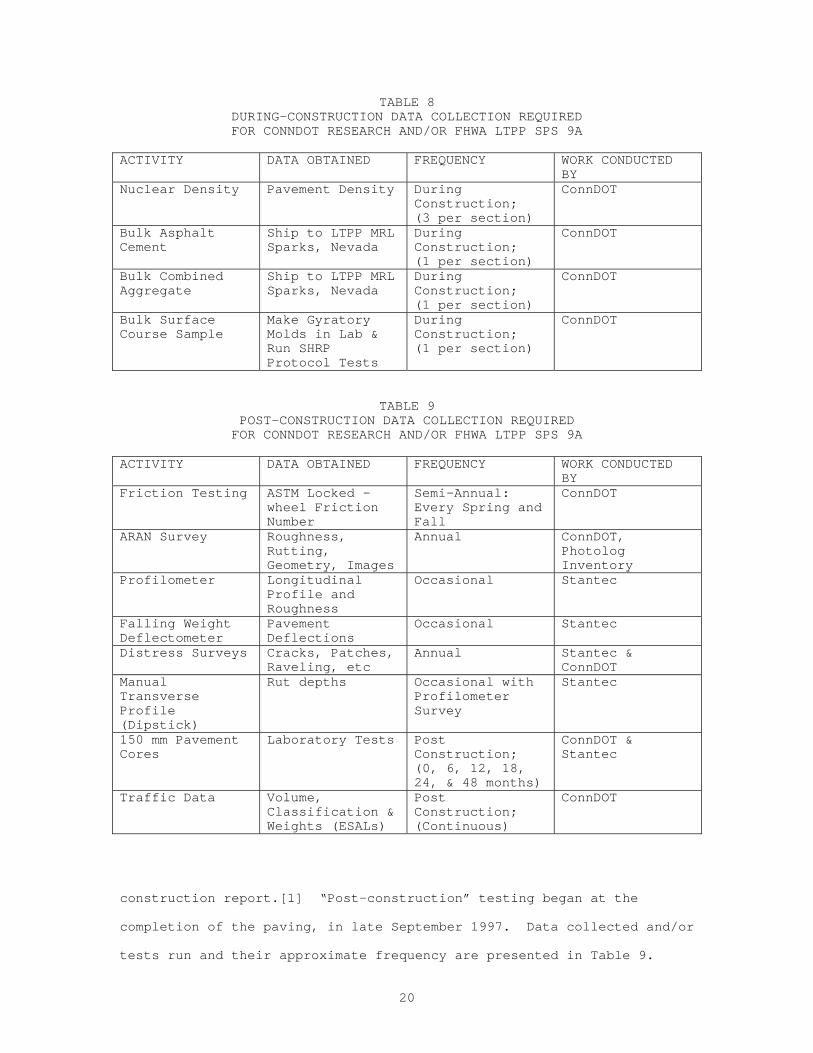
There was a considerable amount of sealed longitudinal and
transverse cracking observed in the existing pavement surface, prior to
construction in 1997. Occasional areas of raveling and patching,
possibly as a result of isolated areas of segregation in the class 114
mix, were also noted (see Images #3 and #4). Twelve-inch diameter
pavement cores removed in September 1996 provided no indication of
stripping within the 1986 or underlying 1970 pavement layers.
The “during-construction” data indicated in Table 8, (densities,
and tests on asphalt, aggregate, and mixes), were obtained during the
construction project, and were presented and discussed in the
19
IMAGE #3. ROUTE 2 EASTBOUND PRIOR TO CONSTRUCTION (AUGUST 1996)
IMAGE #4. ROUTE 2 WESTBOUND AT THE COLCHESTER/LEBANON TOWN LINE, JUST PRIOR TO MILLING (MAY 1997)
20
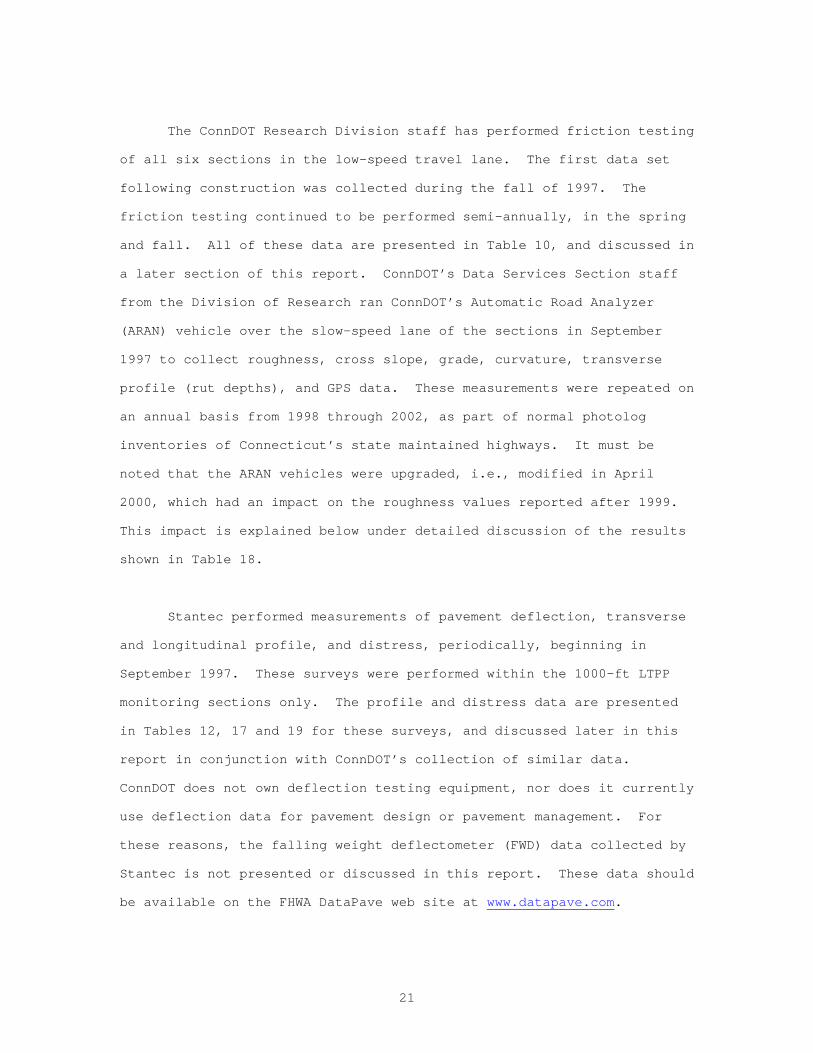
TABLE 8 DURING-CONSTRUCTION DATA COLLECTION REQUIRED FOR CONNDOT RESEARCH AND/OR FHWA LTPP SPS 9A
ACTIVITY DATA OBTAINED FREQUENCY WORK CONDUCTED
BY Nuclear Density Pavement Density During
Construction; (3 per section)
ConnDOT
Bulk Asphalt Cement
Ship to LTPP MRL Sparks, Nevada
During Construction; (1 per section)
ConnDOT
Bulk Combined Aggregate
Ship to LTPP MRL Sparks, Nevada
During Construction; (1 per section)
ConnDOT
Bulk Surface Course Sample
Make Gyratory Molds in Lab & Run SHRP Protocol Tests
During Construction; (1 per section)
ConnDOT
TABLE 9 POST-CONSTRUCTION DATA COLLECTION REQUIRED FOR CONNDOT RESEARCH AND/OR FHWA LTPP SPS 9A
ACTIVITY DATA OBTAINED FREQUENCY WORK CONDUCTED
BY Friction Testing ASTM Locked –
wheel Friction Number
Semi-Annual: Every Spring and Fall
ConnDOT
ARAN Survey Roughness, Rutting, Geometry, Images
Annual ConnDOT, Photolog Inventory
Profilometer Longitudinal Profile and Roughness
Occasional Stantec
Falling Weight Deflectometer
Pavement Deflections
Occasional Stantec
Distress Surveys Cracks, Patches, Raveling, etc
Annual Stantec & ConnDOT
Manual Transverse Profile (Dipstick)
Rut depths Occasional with Profilometer Survey
Stantec
150 mm Pavement Cores
Laboratory Tests Post Construction; (0, 6, 12, 18, 24, & 48 months)
ConnDOT & Stantec
Traffic Data Volume, Classification & Weights (ESALs)
Post Construction; (Continuous)
ConnDOT
construction report.[1] “Post-construction” testing began at the
completion of the paving, in late September 1997. Data collected and/or
tests run and their approximate frequency are presented in Table 9.
21
The ConnDOT Research Division staff has performed friction testing
of all six sections in the low-speed travel lane. The first data set
following construction was collected during the fall of 1997. The
friction testing continued to be performed semi-annually, in the spring
and fall. All of these data are presented in Table 10, and discussed in
a later section of this report. ConnDOT’s Data Services Section staff
from the Division of Research ran ConnDOT’s Automatic Road Analyzer
(ARAN) vehicle over the slow-speed lane of the sections in September
1997 to collect roughness, cross slope, grade, curvature, transverse
profile (rut depths), and GPS data. These measurements were repeated on
an annual basis from 1998 through 2002, as part of normal photolog
inventories of Connecticut’s state maintained highways. It must be
noted that the ARAN vehicles were upgraded, i.e., modified in April
2000, which had an impact on the roughness values reported after 1999.
This impact is explained below under detailed discussion of the results
shown in Table 18.
Stantec performed measurements of pavement deflection, transverse
and longitudinal profile, and distress, periodically, beginning in
September 1997. These surveys were performed within the 1000-ft LTPP
monitoring sections only. The profile and distress data are presented
in Tables 12, 17 and 19 for these surveys, and discussed later in this
report in conjunction with ConnDOT’s collection of similar data.
ConnDOT does not own deflection testing equipment, nor does it currently
use deflection data for pavement design or pavement management. For
these reasons, the falling weight deflectometer (FWD) data collected by
Stantec is not presented or discussed in this report. These data should
be available on the FHWA DataPave web site at www.datapave.com.
22
Six-inch diameter pavement cores were obtained by ConnDOT on a
predetermined schedule, at times of 0, 6, 12, 18, 24, and 48 months
after construction. These sampling intervals were prescribed by the
FHWA LTPP program. ConnDOT’s Division of Materials Testing staff tested
the cores for pavement thickness, bulk specific gravity, maximum
specific gravity, asphalt content, aggregate gradation, air voids, voids
filled with asphalt (VFA), and VMA. The recovered asphalt was tested
for penetration, viscosity, dynamic shear, and creep stiffness. All
tests performed were required (and specified) by the LTPP program. All
test results were submitted to the LTPP contractor on their designated
LTPP forms.
Shortly after completion of construction, a weigh-in-motion (WIM)
system was installed in both directions of Route 2, in all lanes, just
west of the overpass with Camp Moween Road in Lebanon (milepoint 29.61),
in the vicinity of the junctions of sections EB 2 and EB 3 eastbound,
and sections WB 4 and WB 5 westbound. The automated WIM station was
installed to collect continuous traffic volumes, classifications, and
axle and gross vehicle weights. These data were and continue to be
reported to LTPP on a quarterly basis. They have been collected,
calibrated, and validated according to LTPP protocols for traffic data
collection.
At the same time as the WIM installation, a roadway weather
information system (RWIS) was installed in the median of Route 2 at the
location of the WIM system. Orginally, the weather station was a
requirement for the LTPP SPS9A Superpave study. However, at about the
time of installation the requirement was changed, as the FHWA decided to
go to a virtual weather system where multiple weather station sites are
averaged together. The RWIS then became part of a network of RWIS sites
23
for winter storm operations, maintained by ConnDOT’s Office of
Maintenance.
In addition to the distress surveys performed by Stantec for the
LTPP sections, ConnDOT research staff performed manual surveys on three
occasions. In addition, the Wisecrax software from the ARAN survey was
used on another occasion, for the full 24 lane-miles of the study
sections. The data collected during the final survey in March 2003 are
presented in Tables 13 to 15 and discussed later.
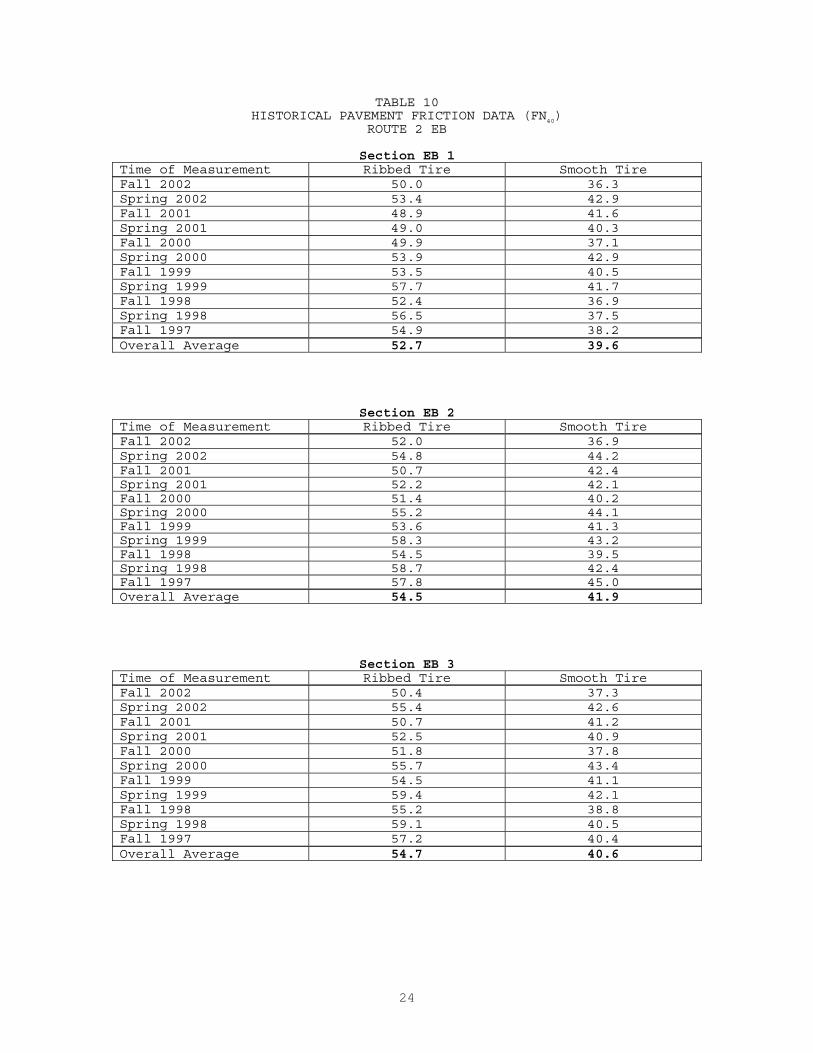
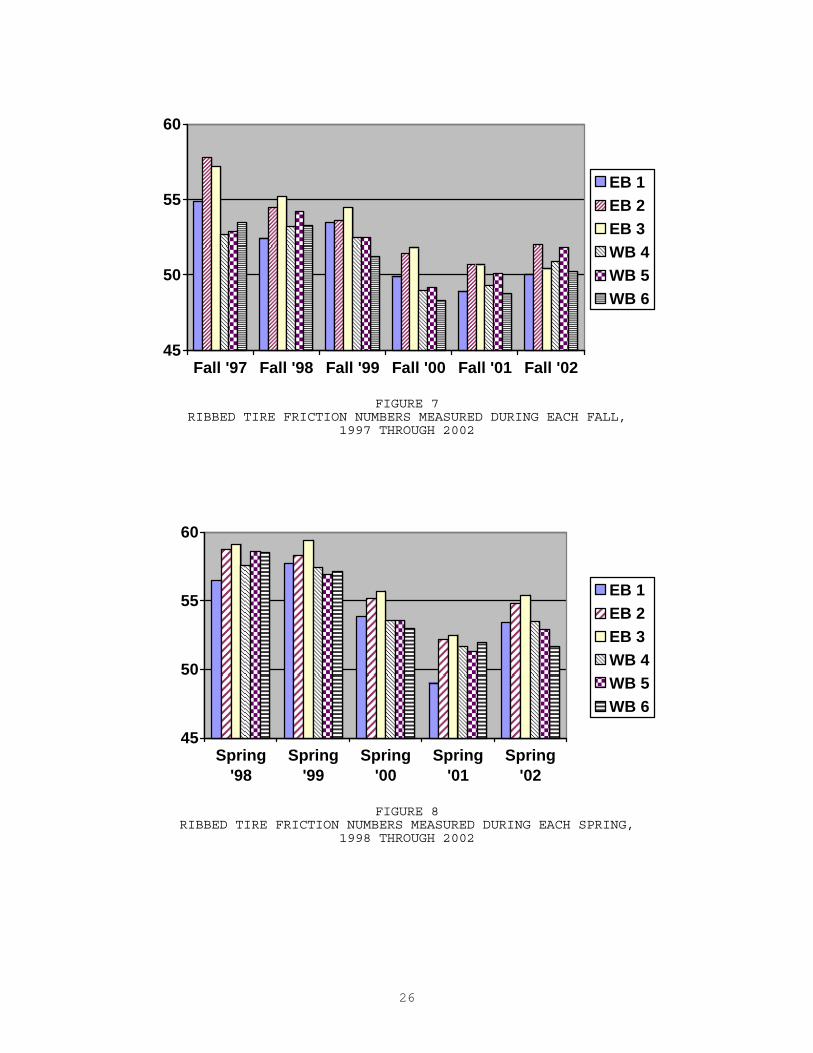
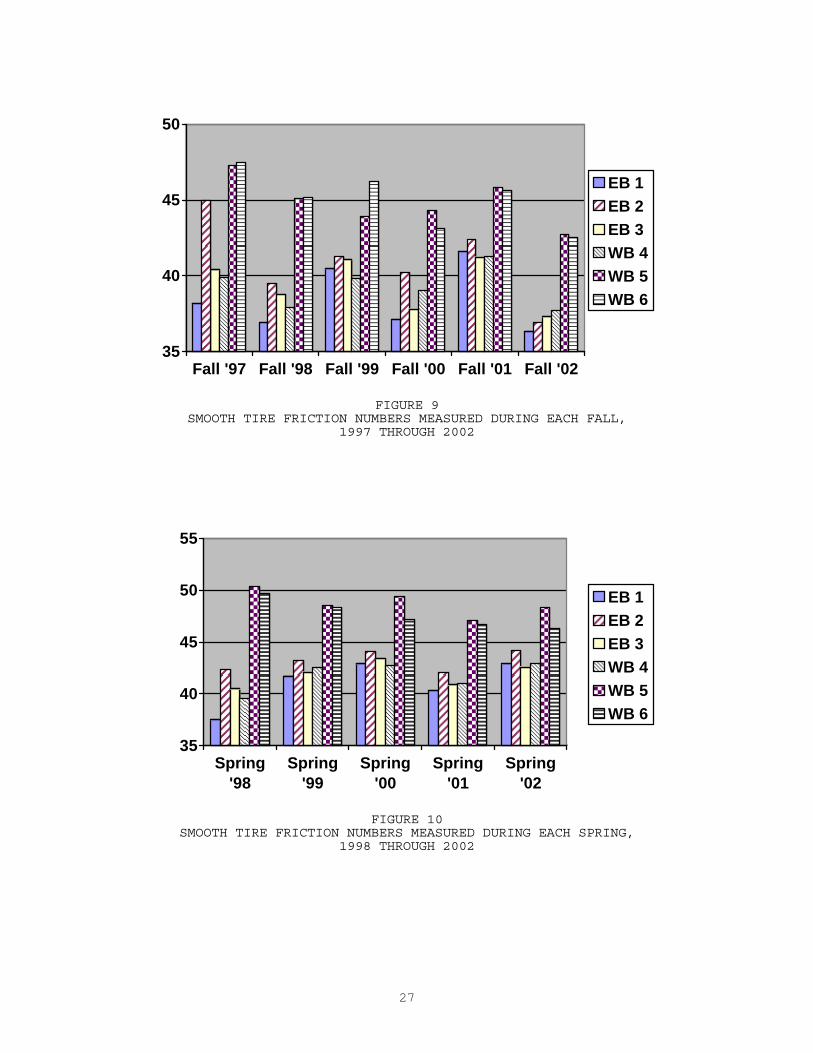
Friction Tests
Friction testing was performed semi-annually each spring and fall,
from September 1997 through October 2002. The ASTM E-501 ribbed and
ASTM E-524 smooth tires were used for these measurements. All sections
were tested at ¼-mile increments in the low-speed lane, resulting in
approximately eight tests per section, per tire. The average values
reported as FN40 are presented in Table 10. All data were collected at
40 mph, in accordance with ASTM E-274 test method, using the ConnDOT
pavement friction tester, which meets the same ASTM standard. The data
represent the coefficient of friction multiplied by 100, measured under
wet conditions. The ribbed tire measurements are indicative of the
microtexture of the pavement surface, whereas the smooth tire
measurements are representative of the macrotexture.
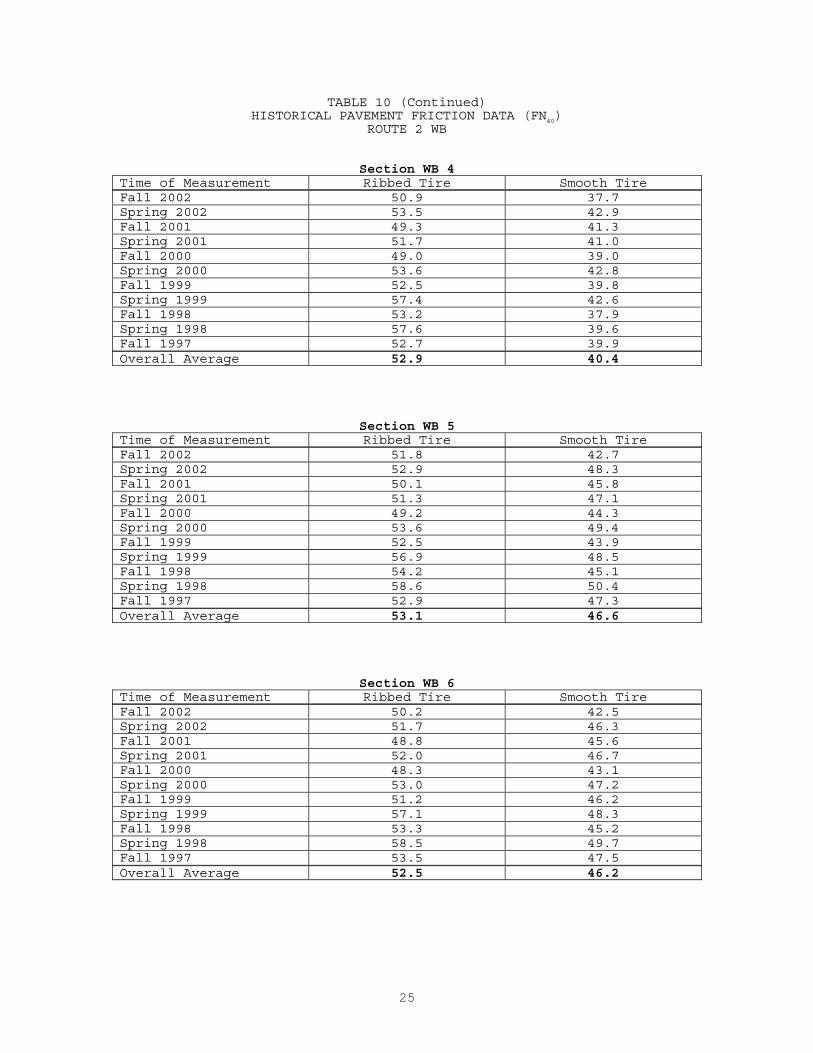
All data presented in Table 10 indicate an acceptable friction
level has existed throughout the five years of study. Overall, the
reduction in friction number over time has been minimal. These data are
also plotted in Figures 7 through 10 to show the trends over time. The
smooth-tire friction numbers indicate that during the five years there
24
TABLE 10 HISTORICAL PAVEMENT FRICTION DATA (FN40)
ROUTE 2 EB
Section EB 1 Time of Measurement Ribbed Tire Smooth Tire Fall 2002 50.0 36.3 Spring 2002 53.4 42.9 Fall 2001 48.9 41.6 Spring 2001 49.0 40.3 Fall 2000 49.9 37.1 Spring 2000 53.9 42.9 Fall 1999 53.5 40.5 Spring 1999 57.7 41.7 Fall 1998 52.4 36.9 Spring 1998 56.5 37.5 Fall 1997 54.9 38.2 Overall Average 52.7 39.6
Section EB 2 Time of Measurement Ribbed Tire Smooth Tire Fall 2002 52.0 36.9 Spring 2002 54.8 44.2 Fall 2001 50.7 42.4 Spring 2001 52.2 42.1 Fall 2000 51.4 40.2 Spring 2000 55.2 44.1 Fall 1999 53.6 41.3 Spring 1999 58.3 43.2 Fall 1998 54.5 39.5 Spring 1998 58.7 42.4 Fall 1997 57.8 45.0 Overall Average 54.5 41.9
Section EB 3 Time of Measurement Ribbed Tire Smooth Tire Fall 2002 50.4 37.3 Spring 2002 55.4 42.6 Fall 2001 50.7 41.2 Spring 2001 52.5 40.9 Fall 2000 51.8 37.8 Spring 2000 55.7 43.4 Fall 1999 54.5 41.1 Spring 1999 59.4 42.1 Fall 1998 55.2 38.8 Spring 1998 59.1 40.5 Fall 1997 57.2 40.4 Overall Average 54.7 40.6
25
TABLE 10 (Continued) HISTORICAL PAVEMENT FRICTION DATA (FN40)
ROUTE 2 WB
Section WB 4 Time of Measurement Ribbed Tire Smooth Tire Fall 2002 50.9 37.7 Spring 2002 53.5 42.9 Fall 2001 49.3 41.3 Spring 2001 51.7 41.0 Fall 2000 49.0 39.0 Spring 2000 53.6 42.8 Fall 1999 52.5 39.8 Spring 1999 57.4 42.6 Fall 1998 53.2 37.9 Spring 1998 57.6 39.6 Fall 1997 52.7 39.9 Overall Average 52.9 40.4
Section WB 5 Time of Measurement Ribbed Tire Smooth Tire Fall 2002 51.8 42.7 Spring 2002 52.9 48.3 Fall 2001 50.1 45.8 Spring 2001 51.3 47.1 Fall 2000 49.2 44.3 Spring 2000 53.6 49.4 Fall 1999 52.5 43.9 Spring 1999 56.9 48.5 Fall 1998 54.2 45.1 Spring 1998 58.6 50.4 Fall 1997 52.9 47.3 Overall Average 53.1 46.6
Section WB 6 Time of Measurement Ribbed Tire Smooth Tire Fall 2002 50.2 42.5 Spring 2002 51.7 46.3 Fall 2001 48.8 45.6 Spring 2001 52.0 46.7 Fall 2000 48.3 43.1 Spring 2000 53.0 47.2 Fall 1999 51.2 46.2 Spring 1999 57.1 48.3 Fall 1998 53.3 45.2 Spring 1998 58.5 49.7 Fall 1997 53.5 47.5 Overall Average 52.5 46.2
26
45
50
55
60
Fall '97 Fall '98 Fall '99 Fall '00 Fall '01 Fall '02
EB 1EB 2EB 3WB 4WB 5WB 6
FIGURE 7
RIBBED TIRE FRICTION NUMBERS MEASURED DURING EACH FALL, 1997 THROUGH 2002
45
50
55
60
Spring'98
Spring'99
Spring'00
Spring'01
Spring'02
EB 1EB 2EB 3WB 4WB 5WB 6
FIGURE 8
RIBBED TIRE FRICTION NUMBERS MEASURED DURING EACH SPRING, 1998 THROUGH 2002
27
35
40
45
50
Fall '97 Fall '98 Fall '99 Fall '00 Fall '01 Fall '02
EB 1EB 2EB 3WB 4WB 5WB 6
FIGURE 9
SMOOTH TIRE FRICTION NUMBERS MEASURED DURING EACH FALL, 1997 THROUGH 2002
35
40
45
50
55
Spring'98
Spring'99
Spring'00
Spring'01
Spring'02
EB 1EB 2EB 3WB 4WB 5WB 6
FIGURE 10
SMOOTH TIRE FRICTION NUMBERS MEASURED DURING EACH SPRING, 1998 THROUGH 2002
28
should have been no potential for hydroplaning in any of the sections.
Thus far, an approximate variation of 8-9 FN40 in five years has been
measured on average for ribbed-tire tests, and 5-8 FN40, for smooth-tire
tests. Much of this variation has been seasonal, possibly due to winter
weather variations and the resultant varying amounts of abrasives
applied to the pavements from year to year.
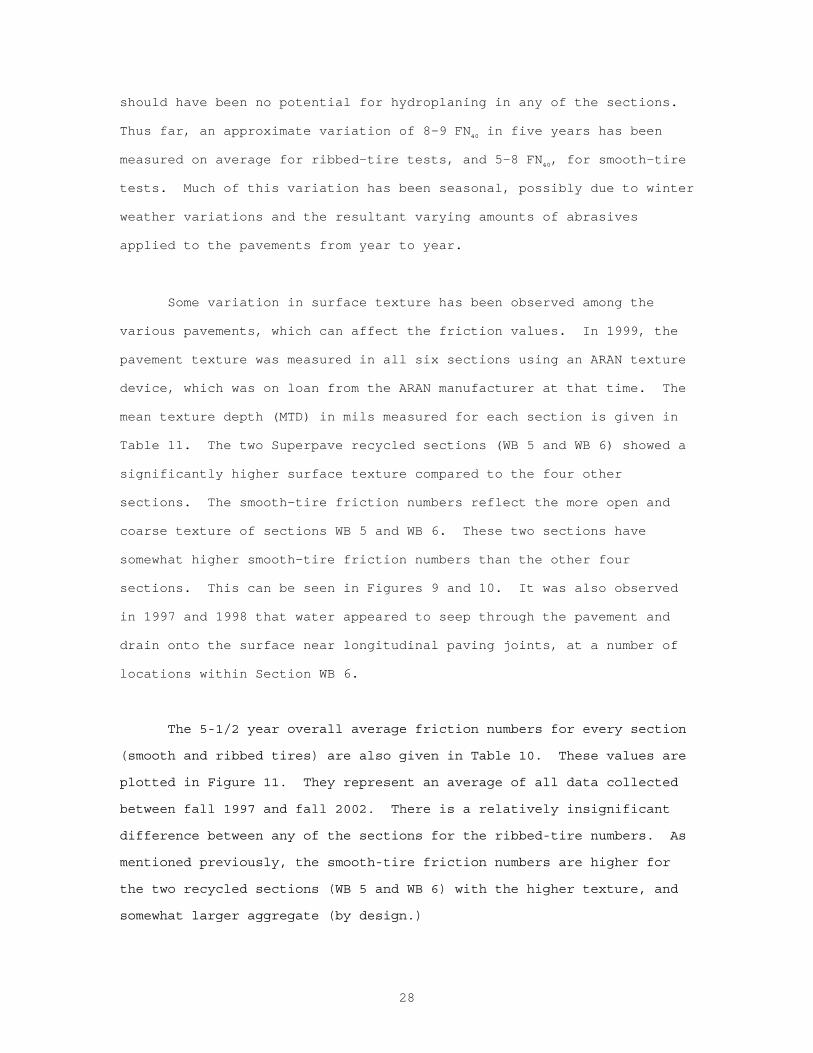
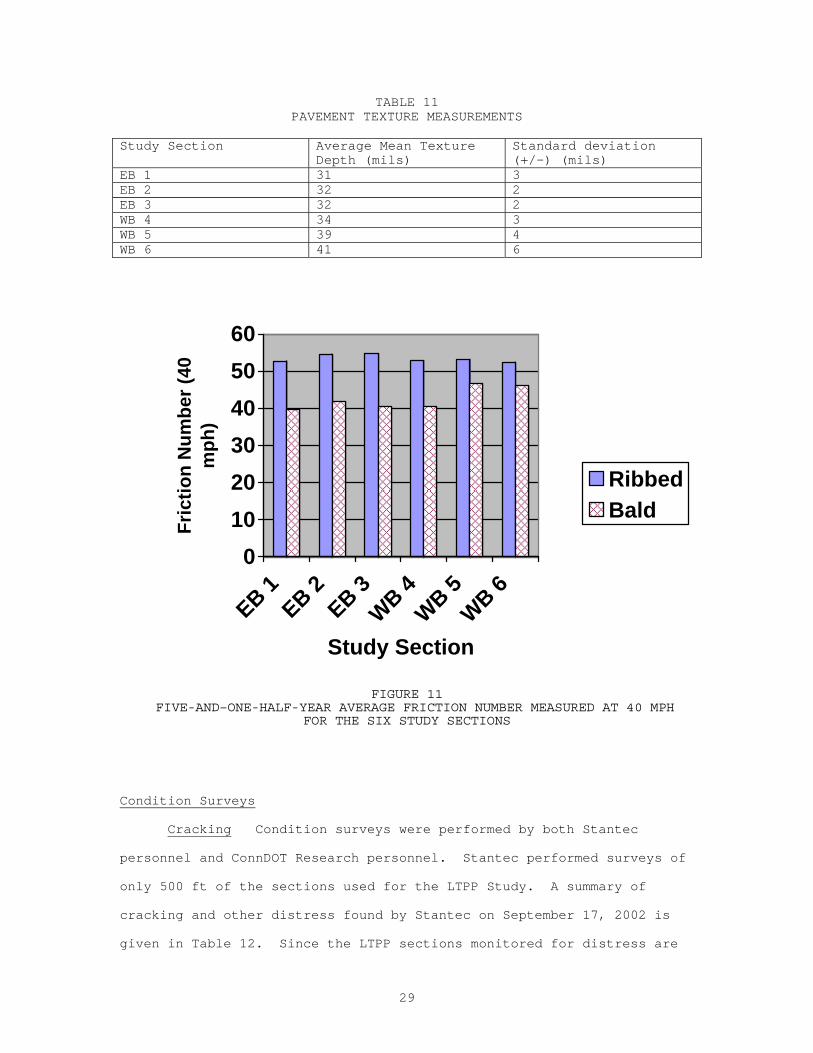
Some variation in surface texture has been observed among the
various pavements, which can affect the friction values. In 1999, the
pavement texture was measured in all six sections using an ARAN texture
device, which was on loan from the ARAN manufacturer at that time. The
mean texture depth (MTD) in mils measured for each section is given in
Table 11. The two Superpave recycled sections (WB 5 and WB 6) showed a
significantly higher surface texture compared to the four other
sections. The smooth-tire friction numbers reflect the more open and
coarse texture of sections WB 5 and WB 6. These two sections have
somewhat higher smooth-tire friction numbers than the other four
sections. This can be seen in Figures 9 and 10. It was also observed
in 1997 and 1998 that water appeared to seep through the pavement and
drain onto the surface near longitudinal paving joints, at a number of
locations within Section WB 6.
The 5-1/2 year overall average friction numbers for every section
(smooth and ribbed tires) are also given in Table 10. These values are
plotted in Figure 11. They represent an average of all data collected
between fall 1997 and fall 2002. There is a relatively insignificant
difference between any of the sections for the ribbed-tire numbers. As
mentioned previously, the smooth-tire friction numbers are higher for
the two recycled sections (WB 5 and WB 6) with the higher texture, and
somewhat larger aggregate (by design.)
29
TABLE 11 PAVEMENT TEXTURE MEASUREMENTS
Study Section Average Mean Texture
Depth (mils) Standard deviation (+/-) (mils)
EB 1 31 3 EB 2 32 2 EB 3 32 2 WB 4 34 3 WB 5 39 4 WB 6 41 6
0102030405060
Fric
tion
Num
ber (
40
mph
)
EB 1EB 2
EB 3WB 4
WB 5WB 6
Study Section
RibbedBald
FIGURE 11 FIVE-AND–ONE-HALF-YEAR AVERAGE FRICTION NUMBER MEASURED AT 40 MPH
FOR THE SIX STUDY SECTIONS
Condition Surveys
Cracking Condition surveys were performed by both Stantec
personnel and ConnDOT Research personnel. Stantec performed surveys of
only 500 ft of the sections used for the LTPP Study. A summary of
cracking and other distress found by Stantec on September 17, 2002 is
given in Table 12. Since the LTPP sections monitored for distress are
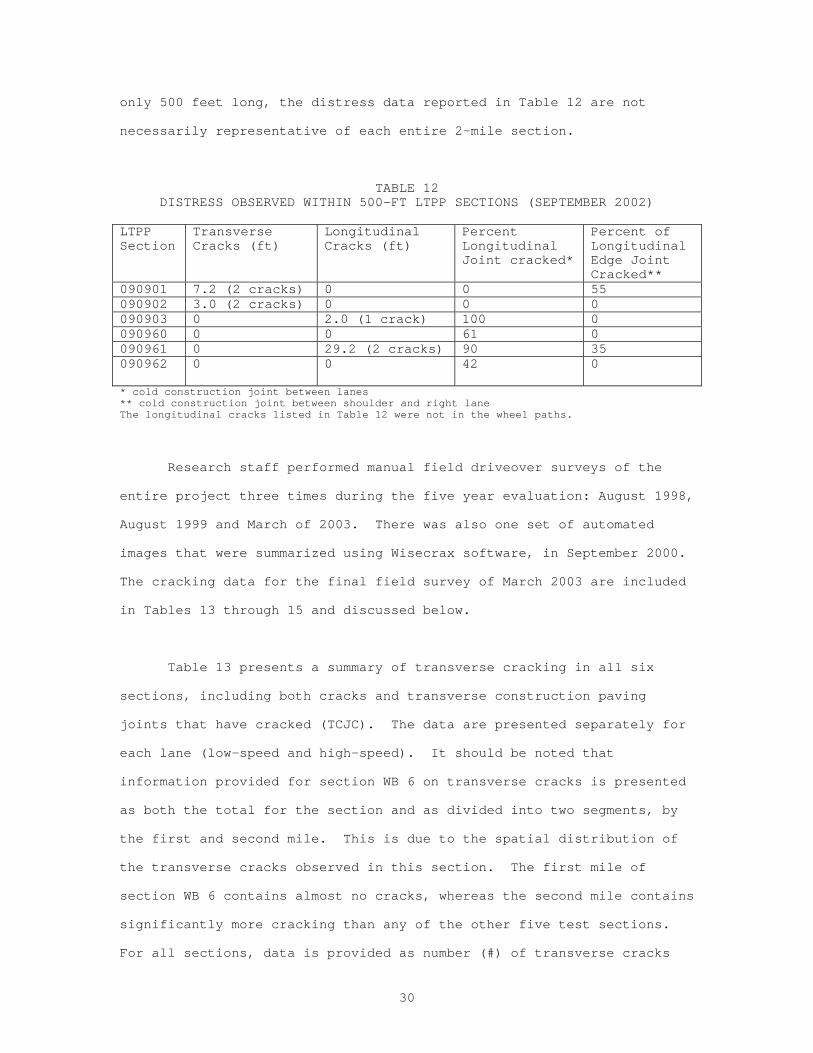
30
only 500 feet long, the distress data reported in Table 12 are not
necessarily representative of each entire 2-mile section.
TABLE 12 DISTRESS OBSERVED WITHIN 500-FT LTPP SECTIONS (SEPTEMBER 2002)
LTPP Section
Transverse Cracks (ft)
Longitudinal Cracks (ft)
Percent Longitudinal Joint cracked*
Percent of Longitudinal Edge Joint Cracked**
090901 7.2 (2 cracks) 0 0 55 090902 3.0 (2 cracks) 0 0 0 090903 0 2.0 (1 crack) 100 0 090960 0 0 61 0 090961 0 29.2 (2 cracks) 90 35 090962 0 0 42 0
* cold construction joint between lanes ** cold construction joint between shoulder and right lane The longitudinal cracks listed in Table 12 were not in the wheel paths.
Research staff performed manual field driveover surveys of the
entire project three times during the five year evaluation: August 1998,
August 1999 and March of 2003. There was also one set of automated
images that were summarized using Wisecrax software, in September 2000.
The cracking data for the final field survey of March 2003 are included
in Tables 13 through 15 and discussed below.
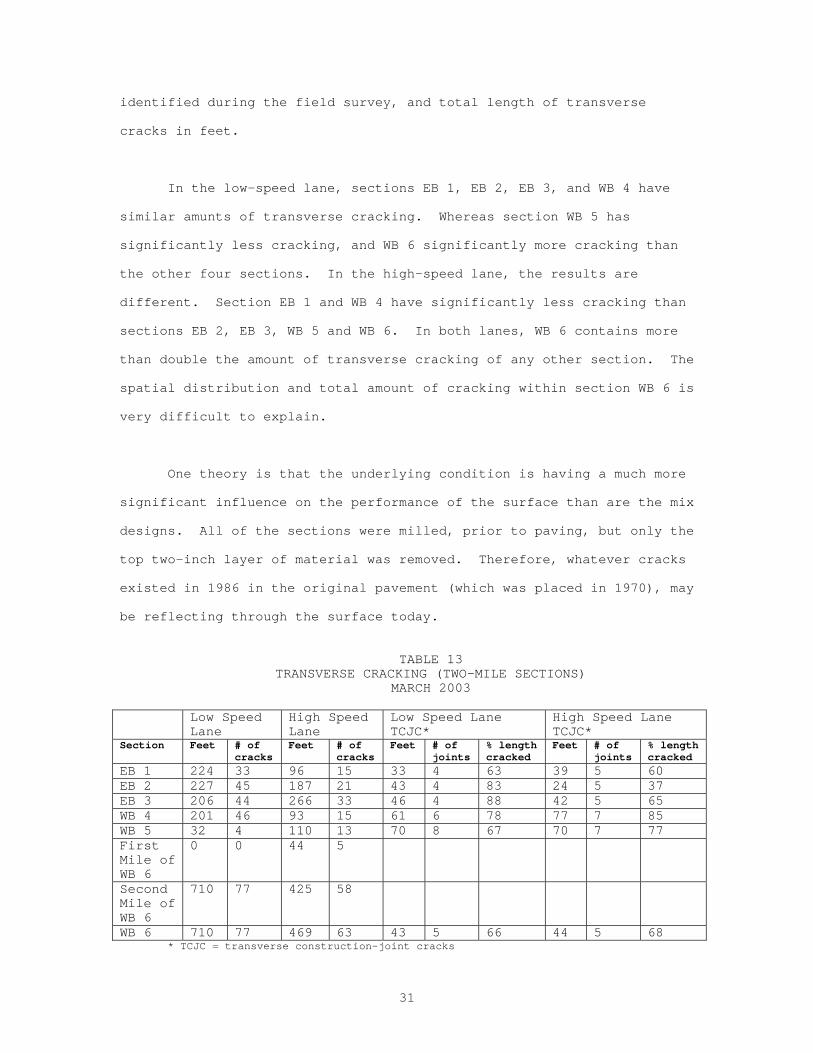
Table 13 presents a summary of transverse cracking in all six
sections, including both cracks and transverse construction paving
joints that have cracked (TCJC). The data are presented separately for
each lane (low-speed and high-speed). It should be noted that
information provided for section WB 6 on transverse cracks is presented
as both the total for the section and as divided into two segments, by
the first and second mile. This is due to the spatial distribution of
the transverse cracks observed in this section. The first mile of
section WB 6 contains almost no cracks, whereas the second mile contains
significantly more cracking than any of the other five test sections.
For all sections, data is provided as number (#) of transverse cracks
31
identified during the field survey, and total length of transverse
cracks in feet.
In the low-speed lane, sections EB 1, EB 2, EB 3, and WB 4 have
similar amunts of transverse cracking. Whereas section WB 5 has
significantly less cracking, and WB 6 significantly more cracking than
the other four sections. In the high-speed lane, the results are
different. Section EB 1 and WB 4 have significantly less cracking than
sections EB 2, EB 3, WB 5 and WB 6. In both lanes, WB 6 contains more
than double the amount of transverse cracking of any other section. The
spatial distribution and total amount of cracking within section WB 6 is
very difficult to explain.
One theory is that the underlying condition is having a much more
significant influence on the performance of the surface than are the mix
designs. All of the sections were milled, prior to paving, but only the
top two-inch layer of material was removed. Therefore, whatever cracks
existed in 1986 in the original pavement (which was placed in 1970), may
be reflecting through the surface today.
TABLE 13
TRANSVERSE CRACKING (TWO-MILE SECTIONS) MARCH 2003
Low Speed
Lane High Speed Lane
Low Speed Lane TCJC*
High Speed Lane TCJC*
Section Feet # of cracks
Feet # of cracks
Feet # of joints
% length cracked
Feet # of joints
% length cracked
EB 1 224 33 96 15 33 4 63 39 5 60 EB 2 227 45 187 21 43 4 83 24 5 37 EB 3 206 44 266 33 46 4 88 42 5 65 WB 4 201 46 93 15 61 6 78 77 7 85 WB 5 32 4 110 13 70 8 67 70 7 77 First Mile of WB 6
0 0 44 5
Second Mile of WB 6
710 77 425 58
WB 6 710 77 469 63 43 5 66 44 5 68 * TCJC = transverse construction-joint cracks
32
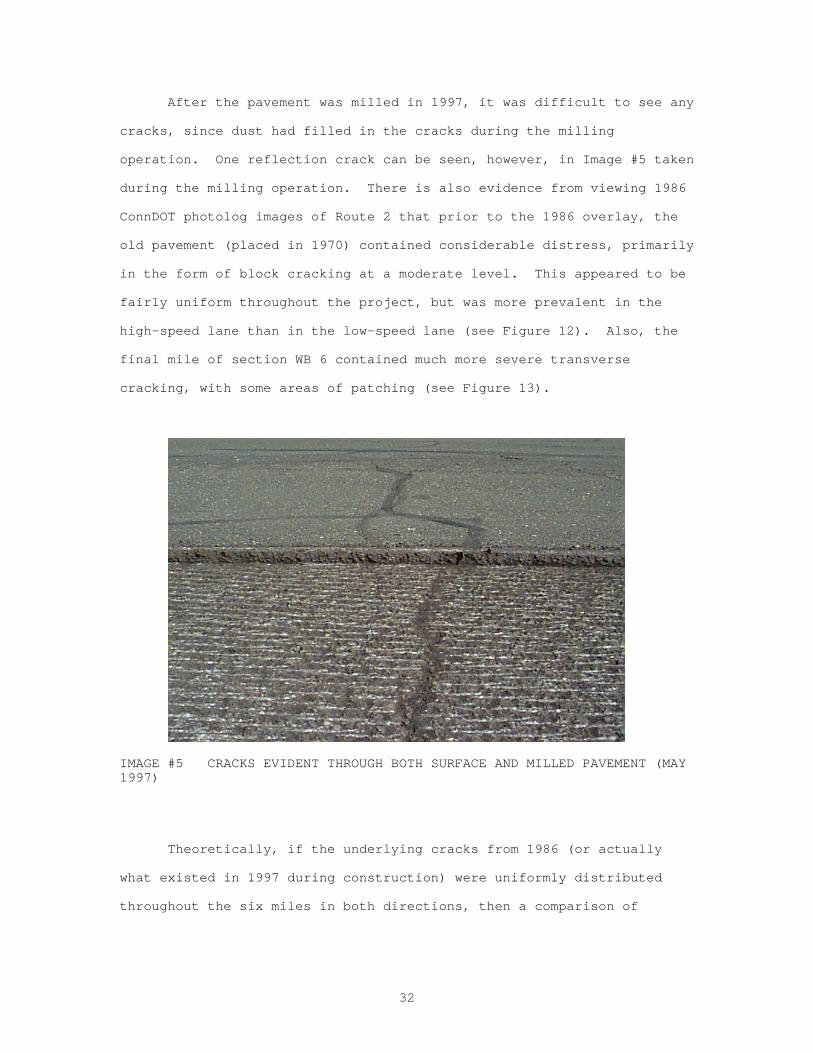
After the pavement was milled in 1997, it was difficult to see any
cracks, since dust had filled in the cracks during the milling
operation. One reflection crack can be seen, however, in Image #5 taken
during the milling operation. There is also evidence from viewing 1986
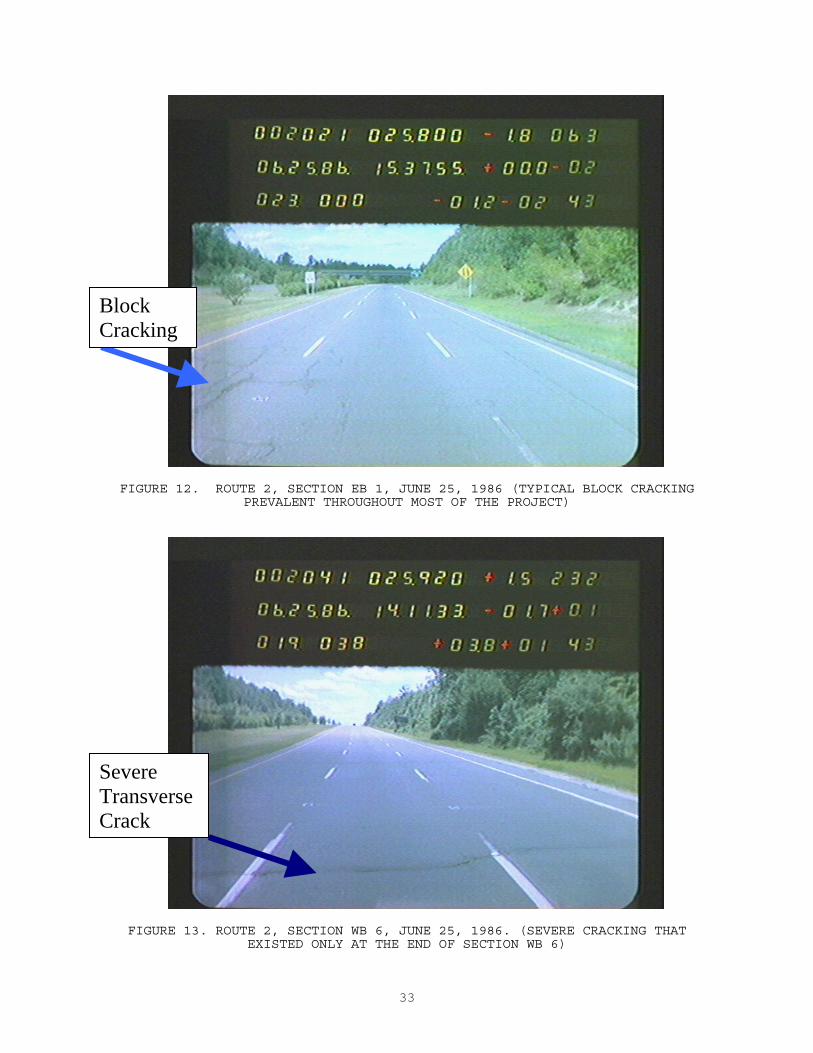
ConnDOT photolog images of Route 2 that prior to the 1986 overlay, the
old pavement (placed in 1970) contained considerable distress, primarily
in the form of block cracking at a moderate level. This appeared to be
fairly uniform throughout the project, but was more prevalent in the
high-speed lane than in the low-speed lane (see Figure 12). Also, the
final mile of section WB 6 contained much more severe transverse
cracking, with some areas of patching (see Figure 13).
IMAGE #5 CRACKS EVIDENT THROUGH BOTH SURFACE AND MILLED PAVEMENT (MAY 1997)
Theoretically, if the underlying cracks from 1986 (or actually
what existed in 1997 during construction) were uniformly distributed
throughout the six miles in both directions, then a comparison of
33
FIGURE 12. ROUTE 2, SECTION EB 1, JUNE 25, 1986 (TYPICAL BLOCK CRACKING PREVALENT THROUGHOUT MOST OF THE PROJECT)
FIGURE 13. ROUTE 2, SECTION WB 6, JUNE 25, 1986. (SEVERE CRACKING THAT EXISTED ONLY AT THE END OF SECTION WB 6)
Block Cracking
Severe Transverse Crack
34
current surface cracking between the sections could be done, for
example, using the data in Table 13 as previously discussed, to
determine the difference in five-year performance of the various surface
mixes. Transverse cracks are generally shrinkage-induced tension cracks
that occur during cold weather. It is very difficult to prevent these
cracks from re-occurring above a layer that already contains transverse
cracks. However, block cracking in the size of less than 5 ft by 5 ft
can be more easily contained, as total movement at the cracks is less
during expansion and contraction. This could explain why the second
mile of section WB 6, which contained the severe transverse cracks in
1986, contains more cracking (presumably reflection) than the rest of
the project.
On the assumption that the rest of the project (i.e., sections EB
1, EB 2, EB 3, WB 4, and WB 5) had fairly uniform block cracking in
1986, then the differences in observed surface cracking in 2003, as
presented in Table 13 for these sections, might be attributed more to
variations in the pavement mix. If this assumption is made, then
overall, based upon transverse cracking alone, sections EB 1 and WB 5
and the first mile of WB 6 are performing the best. However, due to the
unknown reliability of the assumption, very little confidence can be
given to this conclusion.
The quantity of cracks located at transverse construction paving
joints is also given in Table 13 (see TCJC) for each lane of each
section. In these sections, the column labeled as # represents the
total number of construction joints within each section. The percentage
of length of these joints with cracks is also given in Table 13. There
does not appear to be a significant difference between any of the
section’s transverse construction joint performance. More than half of
the joints are cracked in nearly all of the sections. Quality of
35
construction joints is highly dependent upon the paving crew.
Therefore, conclusions about performance of mixes would not be justified
solely on the basis of transverse paving joint conditions after five
years.
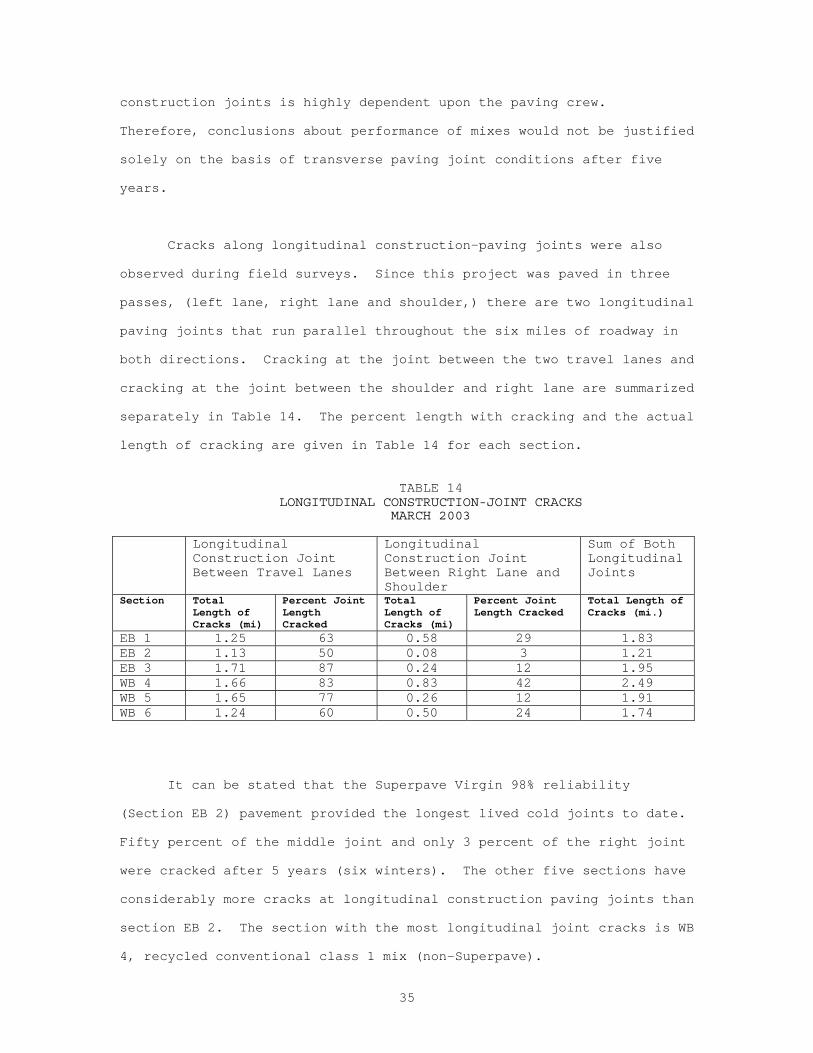
Cracks along longitudinal construction-paving joints were also
observed during field surveys. Since this project was paved in three
passes, (left lane, right lane and shoulder,) there are two longitudinal
paving joints that run parallel throughout the six miles of roadway in
both directions. Cracking at the joint between the two travel lanes and
cracking at the joint between the shoulder and right lane are summarized
separately in Table 14. The percent length with cracking and the actual
length of cracking are given in Table 14 for each section.
TABLE 14
LONGITUDINAL CONSTRUCTION-JOINT CRACKS MARCH 2003
Longitudinal
Construction Joint Between Travel Lanes
Longitudinal Construction Joint Between Right Lane and Shoulder
Sum of Both Longitudinal Joints
Section Total Length of Cracks (mi)
Percent Joint Length Cracked
Total Length of Cracks (mi)
Percent Joint Length Cracked
Total Length of Cracks (mi.)
EB 1 1.25 63 0.58 29 1.83 EB 2 1.13 50 0.08 3 1.21 EB 3 1.71 87 0.24 12 1.95 WB 4 1.66 83 0.83 42 2.49 WB 5 1.65 77 0.26 12 1.91 WB 6 1.24 60 0.50 24 1.74
It can be stated that the Superpave Virgin 98% reliability
(Section EB 2) pavement provided the longest lived cold joints to date.
Fifty percent of the middle joint and only 3 percent of the right joint
were cracked after 5 years (six winters). The other five sections have
considerably more cracks at longitudinal construction paving joints than
section EB 2. The section with the most longitudinal joint cracks is WB
4, recycled conventional class 1 mix (non-Superpave).
36
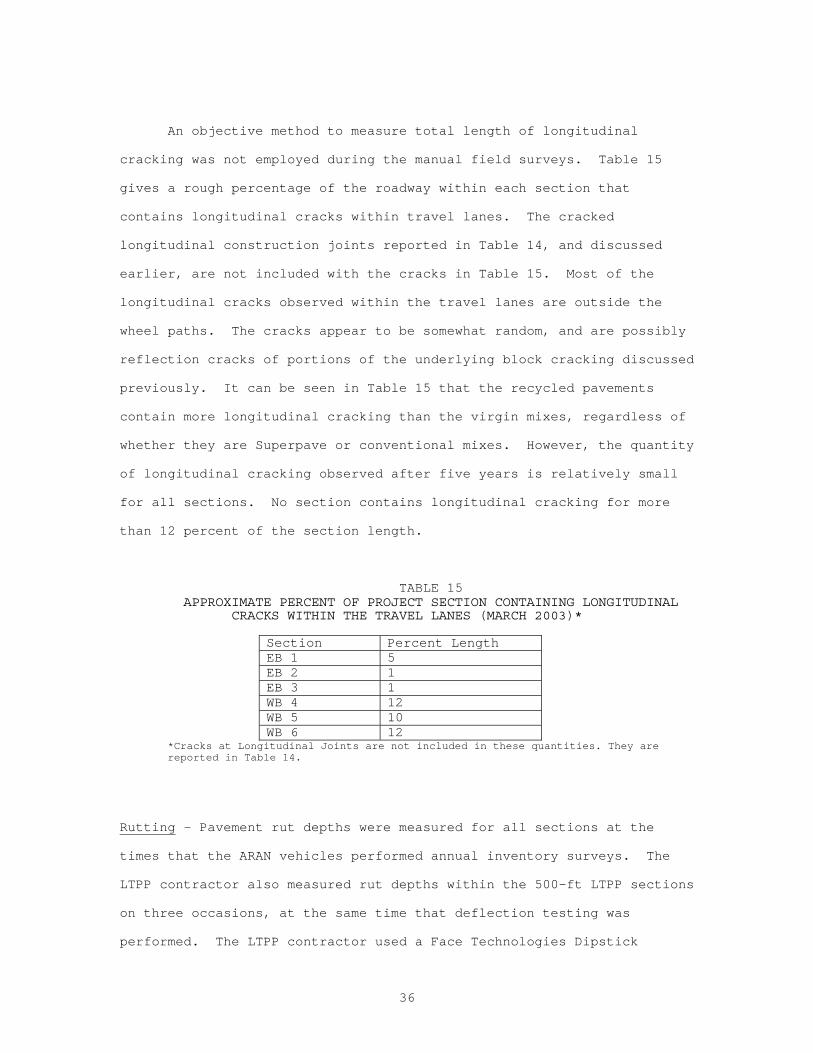
An objective method to measure total length of longitudinal
cracking was not employed during the manual field surveys. Table 15
gives a rough percentage of the roadway within each section that
contains longitudinal cracks within travel lanes. The cracked
longitudinal construction joints reported in Table 14, and discussed
earlier, are not included with the cracks in Table 15. Most of the
longitudinal cracks observed within the travel lanes are outside the
wheel paths. The cracks appear to be somewhat random, and are possibly
reflection cracks of portions of the underlying block cracking discussed
previously. It can be seen in Table 15 that the recycled pavements
contain more longitudinal cracking than the virgin mixes, regardless of
whether they are Superpave or conventional mixes. However, the quantity
of longitudinal cracking observed after five years is relatively small
for all sections. No section contains longitudinal cracking for more
than 12 percent of the section length.
TABLE 15 APPROXIMATE PERCENT OF PROJECT SECTION CONTAINING LONGITUDINAL
CRACKS WITHIN THE TRAVEL LANES (MARCH 2003)*
Section Percent Length EB 1 5 EB 2 1 EB 3 1 WB 4 12 WB 5 10 WB 6 12
*Cracks at Longitudinal Joints are not included in these quantities. They are reported in Table 14.
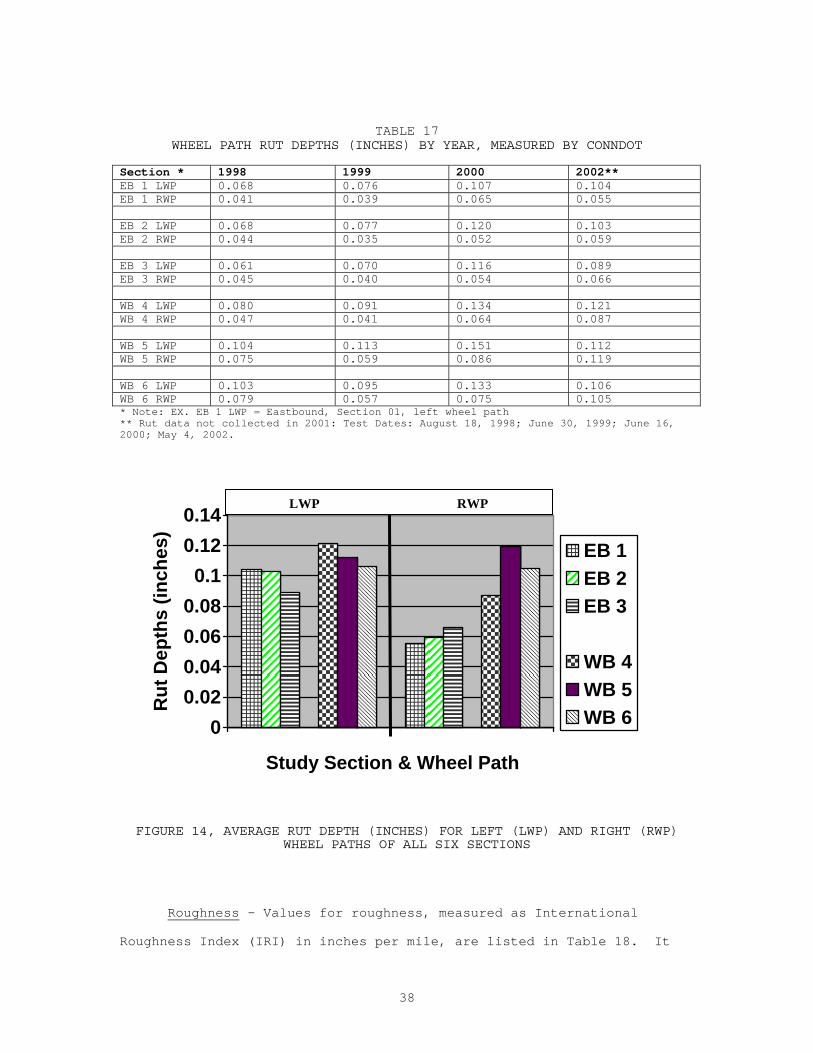
Rutting - Pavement rut depths were measured for all sections at the
times that the ARAN vehicles performed annual inventory surveys. The
LTPP contractor also measured rut depths within the 500-ft LTPP sections
on three occasions, at the same time that deflection testing was
performed. The LTPP contractor used a Face Technologies Dipstick
37
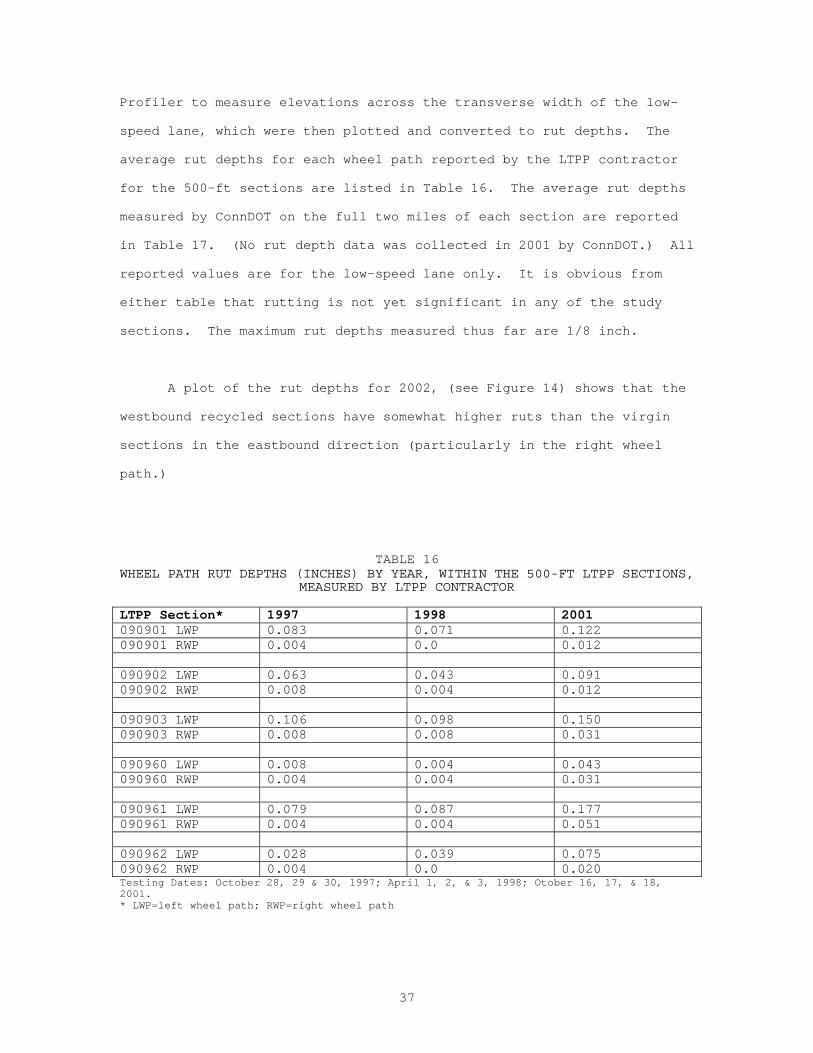
Profiler to measure elevations across the transverse width of the low-
speed lane, which were then plotted and converted to rut depths. The
average rut depths for each wheel path reported by the LTPP contractor
for the 500-ft sections are listed in Table 16. The average rut depths
measured by ConnDOT on the full two miles of each section are reported
in Table 17. (No rut depth data was collected in 2001 by ConnDOT.) All
reported values are for the low-speed lane only. It is obvious from
either table that rutting is not yet significant in any of the study
sections. The maximum rut depths measured thus far are 1/8 inch.
A plot of the rut depths for 2002, (see Figure 14) shows that the
westbound recycled sections have somewhat higher ruts than the virgin
sections in the eastbound direction (particularly in the right wheel
path.)
TABLE 16 WHEEL PATH RUT DEPTHS (INCHES) BY YEAR, WITHIN THE 500-FT LTPP SECTIONS,
MEASURED BY LTPP CONTRACTOR
LTPP Section* 1997 1998 2001 090901 LWP 0.083 0.071 0.122 090901 RWP 0.004 0.0 0.012 090902 LWP 0.063 0.043 0.091 090902 RWP 0.008 0.004 0.012 090903 LWP 0.106 0.098 0.150 090903 RWP 0.008 0.008 0.031 090960 LWP 0.008 0.004 0.043 090960 RWP 0.004 0.004 0.031 090961 LWP 0.079 0.087 0.177 090961 RWP 0.004 0.004 0.051 090962 LWP 0.028 0.039 0.075 090962 RWP 0.004 0.0 0.020 Testing Dates: October 28, 29 & 30, 1997; April 1, 2, & 3, 1998; Otober 16, 17, & 18, 2001. * LWP=left wheel path; RWP=right wheel path
38
TABLE 17 WHEEL PATH RUT DEPTHS (INCHES) BY YEAR, MEASURED BY CONNDOT
Section * 1998 1999 2000 2002** EB 1 LWP 0.068 0.076 0.107 0.104 EB 1 RWP 0.041 0.039 0.065 0.055 EB 2 LWP 0.068 0.077 0.120 0.103 EB 2 RWP 0.044 0.035 0.052 0.059 EB 3 LWP 0.061 0.070 0.116 0.089 EB 3 RWP 0.045 0.040 0.054 0.066 WB 4 LWP 0.080 0.091 0.134 0.121 WB 4 RWP 0.047 0.041 0.064 0.087 WB 5 LWP 0.104 0.113 0.151 0.112 WB 5 RWP 0.075 0.059 0.086 0.119 WB 6 LWP 0.103 0.095 0.133 0.106 WB 6 RWP 0.079 0.057 0.075 0.105 * Note: EX. EB 1 LWP = Eastbound, Section 01, left wheel path ** Rut data not collected in 2001: Test Dates: August 18, 1998; June 30, 1999; June 16, 2000; May 4, 2002.
00.020.040.060.080.1
0.120.14
Rut
Dep
ths
(inch
es)
Study Section & Wheel Path
EB 1EB 2EB 3
WB 4WB 5WB 6
FIGURE 14, AVERAGE RUT DEPTH (INCHES) FOR LEFT (LWP) AND RIGHT (RWP)
WHEEL PATHS OF ALL SIX SECTIONS
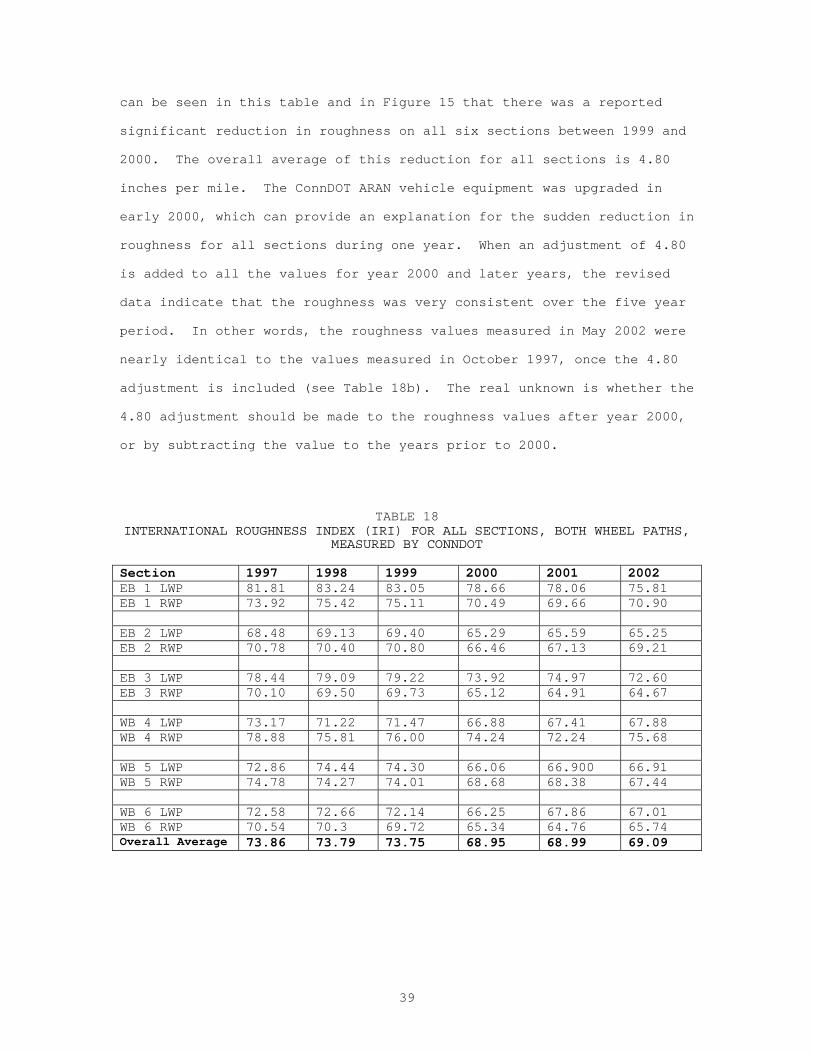
Roughness - Values for roughness, measured as International
Roughness Index (IRI) in inches per mile, are listed in Table 18. It
LWP RWP
39
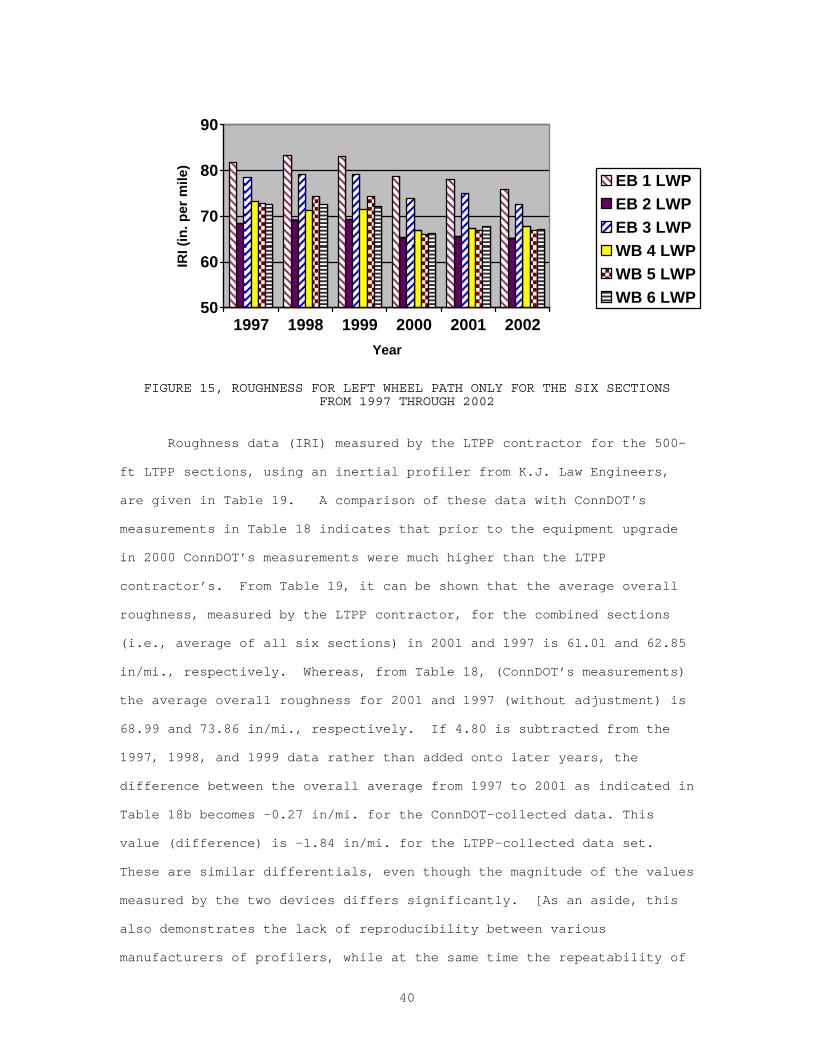
can be seen in this table and in Figure 15 that there was a reported
significant reduction in roughness on all six sections between 1999 and
2000. The overall average of this reduction for all sections is 4.80
inches per mile. The ConnDOT ARAN vehicle equipment was upgraded in
early 2000, which can provide an explanation for the sudden reduction in
roughness for all sections during one year. When an adjustment of 4.80
is added to all the values for year 2000 and later years, the revised
data indicate that the roughness was very consistent over the five year
period. In other words, the roughness values measured in May 2002 were
nearly identical to the values measured in October 1997, once the 4.80
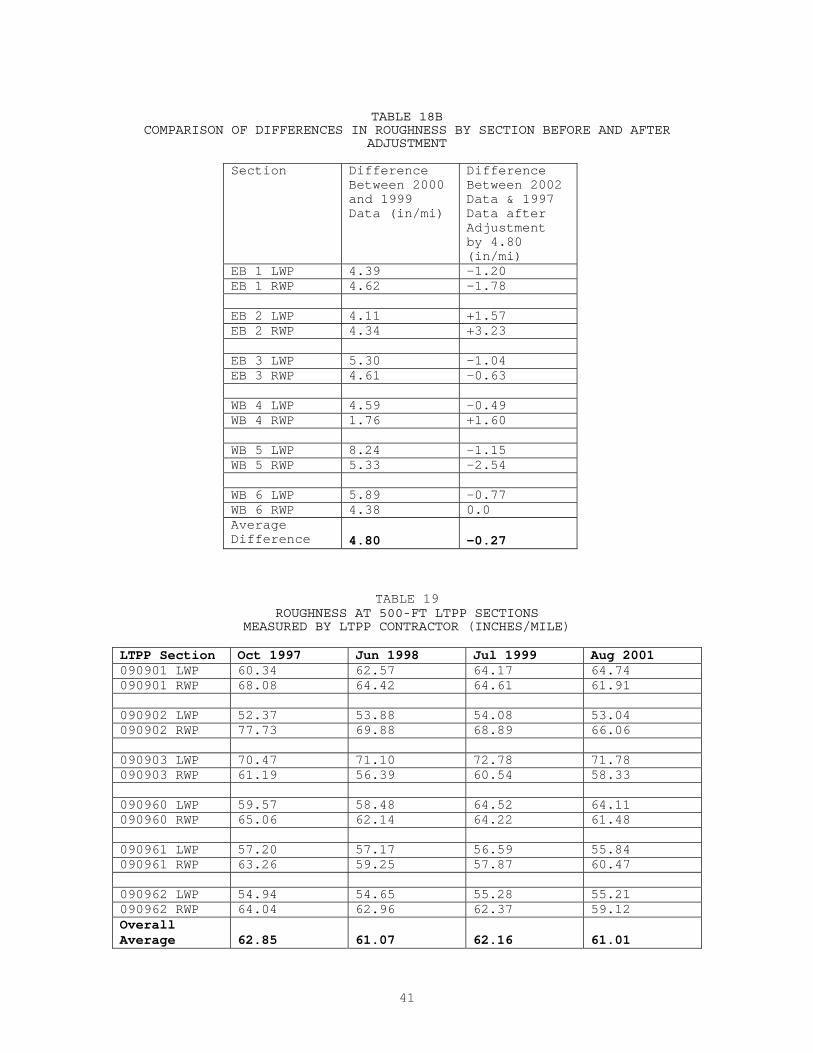
adjustment is included (see Table 18b). The real unknown is whether the
4.80 adjustment should be made to the roughness values after year 2000,
or by subtracting the value to the years prior to 2000.
TABLE 18
INTERNATIONAL ROUGHNESS INDEX (IRI) FOR ALL SECTIONS, BOTH WHEEL PATHS, MEASURED BY CONNDOT
Section 1997 1998 1999 2000 2001 2002 EB 1 LWP 81.81 83.24 83.05 78.66 78.06 75.81 EB 1 RWP 73.92 75.42 75.11 70.49 69.66 70.90 EB 2 LWP 68.48 69.13 69.40 65.29 65.59 65.25 EB 2 RWP 70.78 70.40 70.80 66.46 67.13 69.21 EB 3 LWP 78.44 79.09 79.22 73.92 74.97 72.60 EB 3 RWP 70.10 69.50 69.73 65.12 64.91 64.67 WB 4 LWP 73.17 71.22 71.47 66.88 67.41 67.88 WB 4 RWP 78.88 75.81 76.00 74.24 72.24 75.68 WB 5 LWP 72.86 74.44 74.30 66.06 66.900 66.91 WB 5 RWP 74.78 74.27 74.01 68.68 68.38 67.44 WB 6 LWP 72.58 72.66 72.14 66.25 67.86 67.01 WB 6 RWP 70.54 70.3 69.72 65.34 64.76 65.74 Overall Average 73.86 73.79 73.75 68.95 68.99 69.09
40
50
60
70
80
90
IRI (
in. p
er m
ile)
1997 1998 1999 2000 2001 2002Year
EB 1 LWPEB 2 LWPEB 3 LWPWB 4 LWPWB 5 LWPWB 6 LWP
FIGURE 15, ROUGHNESS FOR LEFT WHEEL PATH ONLY FOR THE SIX SECTIONS FROM 1997 THROUGH 2002
Roughness data (IRI) measured by the LTPP contractor for the 500-
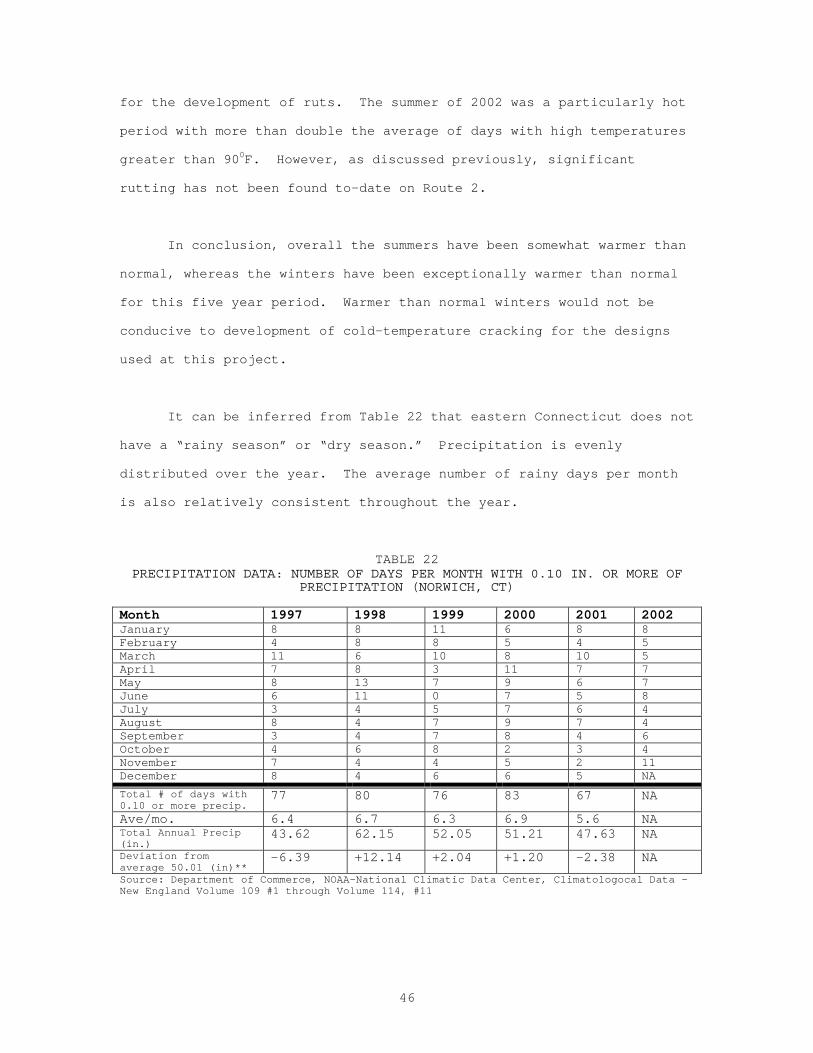
ft LTPP sections, using an inertial profiler from K.J. Law Engineers,
are given in Table 19. A comparison of these data with ConnDOT’s
measurements in Table 18 indicates that prior to the equipment upgrade
in 2000 ConnDOT’s measurements were much higher than the LTPP
contractor’s. From Table 19, it can be shown that the average overall
roughness, measured by the LTPP contractor, for the combined sections
(i.e., average of all six sections) in 2001 and 1997 is 61.01 and 62.85
in/mi., respectively. Whereas, from Table 18, (ConnDOT’s measurements)
the average overall roughness for 2001 and 1997 (without adjustment) is
68.99 and 73.86 in/mi., respectively. If 4.80 is subtracted from the
1997, 1998, and 1999 data rather than added onto later years, the
difference between the overall average from 1997 to 2001 as indicated in
Table 18b becomes -0.27 in/mi. for the ConnDOT-collected data. This
value (difference) is -1.84 in/mi. for the LTPP-collected data set.
These are similar differentials, even though the magnitude of the values
measured by the two devices differs significantly. [As an aside, this
also demonstrates the lack of reproducibility between various
manufacturers of profilers, while at the same time the repeatability of
41
TABLE 18B
COMPARISON OF DIFFERENCES IN ROUGHNESS BY SECTION BEFORE AND AFTER ADJUSTMENT
Section Difference
Between 2000 and 1999 Data (in/mi)
Difference Between 2002 Data & 1997 Data after Adjustment by 4.80 (in/mi)
EB 1 LWP 4.39 -1.20 EB 1 RWP 4.62 -1.78 EB 2 LWP 4.11 +1.57 EB 2 RWP 4.34 +3.23 EB 3 LWP 5.30 -1.04 EB 3 RWP 4.61 -0.63 WB 4 LWP 4.59 -0.49 WB 4 RWP 1.76 +1.60 WB 5 LWP 8.24 -1.15 WB 5 RWP 5.33 -2.54 WB 6 LWP 5.89 -0.77 WB 6 RWP 4.38 0.0 Average Difference
4.80
-0.27
TABLE 19
ROUGHNESS AT 500-FT LTPP SECTIONS MEASURED BY LTPP CONTRACTOR (INCHES/MILE)
LTPP Section Oct 1997 Jun 1998 Jul 1999 Aug 2001 090901 LWP 60.34 62.57 64.17 64.74 090901 RWP 68.08 64.42 64.61 61.91 090902 LWP 52.37 53.88 54.08 53.04 090902 RWP 77.73 69.88 68.89 66.06 090903 LWP 70.47 71.10 72.78 71.78 090903 RWP 61.19 56.39 60.54 58.33 090960 LWP 59.57 58.48 64.52 64.11 090960 RWP 65.06 62.14 64.22 61.48 090961 LWP 57.20 57.17 56.59 55.84 090961 RWP 63.26 59.25 57.87 60.47 090962 LWP 54.94 54.65 55.28 55.21 090962 RWP 64.04 62.96 62.37 59.12 Overall Average
62.85
61.07
62.16
61.01
42
the same ARAN vehicle over time, as long as equipment upgrades do not
occur. [3]
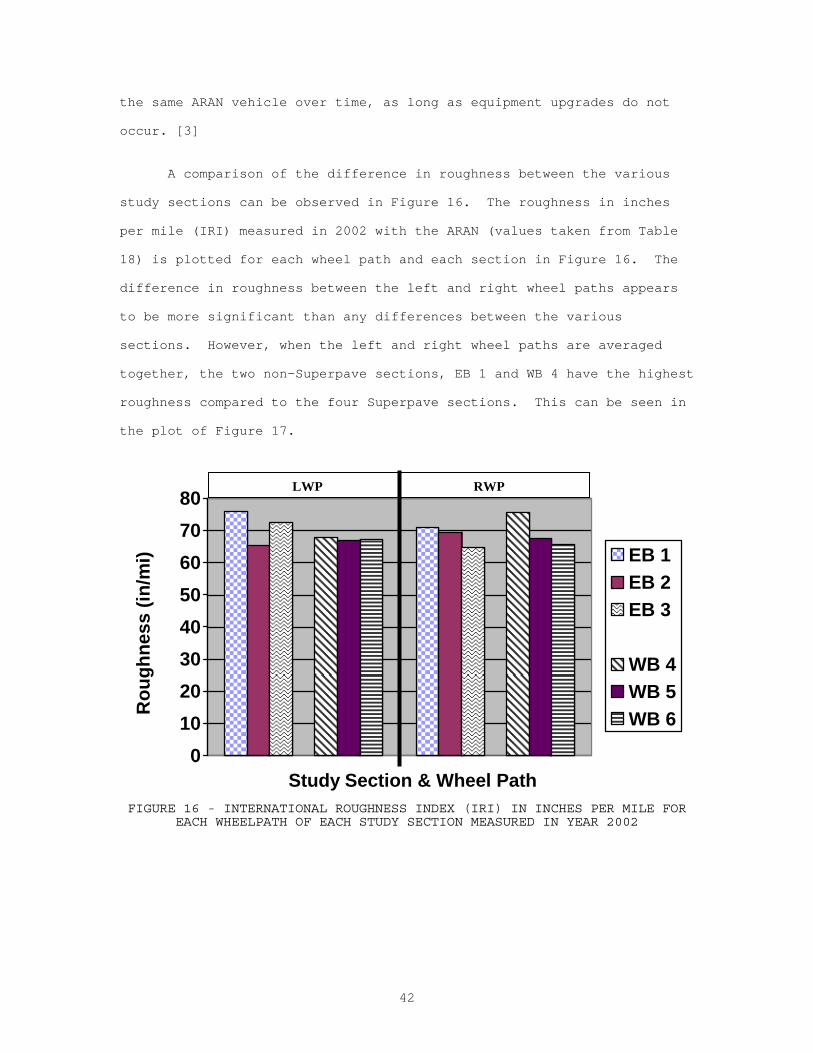
A comparison of the difference in roughness between the various
study sections can be observed in Figure 16. The roughness in inches
per mile (IRI) measured in 2002 with the ARAN (values taken from Table
18) is plotted for each wheel path and each section in Figure 16. The
difference in roughness between the left and right wheel paths appears
to be more significant than any differences between the various
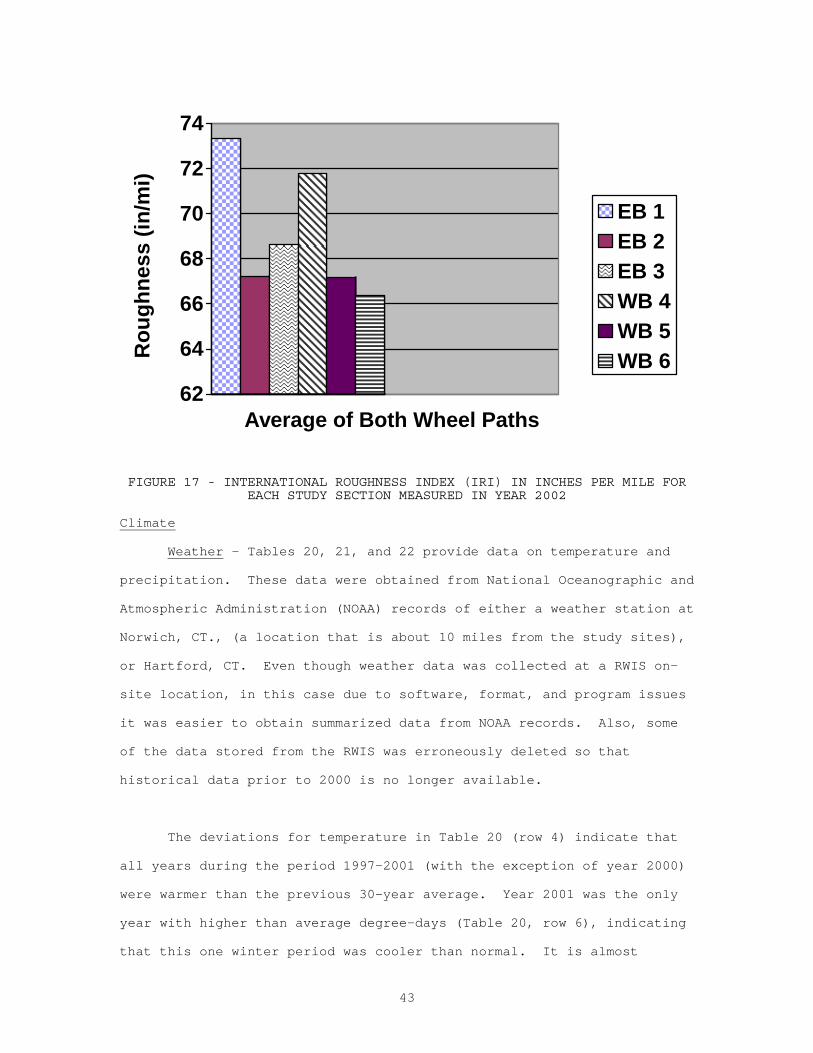
sections. However, when the left and right wheel paths are averaged
together, the two non-Superpave sections, EB 1 and WB 4 have the highest
roughness compared to the four Superpave sections. This can be seen in
the plot of Figure 17.
01020304050607080
Rou
ghne
ss (i
n/m
i)
Study Section & Wheel Path
EB 1EB 2EB 3
WB 4WB 5WB 6
FIGURE 16 - INTERNATIONAL ROUGHNESS INDEX (IRI) IN INCHES PER MILE FOR
EACH WHEELPATH OF EACH STUDY SECTION MEASURED IN YEAR 2002
LWP RWP
43
62
64
66
68
70
72
74R
ough
ness
(in/
mi)
Average of Both Wheel Paths
EB 1EB 2EB 3WB 4WB 5WB 6
FIGURE 17 - INTERNATIONAL ROUGHNESS INDEX (IRI) IN INCHES PER MILE FOR
EACH STUDY SECTION MEASURED IN YEAR 2002 Climate
Weather - Tables 20, 21, and 22 provide data on temperature and
precipitation. These data were obtained from National Oceanographic and
Atmospheric Administration (NOAA) records of either a weather station at
Norwich, CT., (a location that is about 10 miles from the study sites),
or Hartford, CT. Even though weather data was collected at a RWIS on-
site location, in this case due to software, format, and program issues
it was easier to obtain summarized data from NOAA records. Also, some
of the data stored from the RWIS was erroneously deleted so that
historical data prior to 2000 is no longer available.
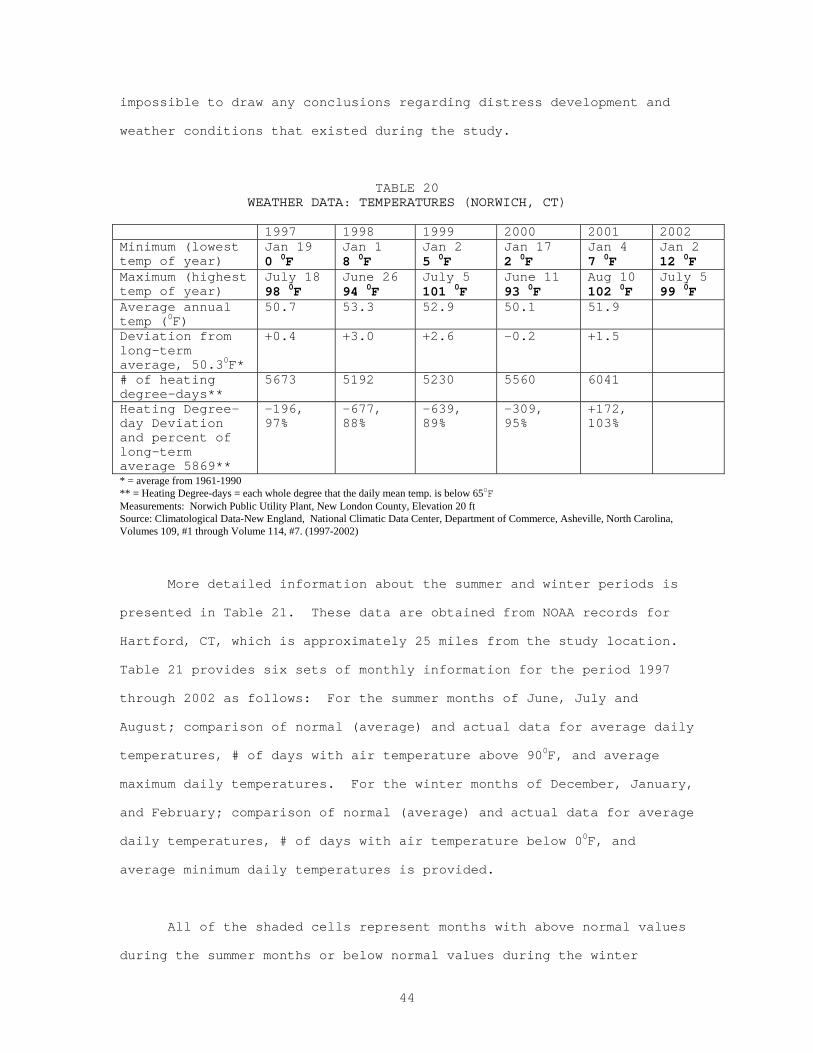
The deviations for temperature in Table 20 (row 4) indicate that
all years during the period 1997-2001 (with the exception of year 2000)
were warmer than the previous 30-year average. Year 2001 was the only
year with higher than average degree-days (Table 20, row 6), indicating
that this one winter period was cooler than normal. It is almost
44
impossible to draw any conclusions regarding distress development and
weather conditions that existed during the study.
TABLE 20 WEATHER DATA: TEMPERATURES (NORWICH, CT)
1997 1998 1999 2000 2001 2002 Minimum (lowest temp of year)
Jan 19 0 0F
Jan 1 8 0F
Jan 2 5 0F
Jan 17 2 0F
Jan 4 7 0F
Jan 2 12 0F
Maximum (highest temp of year)
July 18 98 0F
June 26 94 0F
July 5 101 0F
June 11 93 0F
Aug 10 102 0F
July 5 99 0F
Average annual temp (0F)
50.7 53.3 52.9 50.1 51.9
Deviation from long-term average, 50.30F*
+0.4 +3.0 +2.6 -0.2 +1.5
# of heating degree-days**
5673 5192 5230 5560 6041
Heating Degree-day Deviation and percent of long-term average 5869**
-196, 97%
-677, 88%
-639, 89%
-309, 95%
+172, 103%
* = average from 1961-1990 ** = Heating Degree-days = each whole degree that the daily mean temp. is below 650F Measurements: Norwich Public Utility Plant, New London County, Elevation 20 ft Source: Climatological Data-New England, National Climatic Data Center, Department of Commerce, Asheville, North Carolina, Volumes 109, #1 through Volume 114, #7. (1997-2002)
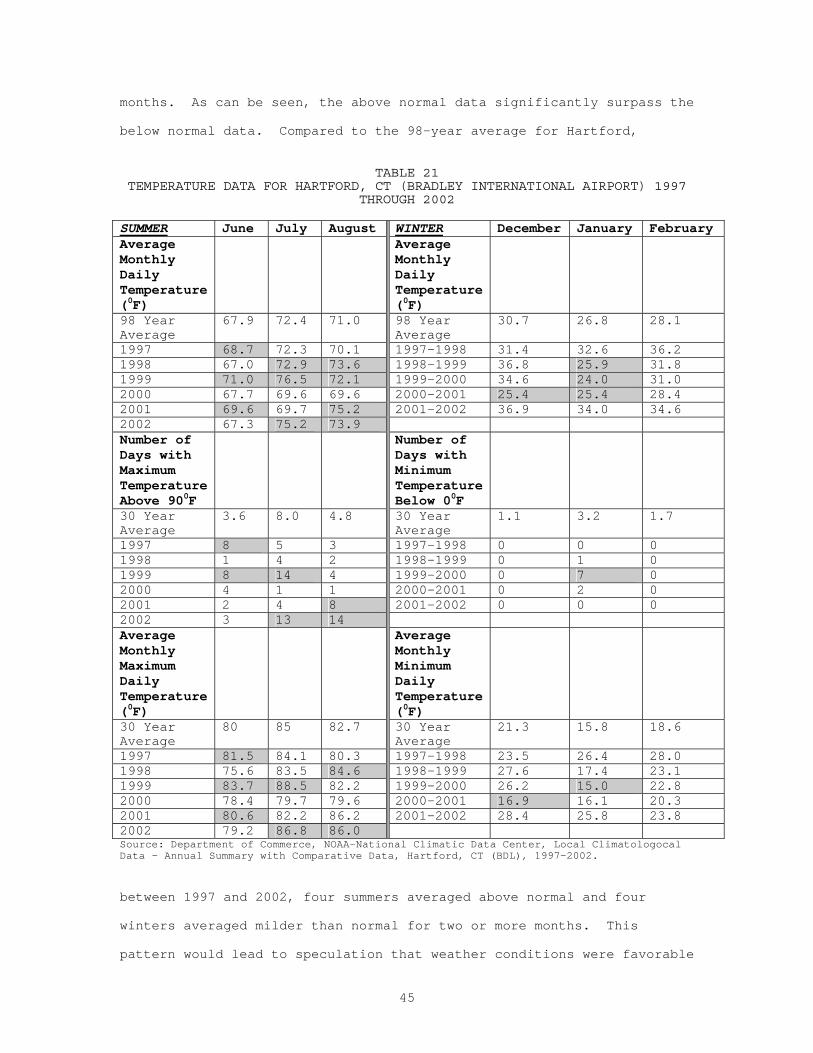
More detailed information about the summer and winter periods is
presented in Table 21. These data are obtained from NOAA records for
Hartford, CT, which is approximately 25 miles from the study location.
Table 21 provides six sets of monthly information for the period 1997
through 2002 as follows: For the summer months of June, July and
August; comparison of normal (average) and actual data for average daily
temperatures, # of days with air temperature above 900F, and average
maximum daily temperatures. For the winter months of December, January,
and February; comparison of normal (average) and actual data for average
daily temperatures, # of days with air temperature below 00F, and
average minimum daily temperatures is provided.
All of the shaded cells represent months with above normal values
during the summer months or below normal values during the winter
45
months. As can be seen, the above normal data significantly surpass the
below normal data. Compared to the 98-year average for Hartford,
TABLE 21
TEMPERATURE DATA FOR HARTFORD, CT (BRADLEY INTERNATIONAL AIRPORT) 1997 THROUGH 2002
SUMMER June July August WINTER December January February Average Monthly Daily Temperature (0F)
Average Monthly Daily Temperature (0F)
98 Year Average
67.9 72.4 71.0 98 Year Average
30.7 26.8 28.1
1997 68.7 72.3 70.1 1997-1998 31.4 32.6 36.2 1998 67.0 72.9 73.6 1998-1999 36.8 25.9 31.8 1999 71.0 76.5 72.1 1999-2000 34.6 24.0 31.0 2000 67.7 69.6 69.6 2000-2001 25.4 25.4 28.4 2001 69.6 69.7 75.2 2001-2002 36.9 34.0 34.6 2002 67.3 75.2 73.9 Number of Days with Maximum Temperature Above 900F
Number of Days with Minimum Temperature Below 00F
30 Year Average
3.6 8.0 4.8 30 Year Average
1.1 3.2 1.7
1997 8 5 3 1997-1998 0 0 0 1998 1 4 2 1998-1999 0 1 0 1999 8 14 4 1999-2000 0 7 0 2000 4 1 1 2000-2001 0 2 0 2001 2 4 8 2001-2002 0 0 0 2002 3 13 14 Average Monthly Maximum Daily Temperature (0F)
Average Monthly Minimum Daily Temperature (0F)
30 Year Average
80 85 82.7 30 Year Average
21.3 15.8 18.6
1997 81.5 84.1 80.3 1997-1998 23.5 26.4 28.0 1998 75.6 83.5 84.6 1998-1999 27.6 17.4 23.1 1999 83.7 88.5 82.2 1999-2000 26.2 15.0 22.8 2000 78.4 79.7 79.6 2000-2001 16.9 16.1 20.3 2001 80.6 82.2 86.2 2001-2002 28.4 25.8 23.8 2002 79.2 86.8 86.0 Source: Department of Commerce, NOAA-National Climatic Data Center, Local Climatologocal Data – Annual Summary with Comparative Data, Hartford, CT (BDL), 1997-2002. between 1997 and 2002, four summers averaged above normal and four
winters averaged milder than normal for two or more months. This
pattern would lead to speculation that weather conditions were favorable
46
for the development of ruts. The summer of 2002 was a particularly hot
period with more than double the average of days with high temperatures
greater than 900F. However, as discussed previously, significant
rutting has not been found to-date on Route 2.
In conclusion, overall the summers have been somewhat warmer than
normal, whereas the winters have been exceptionally warmer than normal
for this five year period. Warmer than normal winters would not be
conducive to development of cold-temperature cracking for the designs
used at this project.
It can be inferred from Table 22 that eastern Connecticut does not
have a “rainy season” or “dry season.” Precipitation is evenly
distributed over the year. The average number of rainy days per month
is also relatively consistent throughout the year.
TABLE 22 PRECIPITATION DATA: NUMBER OF DAYS PER MONTH WITH 0.10 IN. OR MORE OF
PRECIPITATION (NORWICH, CT)
Month 1997 1998 1999 2000 2001 2002 January 8 8 11 6 8 8 February 4 8 8 5 4 5 March 11 6 10 8 10 5 April 7 8 3 11 7 7 May 8 13 7 9 6 7 June 6 11 0 7 5 8 July 3 4 5 7 6 4 August 8 4 7 9 7 4 September 3 4 7 8 4 6 October 4 6 8 2 3 4 November 7 4 4 5 2 11 December 8 4 6 6 5 NA
Total # of days with 0.10 or more precip.
77 80 76 83 67 NA
Ave/mo. 6.4 6.7 6.3 6.9 5.6 NA Total Annual Precip (in.)
43.62 62.15 52.05 51.21 47.63 NA
Deviation from average 50.01 (in)**
-6.39 +12.14 +2.04 +1.20 -2.38 NA
Source: Department of Commerce, NOAA-National Climatic Data Center, Climatologocal Data – New England Volume 109 #1 through Volume 114, #11
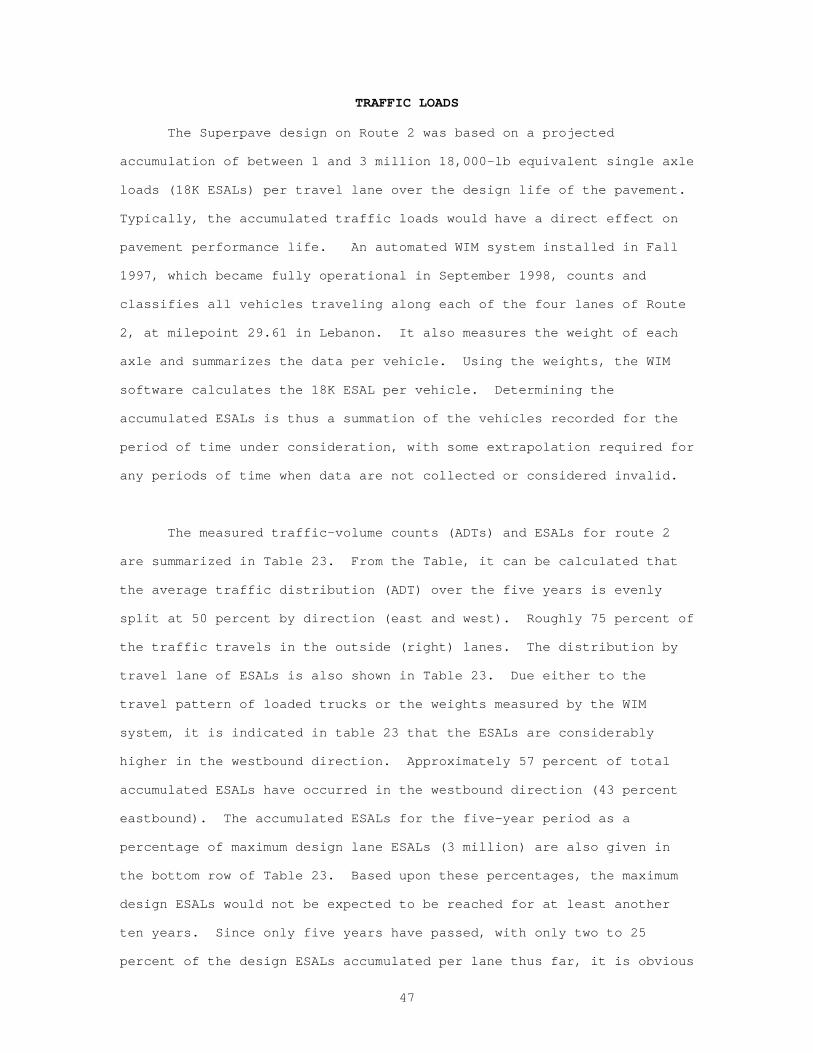
47
TRAFFIC LOADS
The Superpave design on Route 2 was based on a projected
accumulation of between 1 and 3 million 18,000-lb equivalent single axle
loads (18K ESALs) per travel lane over the design life of the pavement.
Typically, the accumulated traffic loads would have a direct effect on
pavement performance life. An automated WIM system installed in Fall
1997, which became fully operational in September 1998, counts and
classifies all vehicles traveling along each of the four lanes of Route
2, at milepoint 29.61 in Lebanon. It also measures the weight of each
axle and summarizes the data per vehicle. Using the weights, the WIM
software calculates the 18K ESAL per vehicle. Determining the
accumulated ESALs is thus a summation of the vehicles recorded for the
period of time under consideration, with some extrapolation required for
any periods of time when data are not collected or considered invalid.
The measured traffic-volume counts (ADTs) and ESALs for route 2
are summarized in Table 23. From the Table, it can be calculated that
the average traffic distribution (ADT) over the five years is evenly
split at 50 percent by direction (east and west). Roughly 75 percent of
the traffic travels in the outside (right) lanes. The distribution by
travel lane of ESALs is also shown in Table 23. Due either to the
travel pattern of loaded trucks or the weights measured by the WIM
system, it is indicated in table 23 that the ESALs are considerably
higher in the westbound direction. Approximately 57 percent of total
accumulated ESALs have occurred in the westbound direction (43 percent
eastbound). The accumulated ESALs for the five-year period as a
percentage of maximum design lane ESALs (3 million) are also given in
the bottom row of Table 23. Based upon these percentages, the maximum
design ESALs would not be expected to be reached for at least another
ten years. Since only five years have passed, with only two to 25
percent of the design ESALs accumulated per lane thus far, it is obvious
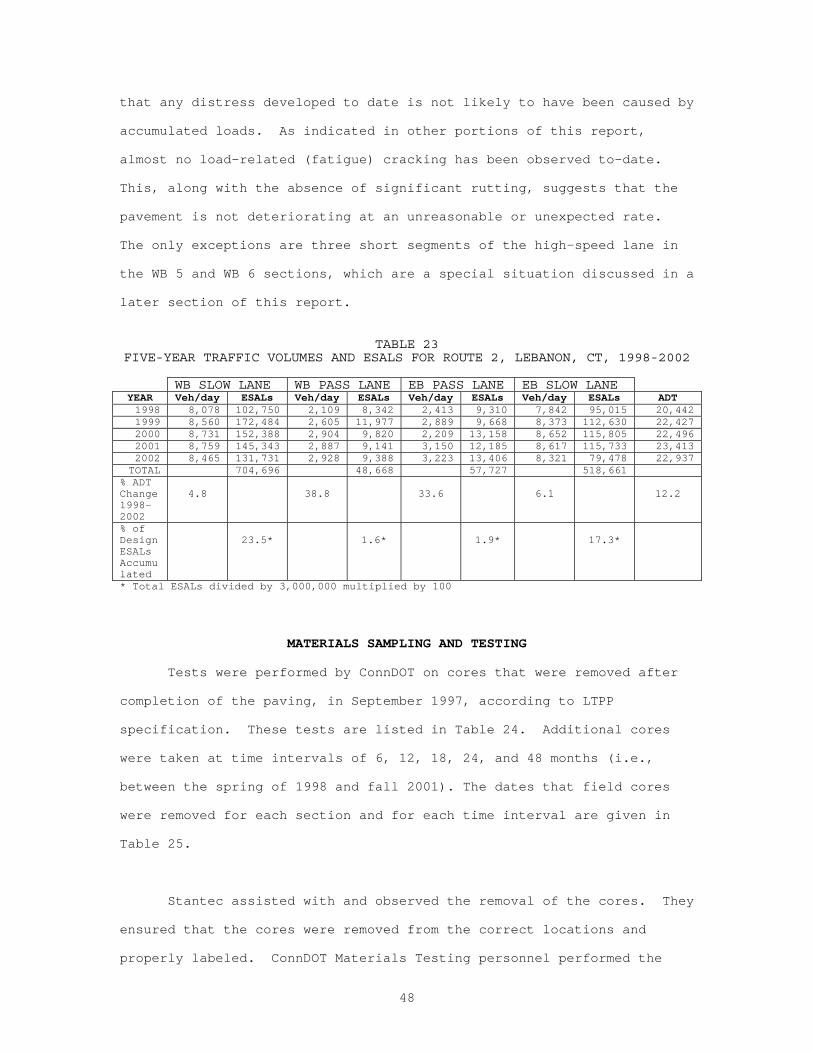
48
that any distress developed to date is not likely to have been caused by
accumulated loads. As indicated in other portions of this report,
almost no load-related (fatigue) cracking has been observed to-date.
This, along with the absence of significant rutting, suggests that the
pavement is not deteriorating at an unreasonable or unexpected rate.
The only exceptions are three short segments of the high-speed lane in
the WB 5 and WB 6 sections, which are a special situation discussed in a
later section of this report.
TABLE 23
FIVE-YEAR TRAFFIC VOLUMES AND ESALS FOR ROUTE 2, LEBANON, CT, 1998-2002
WB SLOW LANE WB PASS LANE EB PASS LANE EB SLOW LANE YEAR Veh/day ESALs Veh/day ESALs Veh/day ESALs Veh/day ESALs ADT 1998 8,078 102,750 2,109 8,342 2,413 9,310 7,842 95,015 20,442 1999 8,560 172,484 2,605 11,977 2,889 9,668 8,373 112,630 22,427 2000 8,731 152,388 2,904 9,820 2,209 13,158 8,652 115,805 22,496 2001 8,759 145,343 2,887 9,141 3,150 12,185 8,617 115,733 23,413 2002 8,465 131,731 2,928 9,388 3,223 13,406 8,321 79,478 22,937
TOTAL 704,696 48,668 57,727 518,661 % ADT Change 1998-2002
4.8
38.8
33.6
6.1
12.2
% of Design ESALs Accumulated
23.5*
1.6*
1.9*
17.3*
* Total ESALs divided by 3,000,000 multiplied by 100
MATERIALS SAMPLING AND TESTING
Tests were performed by ConnDOT on cores that were removed after
completion of the paving, in September 1997, according to LTPP
specification. These tests are listed in Table 24. Additional cores
were taken at time intervals of 6, 12, 18, 24, and 48 months (i.e.,
between the spring of 1998 and fall 2001). The dates that field cores
were removed for each section and for each time interval are given in
Table 25.
Stantec assisted with and observed the removal of the cores. They
ensured that the cores were removed from the correct locations and
properly labeled. ConnDOT Materials Testing personnel performed the
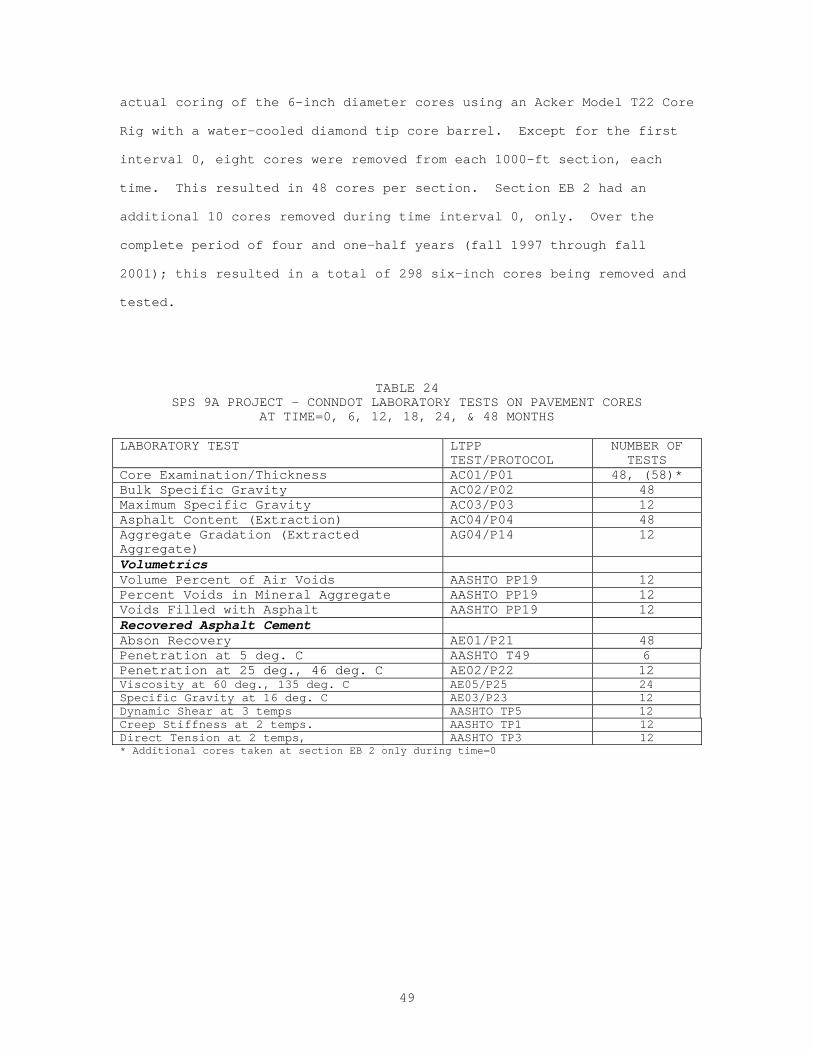
49
actual coring of the 6-inch diameter cores using an Acker Model T22 Core
Rig with a water-cooled diamond tip core barrel. Except for the first
interval 0, eight cores were removed from each 1000-ft section, each
time. This resulted in 48 cores per section. Section EB 2 had an
additional 10 cores removed during time interval 0, only. Over the
complete period of four and one-half years (fall 1997 through fall
2001); this resulted in a total of 298 six-inch cores being removed and
tested.
TABLE 24 SPS 9A PROJECT – CONNDOT LABORATORY TESTS ON PAVEMENT CORES
AT TIME=0, 6, 12, 18, 24, & 48 MONTHS
LABORATORY TEST LTPP TEST/PROTOCOL
NUMBER OF TESTS
Core Examination/Thickness AC01/P01 48, (58)* Bulk Specific Gravity AC02/P02 48 Maximum Specific Gravity AC03/P03 12 Asphalt Content (Extraction) AC04/P04 48 Aggregate Gradation (Extracted Aggregate)
AG04/P14 12
Volumetrics Volume Percent of Air Voids AASHTO PP19 12 Percent Voids in Mineral Aggregate AASHTO PP19 12 Voids Filled with Asphalt AASHTO PP19 12 Recovered Asphalt Cement Abson Recovery AE01/P21 48 Penetration at 5 deg. C AASHTO T49 6 Penetration at 25 deg., 46 deg. C AE02/P22 12 Viscosity at 60 deg., 135 deg. C AE05/P25 24 Specific Gravity at 16 deg. C AE03/P23 12 Dynamic Shear at 3 temps AASHTO TP5 12 Creep Stiffness at 2 temps. AASHTO TP1 12 Direct Tension at 2 temps, AASHTO TP3 12 * Additional cores taken at section EB 2 only during time=0
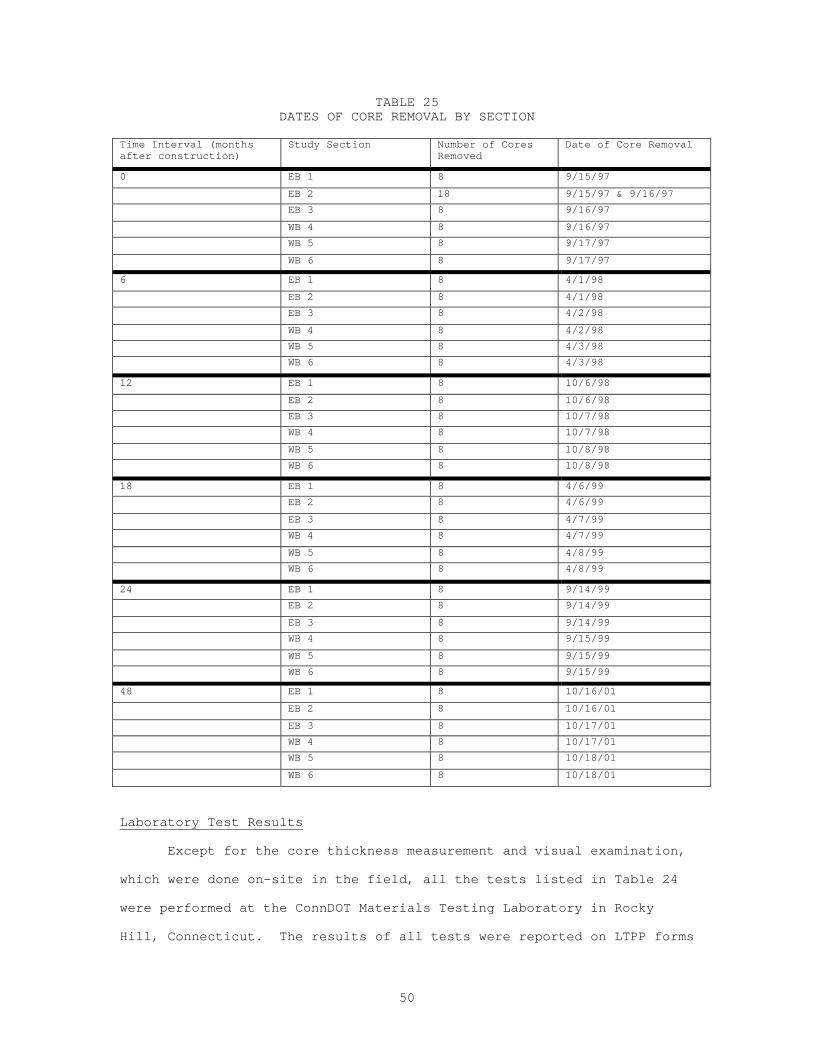
50
TABLE 25 DATES OF CORE REMOVAL BY SECTION
Time Interval (months after construction)
Study Section Number of Cores Removed
Date of Core Removal
0 EB 1 8 9/15/97
EB 2 18 9/15/97 & 9/16/97
EB 3 8 9/16/97
WB 4 8 9/16/97
WB 5 8 9/17/97
WB 6 8 9/17/97
6 EB 1 8 4/1/98
EB 2 8 4/1/98
EB 3 8 4/2/98
WB 4 8 4/2/98
WB 5 8 4/3/98
WB 6 8 4/3/98
12 EB 1 8 10/6/98
EB 2 8 10/6/98
EB 3 8 10/7/98
WB 4 8 10/7/98
WB 5 8 10/8/98
WB 6 8 10/8/98
18 EB 1 8 4/6/99
EB 2 8 4/6/99
EB 3 8 4/7/99
WB 4 8 4/7/99
WB 5 8 4/8/99
WB 6 8 4/8/99
24 EB 1 8 9/14/99
EB 2 8 9/14/99
EB 3 8 9/14/99
WB 4 8 9/15/99
WB 5 8 9/15/99
WB 6 8 9/15/99
48 EB 1 8 10/16/01
EB 2 8 10/16/01
EB 3 8 10/17/01
WB 4 8 10/17/01
WB 5 8 10/18/01
WB 6 8 10/18/01
Laboratory Test Results
Except for the core thickness measurement and visual examination,
which were done on-site in the field, all the tests listed in Table 24
were performed at the ConnDOT Materials Testing Laboratory in Rocky
Hill, Connecticut. The results of all tests were reported on LTPP forms
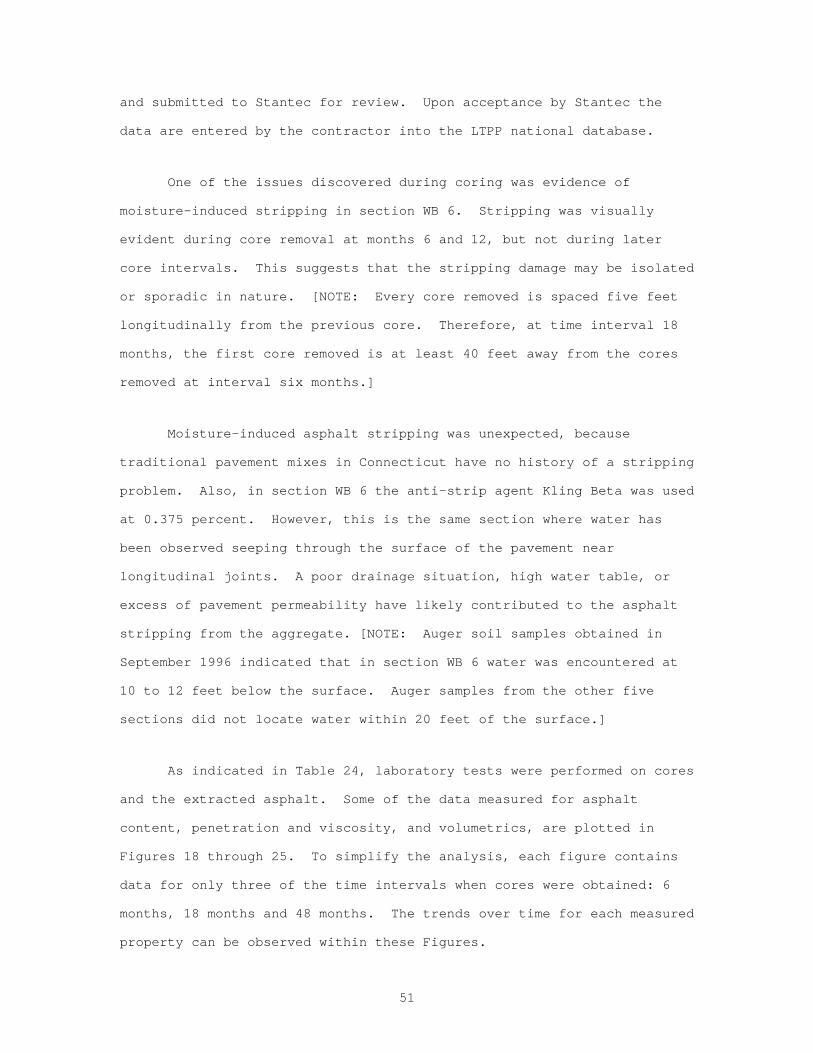
51
and submitted to Stantec for review. Upon acceptance by Stantec the
data are entered by the contractor into the LTPP national database.
One of the issues discovered during coring was evidence of
moisture-induced stripping in section WB 6. Stripping was visually
evident during core removal at months 6 and 12, but not during later
core intervals. This suggests that the stripping damage may be isolated
or sporadic in nature. [NOTE: Every core removed is spaced five feet
longitudinally from the previous core. Therefore, at time interval 18
months, the first core removed is at least 40 feet away from the cores
removed at interval six months.]
Moisture-induced asphalt stripping was unexpected, because
traditional pavement mixes in Connecticut have no history of a stripping
problem. Also, in section WB 6 the anti-strip agent Kling Beta was used
at 0.375 percent. However, this is the same section where water has
been observed seeping through the surface of the pavement near
longitudinal joints. A poor drainage situation, high water table, or
excess of pavement permeability have likely contributed to the asphalt
stripping from the aggregate. [NOTE: Auger soil samples obtained in
September 1996 indicated that in section WB 6 water was encountered at
10 to 12 feet below the surface. Auger samples from the other five
sections did not locate water within 20 feet of the surface.]
As indicated in Table 24, laboratory tests were performed on cores
and the extracted asphalt. Some of the data measured for asphalt
content, penetration and viscosity, and volumetrics, are plotted in
Figures 18 through 25. To simplify the analysis, each figure contains
data for only three of the time intervals when cores were obtained: 6
months, 18 months and 48 months. The trends over time for each measured
property can be observed within these Figures.
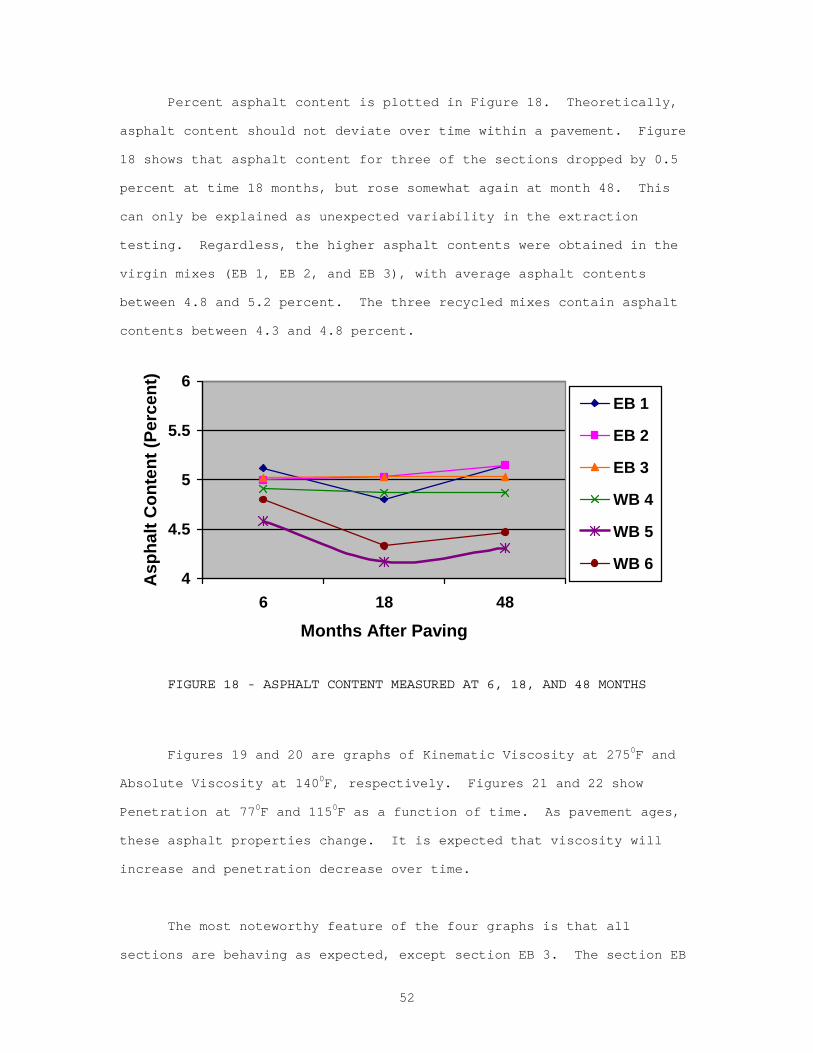
52
Percent asphalt content is plotted in Figure 18. Theoretically,
asphalt content should not deviate over time within a pavement. Figure
18 shows that asphalt content for three of the sections dropped by 0.5
percent at time 18 months, but rose somewhat again at month 48. This
can only be explained as unexpected variability in the extraction
testing. Regardless, the higher asphalt contents were obtained in the
virgin mixes (EB 1, EB 2, and EB 3), with average asphalt contents
between 4.8 and 5.2 percent. The three recycled mixes contain asphalt
contents between 4.3 and 4.8 percent.
4
4.5
5
5.5
6
6 18 48
Months After Paving
Asp
halt
Con
tent
(Per
cent
)
EB 1
EB 2
EB 3
WB 4
WB 5
WB 6
FIGURE 18 - ASPHALT CONTENT MEASURED AT 6, 18, AND 48 MONTHS
Figures 19 and 20 are graphs of Kinematic Viscosity at 2750F and
Absolute Viscosity at 1400F, respectively. Figures 21 and 22 show
Penetration at 770F and 1150F as a function of time. As pavement ages,
these asphalt properties change. It is expected that viscosity will
increase and penetration decrease over time.
The most noteworthy feature of the four graphs is that all
sections are behaving as expected, except section EB 3. The section EB
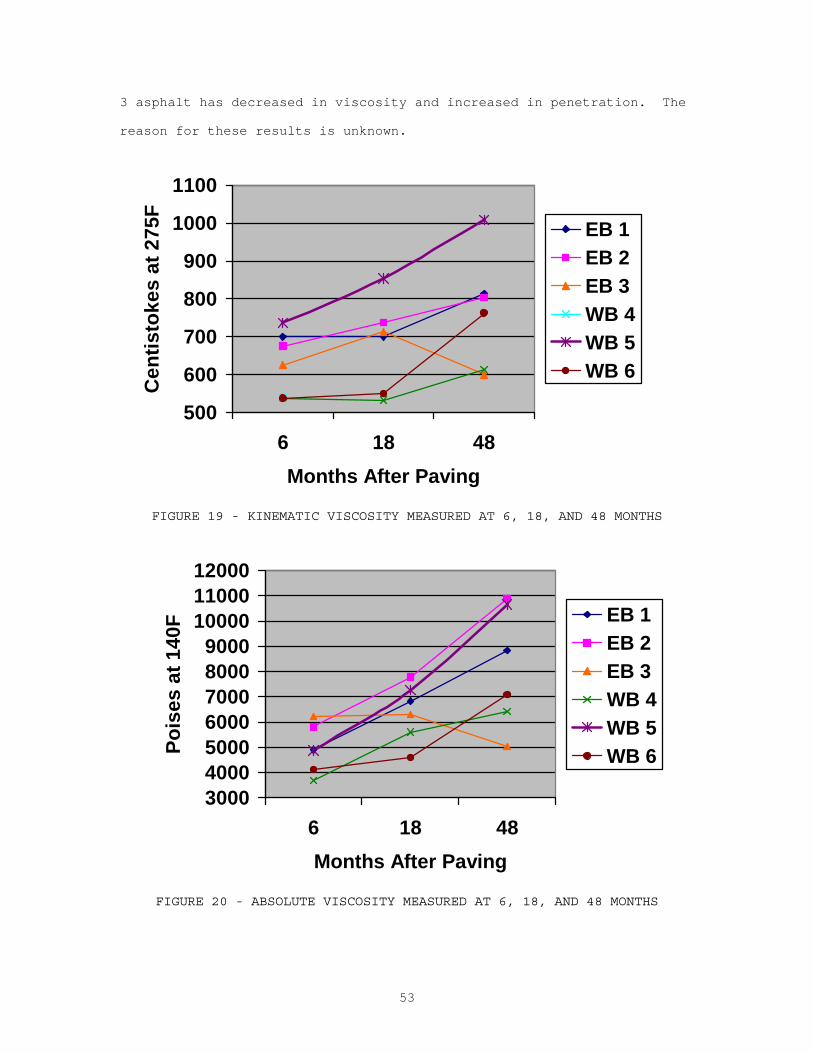
53
3 asphalt has decreased in viscosity and increased in penetration. The
reason for these results is unknown.
500
600
700
800
900
1000
1100
6 18 48Months After Paving
Cen
tisto
kes
at 2
75F
EB 1EB 2EB 3WB 4WB 5WB 6
FIGURE 19 - KINEMATIC VISCOSITY MEASURED AT 6, 18, AND 48 MONTHS
3000400050006000700080009000
100001100012000
6 18 48Months After Paving
Pois
es a
t 140
F EB 1EB 2EB 3WB 4WB 5WB 6
FIGURE 20 - ABSOLUTE VISCOSITY MEASURED AT 6, 18, AND 48 MONTHS
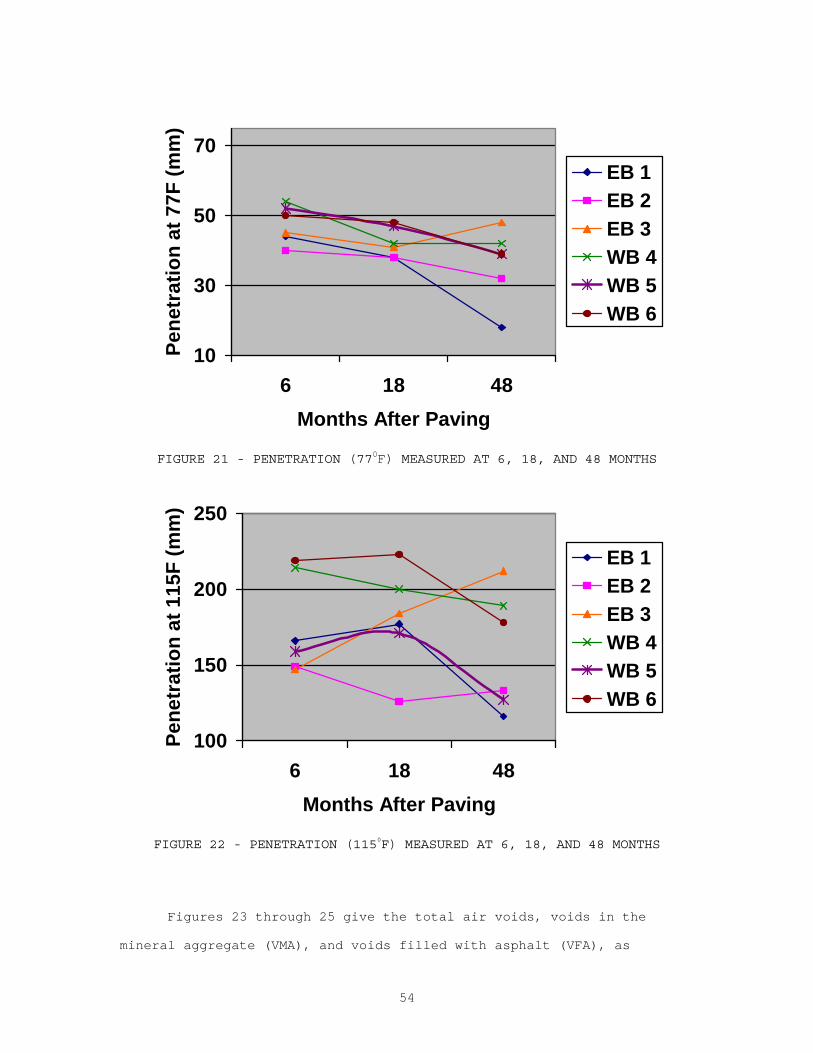
54
10
30
50
70
6 18 48Months After Paving
Pene
trat
ion
at 7
7F (m
m)
EB 1EB 2EB 3WB 4WB 5WB 6
FIGURE 21 - PENETRATION (770F) MEASURED AT 6, 18, AND 48 MONTHS
100
150
200
250
6 18 48Months After Paving
Pene
trat
ion
at 1
15F
(mm
)
EB 1EB 2EB 3WB 4WB 5WB 6
FIGURE 22 - PENETRATION (1150F) MEASURED AT 6, 18, AND 48 MONTHS
Figures 23 through 25 give the total air voids, voids in the
mineral aggregate (VMA), and voids filled with asphalt (VFA), as
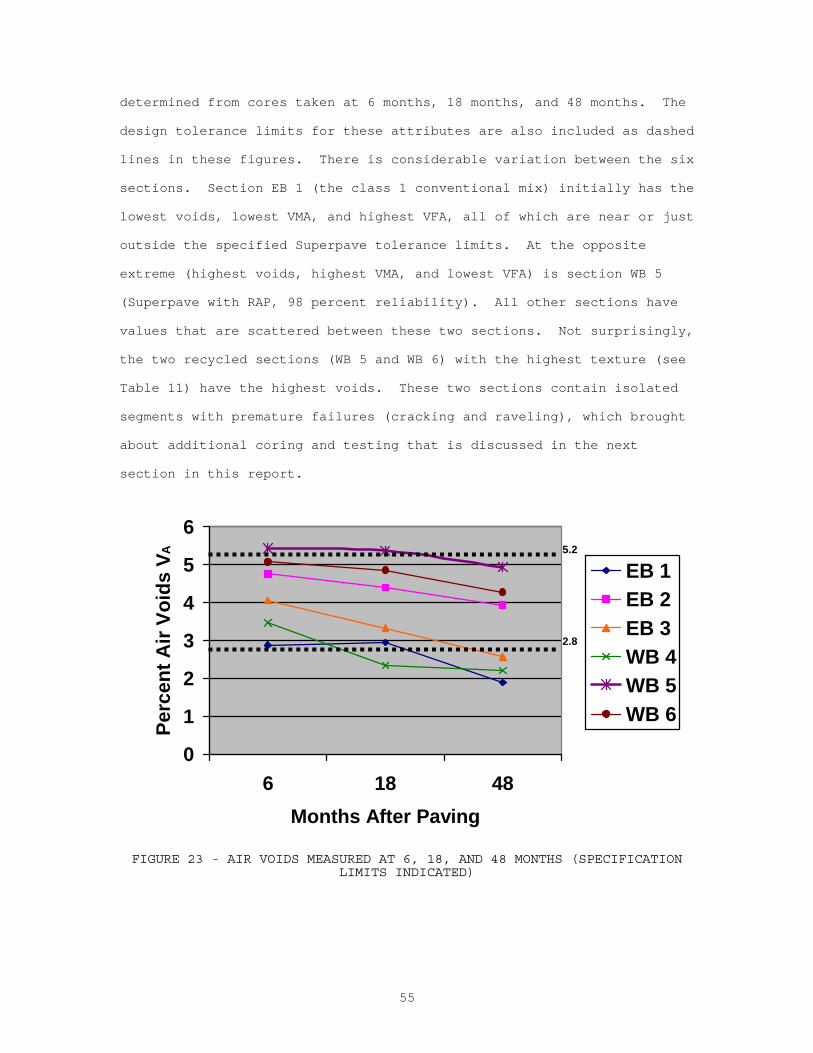
55
determined from cores taken at 6 months, 18 months, and 48 months. The
design tolerance limits for these attributes are also included as dashed
lines in these figures. There is considerable variation between the six
sections. Section EB 1 (the class 1 conventional mix) initially has the
lowest voids, lowest VMA, and highest VFA, all of which are near or just
outside the specified Superpave tolerance limits. At the opposite
extreme (highest voids, highest VMA, and lowest VFA) is section WB 5
(Superpave with RAP, 98 percent reliability). All other sections have
values that are scattered between these two sections. Not surprisingly,
the two recycled sections (WB 5 and WB 6) with the highest texture (see
Table 11) have the highest voids. These two sections contain isolated
segments with premature failures (cracking and raveling), which brought
about additional coring and testing that is discussed in the next
section in this report.
0
1
2
3
4
5
6
6 18 48Months After Paving
Perc
ent A
ir Vo
ids
V A EB 1EB 2EB 3WB 4WB 5WB 6
5.2
2.8
FIGURE 23 - AIR VOIDS MEASURED AT 6, 18, AND 48 MONTHS (SPECIFICATION
LIMITS INDICATED)
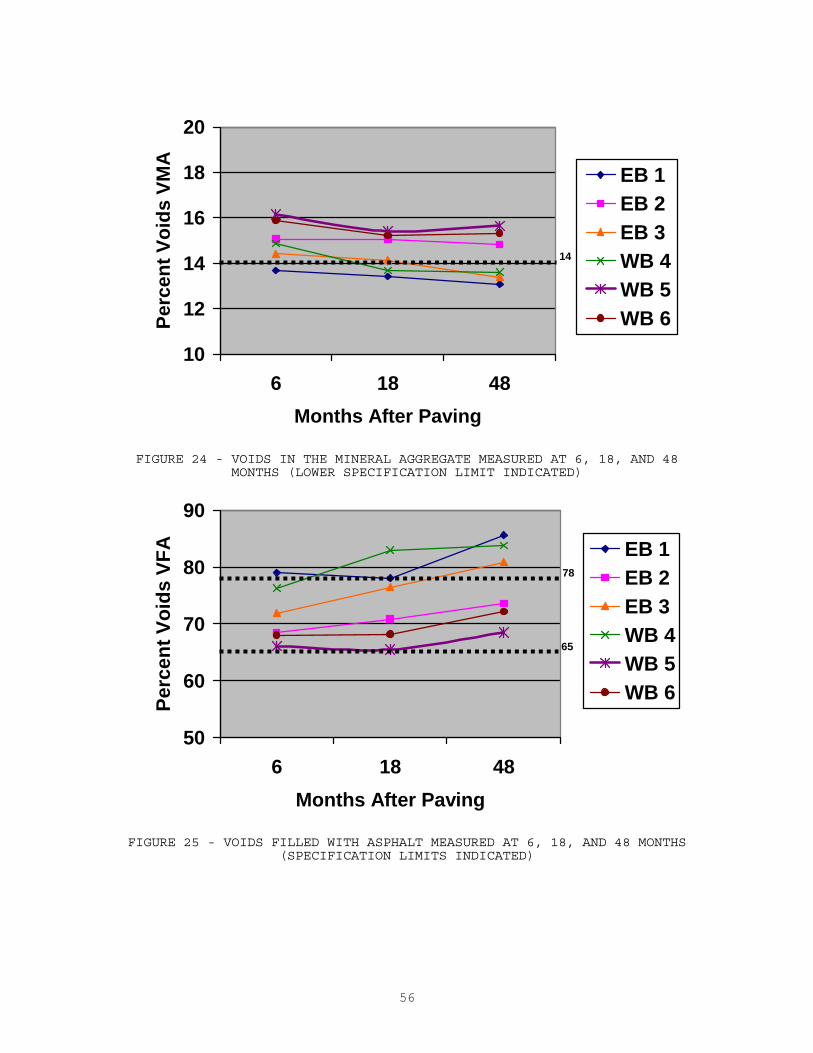
56
10
12
14
16
18
20
6 18 48Months After Paving
Perc
ent V
oids
VM
AEB 1EB 2EB 3WB 4WB 5WB 6
14
FIGURE 24 - VOIDS IN THE MINERAL AGGREGATE MEASURED AT 6, 18, AND 48
MONTHS (LOWER SPECIFICATION LIMIT INDICATED)
50
60
70
80
90
6 18 48Months After Paving
Perc
ent V
oids
VFA EB 1
EB 2EB 3WB 4WB 5WB 6
78
65
FIGURE 25 - VOIDS FILLED WITH ASPHALT MEASURED AT 6, 18, AND 48 MONTHS
(SPECIFICATION LIMITS INDICATED)
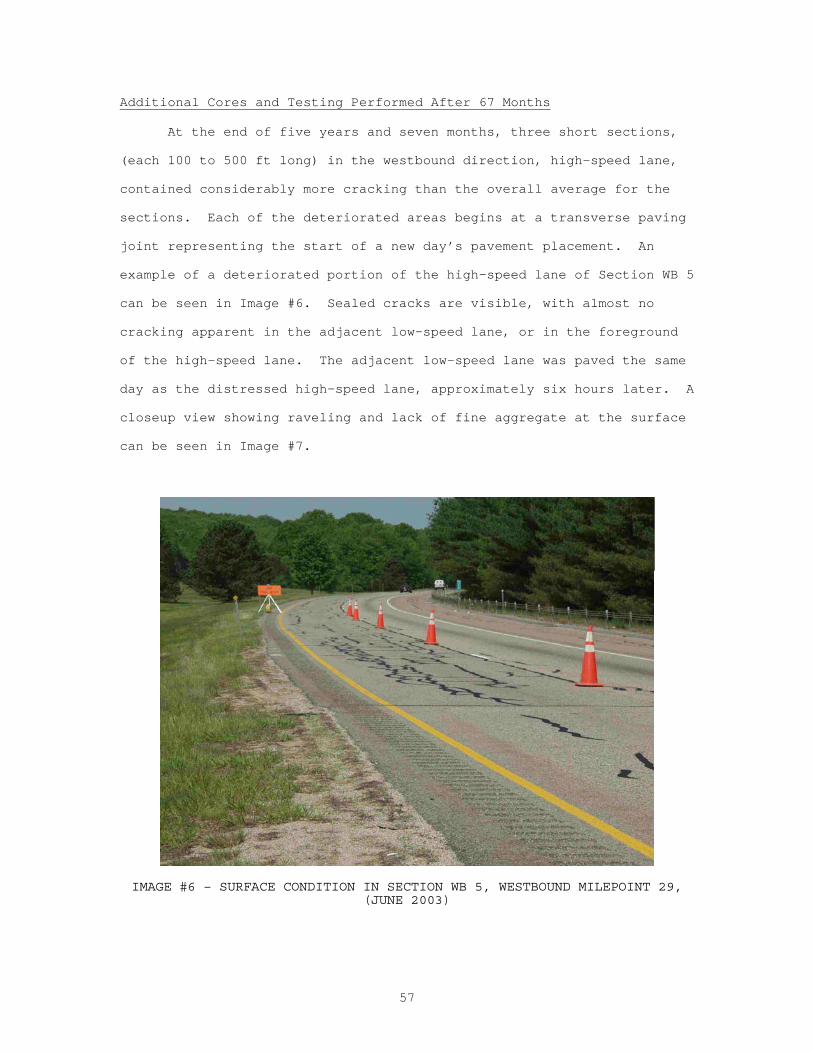
57
Additional Cores and Testing Performed After 67 Months
At the end of five years and seven months, three short sections,
(each 100 to 500 ft long) in the westbound direction, high-speed lane,
contained considerably more cracking than the overall average for the
sections. Each of the deteriorated areas begins at a transverse paving
joint representing the start of a new day’s pavement placement. An
example of a deteriorated portion of the high-speed lane of Section WB 5
can be seen in Image #6. Sealed cracks are visible, with almost no
cracking apparent in the adjacent low-speed lane, or in the foreground
of the high-speed lane. The adjacent low-speed lane was paved the same
day as the distressed high-speed lane, approximately six hours later. A
closeup view showing raveling and lack of fine aggregate at the surface
can be seen in Image #7.
IMAGE #6 – SURFACE CONDITION IN SECTION WB 5, WESTBOUND MILEPOINT 29, (JUNE 2003)
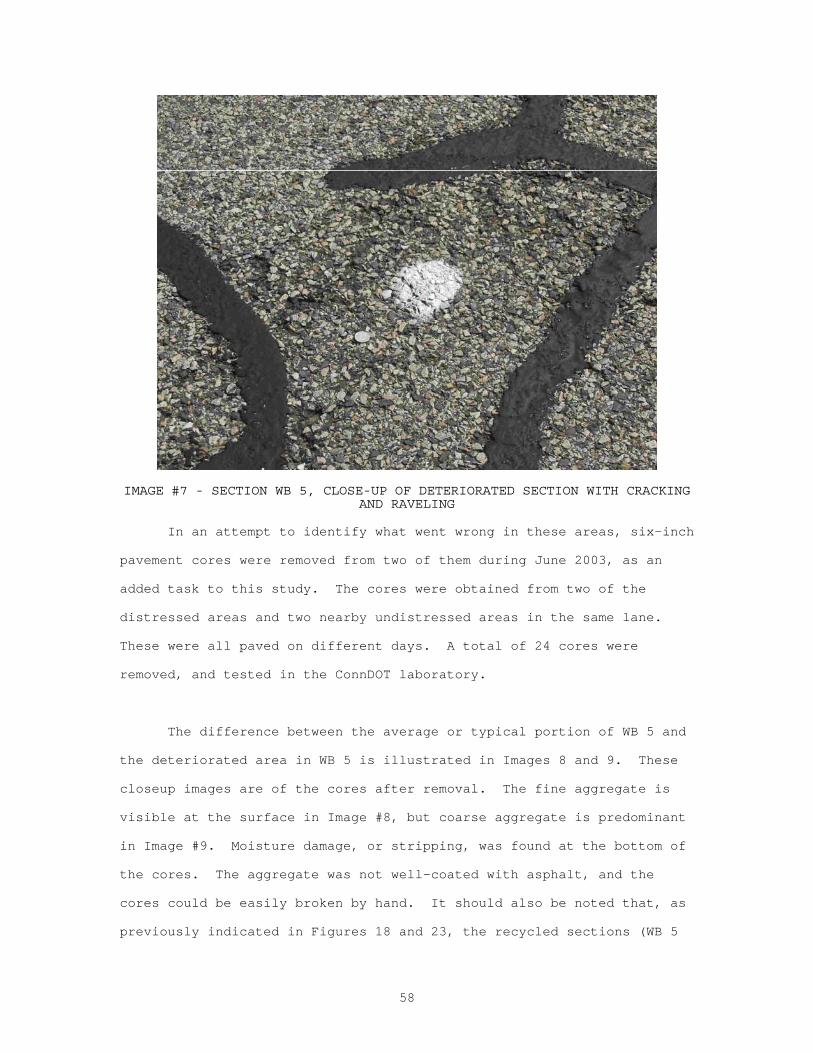
58
IMAGE #7 - SECTION WB 5, CLOSE-UP OF DETERIORATED SECTION WITH CRACKING AND RAVELING
In an attempt to identify what went wrong in these areas, six-inch
pavement cores were removed from two of them during June 2003, as an
added task to this study. The cores were obtained from two of the
distressed areas and two nearby undistressed areas in the same lane.
These were all paved on different days. A total of 24 cores were
removed, and tested in the ConnDOT laboratory.
The difference between the average or typical portion of WB 5 and
the deteriorated area in WB 5 is illustrated in Images 8 and 9. These
closeup images are of the cores after removal. The fine aggregate is
visible at the surface in Image #8, but coarse aggregate is predominant
in Image #9. Moisture damage, or stripping, was found at the bottom of
the cores. The aggregate was not well-coated with asphalt, and the
cores could be easily broken by hand. It should also be noted that, as
previously indicated in Figures 18 and 23, the recycled sections (WB 5
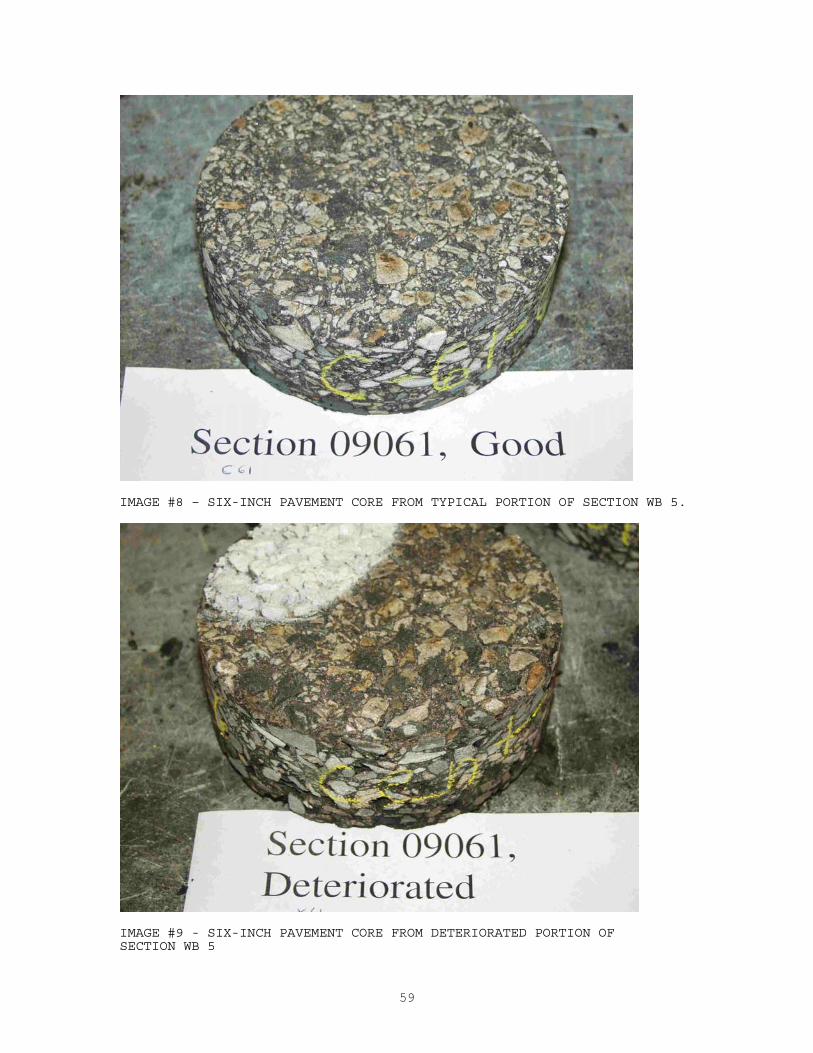
59
IMAGE #8 – SIX-INCH PAVEMENT CORE FROM TYPICAL PORTION OF SECTION WB 5.
IMAGE #9 - SIX-INCH PAVEMENT CORE FROM DETERIORATED PORTION OF SECTION WB 5
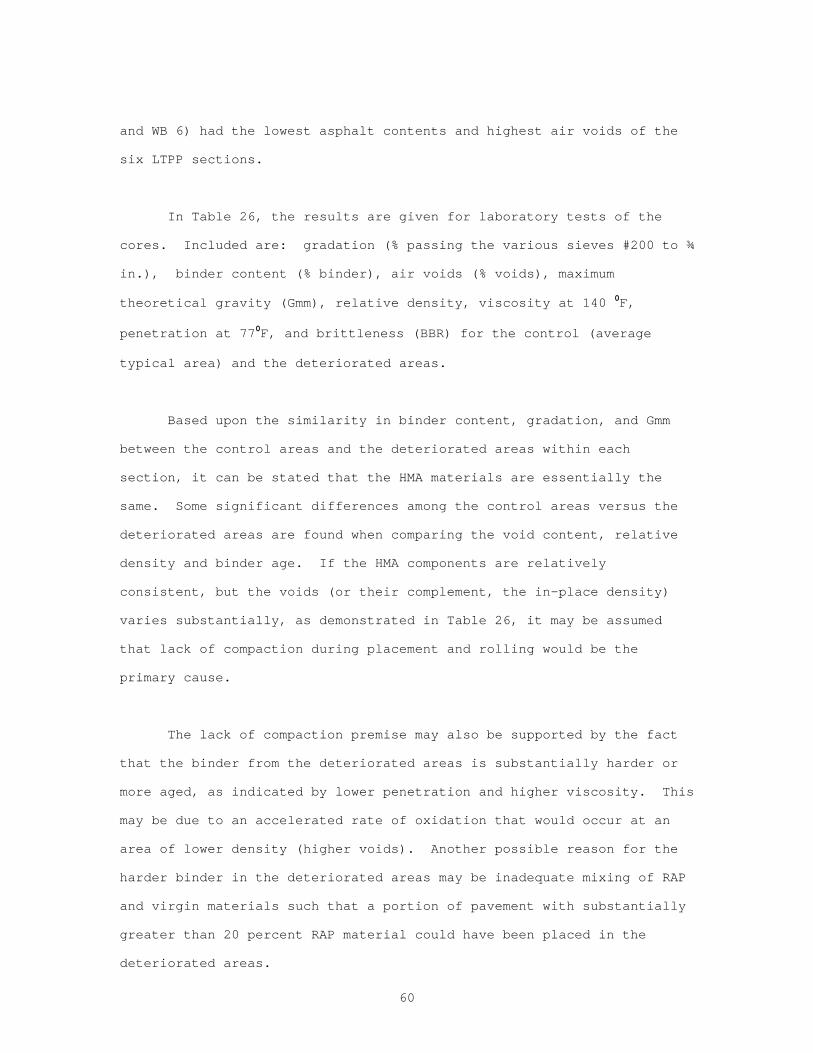
60
and WB 6) had the lowest asphalt contents and highest air voids of the
six LTPP sections.
In Table 26, the results are given for laboratory tests of the
cores. Included are: gradation (% passing the various sieves #200 to ¾
in.), binder content (% binder), air voids (% voids), maximum
theoretical gravity (Gmm), relative density, viscosity at 140 0F,
penetration at 770F, and brittleness (BBR) for the control (average
typical area) and the deteriorated areas.
Based upon the similarity in binder content, gradation, and Gmm
between the control areas and the deteriorated areas within each
section, it can be stated that the HMA materials are essentially the
same. Some significant differences among the control areas versus the
deteriorated areas are found when comparing the void content, relative
density and binder age. If the HMA components are relatively
consistent, but the voids (or their complement, the in-place density)
varies substantially, as demonstrated in Table 26, it may be assumed
that lack of compaction during placement and rolling would be the
primary cause.
The lack of compaction premise may also be supported by the fact
that the binder from the deteriorated areas is substantially harder or
more aged, as indicated by lower penetration and higher viscosity. This
may be due to an accelerated rate of oxidation that would occur at an
area of lower density (higher voids). Another possible reason for the
harder binder in the deteriorated areas may be inadequate mixing of RAP
and virgin materials such that a portion of pavement with substantially
greater than 20 percent RAP material could have been placed in the
deteriorated areas.
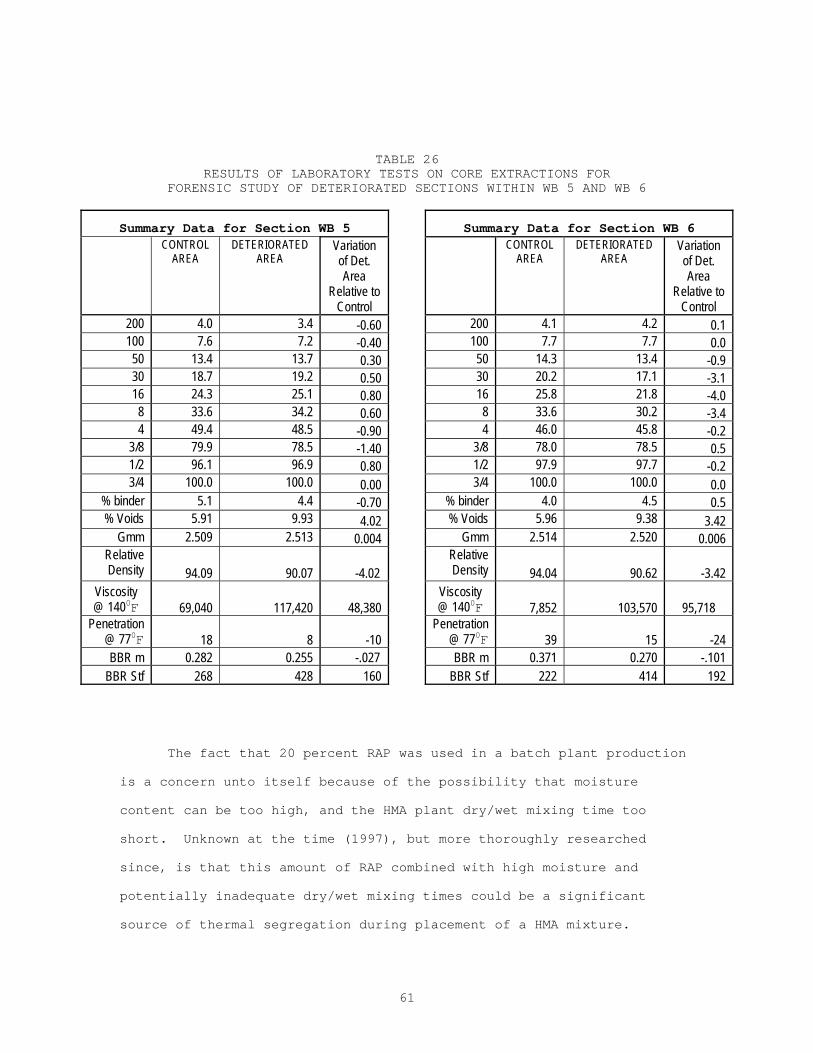
61
TABLE 26 RESULTS OF LABORATORY TESTS ON CORE EXTRACTIONS FOR
FORENSIC STUDY OF DETERIORATED SECTIONS WITHIN WB 5 AND WB 6
Summary Data for Section WB 5 Summary Data for Section WB 6 CONTROL
AREA DETERIORATED
AREA Variation of Det. Area
Relative to Control
CONTROL AREA
DETERIORATED AREA
Variation of Det. Area
Relative to Control
200 4.0 3.4 -0.60 200 4.1 4.2 0.1 100 7.6 7.2 -0.40 100 7.7 7.7 0.0 50 13.4 13.7 0.30 50 14.3 13.4 -0.9 30 18.7 19.2 0.50 30 20.2 17.1 -3.1 16 24.3 25.1 0.80 16 25.8 21.8 -4.0 8 33.6 34.2 0.60 8 33.6 30.2 -3.4 4 49.4 48.5 -0.90 4 46.0 45.8 -0.2
3/8 79.9 78.5 -1.40 3/8 78.0 78.5 0.5 1/2 96.1 96.9 0.80 1/2 97.9 97.7 -0.2 3/4 100.0 100.0 0.00 3/4 100.0 100.0 0.0
% binder 5.1 4.4 -0.70 % binder 4.0 4.5 0.5 % Voids 5.91 9.93 4.02 % Voids 5.96 9.38 3.42
Gmm 2.509 2.513 0.004 Gmm 2.514 2.520 0.006 Relative Density 94.09 90.07 -4.02
Relative Density 94.04 90.62 -3.42
Viscosity @ 1400F
69,040 117,420
48,380
Viscosity @ 1400F
7,852 103,570
95,718
Penetration @ 770F 18 8 -10
Penetration @ 770F 39 15 -24
BBR m 0.282 0.255 -.027 BBR m 0.371 0.270 -.101 BBR Stf 268 428 160 BBR Stf 222 414 192
The fact that 20 percent RAP was used in a batch plant production
is a concern unto itself because of the possibility that moisture
content can be too high, and the HMA plant dry/wet mixing time too
short. Unknown at the time (1997), but more thoroughly researched
since, is that this amount of RAP combined with high moisture and
potentially inadequate dry/wet mixing times could be a significant
source of thermal segregation during placement of a HMA mixture.
62
In summary, both the physical (high voids) and the symptomatic
effects (aged binder) on the pavements indicate that the primary trigger
for these isolated premature distressed areas was inadequate compaction.
The principle reason for the lack of compaction, whether it was caused
by inadequate rolling, poor RAP mixing, or thermal segregation due to
moisture and short dry/wet mixing times, is very difficult to isolate or
determine five years after placement.
SUMMARY AND CONCLUSIONS
Connecticut’s first full-scale Superpave project was constructed
on CT Route 2 between April and September 1997. Construction involved
three phases: removal of the existing surface course of ConnDOT Class
114 surface mix; placement of a leveling course of ConnDOT Class 2; and,
placement of the surface layer for the six sections. A construction
report published in December 1997 [1] documents various aspects of the
Superpave design, production, quality control testing, acceptance
testing, and placement.
The section of Route 2 selected for the SUPERPAVE study begins in
the town of Colchester and runs easterly for a distance of six miles
through the town of Lebanon and into Bozrah. Six two-mile sections
(both directions) were constructed during 1997: a control section
containing a standard agency mix design (EB 1), a SUPERPAVE design using
a PG asphalt with 98 percent reliability (EB 2), and a SUPERPAVE section
with PG asphalt offering 50 percent reliability (EB 3). All were placed
in the eastbound direction. Each of these three designs, but with 20
percent RAP, were also placed in the westbound direction, designated WB
1, WB 2, and WB 3 respectively.
63
“Post-construction” monitoring and testing began at the completion
of the paving, in late September 1997. Six-inch diameter pavement cores
were obtained by ConnDOT at multiple times, after project completion, of
0, 6, 12, 18, 24, and 48 months. The ConnDOT Research Division staff
performed friction testing of all six sections semi-annually, in the
spring and fall, from September 1997 through fall 2002. ConnDOT’s Data
Services Section staff from the Division of Research ran ConnDOT’s
Automatic Road Analyzer (ARAN) vehicle over the sections in September
1997 to collect roughness, cross slope, grade, curvature, transverse
profile (rut depths), and GPS data. These measurements were repeated on
an annual basis from 1998 through 2002, as part of normal photolog
inventories of Connecticut’s state maintained highways. Stantec (the
FHWA North Atlantic Region Long Term Pavement Performance (LTPP)
contractor) performed measurements of pavement deflection, transverse
and longitudinal profile, and distress, beginning in September 1997.
They will continue these measurements periodically through 2007 for the
LTPP program. These surveys were performed within specially designated
1000-ft LTPP monitoring sections. In addition to the distress surveys
performed by Stantec for the LTPP sections, ConnDOT research staff
performed manual surveys on three occasions, and used the Wisecrax
software from the ARAN survey on another occasion, for the full 24 lane-
miles of the study sections.
An acceptable friction level was measured throughout the five
years of study in the slow-speed lane. The ASTM smooth-tire friction
numbers indicate that during the five years there should have been no
potential for hydroplaning in any of the sections. Overall, the
reduction in friction number over the five-year period has been minimal;
a total average drop of only 6-9 FN40. There is a relatively
insignificant difference between any of the sections for the ASTM
ribbed-tire friction numbers. The two Superpave recycled sections (WB 5
64
and WB 6) showed a significantly higher surface texture compared to the
four other sections. The smooth tire numbers are higher for the two
recycled sections with the greater texture.
It appears that the condition of the underlying pavement is having
a much more significant influence on the performance of the surface than
is the mix design. All of the sections were milled, prior to paving,
but only the top layer of two inches placed in 1986 was removed.
Therefore, whatever cracks existed in 1986 in the original pavement
(placed in 1970), may be reflecting through the surface again in 2003.
Four types of cracking, transverse construction-joint cracking,
plain transverse cracking (shrinkage), longitudinal cracking (shrinkage
or load-related), and longitudinal construction joints were monitored
and summarized separately through the five years of study. By the end
in March 2003, it appears that there was very little difference between
any of the sections regarding quantity of transverse construction joint
cracks that had formed. More than half of the joints had developed
cracks. Construction joint quality is highly dependent upon the paving
crew and construction practices, and therefore, conclusions about
performance of mixes might not be justified on the basis of transverse
construction joint condition.
Transverse cracks not associated with construction joints were
also observed for the study. By the end of the study in March 2003, in
the low-speed lane, sections EB 1, EB 2, EB 3, and WB 4 had similar
amounts of transverse cracking. Section WB 5 (Superpave with 20 percent
RAP, 98 percent reliability design) had significantly less cracking, and
WB 6 (Superpave with 20 percent RAP, 50 percent reliability design) had
significantly more cracking than the other four sections. In the high-
speed lane, the results were different. Section EB 1 and WB 4 had
65
significantly less cracking than sections EB 2, EB 3, WB 5 and WB 6. In
both lanes, WB 6 contained more than double the amount of transverse
cracking of any other section. Although difficult to explain, this is
likely the result of reflections of existing conditions, where the
underlying conditions were much worse in the last mile of section WB 6
than anywhere else in the project.
From analysis of longitudinal construction-joint cracking it could
be concluded that the Superpave Virgin 98% reliability (Section EB 2)
pavement provided the longest lived cold joints thus far. Fifty percent
of the middle joint and only three percent of the right joint were
cracked after five years (six winters). The section with the most
longitudinal joint cracking was WB 4, recycled pavement conventional
class 1 mix (non-Superpave).
Most of the longitudinal cracks (i.e., non-joint associated)
observed within the travel lanes were outside of the wheel paths. They
appear to be somewhat random and were possibly reflection cracks from
underlying block cracking that existed in the 1970 pavement. The
recycled pavements contained more longitudinal cracking than the virgin
mixes, regardless of whether they are Superpave or conventional mixes.
However, the quantity of longitudinal cracking observed after five years
was relatively small for all of the six study sections. No section
contained longitudinal cracking for more than 12 percent of the section
length.
Rutting was not yet significant in any of the study sections. The
maximum rut depths measured after five years were 1/8 inch.
The variation in roughness between the left and right wheel paths
appears to be as significant as any differences between the various
66
sections. However, when data for the two wheel paths is averaged
together, it was obvious that the two roughest sections at approximately
73.5 and 71.9 in/mi. were EB 1 and WB 4, respectively. These are the
two conventional (non Superpave) mixes. The four Superpave mixes
contained roughness values of between 66.5 and 68.5 in/mi.
Since only five years had passed with only 25 percent of the
design ESALs accumulated in the worst case lane, it is expected that any
distress development should not be the result of fatigue. Since nearly
no load-related cracking had been observed, along with the absence of
significant rutting, it appears that the pavements are not deteriorating
at an unreasonable or unexpected rate. The only exception is for three
short segments of the high-speed lane in the WB 5 and WB 6 sections,
where short sections (100 to 500 feet long) of what may have been out-
of-specification or inadequately-rolled material had been placed.
From weather data obtained from NOAA stations in Connecticut, it
can be stated that the summers were somewhat warmer than normal, and the
winters were exceptionally milder than normal for the period 1997 -
2002. Warmer than normal winters would not be conducive to the
development of cold-temperature cracking, unless there were isolated
days with extremely low temperatures. The weather data does not show
this. In fact, the coldest temperature recorded in eastern Connecticut
between June 1997 and December 2002 was +2 0F in January 2000. The
PG64-22 asphalt is designated to resist cracking down to a minimum
temperature of -7.6 0F.
One item discovered during various coring operations was evidence
of moisture-induced asphalt stripping in section WB 6. Stripping was
visually evident during core removal at months 6 and 12, but not during
later core intervals. This suggests that the stripping damage may be
67
isolated or sporadic in nature. Some asphalt stripping was also
observed from cores taken at locations other than the 1000-ft LTPP
sections, within sections WB 5 and WB 6, in early June 2003.
In conclusion, the pavements are performing as would be expected
for overlays on a 27-year-old pavement structure. Thus far, there is no
notable difference between the conventional ConnDOT class 1 overlays and
the Superpave mixes. Most cracking that has occurred is assumed to be
reflection of underlying conditions. However, the mixes containing 20
percent RAP appear to be performing at a somewhat reduced level,
possibly due to higher air voids, increased permeability and water
seepage in areas with a high water table. Testing indicates these
sections also contain lower asphalt content.
IMPLEMENTATION OF FINDINGS
As a result of what was learned during design and construction of
Route 2, a number of changes were made to the ConnDOT Superpave Special
Provisions. ConnDOT continues the evolution toward implementation of
Quality Assurance specifications for HMA, where the contractor is
responsible for quality control.
Construction tolerances for gradation of the Superpave mixes used
on Route 2 were considerably tighter than those allowed with
conventional ConnDOT class 1 mixes. These were discussed in the
construction report [1]. It was concluded that the contractor had no
difficulty meeting the tighter gradation tolerances. As a result, the
special provisions developed for Superpave placed in years 2000 and
later continue to specify the stricter tolerances for material passing
the various sieve sizes. In addition, for year 2000 and later, the
68
tolerance for asphalt content has been reduced from +/- 1.5% to +/-
1.0%.
The control test strip used on Route 2 was 300 feet in length.
This was Connecticut’s first experience with test strips for HMA. It
was found that 300 feet was too short to be able to establish an
effective rolling pattern that consistently produced desired pavement
density. The test strip was changed to 600 ft in later special
provisions.
Although 20 percent RAP was used on Route 2, the use of RAP in
Superpave is now limited to a maximum of 10 percent. It must now be
crushed after milling so that 100 percent passes the 0.75-inch sieve.
The RAP must also be free from crack or joint sealant to the greatest
extent possible.
The Route 2 Superpave, and later Superpave mixes placed since
1999, indicated that permeability is a concern with some of the mix
designs. This has also been an issue in other states. Emphasis during
2003 is being placed on ways to reduce permeability, especially for
mixes that will be placed on bridges.
The latest Superpave special provisions allow for the pavement
designs to be within the previously defined “restricted zone” for
gradations, as long as good experience can be demonstrated.
Full implementation of Superpave in Connecticut continues
according to the schedule contained in Appendix A. After January 1,
2004, almost all paving on state-maintained roadways will be with
Superpave specifications.
69
REFERENCES
1. Larsen, D.A. and Rodrigues, N., “Demonstration and Evaluation
of SUPERPAVE Technologies: Construction report for Route 2,”
December 1997, ConnDOT.
2. Dougan, C.E., “Demonstration and Evaluation of SUPERPAVE
Technologies Project Proposal,” February 1996, ConnDOT.
3. Larsen, D.A., “Evaluation of Lightweight Non-Contact Profilers
for Use in Quality Assurance Specifications on Pavement
Smoothness,” December 1999, ConnDOT.
70
APPENDIX
Superpave Implementation Schedule
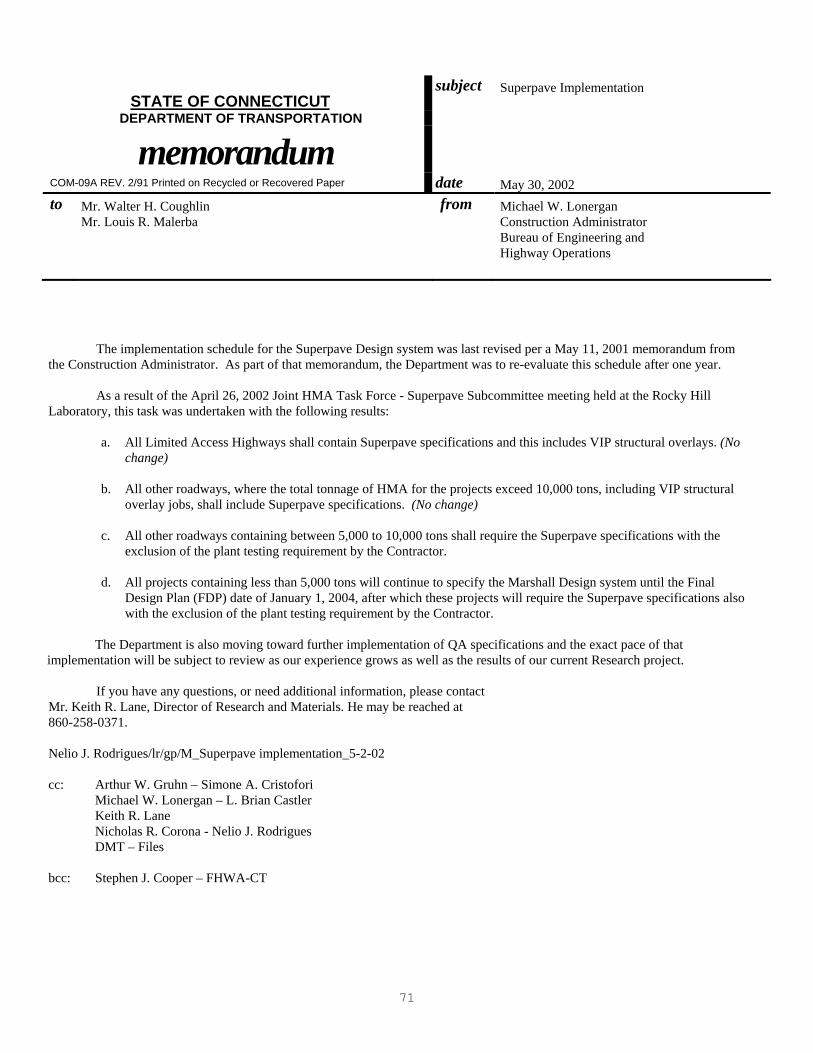
71
The implementation schedule for the Superpave Design system was last revised per a May 11, 2001 memorandum from the Construction Administrator. As part of that memorandum, the Department was to re-evaluate this schedule after one year. As a result of the April 26, 2002 Joint HMA Task Force - Superpave Subcommittee meeting held at the Rocky Hill Laboratory, this task was undertaken with the following results:
a. All Limited Access Highways shall contain Superpave specifications and this includes VIP structural overlays. (No change)
b. All other roadways, where the total tonnage of HMA for the projects exceed 10,000 tons, including VIP structural
overlay jobs, shall include Superpave specifications. (No change)
c. All other roadways containing between 5,000 to 10,000 tons shall require the Superpave specifications with the exclusion of the plant testing requirement by the Contractor.
d. All projects containing less than 5,000 tons will continue to specify the Marshall Design system until the Final Design Plan (FDP) date of January 1, 2004, after which these projects will require the Superpave specifications also with the exclusion of the plant testing requirement by the Contractor.
The Department is also moving toward further implementation of QA specifications and the exact pace of that
implementation will be subject to review as our experience grows as well as the results of our current Research project.
If you have any questions, or need additional information, please contact Mr. Keith R. Lane, Director of Research and Materials. He may be reached at 860-258-0371. Nelio J. Rodrigues/lr/gp/M_Superpave implementation_5-2-02 cc: Arthur W. Gruhn – Simone A. Cristofori Michael W. Lonergan – L. Brian Castler Keith R. Lane Nicholas R. Corona - Nelio J. Rodrigues DMT – Files bcc: Stephen J. Cooper – FHWA-CT
STATE OF CONNECTICUT subject Superpave Implementation
DEPARTMENT OF TRANSPORTATION
memorandum
COM-09A REV. 2/91 Printed on Recycled or Recovered Paper date May 30, 2002 to Mr. Walter H. Coughlin from Michael W. Lonergan Mr. Louis R. Malerba Construction Administrator Bureau of Engineering and Highway Operations