demographic determinants of economic growth in … · brics and selected developed countries ......
TRANSCRIPT
Demographic Determinants of Economic Growth in
BRICS and selected Developed Countries
By \
Tanima Basu Research Scholar
International Institute for Population Sciences (IIPS)
Mumbai, India
DebasisBarik Associate Fellow
National Council of Applied Economic Research (NCAER)
New Delhi, India
and
P. Arokiasamy Professor and Head
Department of Development Studies
International Institute for Population Sciences (IIPS)
Mumbai, India

Demographic Determinants of Economic Growth in
BRICS and selected Developed Countries
By
Tanima Basu1, Debasis Barik
2 and P. Arokiasamy
3
1Research Scholar, IIPS, Mumbai, India,
2 Associate Fellow, NCAER,
New Delhi, India, and 3 Professor and Head, Department of Development
Studies, IIPS, Mumbai, India
Presented in XXVII IUSSP International Population Conference (IUSSP
2013)26-31st August 2013 at BEXCO, Busan, Republic of Korea.
Abstract
The dynamics of world economic change has been interesting particularly for last 10-20
years as this period has seen rapid growth and improvement in economic, demographic and
health factors. This study tries to find out how far demographic component of deceasing
dependency ratio in BRICS countries is affecting efficiently in the growth of their economies
compared to few selected developed economies. The potential growth of BRICS economies is
largely dependent on its skill formation capacity of its population, particularly working age
population.
Key Words: BRICS, Population Growth, Economic Growth, Demographic Dividend
Introduction
The phenomenon of demographic transition is associated with a change in age structure due
to reduction in both mortality as well as fertility. Change in mortality leads the first phase of
the transition process, where the later part is guided by fertility decline. Many developed
countries are at the last stage of the demographic transition whereas most of the African
countries are at the second stage of it. Fortunately for many developing nations, the second to
third stage of demographic transition is associated with the stage of demographic dividend.
Demographic dividend is the window of opportunity to a nation for rapid economic growth
and human development if effective policies are implemented.
During the course of the demographic dividend there are four mechanisms that the benefits
are delivered through. The first is the increased labour supply. The magnitude of this benefit
depends on the ability of the economy to absorb and productively employ the extra workers.
The second is the increase in savings. As the number of dependents decreases individuals can
save more. This increase in national savings rates increases the stock of capital in developing
countries already facing shortages of capital and leads to higher productivity as the
accumulated capital is invested. The third mechanism is human capital. Decreases in fertility
rates result in healthier women and fewer economic burdens. This also allows parents to
invest more resources per child, leading to better health and educated people. The fourth
mechanism for growth is the increasing domestic demand brought about by the increasing
GDP (Gross Domestic Products) per capita and the decreasing dependency ratio.
The dynamics of world economic change has been interesting particularly for last 10-20 years
as this period has seen rapid growth and improvement in economic, demographic and health
factors. World economy has also faced extreme recession (second biggest after the great
depression in 1930s),the apparent US housing market turbulence metamorphosed into full
blown recession often called the ‘Great recession’ in late 2007. For last few years the world is
struggling to cope with the economic recession (started in 2007 and picked in September
2008) triggered by fall in US economy which caused large scale unemployment and resource
scarcity even in some of the world’s strongest developed economies and adversely affected
world economy as a whole. Some of the world’s big and strong economies like UK, USA,
Japan, and European countries were unable to encounter recession to a large extent and many
development plans were dropped during this period because of scarcity of resources.
At the same time some interesting economic observations attracted attention of economic
discussion. Amongst worldwide economic crisis generated by world financial recession
China and India stood as the nations which were least affected by it and showed an
appreciable rate of growth of GDP (Gross Domestic Product) in spite of world economic
slowdown. Economists are trying to find whether this growth is due to the sheer size and
hence population of these two big nations, or their less dependence on trade (particularly for
India) or any other factors. Even before China and India sustained world recession as the least
affected developing economy, a group of four countries (BRICs) were viewed as the future
economic power by some economic predictions. The acronym BRICs was coined in 2001 by
the Investment Bank Goldman Sachs to emphasise the economic growth potential of the
countries Brazil, Russian Federation, India and China (thus the name BRIC) in the coming
decades. Ever since then world economy has kept a vigilant eye on the growth path of these
countries. Along with the four countries South Africa has recently joined (2010) the group to
make it BRICS. The BRICS economies differ greatly in terms of their growth prospects. The
demographic trends, labour supply dynamics seem to remain favourable for Brazil, India and
South Africa. In Brazil, India and South Africa the working age population continues to
expand until the middle of the current century, hence the possibility of reaping demographic
dividend is present while in China it may decline after 2015 and in Russia it is already
declining. The relative and absolute economic importance of BRICS is expected to continue
to rise for the foreseeable future. It is estimated that BRICS will be one of the major players
in world economic scenario in next 30 years. By 2018 the cumulative GDP (US$) of BRICS
will overtake that of USA and is expected to overtake G7 countries by 2030.
The past decades (2000-2010) performance of BRICs shows its growth from share of one
sixth of global GDP to almost a quarter (in PPP terms) and has contributed over a third of
world GDP growth (50% of world GDP growth in last three years is contributed by BRICS).
According to the World Bank estimation (2010) China overtook Japan in its total GDP and
became second largest economy in the world (GDP in nominal value) followed by Brazil in
7th
, India in 9th
and Russian Federation in 11th
position. 1With almost 30% of world territory
and 45% of world population BRICS potential to emerge as an important global player in
economic field as well as in global political scenario is immense.
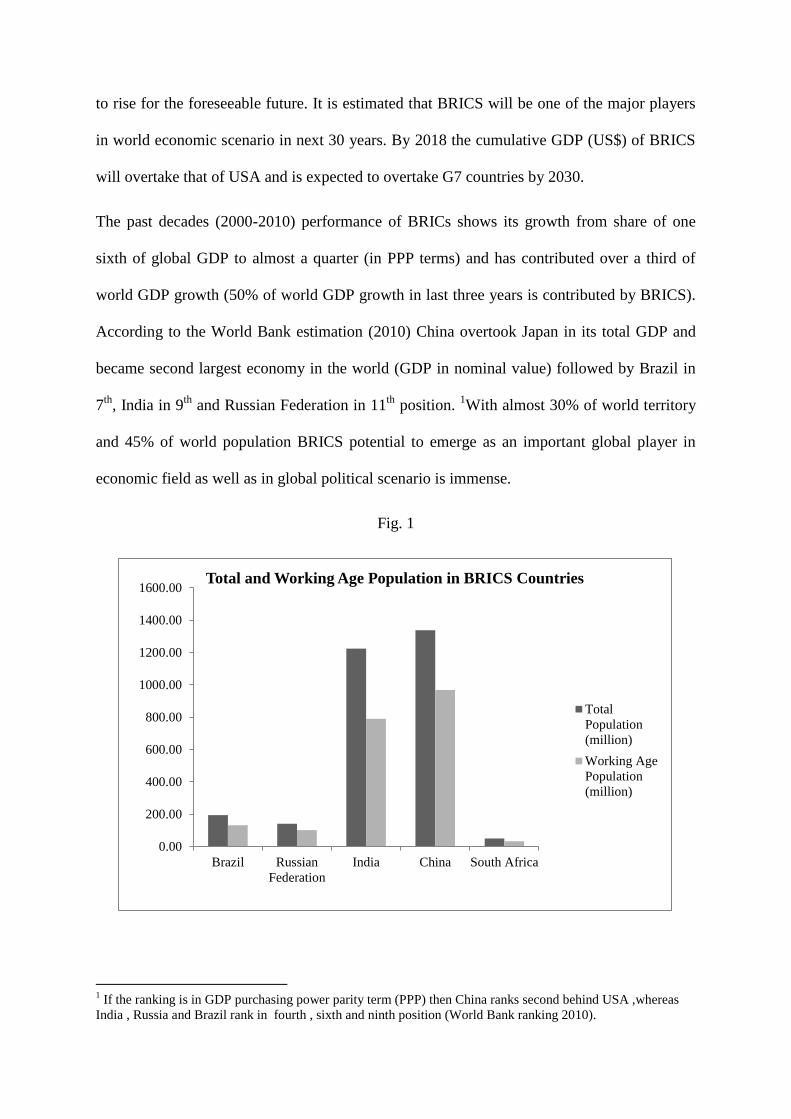
Fig. 1
1 If the ranking is in GDP purchasing power parity term (PPP) then China ranks second behind USA ,whereas
India , Russia and Brazil rank in fourth , sixth and ninth position (World Bank ranking 2010).
0.00
200.00
400.00
600.00
800.00
1000.00
1200.00
1400.00
1600.00
Brazil Russian
Federation
India China South Africa
Total and Working Age Population in BRICS Countries
Total
Population
(million)
Working Age
Population
(million)

Except Russian Federation all BRICS countries are developing economies and most of them
have a large number of working age population. From the estimates of United Nations World
Population Prospects (2010 Revision), Demographic Dividend due to Demographic
Transition currently taking place in these countries are likely to continue for at least another
30 years (except Russia). For China and Brazil the Demographic Window is expected till
2025 but for India it is projected longer until 2050 and in case of South Africa it is projected
for much longer duration. The potential for BRICS countries economic growth can be partly
attributed to the demographic dividend component. In this study an attempt is made to assess
how far the demographic dividend component is responsible for the economic growth of the
BRICS countries. To compare the potential for economic growth of BRICS, selected
developed nations (Japan, UK and USA) are also included in the analysis along with BRICS
countries.
Literature Review
Previous studies on the economic growth potential of developing nations are many but
studies of demographic impact on the economic growth are very limited. Particularly there
are large number of studies focussing on the future economic prospects (and hence market) of
the developing nation including African continent from purely business point of view.
Studies relating economic growth with demographic dividend component and prospects of
future growth as well as development in developing countries are limited. There have not
been many scientifically focussed studies to determine the effect of demographic variables on
economic growth focussing on comparative assessment of demographic dividend. Barro
(1991) had observed for 98 countries in the period 1960-1985, the growth rate of real per
capita GDP was positively related to initial human capital (proxied by 1960 school enrolment
rates) and negatively related to the initial (1960) level of real per capita GDP. Countries with
higher human capital also had lower fertility rates and higher ratios of physical investment to
GDP.
Lee et al. (1997) examined the growth and convergence in a multi country Solow Model.
The empirical analysis of the logarithm of per-capita output, in their paper indicates that data
for 102 countries over 30 years (1960-1989) strongly rejects the hypothesis that technology
growth rates are equal across countries. Bloom and Williamson study on East Asia (1998)
showed empirical analyses indicating that population growth had a purely transitional effect
on economic growth; this effect operated only when the dependent and working-age
populations were growing at different rates. From these results they concluded that future
demographic change would tend to depress growth rates in East Asia, while it would promote
more rapid economic growth in Southeast and South Asia. Bloom and Canning (2005)
studied global economic change and its economic significance. The per capita GDP growth
and productivity has been studied by Marattin and Salotti (2009). Bosworth et al. working
paper titled Sources of growth in the Indian economy examined the growth experience of
India during 1960-2004. Bloom, Canning (2010) studied effect of health and demographic
change on economic growth in China and India. In their study of cross-country model of
economic growth they track the growth take-off in China and India. The major contributors in
the take-off are improved health, increased openness to trade, rising labour force to
population ratio. Esterwood and Lipton (2011) studied demographic transition in Sub Saharan
Africa arising more from falling dependency than reduced natural increase, and could be
increased by accelerating the fertility decline.
Rationale and Research Questions
In this study we have tried to find out whether there are any relationships between economic
growth and demographic components like the bulging working age population share of

BRICS countries (except Russia). And if there are any causation between the two what
direction it is and how much the factor is affecting the economic growth or likely to affect in
future. To compare the prospects of future economic growth of the BRICS with developed
nations, three major world economic powers like Japan, UK and USA are taken in this
analysis.
In this study of BRICS countries and selected developed nations we have tried to address the
following questions
1. How demographic component is related with the GDP per capita growth rate.
2. What may be the other possible components that are contributing to the growth of GDP per
capita.
3. Whether there are any sectoral effects that is playing major role in this growth.
4. How far the Demographic Dividend component (which is also affecting the growth of
share of working age to total population) is responsible for the growth of GDP per capita in
the BRICS countries and what can be the future consequences of demographic window to the
growth of the economies.
5. Whether India has more potential to emerge as strong economic power amongst BRICS
countries in future.
Objectives
The specific objectives of the study are as follows
1. To examine comparative trends in demographic and economic variables in the BRICS
countries and selected developed nations.
2. To assess relative strength of economic and demographic variables of economic
growth in BRICS countries and the impact of demographic dividend on Economic
Growth.
3. To assess effects of economic vis-a-vis demographic factors and compare the
economic growth between BRICS countries and selected developed nations.
Data
For decomposition, data from World Development Indicators (WDI) of World Bank (2011)
have been taken. For the regression analysis, we have formed two panels of single year data
of eight countries (BRICS and Japan, UK, USA), from 1961 to 2009 and another from 1991-
2009. Data on GDP per capita and the ratio of investment to GDP are obtained from Penn
World Table Version 7.0 (Alan Heston, Robert Summers and Bettina Aten, Penn World
Table Version 7.0, Center for International Comparisons of Production, Income and Prices at
the University of Pennsylvania, May 2011)2.
The data on working age population (aged 15-64), total population, Life expectancy at birth,
Infant Mortality Rate and Under Five Mortality are taken from World Bank (2011)3.
Education data on average total years of schooling is taken from Barro and Lee (2000).
2 As stated by Bloom, Canning et al in their paper ’The contribution of population health and demographic
change to economic growth in China and India’ – Journal of Comparative Economics 38 (2010) Data on GDP
per capita (PPP) is more reliable in Penn World Table, hence that data has been taken for regression purposes.
3 World Development Indicators Data on demographic and employment variables are derived from sources such
as: (1) United Nations Population Division. World Population Prospects, (2) United Nations Statistical Division.
Population and Vital Statistics Report (various years), (3) Census reports and other statistical publications from
national statistical offices, (4) Eurostat: Demographic Statistics, (5) Secretariat of the Pacific Community:
Statistics and Demography Programme, (6) U.S. Census Bureau: International Database, Estimates Developed
by the UN Inter-agency Group for Child Mortality Estimation (UNICEF, WHO, World Bank, UN DESA,
UNPD), International Labour Organization, Key Indicators of the Labour Market database.
Methodology
In most of the economic literature economic growth of a country is measured by growth of
Gross National Product (GDP) per capita of that country (taken as a proxy of standard of
living). For comparing the economic growth of different countries GDP is measured in
Purchasing Power Parity (PPP) terms.
In our analysis we tried to find how far the change in per capita GDP (PPP) can be explained
by change in labour productivity, labour participation rate and working age to total
population ratio. Further we tried to find intersectoral change in productivity of the BRICS
countries and compare it with some of the Developed Nations like Japan, UK and USA.
Income per capita can be seen as the following identity
=
(1)
It implies GDP per capita (Y/N) is a product of income per worker or labour productivity
(Y/E), labour participation rate (E/WA) and ratio of working age to total population (WA/N)
where Y is total income (GDP), N is total population, E is the total number of employed and
WA is the working age population (aged 15-64). Now taking log to both sides of equation (1)
and differentiating the identity with respect to time (t) the following equation is obtained
4 (2)
Where y = log (Y/N), z = log (Y/E), e = log (E/WA) and w = log (WA/N) (3)
and
x is the growth rate of the variable x over time i.e.
x = dt
dx
x
1.
4 The most common approaches to solve this equation are either estimate the employment elasticity of growth
and TFP growth via growth regression or to calculate the employment elasticity of growth as the percentage
change in employment over the percentage change in GDP, or the partial elasticity of employment with respect
to growth. Both the approaches cannot capture the effect of change in labour force due to change in population
growth as employment elasticity of growth does not take into account changes in employment rate (E/WA)
rather only consider level of employment.
wezy
Growth of per capita GDP (PPP) has been decomposed5 into three factors: growth of output
per worker, growth linked to change in employment and growth of working age to total
population ratio and further in the study it is tried to find out the sectoral effects (three sectors
in the economy are taken - agriculture, industry and service) as well as effect of intersectoral
shifts.
In the next section of this study a panel data (1961-2009) of eight countries (BRICS and
Japan, UK, and USA) has been constructed to know the effect of selected independent
variables on the growth rate of per capita GDP. In cross-country growth studies, the concept
of Solow growth model (1956)6 is largely used. Here it is assumed that the production
function is same for all the countries and it is a constant return to scale production function
(like Cobb-Douglas Production Function: CDPF).
Cross country growth econometrics is largely based on the so called ‘convergence’ or
‘technology gap’ framework (Barro 1991, 1997; Kelly and Schmidt 2005, 2007). The
underlying concept is that economic growth is partly dependent on the speed of ‘catch-up’.
From the concept of steady-state equilibrium as stated in growth theory, a demography
oriented elaboration of the convergence frame work (see Barro-Sala-i-Martin 1995) can be
stated as: the rate of growth of productivity (here labour productivity ) depends on how far
productivity falls short of its steady-state value. If z0 is the initial level of output per worker
and z* steady-state value then
= λ (z*- z0), where λ is the speed of the convergence. (4)
5 For Decomposition we have used Shapely Decomposition Approach.
6Solow, Robert M. (1956). "A Contribution to the Theory of Economic Growth". Quarterly Journal of
Economics (The MIT Press) 70 (1): 65–94.
The steady-state level of output per worker depends on many factors like education level,
health, capital stock, political stability etc.
Now from previous equation (1) it can be written
y0 = z0 + e0 + w0 (5)
Incorporating equation (5) in (4) and using equation (2) the following equation is formed
= λ (z* + e0 +w0 – y0) + + (6)
Now it has been observed in literature for empirical purpose the effect of the labour
participation rate is not included and only the effect of the share of working age to total
population is included. Moreover, since the available data on labour participation is in 15+
age group and including that in calculation of labour participation rate may give some biased
results particularly since the old age labour participation rate (for 65+ population) varies
widely in these eight countries in this study it has opted to drop this effect from the regression
analysis. Hence the equation becomes
= λ (X*β +w0 – y0) + (7)
Where X is the range of variables that affect the steady-state level of output. In this study the
variables included are Investment to GDP ratio, Average total years of schooling, Life
Expectancy at Birth (LEB), and under five mortality rate (U5MR) (as proxies for health
variable). Equation (7) is similar in the form to a standard empirical growth regression.
Results
Decomposition of per capita growth of GDP
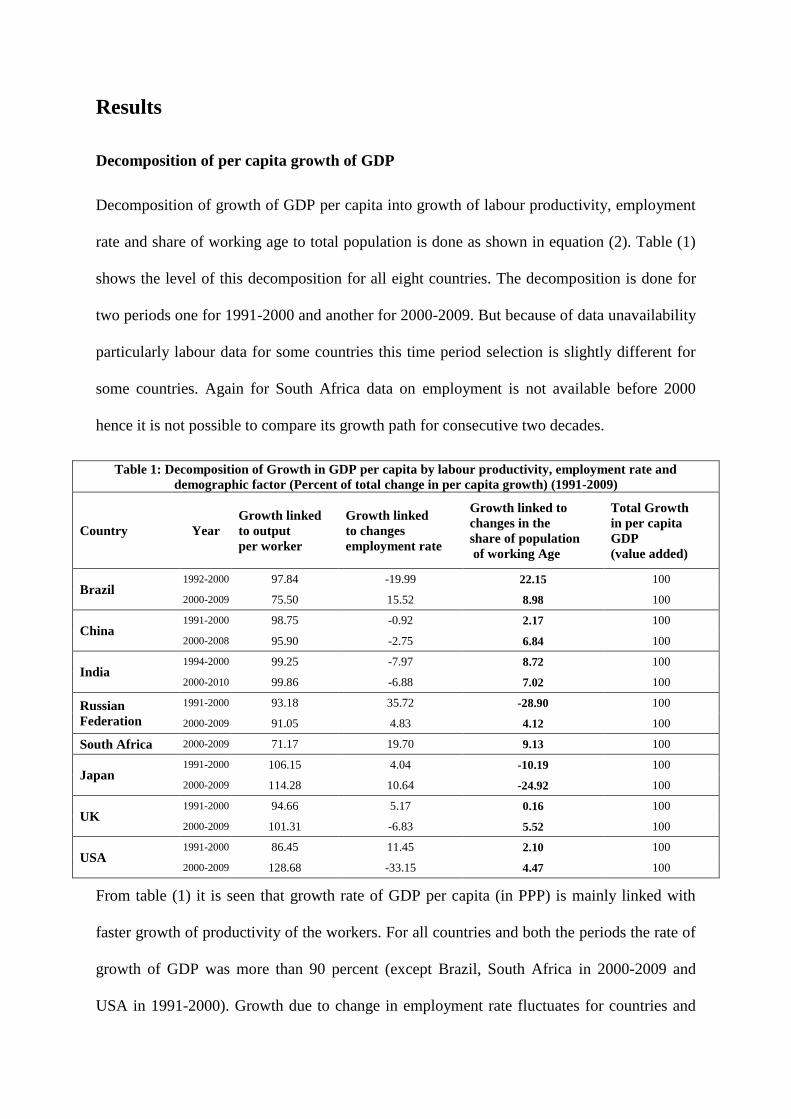
Decomposition of growth of GDP per capita into growth of labour productivity, employment
rate and share of working age to total population is done as shown in equation (2). Table (1)
shows the level of this decomposition for all eight countries. The decomposition is done for
two periods one for 1991-2000 and another for 2000-2009. But because of data unavailability
particularly labour data for some countries this time period selection is slightly different for
some countries. Again for South Africa data on employment is not available before 2000
hence it is not possible to compare its growth path for consecutive two decades.
Table 1: Decomposition of Growth in GDP per capita by labour productivity, employment rate and
demographic factor (Percent of total change in per capita growth) (1991-2009)
Country Year
Growth linked
to output
per worker
Growth linked
to changes
employment rate
Growth linked to
changes in the
share of population
of working Age
Total Growth
in per capita
GDP
(value added)
Brazil 1992-2000 97.84 -19.99 22.15 100
2000-2009 75.50 15.52 8.98 100
China 1991-2000 98.75 -0.92 2.17 100
2000-2008 95.90 -2.75 6.84 100
India 1994-2000 99.25 -7.97 8.72 100
2000-2010 99.86 -6.88 7.02 100
Russian
Federation
1991-2000 93.18 35.72 -28.90 100
2000-2009 91.05 4.83 4.12 100
South Africa 2000-2009 71.17 19.70 9.13 100
Japan 1991-2000 106.15 4.04 -10.19 100
2000-2009 114.28 10.64 -24.92 100
UK 1991-2000 94.66 5.17 0.16 100
2000-2009 101.31 -6.83 5.52 100
USA 1991-2000 86.45 11.45 2.10 100
2000-2009 128.68 -33.15 4.47 100
From table (1) it is seen that growth rate of GDP per capita (in PPP) is mainly linked with
faster growth of productivity of the workers. For all countries and both the periods the rate of
growth of GDP was more than 90 percent (except Brazil, South Africa in 2000-2009 and
USA in 1991-2000). Growth due to change in employment rate fluctuates for countries and
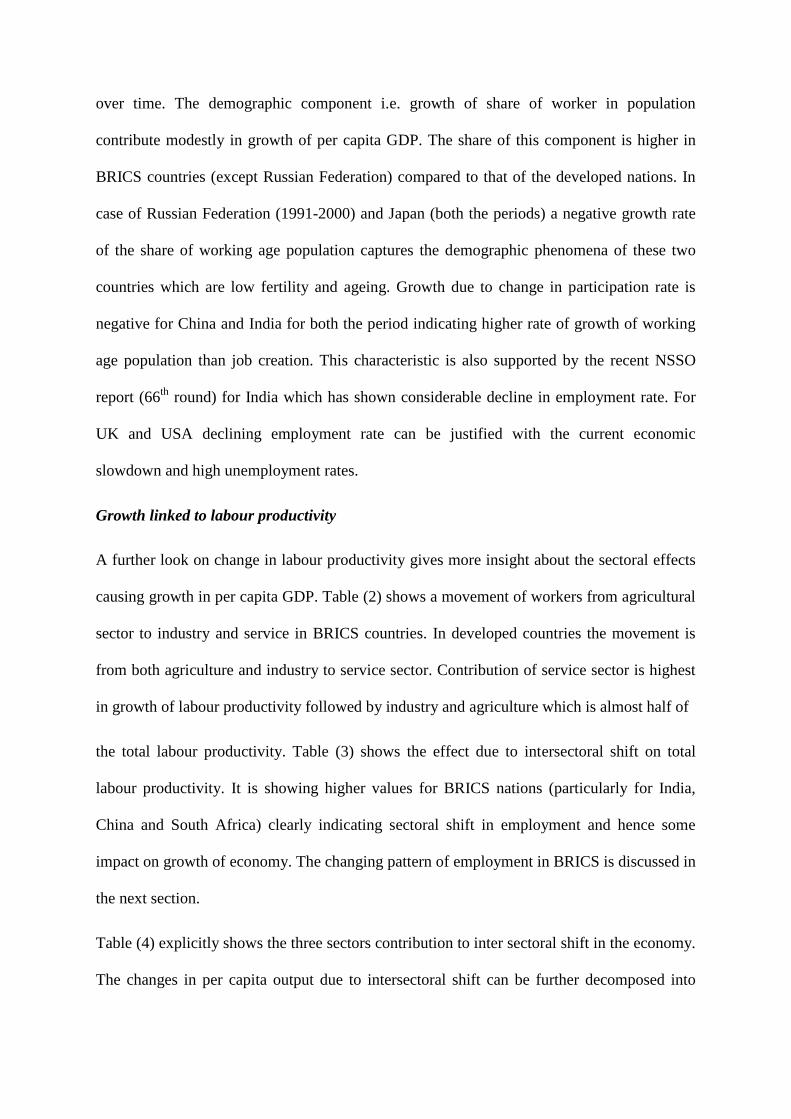
over time. The demographic component i.e. growth of share of worker in population
contribute modestly in growth of per capita GDP. The share of this component is higher in
BRICS countries (except Russian Federation) compared to that of the developed nations. In
case of Russian Federation (1991-2000) and Japan (both the periods) a negative growth rate
of the share of working age population captures the demographic phenomena of these two
countries which are low fertility and ageing. Growth due to change in participation rate is
negative for China and India for both the period indicating higher rate of growth of working
age population than job creation. This characteristic is also supported by the recent NSSO
report (66th
round) for India which has shown considerable decline in employment rate. For
UK and USA declining employment rate can be justified with the current economic
slowdown and high unemployment rates.
Growth linked to labour productivity
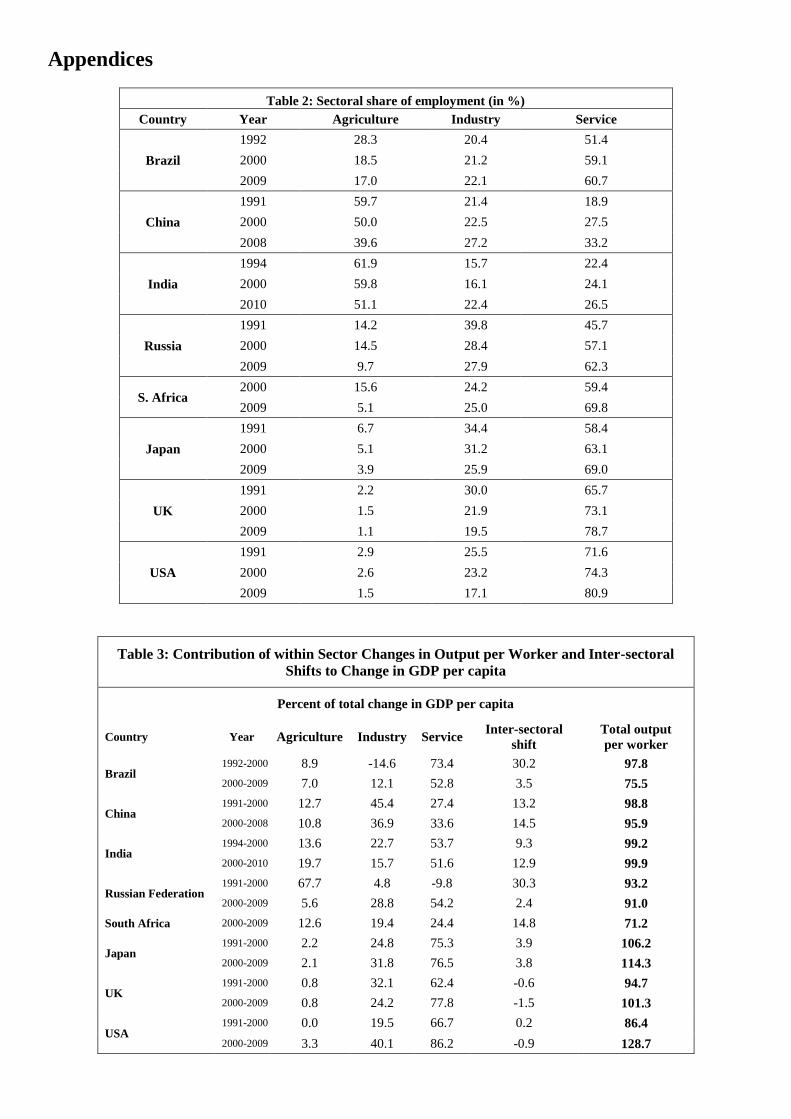
A further look on change in labour productivity gives more insight about the sectoral effects
causing growth in per capita GDP. Table (2) shows a movement of workers from agricultural
sector to industry and service in BRICS countries. In developed countries the movement is
from both agriculture and industry to service sector. Contribution of service sector is highest
in growth of labour productivity followed by industry and agriculture which is almost half of
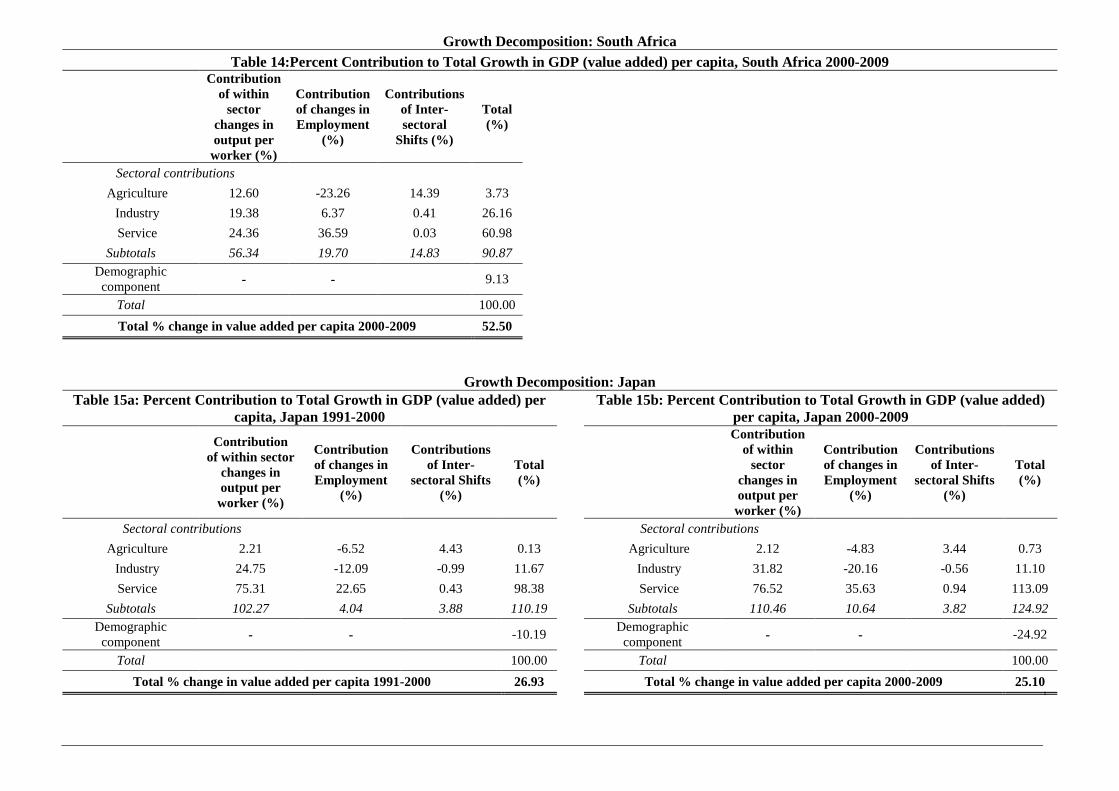
the total labour productivity. Table (3) shows the effect due to intersectoral shift on total
labour productivity. It is showing higher values for BRICS nations (particularly for India,
China and South Africa) clearly indicating sectoral shift in employment and hence some
impact on growth of economy. The changing pattern of employment in BRICS is discussed in
the next section.
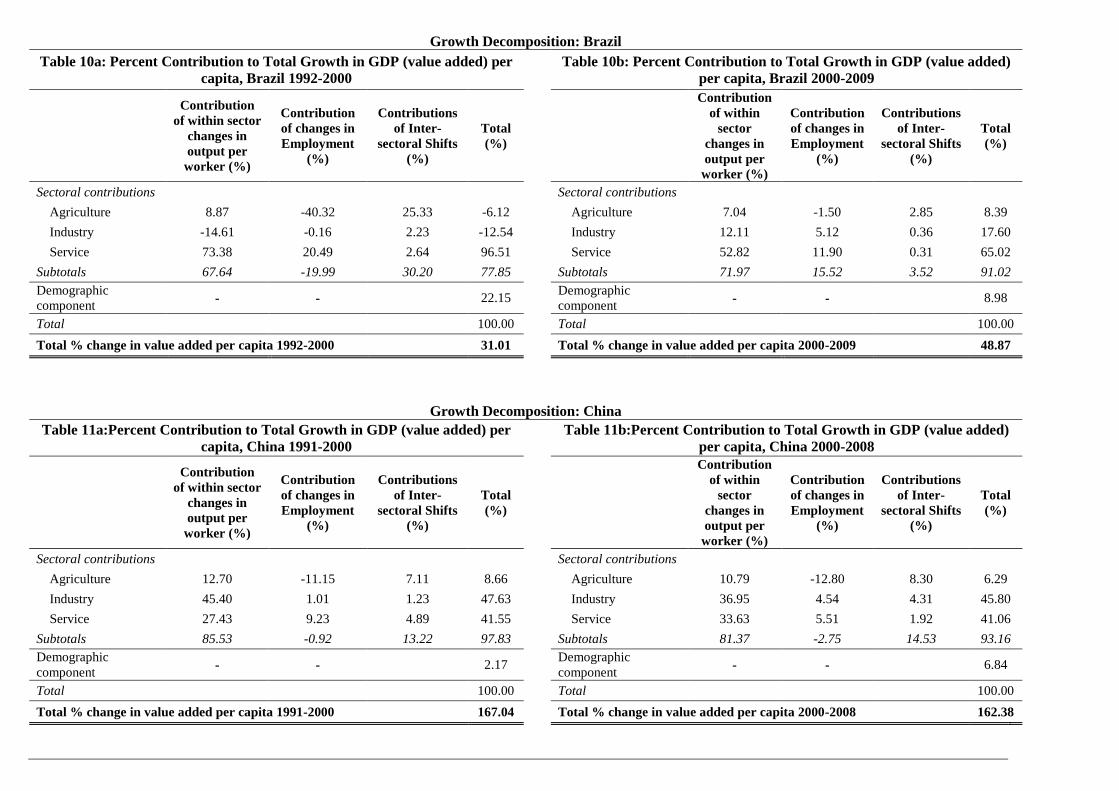
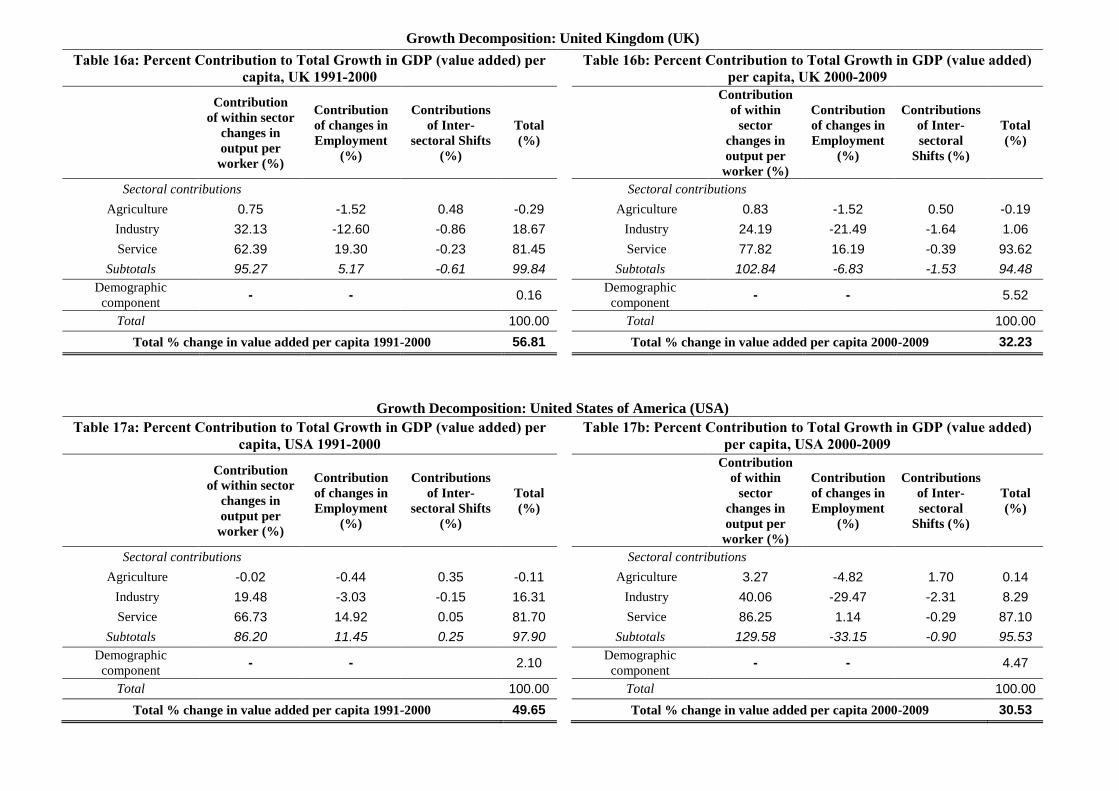
Table (4) explicitly shows the three sectors contribution to inter sectoral shift in the economy.
The changes in per capita output due to intersectoral shift can be further decomposed into

within sector shift. Agricultural sector contributes largely in intersectoral shift effect (as can
be seen from Table (4) the shift is largely from agriculture to other sector) implying structural
change in the pattern of employment in the economy. In 1994-2000 there is a large share of
service sector’s contribution in intersectoral shift in case of India justifying the fact that there
was an increase in tertiary sector employment rate and total productivity after liberalisation
happened (1991).
Growth linked to changes in employment rate
The effect of changes in growth of employment rate on growth of per capita output shows
rather mixed pattern. As explained earlier, employment rate indicates overall employment-
unemployment scenario in an economy. Table (5) shows overall decrease in employment in
agriculture sector for all countries over the last two decades consistent with the fact that as
economy develops,the share of agriculture employment in total employment falls because of
increasing capital intensive pattern of cultivation. Increase in employment in both industry
and service sectors are observed in last one decade for all BRICS countries. But this
improvement in secondary and tertiary sector employment failed to offset the decrease in
agriculture sector employment leading to overall fall in employment rate in China and India.
In other words it can be said that lack of skill formation left workers from agricultural sector
unable to find job in either industry or service sectors. From Table (6)contribution of
employment changes to overall change in per capita GDP can be observed. Per capita GDP
contributed by change in agriculture employment is decreasing over time for all nations. India
and China show a negative total contribution to growth rate of per capita GDP due to
employment change. It is the extension of the effect of decline in employment rate during
2000-2010. In case of UK and USA the effect of change in employment on per capita GDP
growth is the aftermath of global financial crisis leading sharp increase in unemployment and
eventually decreases in employment. It can be further observed that though effect of

employment change on per capita GDP growth is negative for all the four countries (India,
China, UK and USA) , agriculture contributes a major part in case of China and India
whereas industry contributes in case of UK and USA. It may be observed that the pattern of
effect in these two groups of countries is significantly different, for the developed countries
the negative effect is rather because of the temporary impact of world economic recession
whereas in case of the developing countries it addresses structural shift in employment. Once
recession is overcome by the developed nations, there are possibility that the change in
employment may have positive effects on change in per capita income (assuming it is
increasing), but it will be difficult for the developing nations to make the effect positive since
it will take some time for skill formation in the workers so that they can be absorbed in the
secondary or tertiary sectors.
Effects of Demographic variables on Economic Growth
From the above discussion, it is seen that decomposition approach addresses more structural
aspect of an economic growth but very little can be inferred about demographic component
measured by share of working age population in total population. Thereafter to understand
the effect of the demographic component on growth of per capita GDP , we use Barro panel
data regression model.
Results of Barro Panel Data Regression Model
In this study, a panel of countries (eight countries: Five countries of BRICS and three
developed economies Japan, UK and USA) is constructed taking yearly data on economic
and demographic variables from 1961 to 2009. Data for some variables in case of Russian
Federation is not available before 1990 (since it was formed in 1989). Hence a modified
panel of same countries with the annual observation of the variables from 1991 to 2009 is
constructed.
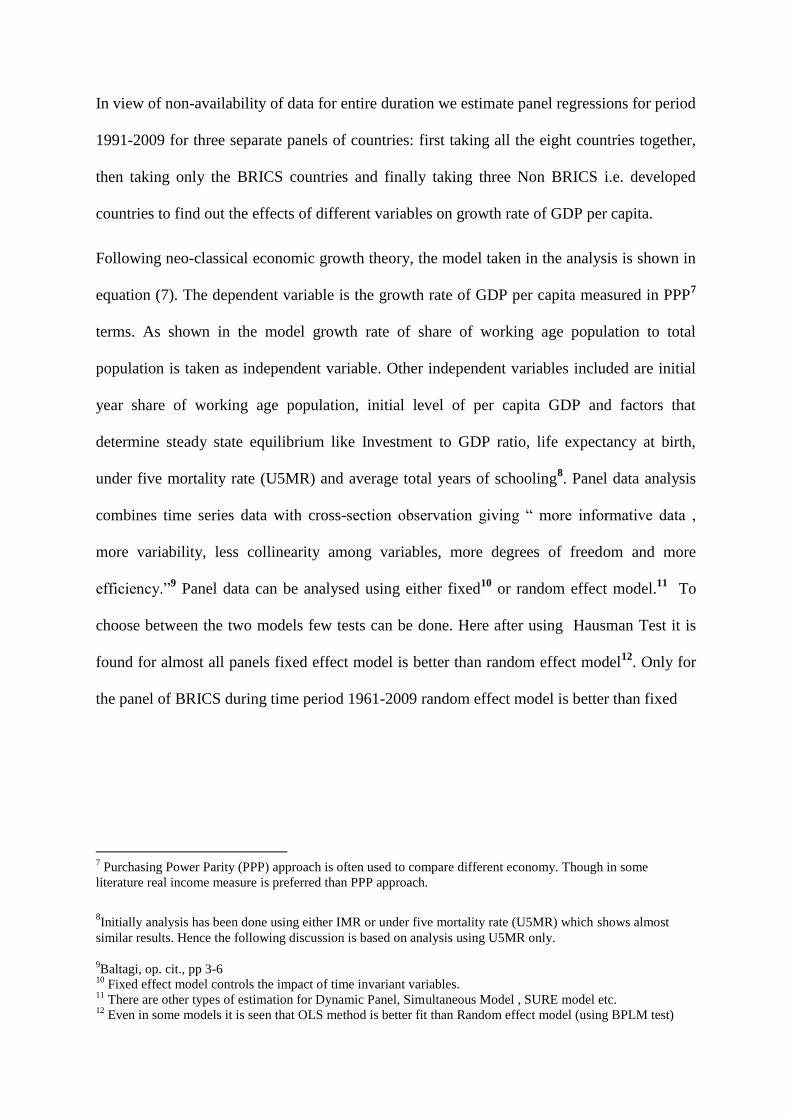
In view of non-availability of data for entire duration we estimate panel regressions for period
1991-2009 for three separate panels of countries: first taking all the eight countries together,
then taking only the BRICS countries and finally taking three Non BRICS i.e. developed
countries to find out the effects of different variables on growth rate of GDP per capita.
Following neo-classical economic growth theory, the model taken in the analysis is shown in
equation (7). The dependent variable is the growth rate of GDP per capita measured in PPP7
terms. As shown in the model growth rate of share of working age population to total
population is taken as independent variable. Other independent variables included are initial
year share of working age population, initial level of per capita GDP and factors that
determine steady state equilibrium like Investment to GDP ratio, life expectancy at birth,
under five mortality rate (U5MR) and average total years of schooling8. Panel data analysis
combines time series data with cross-section observation giving “ more informative data ,
more variability, less collinearity among variables, more degrees of freedom and more
efficiency.”9 Panel data can be analysed using either fixed
10 or random effect model.
11 To
choose between the two models few tests can be done. Here after using Hausman Test it is
found for almost all panels fixed effect model is better than random effect model12
. Only for
the panel of BRICS during time period 1961-2009 random effect model is better than fixed
7 Purchasing Power Parity (PPP) approach is often used to compare different economy. Though in some
literature real income measure is preferred than PPP approach.
8Initially analysis has been done using either IMR or under five mortality rate (U5MR) which shows almost
similar results. Hence the following discussion is based on analysis using U5MR only.
9Baltagi, op. cit., pp 3-6
10 Fixed effect model controls the impact of time invariant variables.
11 There are other types of estimation for Dynamic Panel, Simultaneous Model , SURE model etc.
12 Even in some models it is seen that OLS method is better fit than Random effect model (using BPLM test)
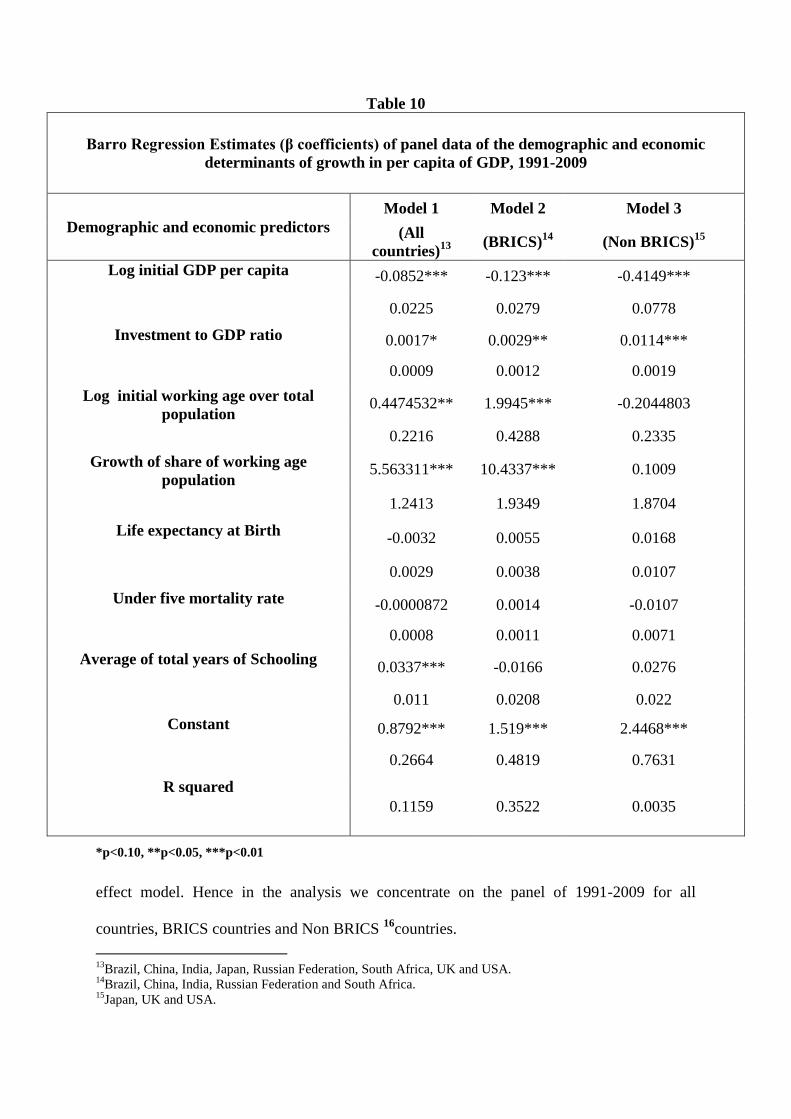
Table 10
Barro Regression Estimates (β coefficients) of panel data of the demographic and economic
determinants of growth in per capita of GDP, 1991-2009
Demographic and economic predictors
Model 1 Model 2 Model 3
(All
countries)13
(BRICS)
14 (Non BRICS)
15
Log initial GDP per capita -0.0852*** -0.123*** -0.4149***
0.0225 0.0279 0.0778
Investment to GDP ratio 0.0017* 0.0029** 0.0114***
0.0009 0.0012 0.0019
Log initial working age over total
population 0.4474532** 1.9945*** -0.2044803
0.2216 0.4288 0.2335
Growth of share of working age
population 5.563311*** 10.4337*** 0.1009
1.2413 1.9349 1.8704
Life expectancy at Birth -0.0032 0.0055 0.0168
0.0029 0.0038 0.0107
Under five mortality rate -0.0000872 0.0014 -0.0107
0.0008 0.0011 0.0071
Average of total years of Schooling 0.0337*** -0.0166 0.0276
0.011 0.0208 0.022
Constant 0.8792*** 1.519*** 2.4468***
0.2664 0.4819 0.7631
R squared
0.1159 0.3522 0.0035
*p<0.10, **p<0.05, ***p<0.01
effect model. Hence in the analysis we concentrate on the panel of 1991-2009 for all
countries, BRICS countries and Non BRICS 16
countries.
13
Brazil, China, India, Japan, Russian Federation, South Africa, UK and USA. 14
Brazil, China, India, Russian Federation and South Africa. 15
Japan, UK and USA.
Table (10) presents the panel data regression values of the coefficients of the independent
variables.17
The effect of initial GDP per capita on the growth rate of GDP per capita is
negative and highly significant. This supports the convergence theory that poorer countries
with low per capita income tend to grow faster. The coefficient value of initial per capita
GDP for BRICS is greater than that of all country regression results. This strongly indicates
that the speed of convergence to steady state equilibrium income for BRICS is faster than that
of the eight countries together.
The effect of investment to GDP ratio is positive and significant as expected. Increase in
investment share in GDP will accelerate the growth of the economy. It also supports the
theoretical notion that with economic improvement secondary and tertiary sectors flourish.
Both life expectancy at birth and under five mortality rate show negative effect in case of
eight countries panel regression whereas a positive effect in BRICS regression though they
are insignificant. This is not expected as it has been observed that with economic
improvement life expectancy increases and under five mortality rate decreases. The results
are as expected in case of Non BRICS countries however they are insignificant from
statistical point of view.
Education variable is showing a positive effect on economic growth in the eight country
model and it is also highly significant, which was not observed by Bloom and Canning
(2010). This supports the prior evidence that schooling improves workers’ productivity
hence income. Constant term in the fixed effect model captures the effects of those variables
which were not included in the model and which do not fluctuate very much over time (e.g.
16
The Test result shows fixed effect model better fit than random effect model for non BRICS, but it also
showed that OLS is also better fit than random effect model. Results of fixed effect model are used here. OLS
model may have been explained the effects of independent variables better.
17Figures in bracket are showing the standard error values. From the R
2 value it is observed that for Non BRICS
countries the model is unable to describe the fluctuation in per capita GDP due to fluctuation in its determinants.
race, religion etc.). In both the panels, constant term is significant and positive, indicating a
positive impact on growth of economy arising from time invariant variables which were not
included in the model.18
The main interest of the study is how far the demographic component is affecting the growth
of economy. Both the effects of initial level of working age population and growth rate of
that population is seen highly significant in this study. Both the variables affect growth of an
economy positively and effect of growthrate of working age population is very high. In this
study, we tried to find out whether the presence of demographic window in most of the
BRICS countries is potentially contributing to its economic growth or not. From the
regression results, it is evident that the effect (β coefficient) of growth of working age
population to population ratio on growth in per capita GDP is more in case of BRICS
countries (β=10.43) taken together than overall eight countries (β=5.56)19
. This indicates the
substantial effect of demographic component on economic growth of BRICS countries
particularly for China, India and South Africa since they are still going through the
demographic dividend phase of transition.
Conclusions
From the analysis the following outcomes have been ascertained
Growth rate of GDP per capita (in PPP) is mainly linked with faster growth of productivity of
the workers. Contribution of service sector is highest in growth oflabour productivity
followed by industry and agriculture which is almost half of the total labour productivity.
18
This variables are specific to the individual, here countries.
19The high standard error may be due to the inability of the data (of only two decades 1991-2009) to capture the
effect of a larger period.

Increase in employment in both industry and service sectors are seen in last one decade for all
BRICS countries. Growth in per capita GDP due to change in participation rate is negative
for China and India for both the periods (1991-2000 and 2000-2010).
The effect of initial GDP per capita on the growth rate of GDP per capita is negative and
highly significant. The coefficient value for BRICS is greater than that of all country
regression result. This strongly indicates that the speed of convergence to steady state
equilibrium income for BRICS is faster than that of the eight countries together.
Education variable is showing a significantly positive effect on economic growth for eight
country model.The effect of growth of working age population to population ratio on growth
in per capita GDP is more in case of BRICS countries (β=10.43) taken together than overall
eight countries (β=5.56).
Now the question is how far this effect of demographic dividend can be realised largely
depends on efficiency of the skill formation factor of these working age population. As seen
in the decomposition analysis labour productivity is contributing a major part in growth rate
of per capita GDP and also there are significant evidences of sectoral change in economy
mainly from agriculture to industry and services. Increase in labour productivity is also
necessary in secondary and tertiary sectors and this requires skill formation. Overall, it can
be stated that growth of GDP in BRICS is determined by demographics as well as sectoral
factors. The ultimate effect will largely depend on the labour force skill formation capacity of
these nations.
References
1. Armijo L. E. 2007. “The BRICS Countries (Brazil, Russia, India and China) As
Analytical Category: Mirage or Insight?” Asian Perspective, 31(4):7-42.
2. Baldacci, Emanuele, Maria Teresa Guin-Sui, and Luiz de Mello. 2003. “More on
the Effectiveness of Public Spending on Health Care and Education: A
Covariance Structure Model,” Journal of International Development, 15:709-725.
3. BaldacciE., B. Clements, S. Gupta, and Q. Cui. 2004. “Social Spending, Human
Capital, and Growth in Developing Countries: Implications for Achieving the
MDGs.”IMF Working Paper No. 217, Fiscal Affairs Department.
4. Baltagi, B. H. 2005. Econometric Analysis of Panel Data. John Wiley & Sons.
Ltd., UK.
5. Barro, R. 1991. “Economic growth in a cross section of countries”. Quarterly
Journal of Economics, 106(2):407-444
6. Barro, R, 1997. Determinants of Economic Growth: A Cross Country Empirical
Study. Cambridge, MA: MIT Press.
7. Barro, R. Sala-I-Martin, Xavier, 1995. Economic Growth. McGraw-Hill, New
York.
8. Bloom, David, and David Canning. 2001. “Cumulative causality, economic
growth, and the demographic transition”. In Birdsall, Nancy, Allen C. Kelley, and
Steven W. Sinding, eds., Population Matters: Demographic Change, Economic
Growth, and Poverty in the Developing World. Oxford: Oxford University Press.
165-197.
9. Bloom, David E., and David Canning. 2003. “Contraception and the Celtic Tiger.”
The Economic and Social Review, Vol. 34, 229–247.
10. Bloom, D. and D. Canning 2005. “Global Demographic Change:
Dimensions And Economic Significance.” Working Paper No. 1, Program on the
Global Demography of Aging, Harvard Institute for Global Health.
11. Bloom, David E and David Canning. 2008. “Global Demographic Change:
Dimensions and Economic Significance,” in Alexia Prskawetz, David E. Bloom,

and Wolfgang Lutz, eds., A supplement to Population and Development Review
vol. 33, Population Council, New York.
12. Bloom, David E., David Canning, and JaypeeSevilla. 2003. The Demographic
Dividend: A New Perspective on the Economic Consequences of Population
Change. Santa Monica, California: RAND, MR–1274.
13. Bloom D., D. Canning, G. Fink and J. Finlay. 2007. “Realizing the Demographic
Dividend: Is Africa any different?” PGDA Working Paper No. 23, Program on the
Global Demography of Aging, Harvard University.
http://www.hsph.harvard.edu/pgda/working.htm.
14. Bloom, D., D. Canning, L. Hu, Y. Liu, A. Mahal and W. Yip 2010. “The
contribution of Population Health and Demographic Change to Economic Growth
in China and India”. Journal of Comparative Economics, 38:17-33.
15. Bloom, D. E., D. Canning, and L. Rosenberg. 2010. “Demographic Change and
Economic Growth in South Asia”. Paper prepared for The World Bank.
16. Bloom, D., D. Canning, and P. Malaney. 2000. “Population Dynamics and
Economic Growth in Asia”. Population and Development Review,
26(suppl.):257-290.
17. Bloom, David E., and Jeffrey D. Sachs. 1998. “Geography, Demography and
Economic Growth in Africa.” Brookings Papers on Economic Activity, 2:207–
295.
18. Bloom, D and J. Finlay. 2009. “Demographic Change and Economic Growth in
Asia.” Asian Economic Policy Review 4:45‐64.
19. Bloom, D. and J. Finlay, S. Humair, A. Mason, O. Olaniyan, and A. Soyibo. 2011.
“Prospects for Economic Growth in Nigeria: A Demographic Prospective.” Paper
presented at the IUSSP Seminar on Demographics and Macroeconomic
Performance held at Novotel, Gare de Lyon, Paris, France 4-5 June 2010.
20. Bloom, D and J. Williamson. 1998. “Demographic Transition and Economic
Miracles in Emerging Asia”. World Bank Economic Review, 12(3):419-456.
21. Bosworth, B., S. M. Collins and A. Virmani. 2007. “Sources of Growth in the
Indian Economy”. NBER Working Paper No. 12901.
22. Cai, Fang and Dewen Wang. 2005. ‘Demographic Transition: implications for
growth’ in Garnaut and Song, eds, The China Boom and its Discontents, Asia-
Pacific Press, Canberra.
23. Chandrasekhar C. P., J. Ghosh, and A. Roychowdhury. 2006. “The ‘Demographic
Dividend’ and Young India’s Economic Future.” Economic and Political Weekly,
December 9:5055-5064.
24. Coale, A. and E. Hoover.1958. Population Growth and Economic Development in
Low Income Countries.Prinston, NJ: Princeton University Press.
25. Cohen, B. 1993. “Fertility levels, differentials, and trends”, in K. Foote, K. Hill,
and L. Martin (eds.), Demographic Change in Sub-Saharan Africa. Washington,
DC: National Academy Press, pp 8-67.
26. Cohen, B. 1998. “The emerging fertility transition in Sub-Saharan Africa”. World
Development, 26(8):1431-1461.
27. Crenshaw, Edward M., Ansari Z. Ameen, and Matthew Christenson (1997).
“Population dynamics and economic development: Age-specific population
growth rates and economic growth in developing countries, 1965 to 1990”.
American Sociological Review, Vol. 62. December. 974-984.
28. DaVanzo, Julie, HarunDogo, and Clifford Grammich. 2010. “Demographic
dividend or demographic drag? A net assessment of population trends in China
and India, 2020-2025, and their implications.” International Union for the
Scientific Study of the Population (IUSSP) Seminar on Demographics and
Macroeconomic Performance, Paris, France, 4-5 June 2010.
29. De la Croix, David, Thomas Lindh, and Bo Malmberg. 2007. “Demographic
change and economic growth in Sweden: 1750-2050”. Journal of
Macroeconomics, Vol. 31. 132-148.
30. Esterwood, R. and M. Lipton. 2011. “Demographic Transition in sub-Saharan
Africa: How big will the economic dividend be?” Population Studies, 65(1):9-35.
31. Heston, Alan, Robert Summers and Bettina Aten, 2011(May). Penn World Table
Version 7.0, Center for International Comparisons of Production, Income and
Prices at the University of Pennsylvania.
32. Feng, Wang and Andrew Mason. 2005. “Demographic Dividend and Prospects for
Economic Development in China”, UN Expert Group Meeting on Social and
Economic Implications of Changing Population Age Structures, Mexico City,
August 31-September 2.
33. Gupta, Sanjeev, MarijnVerhoeven, and Erwin Tiongson. 2002. “The Effectiveness
of Government Spending on Education and Health Care in Developing and
Transition Economies,” European Journal of Political Economy, 18(4):17–37.
Also reprinted in Sanjeev Gupta, Benedict Clements, and Gabriela Inchauste, eds.,
Helping Countries Develop: The Role of Fiscal Policy (Washington: International
Monetary Fund, 2004).
34. Gyimah-Brempong, Kwabena, and Mark Wilson. 2004, “Health Human Capital
and Economic Growth in Sub-Saharan African and OECD Countries,” The
Quarterly Review of Economics and Finance, 44(2):296–320.
35. Kim, J.-I. and L. J. Lau 1994. "The Sources of Economic Growth of the East
Asian Newly Industrialized Countries." Journal of the Japanese and International
Economies,8: 235-271.
36. Krugman, P. 1994. "The Myth of Asia's Miracle." Foreign Affairs.
37. Lee, K., M. H. Pesaran and R. Smith 1997. “Growth and Convergence in a Multi-
Country Empirical Stochastic Solow Model”. Journal of Applied Econometrics,
12:357-392.
38. Leipziger, D. M. and V. Thomas. 1994. "Roots of East Asia's Success." Finance
& Development, 31(1): 6-9.
39. Lucas, Robert E. Jr. 1988. “On the Mechanic of Economic Development,” Journal
of Monetary Economics, 22:3–42.
40. Mason A. and T. Kinugasa. 2004. “East Asian Economic Development: Two
Demographic Dividends.” (Paper Prepared for Conference on Miracles and
Mirages in East Asian Economic Development, Honolulu, HI, May 22).
41. Pool, I. 2007. “Demographic Dividends: Determinants of Development or Merely
Windows of Opportunity?” Oxford Institute of Ageing, Aging Horizons (7):28-35.
42. Ranis, G. 1995. "Another Look at the East Asian Miracle." The World Bank
Economic Review. 9(3): 509-534.
43. Ravallion, Martin, and Shaohua Chen, 1997, “What Can New Survey Data Tell
Us About Recent Changes in Distribution and Poverty?” World Bank Economic
Review, 11(2):357–82.
44. Romer, Paul. 1986. “Increasing Returns and Long-Run Growth,” Journal of
Political Economy, 94(5):1002–37.
45. Sastre, M., and Alain Trannoy 2002. “Shapely inequality decomposition by factor
Components: Some Methodological Issues”. Journal of Economics, 9 (suppl.): 51-
89.
46. Sen, Amartya. 1999. Development as Freedom (Alfred A. Knopf Inc.: New York).
47. Schultz, T. Paul. 1999. “Health and Schooling Investments in Africa,” Journal of
Economic Perspectives, 13(3):67–88.
48. Squire, Lyn. 1993. “Fighting Poverty,” American Economic Review, Papers and
Proceedings, 83(2):377–82.
49. Stiglitz, J. E. 1996. "Some Lessons from the East Asian Miracle." World Bank
Research Observer, 11(2): 151-177
50. Singh, B. P. 2008. “The Challenge of Good Governance in India: Need for
Innovative Approaches.” (Paper Circulated in the Second International
Conference of the Global Network of Global Innovators. Harvard University
March 31 – April 2).
51. Solow, Robert M. 1956. "A Contribution to the Theory of Economic
Growth". Quarterly Journal of Economics, (The MIT Press) 70 (1): 65–94.
52. Swan, Trevor W. 1956. "Economic Growth and Capital Accumulation". Economic
Record, (John Wiley & Sons) 32 (2): 334–361.
53. Thakur V. 2012. “The Demographic Dividend in India: Gift or curse? A State
level analysis ondiffering age structure and its implications forIndia’s economic
growth prospects.” Working Paper No. 12-128. International Development, LSE.
54. Vijayakumar, N., P. Sridharan and K. C. S. Rao. 2010. “Determinants of FDI in
BRICS Countries: A panel analysis”. International Journal of Business Science
and Applied Management, 5 (3).
55. World Bank. 1993. The East Asian Miracle: Economic Growth and Public Policy.
Oxford, Oxford University Press.

56. World Bank, 2011. World Development Indicators, 2011. The World Bank,
Washington, DC.
57. Yunyun, D. 2010. “FDI in BRICs: A Sector Level Analysis”. International
Journal of Business and Management, 5(1).
Appendices
Table 2: Sectoral share of employment (in %)
Country Year Agriculture Industry Service
Brazil
1992 28.3 20.4 51.4
2000 18.5 21.2 59.1
2009 17.0 22.1 60.7
China
1991 59.7 21.4 18.9
2000 50.0 22.5 27.5
2008 39.6 27.2 33.2
India
1994 61.9 15.7 22.4
2000 59.8 16.1 24.1
2010 51.1 22.4 26.5
Russia
1991 14.2 39.8 45.7
2000 14.5 28.4 57.1
2009 9.7 27.9 62.3
S. Africa 2000 15.6 24.2 59.4
2009 5.1 25.0 69.8
Japan
1991 6.7 34.4 58.4
2000 5.1 31.2 63.1
2009 3.9 25.9 69.0
UK
1991 2.2 30.0 65.7
2000 1.5 21.9 73.1
2009 1.1 19.5 78.7
USA
1991 2.9 25.5 71.6
2000 2.6 23.2 74.3
2009 1.5 17.1 80.9
Table 3: Contribution of within Sector Changes in Output per Worker and Inter-sectoral
Shifts to Change in GDP per capita
Percent of total change in GDP per capita
Country Year Agriculture Industry Service Inter-sectoral
shift
Total output
per worker
Brazil 1992-2000 8.9 -14.6 73.4 30.2 97.8
2000-2009 7.0 12.1 52.8 3.5 75.5
China 1991-2000 12.7 45.4 27.4 13.2 98.8
2000-2008 10.8 36.9 33.6 14.5 95.9
India 1994-2000 13.6 22.7 53.7 9.3 99.2
2000-2010 19.7 15.7 51.6 12.9 99.9
Russian Federation 1991-2000 67.7 4.8 -9.8 30.3 93.2
2000-2009 5.6 28.8 54.2 2.4 91.0
South Africa 2000-2009 12.6 19.4 24.4 14.8 71.2
Japan 1991-2000 2.2 24.8 75.3 3.9 106.2
2000-2009 2.1 31.8 76.5 3.8 114.3
UK 1991-2000 0.8 32.1 62.4 -0.6 94.7
2000-2009 0.8 24.2 77.8 -1.5 101.3
USA 1991-2000 0.0 19.5 66.7 0.2 86.4
2000-2009 3.3 40.1 86.2 -0.9 128.7
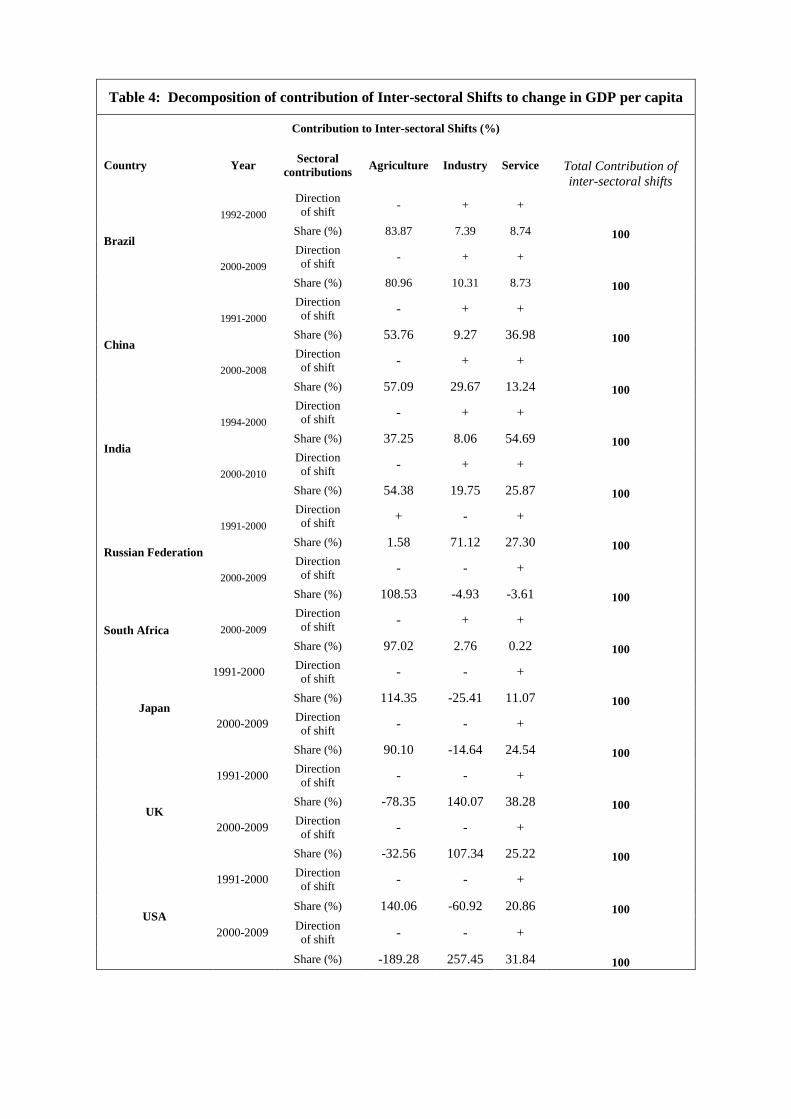
Table 4: Decomposition of contribution of Inter-sectoral Shifts to change in GDP per capita
Contribution to Inter-sectoral Shifts (%)
Country Year Sectoral
contributions Agriculture Industry Service Total Contribution of
inter-sectoral shifts
Brazil
1992-2000
Direction
of shift - + +
Share (%) 83.87 7.39 8.74 100
2000-2009
Direction
of shift - + +
Share (%) 80.96 10.31 8.73 100
China
1991-2000
Direction
of shift - + +
Share (%) 53.76 9.27 36.98 100
2000-2008
Direction
of shift - + +
Share (%) 57.09 29.67 13.24 100
India
1994-2000
Direction
of shift - + +
Share (%) 37.25 8.06 54.69 100
2000-2010
Direction
of shift - + +
Share (%) 54.38 19.75 25.87 100
Russian Federation
1991-2000
Direction
of shift + - +
Share (%) 1.58 71.12 27.30 100
2000-2009
Direction
of shift - - +
Share (%) 108.53 -4.93 -3.61 100
South Africa 2000-2009
Direction
of shift - + +
Share (%) 97.02 2.76 0.22 100
Japan
1991-2000 Direction
of shift - - +
Share (%) 114.35 -25.41 11.07 100
2000-2009 Direction
of shift - - +
Share (%) 90.10 -14.64 24.54 100
UK
1991-2000 Direction
of shift - - +
Share (%) -78.35 140.07 38.28 100
2000-2009 Direction
of shift - - +
Share (%) -32.56 107.34 25.22 100
USA
1991-2000 Direction
of shift - - +
Share (%) 140.06 -60.92 20.86 100
2000-2009 Direction
of shift - - +
Share (%) -189.28 257.45 31.84 100
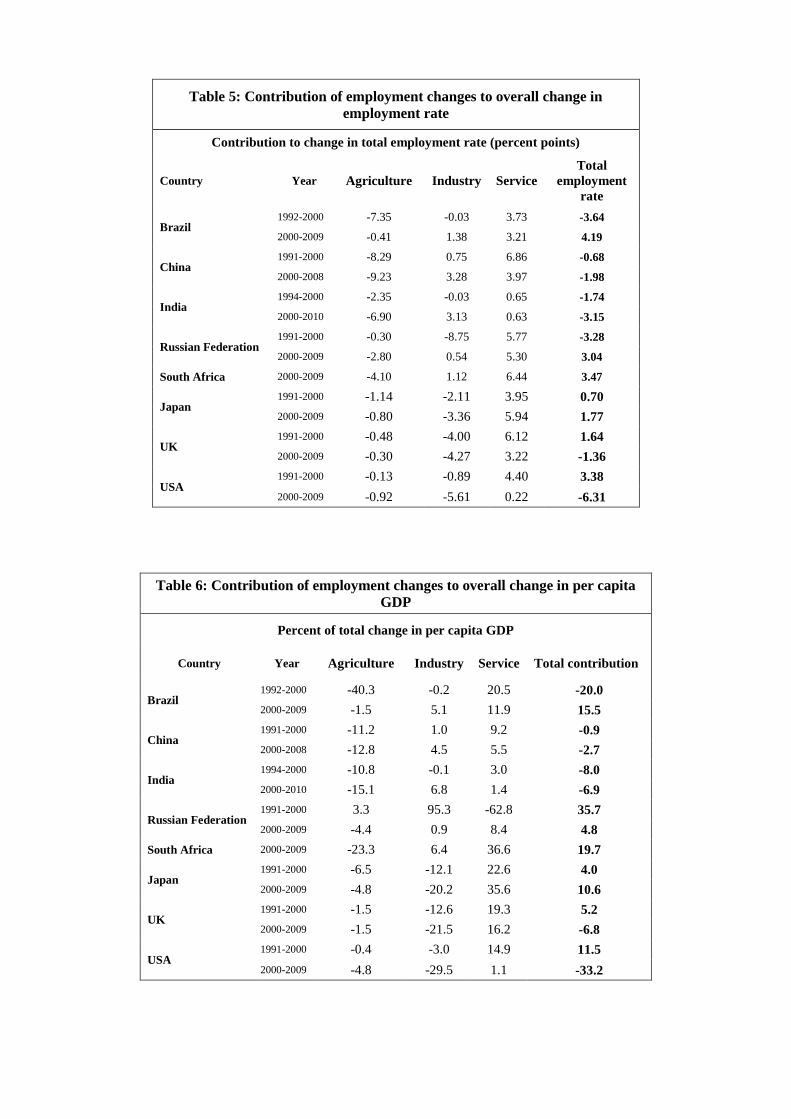
Table 5: Contribution of employment changes to overall change in
employment rate
Contribution to change in total employment rate (percent points)
Country Year Agriculture Industry Service
Total
employment
rate
Brazil 1992-2000 -7.35 -0.03 3.73 -3.64
2000-2009 -0.41 1.38 3.21 4.19
China 1991-2000 -8.29 0.75 6.86 -0.68
2000-2008 -9.23 3.28 3.97 -1.98
India 1994-2000 -2.35 -0.03 0.65 -1.74
2000-2010 -6.90 3.13 0.63 -3.15
Russian Federation 1991-2000 -0.30 -8.75 5.77 -3.28
2000-2009 -2.80 0.54 5.30 3.04
South Africa 2000-2009 -4.10 1.12 6.44 3.47
Japan 1991-2000 -1.14 -2.11 3.95 0.70
2000-2009 -0.80 -3.36 5.94 1.77
UK 1991-2000 -0.48 -4.00 6.12 1.64
2000-2009 -0.30 -4.27 3.22 -1.36
USA 1991-2000 -0.13 -0.89 4.40 3.38
2000-2009 -0.92 -5.61 0.22 -6.31
Table 6: Contribution of employment changes to overall change in per capita
GDP
Percent of total change in per capita GDP
Country Year Agriculture Industry Service Total contribution
Brazil 1992-2000 -40.3 -0.2 20.5 -20.0
2000-2009 -1.5 5.1 11.9 15.5
China 1991-2000 -11.2 1.0 9.2 -0.9
2000-2008 -12.8 4.5 5.5 -2.7
India 1994-2000 -10.8 -0.1 3.0 -8.0
2000-2010 -15.1 6.8 1.4 -6.9
Russian Federation 1991-2000 3.3 95.3 -62.8 35.7
2000-2009 -4.4 0.9 8.4 4.8
South Africa 2000-2009 -23.3 6.4 36.6 19.7
Japan 1991-2000 -6.5 -12.1 22.6 4.0
2000-2009 -4.8 -20.2 35.6 10.6
UK 1991-2000 -1.5 -12.6 19.3 5.2
2000-2009 -1.5 -21.5 16.2 -6.8
USA 1991-2000 -0.4 -3.0 14.9 11.5
2000-2009 -4.8 -29.5 1.1 -33.2
Table 7 : Employment, Output, Productivity and Population (% change)
Country Year GDP
(in 1000000's)
Total
population
Total
population
of working
age
Total number
of employed
GDP per
capita
Output
per
worker
Employment
rate
Share of
population of
working age
Brazil
1992-2000 47.8 12.8 19.8 13.5 31.01 30.23 -5.22 3.75
2000-2009 64.9 10.8 14.8 22.1 48.87 35.12 6.33 2.35
China
1991-2000 193.0 9.7 11.9 11.0 167.04 164.02 -0.83 1.32
2000-2008 175.3 4.9 11.6 8.9 162.38 152.79 -2.44 4.31
India
1994-2000 59.2 11.4 14.9 11.7 42.98 42.59 -2.78 1.86
2000-2010 163.3 16.2 22.7 16.4 126.60 126.27 -5.18 3.43
Russian
Federation
1991-2000 -14.3 -1.6 2.5 -2.5 -12.96 -12.13 -4.83 2.72
2000-2009 168.0 -3.0 0.8 5.6 176.44 153.85 4.71 2.78
South Africa 2000-2009 70.9 12.1 16.5 26.5 52.50 35.13 8.62 2.44
Japan
1991-2000 30.0 2.4 -0.1 0.9 26.93 28.79 0.96 -1.67
2000-2009 25.8 0.5 -4.9 -2.6 25.10 29.13 2.40 -3.68
UK
1991-2000 60.8 2.6 2.6 5.0 56.81 53.14 2.32 0.05
2000-2009 38.8 5.0 6.6 4.6 32.23 32.71 -1.88 1.01
USA
1991-2000 66.9 11.5 12.5 17.7 49.65 41.76 4.68 0.55
2000-2009 41.9 8.7 10.0 0.8 30.53 40.76 -8.36 0.79
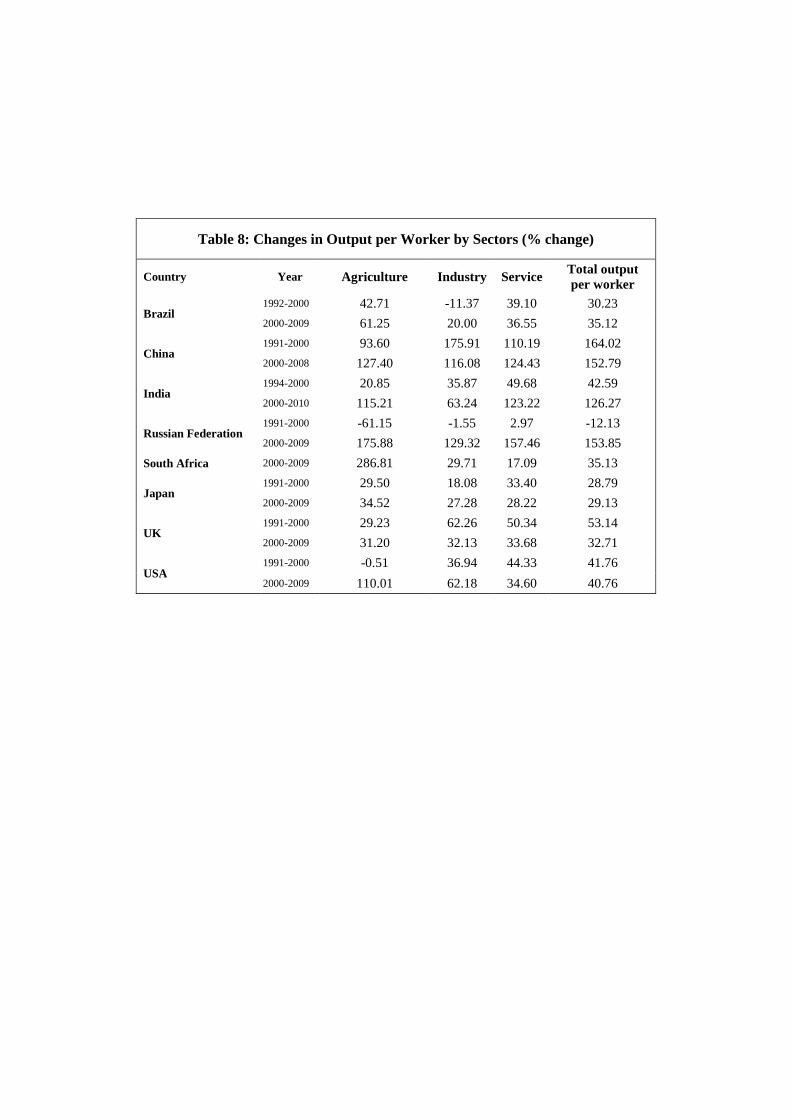
Table 8: Changes in Output per Worker by Sectors (% change)
Country Year Agriculture Industry Service Total output
per worker
Brazil 1992-2000 42.71 -11.37 39.10 30.23
2000-2009 61.25 20.00 36.55 35.12
China 1991-2000 93.60 175.91 110.19 164.02
2000-2008 127.40 116.08 124.43 152.79
India 1994-2000 20.85 35.87 49.68 42.59
2000-2010 115.21 63.24 123.22 126.27
Russian Federation 1991-2000 -61.15 -1.55 2.97 -12.13
2000-2009 175.88 129.32 157.46 153.85
South Africa 2000-2009 286.81 29.71 17.09 35.13
Japan 1991-2000 29.50 18.08 33.40 28.79
2000-2009 34.52 27.28 28.22 29.13
UK 1991-2000 29.23 62.26 50.34 53.14
2000-2009 31.20 32.13 33.68 32.71
USA 1991-2000 -0.51 36.94 44.33 41.76
2000-2009 110.01 62.18 34.60 40.76
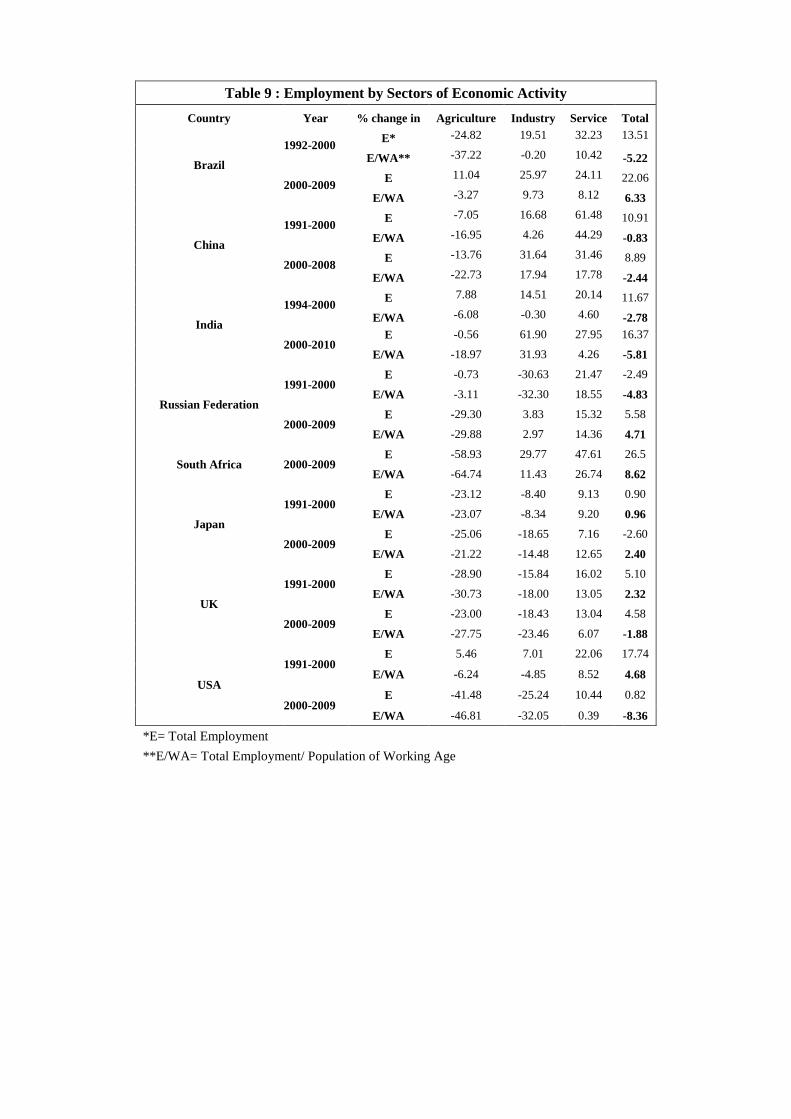
Table 9 : Employment by Sectors of Economic Activity
Country Year % change in Agriculture Industry Service Total
Brazil
1992-2000 E* -24.82 19.51 32.23 13.51
E/WA** -37.22 -0.20 10.42 -5.22
2000-2009 E 11.04 25.97 24.11 22.06
E/WA -3.27 9.73 8.12 6.33
China
1991-2000 E -7.05 16.68 61.48 10.91
E/WA -16.95 4.26 44.29 -0.83
2000-2008 E -13.76 31.64 31.46 8.89
E/WA -22.73 17.94 17.78 -2.44
India
1994-2000 E 7.88 14.51 20.14 11.67
E/WA -6.08 -0.30 4.60 -2.78
2000-2010 E -0.56 61.90 27.95 16.37
E/WA -18.97 31.93 4.26 -5.81
Russian Federation
1991-2000 E -0.73 -30.63 21.47 -2.49
E/WA -3.11 -32.30 18.55 -4.83
2000-2009 E -29.30 3.83 15.32 5.58
E/WA -29.88 2.97 14.36 4.71
South Africa 2000-2009 E -58.93 29.77 47.61 26.5
E/WA -64.74 11.43 26.74 8.62
Japan
1991-2000 E -23.12 -8.40 9.13 0.90
E/WA -23.07 -8.34 9.20 0.96
2000-2009 E -25.06 -18.65 7.16 -2.60
E/WA -21.22 -14.48 12.65 2.40
UK
1991-2000 E -28.90 -15.84 16.02 5.10
E/WA -30.73 -18.00 13.05 2.32
2000-2009 E -23.00 -18.43 13.04 4.58
E/WA -27.75 -23.46 6.07 -1.88
USA
1991-2000 E 5.46 7.01 22.06 17.74
E/WA -6.24 -4.85 8.52 4.68
2000-2009 E -41.48 -25.24 10.44 0.82
E/WA -46.81 -32.05 0.39 -8.36
*E= Total Employment
**E/WA= Total Employment/ Population of Working Age
Growth Decomposition: Brazil
Table 10a: Percent Contribution to Total Growth in GDP (value added) per
capita, Brazil 1992-2000
Table 10b: Percent Contribution to Total Growth in GDP (value added)
per capita, Brazil 2000-2009
Contribution
of within sector
changes in
output per
worker (%)
Contribution
of changes in
Employment
(%)
Contributions
of Inter-
sectoral Shifts
(%)
Total
(%)
Contribution
of within
sector
changes in
output per
worker (%)
Contribution
of changes in
Employment
(%)
Contributions
of Inter-
sectoral Shifts
(%)
Total
(%)
Sectoral contributions
Sectoral contributions
Agriculture 8.87 -40.32 25.33 -6.12
Agriculture 7.04 -1.50 2.85 8.39
Industry -14.61 -0.16 2.23 -12.54
Industry 12.11 5.12 0.36 17.60
Service 73.38 20.49 2.64 96.51
Service 52.82 11.90 0.31 65.02
Subtotals 67.64 -19.99 30.20 77.85
Subtotals 71.97 15.52 3.52 91.02
Demographic
component - - 22.15
Demographic
component - - 8.98
Total
100.00
Total
100.00
Total % change in value added per capita 1992-2000 31.01
Total % change in value added per capita 2000-2009 48.87
Growth Decomposition: China
Table 11a:Percent Contribution to Total Growth in GDP (value added) per
capita, China 1991-2000
Table 11b:Percent Contribution to Total Growth in GDP (value added)
per capita, China 2000-2008
Contribution
of within sector
changes in
output per
worker (%)
Contribution
of changes in
Employment
(%)
Contributions
of Inter-
sectoral Shifts
(%)
Total
(%)
Contribution
of within
sector
changes in
output per
worker (%)
Contribution
of changes in
Employment
(%)
Contributions
of Inter-
sectoral Shifts
(%)
Total
(%)
Sectoral contributions
Sectoral contributions
Agriculture 12.70 -11.15 7.11 8.66
Agriculture 10.79 -12.80 8.30 6.29
Industry 45.40 1.01 1.23 47.63
Industry 36.95 4.54 4.31 45.80
Service 27.43 9.23 4.89 41.55
Service 33.63 5.51 1.92 41.06
Subtotals 85.53 -0.92 13.22 97.83
Subtotals 81.37 -2.75 14.53 93.16
Demographic
component - - 2.17
Demographic
component - - 6.84
Total
100.00
Total
100.00
Total % change in value added per capita 1991-2000 167.04
Total % change in value added per capita 2000-2008 162.38

Growth Decomposition: India
Table 12a:Percent Contribution to Total Growth in GDP (value added) per
capita, India 1994-2000
Table 12b:Percent Contribution to Total Growth in GDP (value added)
per capita, India 2000-2010
Contribution
of within sector
changes in
output per
worker (%)
Contribution
of changes in
Employment
(%)
Contributions
of Inter-
sectoral Shifts
(%)
Total
(%)
Contribution
of within
sector
changes in
output per
worker (%)
Contribution
of changes in
Employment
(%)
Contributions
of Inter-
sectoral
Shifts (%)
Total
(%)
Sectoral contributions
Sectoral contributions
Agriculture 13.62 -10.79 3.45 6.28
Agriculture 19.73 -15.08 6.99 11.64
Industry 22.69 -0.14 0.75 23.30
Industry 15.66 6.83 2.54 25.03
Service 53.68 2.96 5.06 61.70
Service 51.62 1.37 3.33 56.31
Subtotals 90.00 -7.97 9.25 91.28
Subtotals 87.01 -6.88 12.85 92.98
Demographic
component - - 8.72
Demographic
component - - 7.02
Total
100.00
Total
100.00
Total % change in value added per capita 1994-2000 42.98
Total % change in value added per capita 2000-2010 126.60
Growth Decomposition: Russian Federation
Table 13a:Percent Contribution to Total Growth in GDP (value added) per
capita, Russian Federation 1991-2000
Table 13b:Percent Contribution to Total Growth in GDP (value added)
per capita, Russian Federation 2000-2009
Contribution
of within sector
changes in
output per
worker (%)
Contribution
of changes in
Employment
(%)
Contributions
of Inter-
sectoral Shifts
(%)
Total
(%)
Contribution
of within
sector
changes in
output per
worker (%)
Contribution
of changes in
Employment
(%)
Contributions
of Inter-
sectoral
Shifts (%)
Total
(%)
Sectoral contributions
Sectoral contributions
Agriculture 67.74 3.28 0.48 71.50
Agriculture 5.59 -4.44 2.65 3.80
Industry 4.85 95.29 21.58 121.72
Industry 28.80 0.86 -0.12 29.54
Service -9.75 -62.85 8.28 -64.32
Service 54.22 8.41 -0.09 62.54
Subtotals 62.84 35.72 30.35 128.90
Subtotals 88.61 4.83 2.44 95.88
Demographic
component - - -28.90
Demographic
component - - 4.12
Total
100.00
Total
100.00
Total % change in value added per capita 1991-2000 -12.96
Total % change in value added per capita 2000-2009 176.44
Growth Decomposition: South Africa
Table 14:Percent Contribution to Total Growth in GDP (value added) per capita, South Africa 2000-2009
Contribution
of within
sector
changes in
output per
worker (%)
Contribution
of changes in
Employment
(%)
Contributions
of Inter-
sectoral
Shifts (%)
Total
(%)
Sectoral contributions
Agriculture 12.60 -23.26 14.39 3.73
Industry 19.38 6.37 0.41 26.16
Service 24.36 36.59 0.03 60.98
Subtotals 56.34 19.70 14.83 90.87
Demographic
component - -
9.13
Total
100.00
Total % change in value added per capita 2000-2009 52.50
Growth Decomposition: Japan
Table 15a: Percent Contribution to Total Growth in GDP (value added) per
capita, Japan 1991-2000
Table 15b: Percent Contribution to Total Growth in GDP (value added)
per capita, Japan 2000-2009
Contribution
of within sector
changes in
output per
worker (%)
Contribution
of changes in
Employment
(%)
Contributions
of Inter-
sectoral Shifts
(%)
Total
(%)
Contribution
of within
sector
changes in
output per
worker (%)
Contribution
of changes in
Employment
(%)
Contributions
of Inter-
sectoral Shifts
(%)
Total
(%)
Sectoral contributions
Sectoral contributions
Agriculture 2.21 -6.52 4.43 0.13
Agriculture 2.12 -4.83 3.44 0.73
Industry 24.75 -12.09 -0.99 11.67
Industry 31.82 -20.16 -0.56 11.10
Service 75.31 22.65 0.43 98.38
Service 76.52 35.63 0.94 113.09
Subtotals 102.27 4.04 3.88 110.19
Subtotals 110.46 10.64 3.82 124.92
Demographic
component - -
-10.19
Demographic
component - -
-24.92
Total
100.00
Total
100.00
Total % change in value added per capita 1991-2000 26.93
Total % change in value added per capita 2000-2009 25.10
Growth Decomposition: United Kingdom (UK)
Table 16a: Percent Contribution to Total Growth in GDP (value added) per
capita, UK 1991-2000
Table 16b: Percent Contribution to Total Growth in GDP (value added)
per capita, UK 2000-2009
Contribution
of within sector
changes in
output per
worker (%)
Contribution
of changes in
Employment
(%)
Contributions
of Inter-
sectoral Shifts
(%)
Total
(%)
Contribution
of within
sector
changes in
output per
worker (%)
Contribution
of changes in
Employment
(%)
Contributions
of Inter-
sectoral
Shifts (%)
Total
(%)
Sectoral contributions
Sectoral contributions
Agriculture 0.75 -1.52 0.48 -0.29
Agriculture 0.83 -1.52 0.50 -0.19
Industry 32.13 -12.60 -0.86 18.67
Industry 24.19 -21.49 -1.64 1.06
Service 62.39 19.30 -0.23 81.45
Service 77.82 16.19 -0.39 93.62
Subtotals 95.27 5.17 -0.61 99.84
Subtotals 102.84 -6.83 -1.53 94.48
Demographic
component - -
0.16
Demographic
component - -
5.52
Total
100.00
Total
100.00
Total % change in value added per capita 1991-2000 56.81
Total % change in value added per capita 2000-2009 32.23
Growth Decomposition: United States of America (USA)
Table 17a: Percent Contribution to Total Growth in GDP (value added) per
capita, USA 1991-2000
Table 17b: Percent Contribution to Total Growth in GDP (value added)
per capita, USA 2000-2009
Contribution
of within sector
changes in
output per
worker (%)
Contribution
of changes in
Employment
(%)
Contributions
of Inter-
sectoral Shifts
(%)
Total
(%)
Contribution
of within
sector
changes in
output per
worker (%)
Contribution
of changes in
Employment
(%)
Contributions
of Inter-
sectoral
Shifts (%)
Total
(%)
Sectoral contributions
Sectoral contributions
Agriculture -0.02 -0.44 0.35 -0.11
Agriculture 3.27 -4.82 1.70 0.14
Industry 19.48 -3.03 -0.15 16.31
Industry 40.06 -29.47 -2.31 8.29
Service 66.73 14.92 0.05 81.70
Service 86.25 1.14 -0.29 87.10
Subtotals 86.20 11.45 0.25 97.90
Subtotals 129.58 -33.15 -0.90 95.53
Demographic
component - -
2.10
Demographic
component - -
4.47
Total
100.00
Total
100.00
Total % change in value added per capita 1991-2000 49.65
Total % change in value added per capita 2000-2009 30.53