demand response automation around the us: tech … · demand response automation around the us: ......
TRANSCRIPT
Demand Response Automation Around the US:
Tech Trends and Practical Issues
for Facility Operations
NSF BEST CENTER NATIONAL WORKSHOP
Mary Ann Piette, Director, Demand Response Research Center
Lawrence Berkeley National Laboratory
Presentation Outline
• Introduction to Demand Response
• Automation and Hot Summer Day DR
• Future – Any Time DR
• Summary
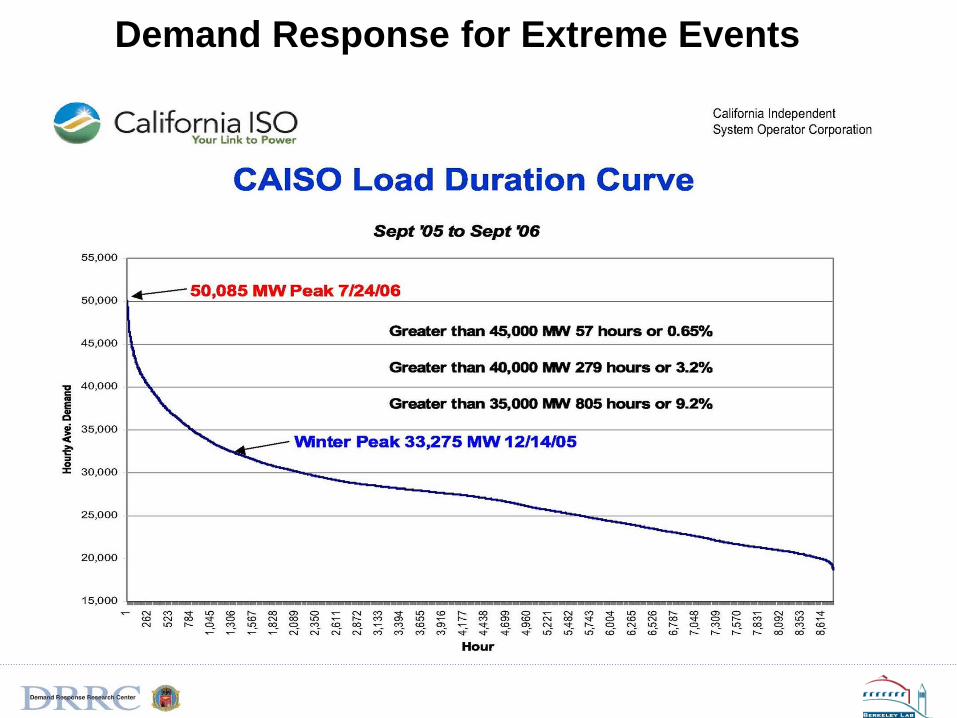
Demand Response for Extreme Events
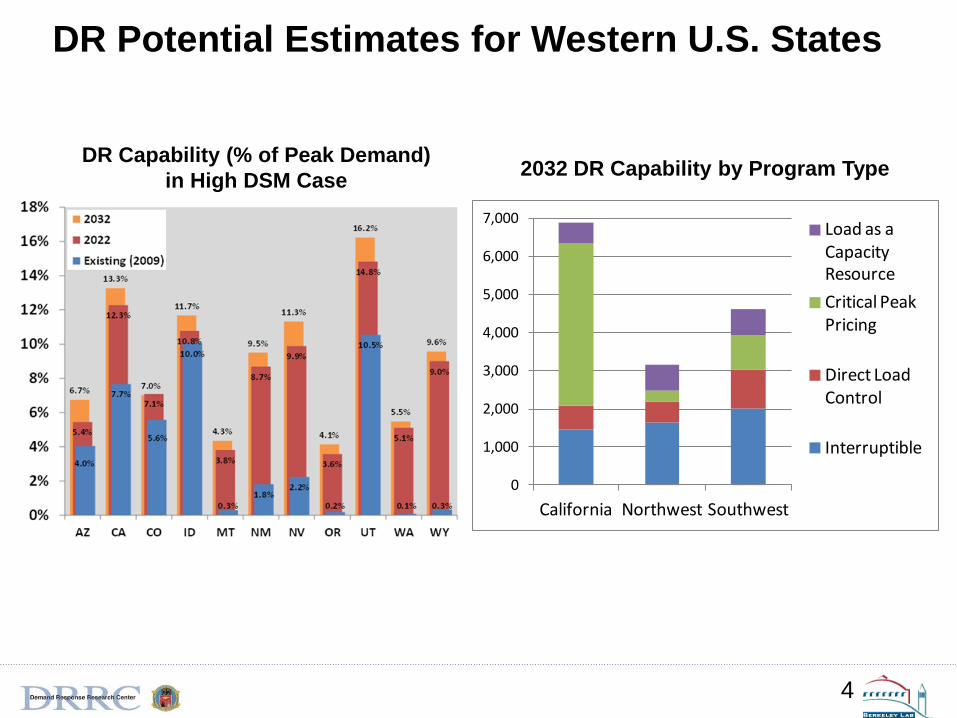
DR Potential Estimates for Western U.S. States
4
DR Capability (% of Peak Demand)
in High DSM Case
0
1,000
2,000
3,000
4,000
5,000
6,000
7,000
California Northwest Southwest
Load as a Capacity Resource
Critical Peak Pricing
Direct Load Control
Interruptible
2032 DR Capability by Program Type
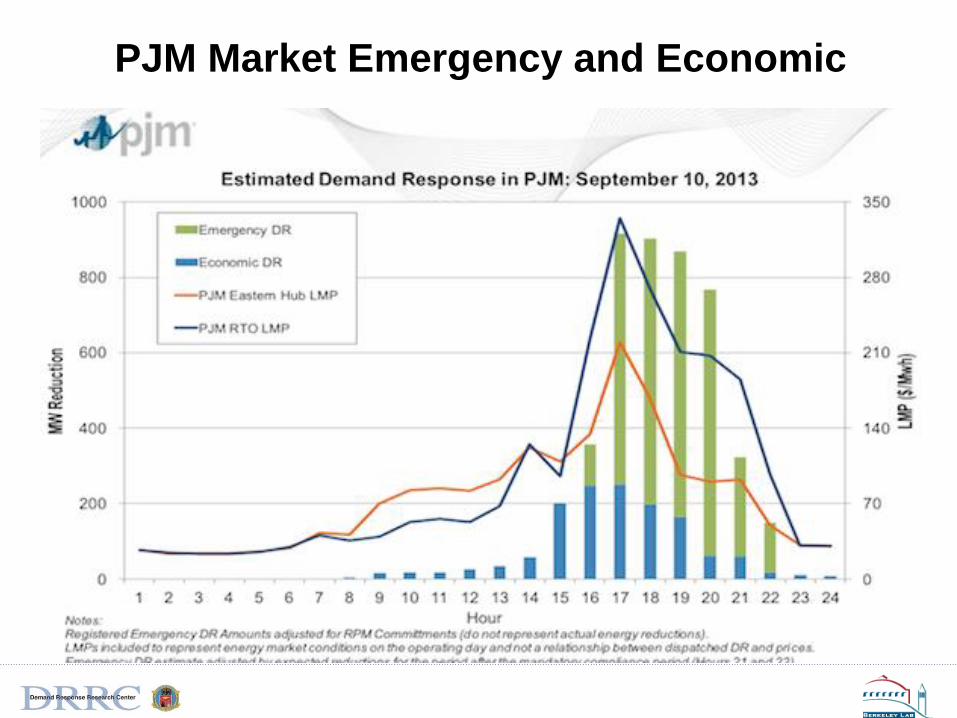
PJM Market Emergency and Economic
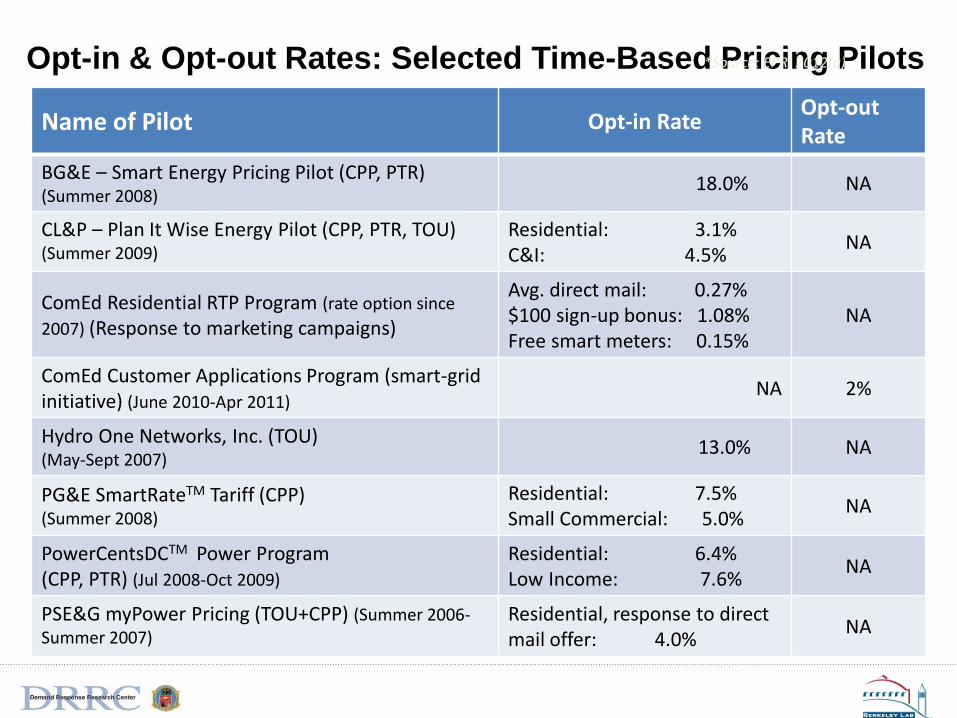
Opt-in & Opt-out Rates: Selected Time-Based Pricing Pilots
Name of Pilot Opt-in Rate Opt-out Rate
BG&E – Smart Energy Pricing Pilot (CPP, PTR) (Summer 2008)
18.0% NA
CL&P – Plan It Wise Energy Pilot (CPP, PTR, TOU) (Summer 2009)
Residential: 3.1% C&I: 4.5%
NA
ComEd Residential RTP Program (rate option since
2007) (Response to marketing campaigns)
Avg. direct mail: 0.27% $100 sign-up bonus: 1.08% Free smart meters: 0.15%
NA
ComEd Customer Applications Program (smart-grid initiative) (June 2010-Apr 2011)
NA 2%
Hydro One Networks, Inc. (TOU) (May-Sept 2007)
13.0% NA
PG&E SmartRateTM Tariff (CPP) (Summer 2008)
Residential: 7.5% Small Commercial: 5.0%
NA
PowerCentsDCTM Power Program (CPP, PTR) (Jul 2008-Oct 2009)
Residential: 6.4% Low Income: 7.6%
NA
PSE&G myPower Pricing (TOU+CPP) (Summer 2006-Summer 2007)
Residential, response to direct mail offer: 4.0%
NA
*Source: EPRI 2012(a)
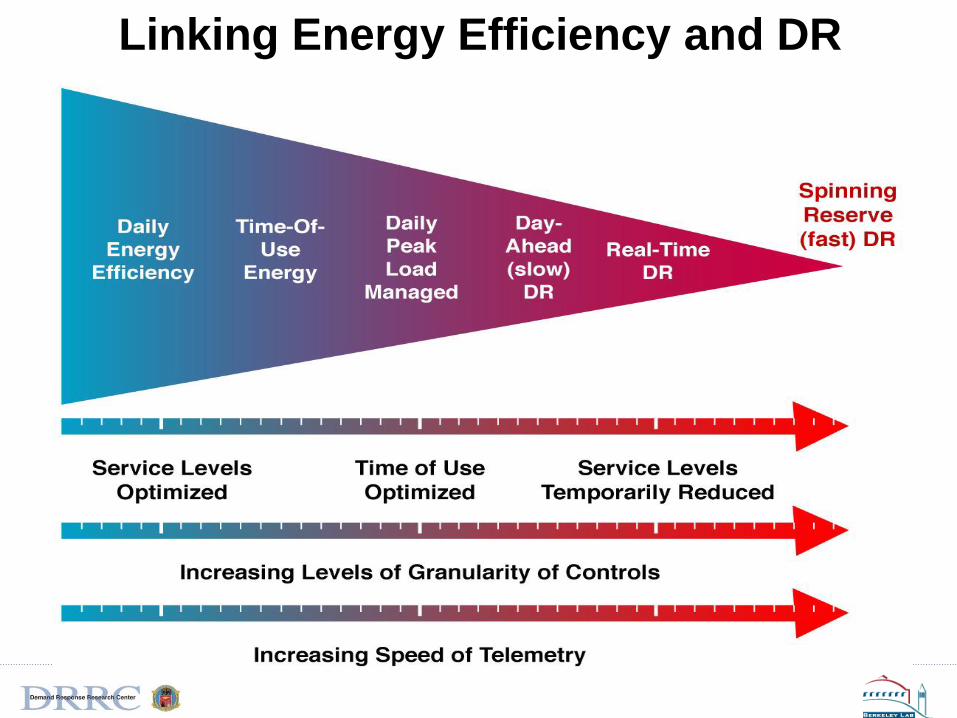
Linking Energy Efficiency and DR
Interfacing Electricity and Transportation Networks
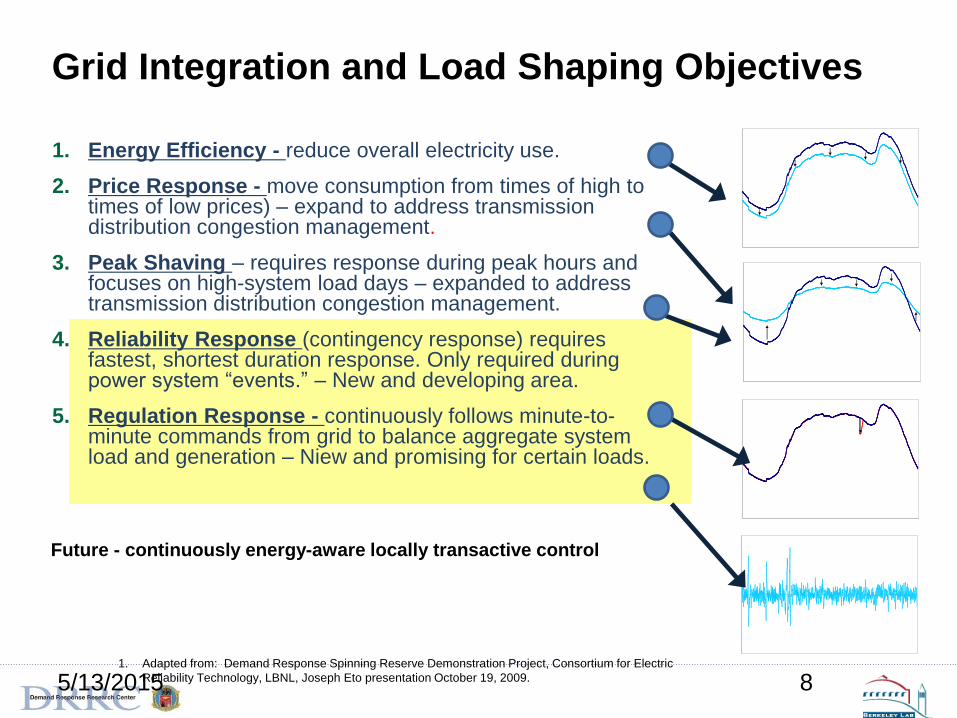
Grid Integration and Load Shaping Objectives
1. Energy Efficiency - reduce overall electricity use.
2. Price Response - move consumption from times of high to times of low prices) – expand to address transmission distribution congestion management.
3. Peak Shaving – requires response during peak hours and focuses on high-system load days – expanded to address transmission distribution congestion management.
4. Reliability Response (contingency response) requires fastest, shortest duration response. Only required during power system “events.” – New and developing area.
5. Regulation Response - continuously follows minute-to-minute commands from grid to balance aggregate system load and generation – Niew and promising for certain loads.
1. Adapted from: Demand Response Spinning Reserve Demonstration Project, Consortium for Electric
Reliability Technology, LBNL, Joseph Eto presentation October 19, 2009. 5/13/2015 8
Future - continuously energy-aware locally transactive control
5/13/2015 9
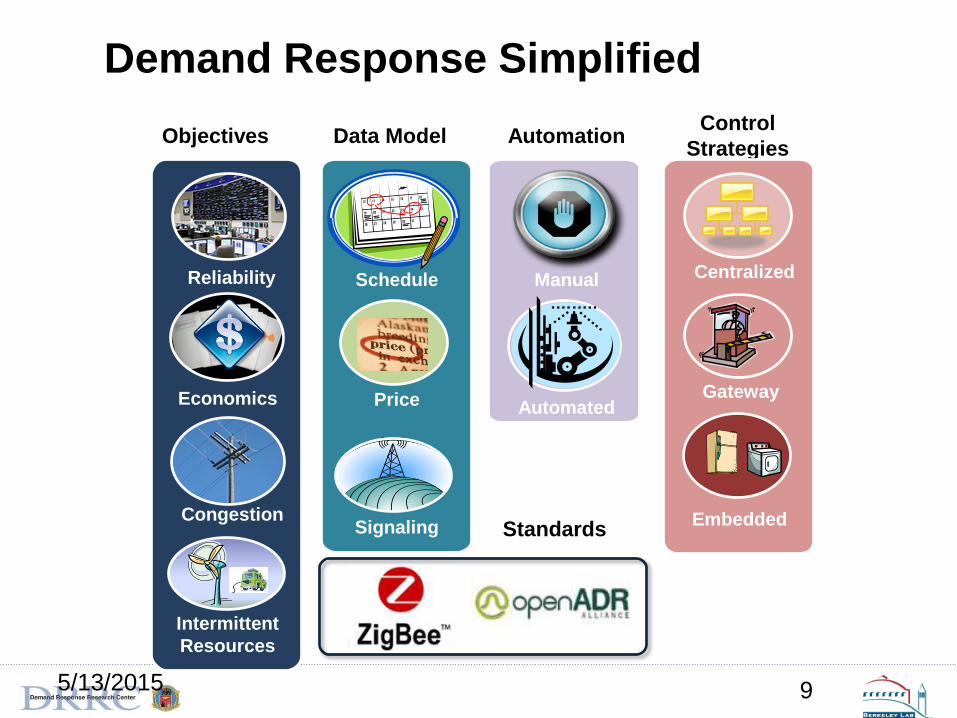
Demand Response Simplified
Schedule
Price
Signaling
Congestion
Reliability
Economics
Intermittent
Resources
Objectives Data Model Automation
Standards
Control
Strategies
D
Manual
Automated
Centralized
Gateway
Embedded
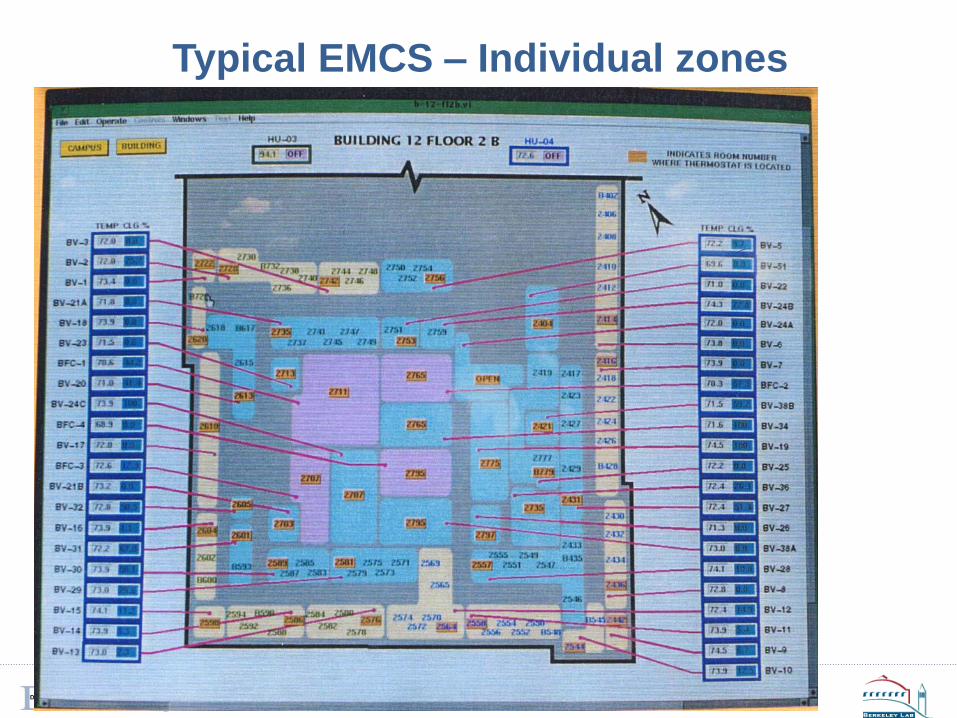
Typical EMCS – Individual zones
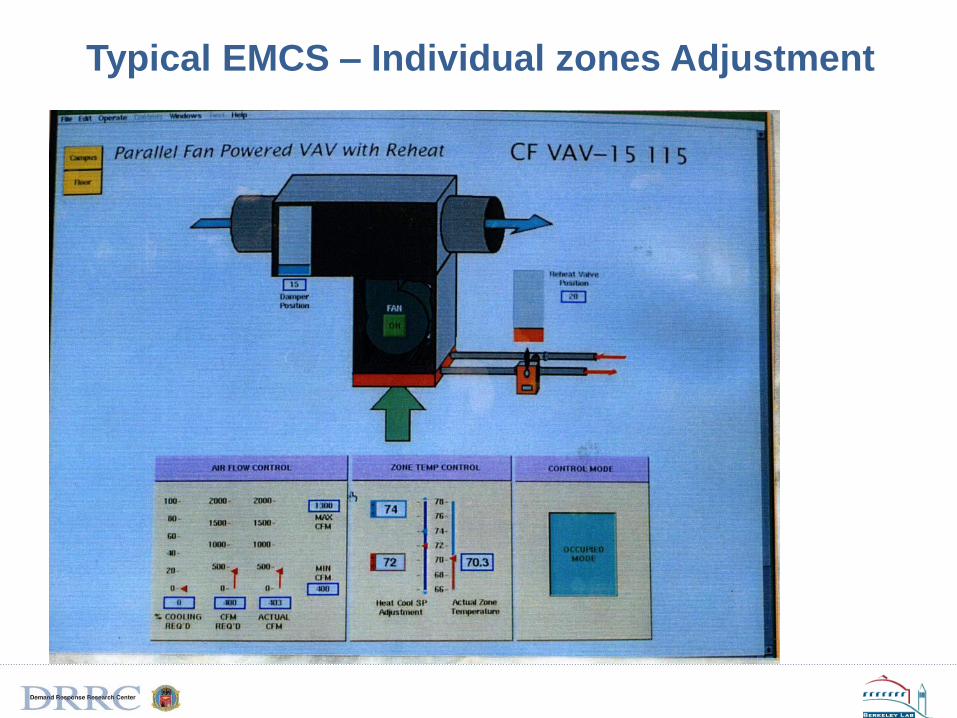
Typical EMCS – Individual zones Adjustment
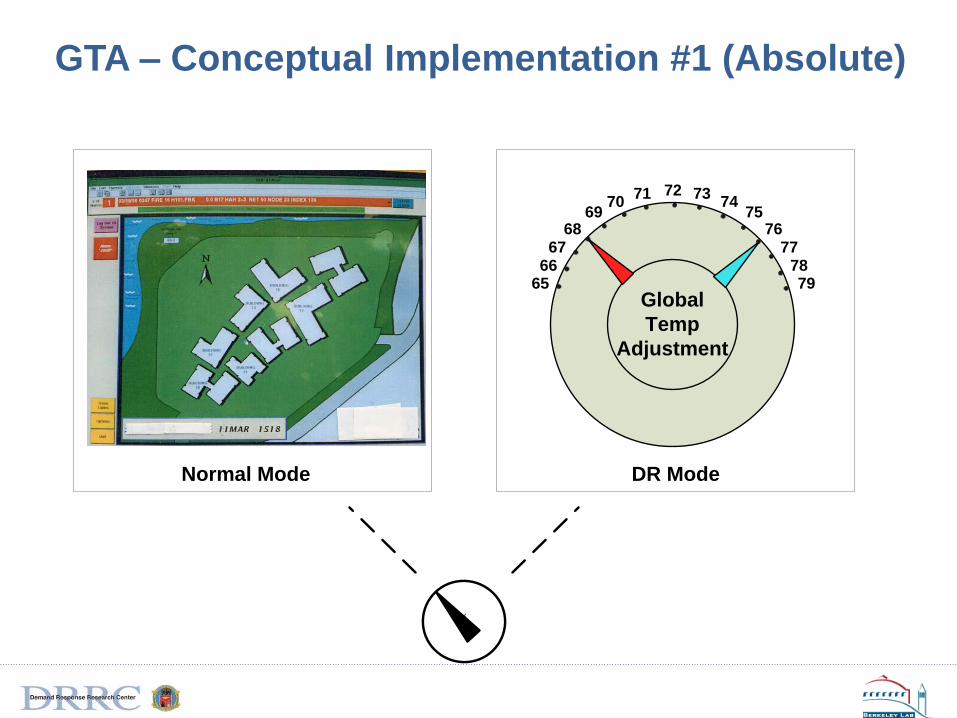
Normal Mode
Global
Temp
Adjustment
72 7374
7576
777879
7170
6968
6766
65
DR Modete
xt
GTA – Conceptual Implementation #1 (Absolute)
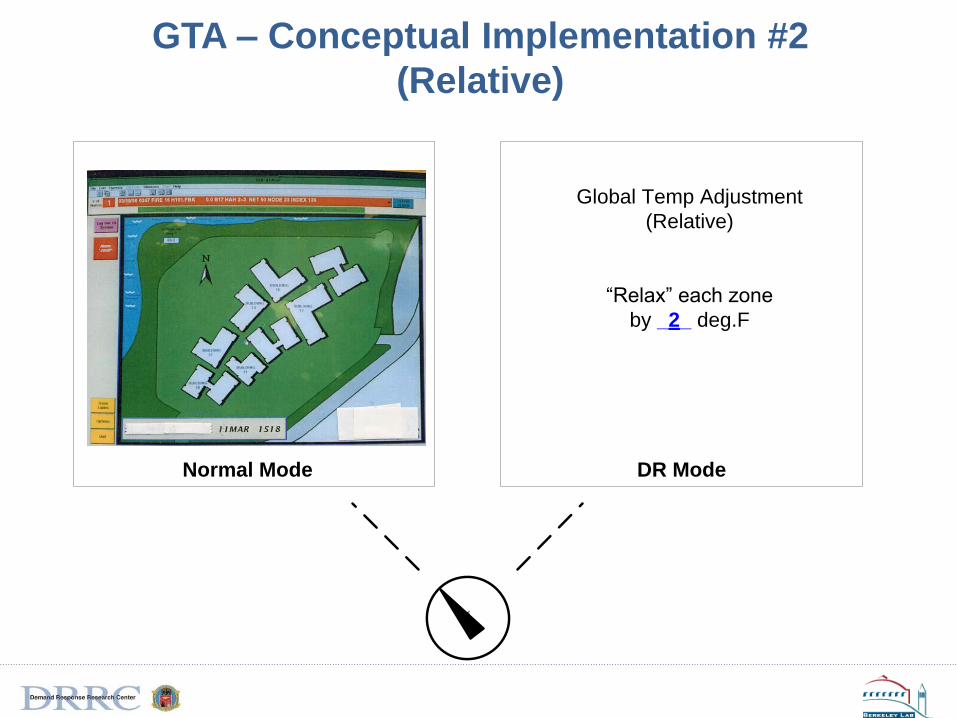
Normal Mode DR Modete
xt
Global Temp Adjustment
(Relative)
“Relax” each zone
by _2_ deg.F
GTA – Conceptual Implementation #2
(Relative)

Comfort: 1.5 deg. F° Temperature Rise at
GSA (39 zone average) (1 of 2)
68
69
70
71
72
73
74
0:0
0
1:0
0
2:0
0
3:0
0
4:0
0
5:0
0
6:0
0
7:0
0
8:0
0
9:0
0
10
:00
11
:00
12
:00
13
:00
14
:00
15
:00
16
:00
17
:00
18
:00
19
:00
20
:00
21
:00
22
:00
23
:00
Zo
ne
Te
mp
era
ture
[De
gre
e F
]
Actual Previous Days Average
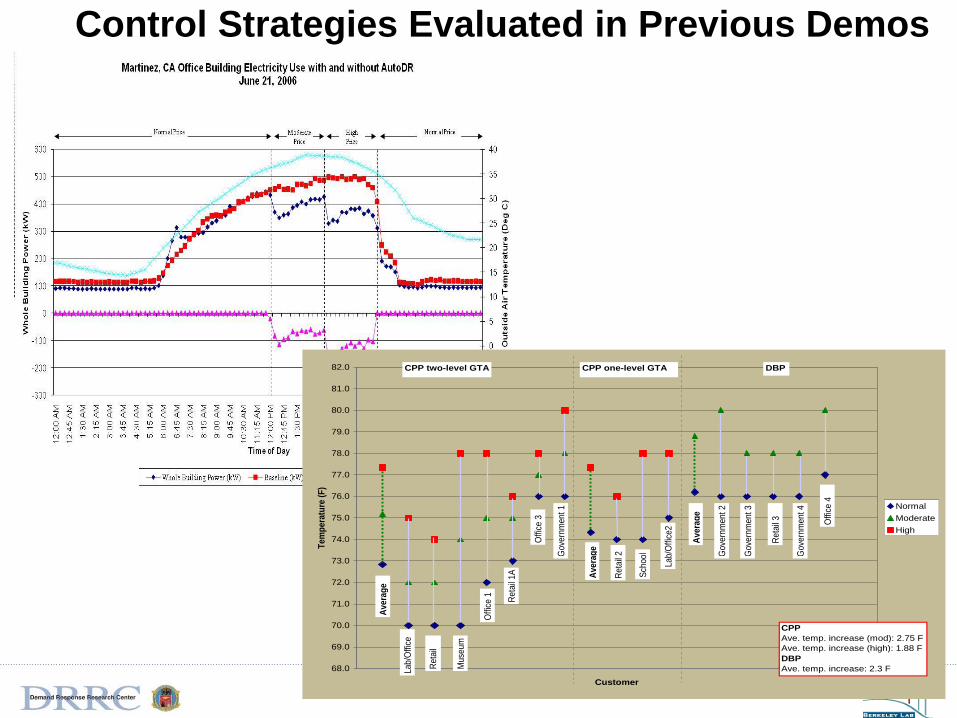
Control Strategies Evaluated in Previous Demos
15
Global Temperature Adjustment Amounts for Auto-DR sites
68.0
69.0
70.0
71.0
72.0
73.0
74.0
75.0
76.0
77.0
78.0
79.0
80.0
81.0
82.0
Customer
Te
mp
era
ture
(F
)
Normal
Moderate
High
CPP
Ave. temp. increase (mod): 2.75 F
Ave. temp. increase (high): 1.88 F
DBP
Ave. temp. increase: 2.3 F
DBP CPP one-level GTACPP two-level GTA
Re
tail
Muse
um
Off
ice
1 Re
tail
1A
Off
ice
3
Go
vern
me
nt
1
Re
tail
2
Sch
oo
l
Lab
/Off
ice
2
Go
vern
me
nt
2
Go
vern
me
nt
3
Go
vern
me
nt
4
Re
tail
3
Off
ice
4
Lab
/Off
ice
Av
era
ge
Av
era
ge
Av
era
ge

Strategies used in DR Field Tests
Building use
Total
conditioned
area
# of
bldg 2003 2004 2005 Glo
bal
tem
p.
ad
just
men
t
Fan
-co
il u
nit
off
SA
T r
ese
t
Fan
VF
D l
imit
Du
ct
stati
c p
res.
rese
t
Fan
qu
an
tity
red
ucti
on
Ele
ctr
ic h
um
idif
ier
off
CH
W t
em
p.
rese
t
CH
W c
urr
en
t li
mit
Ch
ille
r d
em
an
d l
imit
Bo
iler
lock
ou
t
Pre
-co
oli
ng
Ex
ten
ded
sh
ed
peri
od
Slo
w r
eco
very
Co
mm
on
are
a l
igh
t d
im
Off
ice a
rea l
igh
t d
im
An
ti-s
weat
heate
r sh
ed
Fo
un
tain
pu
mp
off
Tra
nsf
er
pu
mp
off
300 CapMall Office 383,000 1 X X X X X X
ACWD Office, lab 51,200 1 X X X X X X X X
Albertsons Supermarket 50,000 1 X X X
B of A Office, data center 708,000 4 X X X X X X X X
Chabot Museum 86,000 2 X X X
Cal EPA Office 950,000 1 X X X X
CETC Research facility 18,000 1 X X X
Cisco Office, tech lab 4,466,000 24 X X X X X X
2530 Arnold Office 131,000 1 X X X X
50 Douglas Office 90,000 1 X X X X
Echelon Corporate Headquarter 75,000 1 X X X X X X X X
GSA 450 GG Federal office 1,424,000 1 X X
GSA NARA Archive storage 202,000 1 X X
GSA Oakland Federal office 978,000 1 X X X
Gilead 300 Office 83,000 1 X X
Gilead 342 Office, Lab 32,000 1 X X X
Gilead 357 Office, Lab 33,000 1 X X X
Irvington Highschool N/A 1 X X X
IKEA Retail 300,000 1 X X
Kadent Material process - 1 X X
LBNL OSF Data center, Office 70,000 1 X X X
Monterey Office 170,000 1 X X
Oracle Office 100,000 2 X X X
OSIsoft Office 60,000 1 X X
Roche Cafeteria, auditorium 192,000 3 X X X
Target Retail 130,000 1 X X X
UCSB Library Library 289,000 3 X X X X X
USPS Postal service 390,000 1 X X X X
Light, Misc.Participation HVAC
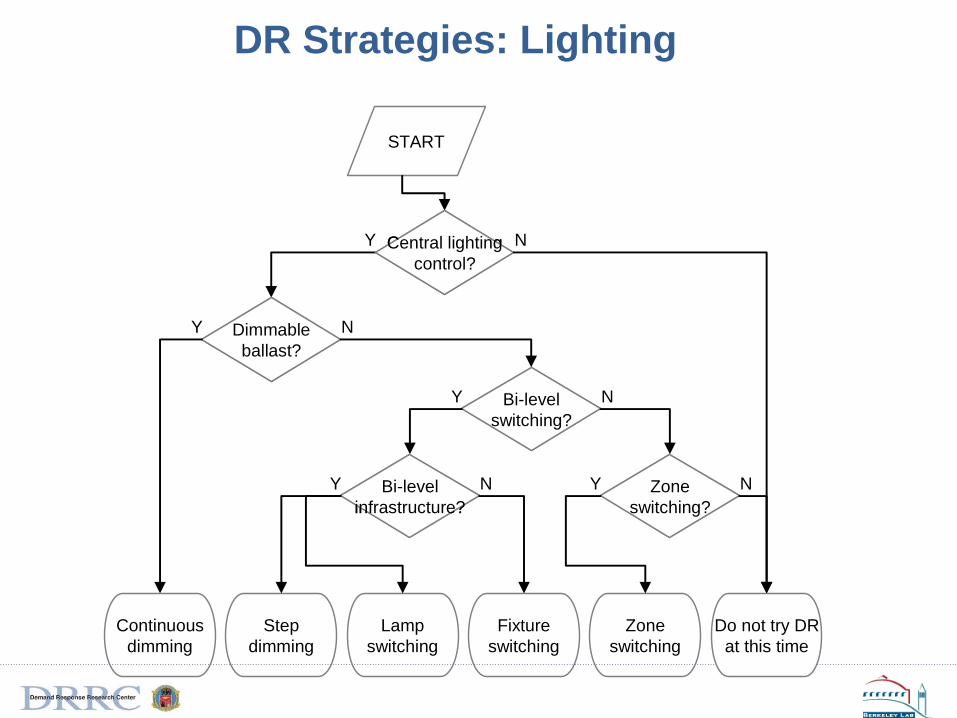
DR Strategies: Lighting
START
Central lighting
control?
Y NCentral lighting
control?
Y N
Dimmable
ballast?
Y NDimmable
ballast?
Y N
Zone
switching
Zone
switching?
Y NZone
switching?
Y N
Bi-level
switching?
Y NBi-level
switching?
Y N
Do not try DR
at this time
Fixture
switching
Continuous
dimming
Lamp
switching
Step
dimming
Bi-level
infrastructure?
Y NBi-level
infrastructure?
Y N
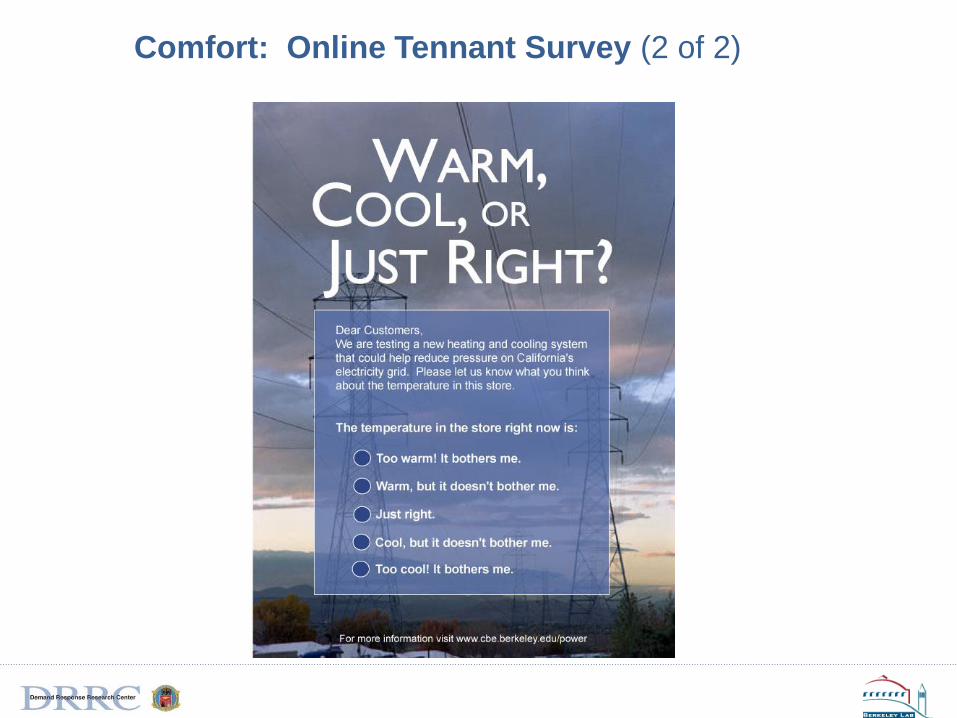
Comfort: Online Tennant Survey (2 of 2)

OpenADR Fundamentals
Provides non-proprietary, open standardized DR interface
Allows electricity providers to communicate DR signals directly to existing customers
Uses common XML language and existing communications such as the Internet
$/kWh
Price Signal
OpenADR Data
Model Internet Comm
Pricing Data Models
Physical Communications
Client Server
Auto-DR Building
Action
End-Use Controls
Control Strategies
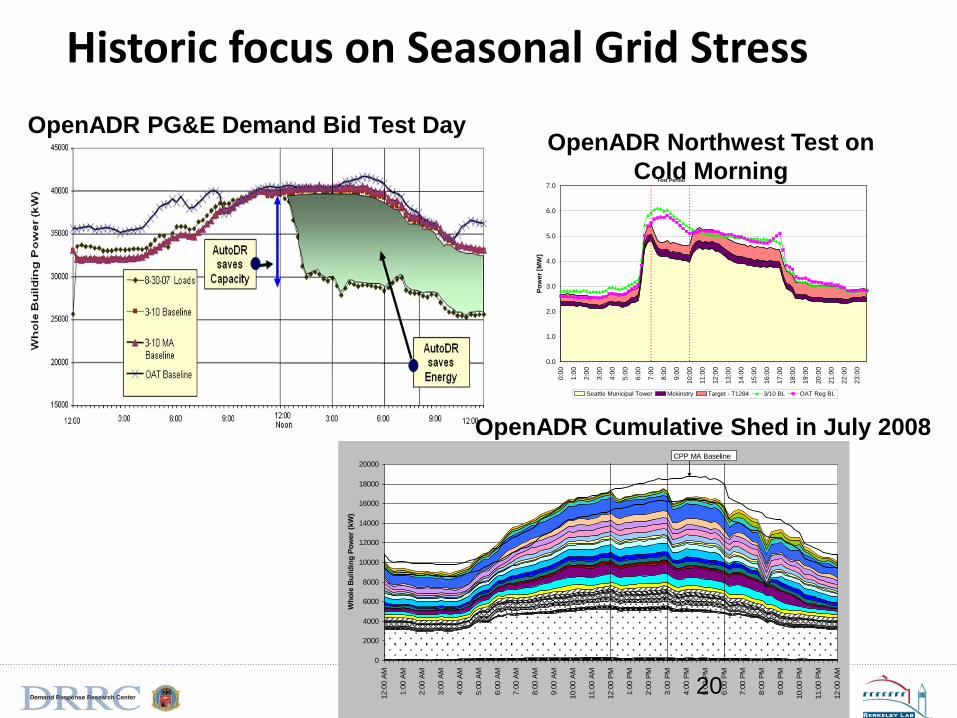
Historic focus on Seasonal Grid Stress
OpenADR PG&E Demand Bid Test Day
7/9/2008
0
2000
4000
6000
8000
10000
12000
14000
16000
18000
20000
12:0
0 A
M
1:0
0 A
M
2:0
0 A
M
3:0
0 A
M
4:0
0 A
M
5:0
0 A
M
6:0
0 A
M
7:0
0 A
M
8:0
0 A
M
9:0
0 A
M
10:0
0 A
M
11:0
0 A
M
12:0
0 P
M
1:0
0 P
M
2:0
0 P
M
3:0
0 P
M
4:0
0 P
M
5:0
0 P
M
6:0
0 P
M
7:0
0 P
M
8:0
0 P
M
9:0
0 P
M
10:0
0 P
M
11:0
0 P
M
12:0
0 A
M
Wh
ole
Bu
ild
ing
Po
wer
(kW
)
CPP MA Baseline
OpenADR Cumulative Shed in July 2008
0.0
1.0
2.0
3.0
4.0
5.0
6.0
7.0
0:0
0
1:0
0
2:0
0
3:0
0
4:0
0
5:0
0
6:0
0
7:0
0
8:0
0
9:0
0
10:0
0
11:0
0
12:0
0
13:0
0
14:0
0
15:0
0
16:0
0
17:0
0
18:0
0
19:0
0
20:0
0
21:0
0
22:0
0
23:0
0
Po
wer
[MW
]
Seattle Municipal Tower Mckinstry Target - T1284 3/10 BL OAT Reg BL
Test Period
OpenADR Northwest Test on
Cold Morning
20
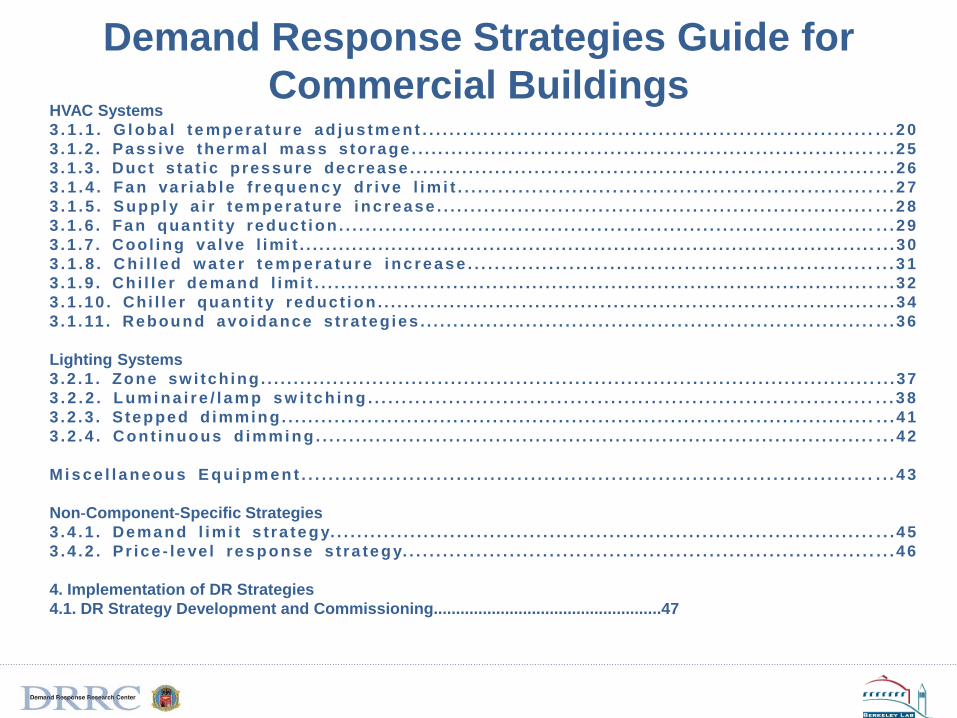
Demand Response Strategies Guide for
Commercial Buildings HVAC Systems
3 . 1 . 1 . G l oba l t e m pe r a tu r e a d j us tm e nt . . . . . . . . . . . . . . . . . . . . . . . . . . . . . . . . . . . . . . . . . . . . . . . . . . . . . . . . . . . . . . . . . . . . . . 2 0
3 .1 .2 . Pass i ve thermal mass s tora ge . . . . . . . . . . . . . . . . . . . . . . . . . . . . . . . . . . . . . . . . . . . . . . . . . . . . . . . . . . . . . . . . . . . . . . . . . 25
3 .1 .3 . Duct s ta t ic pressure decrease . . . . . . . . . . . . . . . . . . . . . . . . . . . . . . . . . . . . . . . . . . . . . . . . . . . . . . . . . . . . . . . . . . . . . . . . . . 26
3 . 1 . 4 . Fa n va r i a b l e f r e que nc y d r i ve l i m i t . . . . . . . . . . . . . . . . . . . . . . . . . . . . . . . . . . . . . . . . . . . . . . . . . . . . . . . . . . . . . . . . . 2 7
3 . 1 . 5 . S upp l y a i r t e m pe r a tu r e i nc r e ase . . . . . . . . . . . . . . . . . . . . . . . . . . . . . . . . . . . . . . . . . . . . . . . . . . . . . . . . . . . . . . . . . . . . 2 8
3 .1 .6 . Fa n qua nt i t y re duct i on . . . . . . . . . . . . . . . . . . . . . . . . . . . . . . . . . . . . . . . . . . . . . . . . . . . . . . . . . . . . . . . . . . . . . . . . . . . . . . . . . . . . 29
3 .1 .7 . Cool ing va lve l imi t . . . . . . . . . . . . . . . . . . . . . . . . . . . . . . . . . . . . . . . . . . . . . . . . . . . . . . . . . . . . . . . . . . . . . . . . . . . . . . . . . . . . . . . . . . . 30
3 . 1 . 8 . C h i l l e d w a te r t e m pe r a t u r e i nc r e a s e . . . . . . . . . . . . . . . . . . . . . . . . . . . . . . . . . . . . . . . . . . . . . . . . . . . . . . . . . . . . . . . 3 1
3 .1 .9 . Ch i l l e r de mand l imi t . . . . . . . . . . . . . . . . . . . . . . . . . . . . . . . . . . . . . . . . . . . . . . . . . . . . . . . . . . . . . . . . . . . . . . . . . . . . . . . . . . . . . . . . 32
3 .1 .10 . Ch i l l e r quant i t y reduct i on . . . . . . . . . . . . . . . . . . . . . . . . . . . . . . . . . . . . . . . . . . . . . . . . . . . . . . . . . . . . . . . . . . . . . . . . . . . . . . . 34
3 .1 .11 . Rebound avo ida nce s t ra teg ies . . . . . . . . . . . . . . . . . . . . . . . . . . . . . . . . . . . . . . . . . . . . . . . . . . . . . . . . . . . . . . . . . . . . . . . . 36
Lighting Systems
3 .2 .1 . Zone sw i tch ing . . . . . . . . . . . . . . . . . . . . . . . . . . . . . . . . . . . . . . . . . . . . . . . . . . . . . . . . . . . . . . . . . . . . . . . . . . . . . . . . . . . . . . . . . . . . . . . . . 37
3 . 2 . 2 . L um i na i r e / l a m p s w i tc h i ng . . . . . . . . . . . . . . . . . . . . . . . . . . . . . . . . . . . . . . . . . . . . . . . . . . . . . . . . . . . . . . . . . . . . . . . . . . . . . . 3 8
3 .2 .3 . S tepped d imming . . . . . . . . . . . . . . . . . . . . . . . . . . . . . . . . . . . . . . . . . . . . . . . . . . . . . . . . . . . . . . . . . . . . . . . . . . . . . . . . . . . . . . . . . . . . . 41
3 .2 .4 . Cont i nuous d imm i ng . . . . . . . . . . . . . . . . . . . . . . . . . . . . . . . . . . . . . . . . . . . . . . . . . . . . . . . . . . . . . . . . . . . . . . . . . . . . . . . . . . . . . . . 42
Mi s c e l l a ne ous E qu i pm e n t . . . . . . . . . . . . . . . . . . . . . . . . . . . . . . . . . . . . . . . . . . . . . . . . . . . . . . . . . . . . . . . . . . . . . . . . . . . . . . . . . . . . . . . . 4 3
Non‐Component‐Specific Strategies
3 .4 .1 . Dema nd l im i t s t ra te gy. . . . . . . . . . . . . . . . . . . . . . . . . . . . . . . . . . . . . . . . . . . . . . . . . . . . . . . . . . . . . . . . . . . . . . . . . . . . . . . . . . . . . 45
3 .4 .2 . Pr ice ‐ l e ve l res ponse s t ra te gy. . . . . . . . . . . . . . . . . . . . . . . . . . . . . . . . . . . . . . . . . . . . . . . . . . . . . . . . . . . . . . . . . . . . . . . . . . 46
4. Implementation of DR Strategies
4.1. DR Strategy Development and Commissioning...................................................47

DR Quick Assessment Tool
0
50
100
150
200
250
300
350
0:00 2:00 4:00 6:00 8:00 10:00 12:00 14:00 16:00 18:00 20:00 22:00
Time
Wh
ole
Bu
ild
ing
Po
wer
k
W
Baseline Pre-cooling with linear temp set up
Pre-cooling with exponential temp set up No pre-cooling with exponential temp set up
Pre-cooling with step temp set up
High Price Period
`
Simple free EnergyPlus tool for retail and office buildings to provide DR
estimates for common HVAC and lighting strategies
0.0
0.1
0.2
0.3
0.4
0.5
0.6
0.7
0.8
0.9
1.0
#1 #2 #3 #4 #5 #6 #7 #8 #9 #10 #11
Av
era
ge
Dem
an
d S
av
ing
s (W
/Sq
ft)
Actual data Simulation Results
Excellent performance predicting DR in southern Calif.
Included modeling pre-cooling strategies
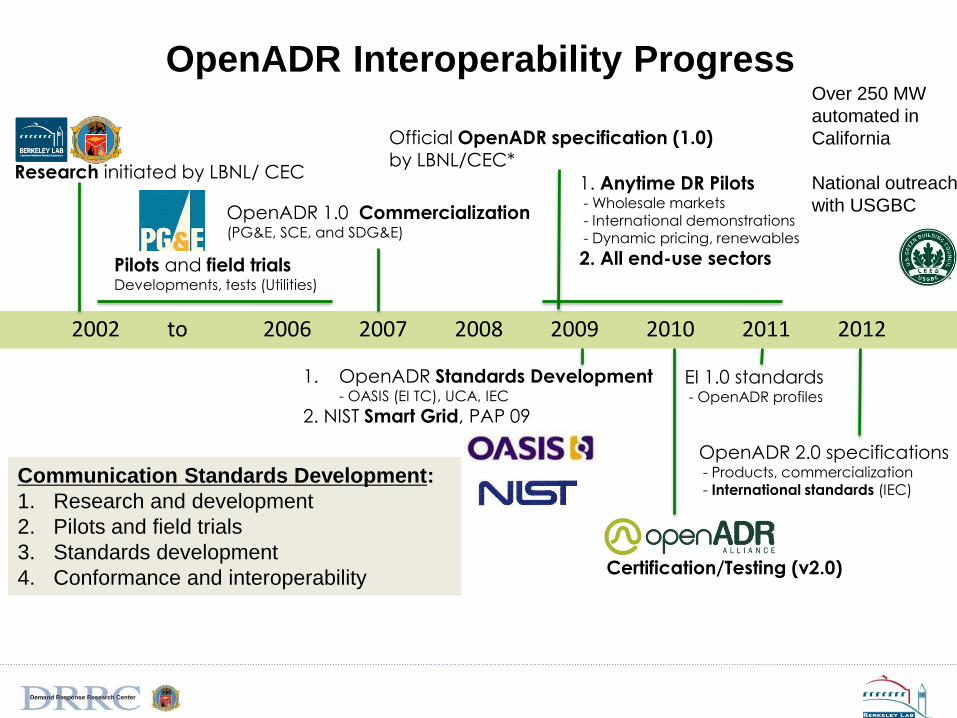
OpenADR Interoperability Progress
2002 to 2006 2007 2008 2009 2010 2011 2012
Research initiated by LBNL/ CEC
Pilots and field trials Developments, tests (Utilities)
OpenADR 1.0 Commercialization (PG&E, SCE, and SDG&E)
Official OpenADR specification (1.0) by LBNL/CEC*
1. OpenADR Standards Development - OASIS (EI TC), UCA, IEC
2. NIST Smart Grid, PAP 09
1. Anytime DR Pilots - Wholesale markets - International demonstrations - Dynamic pricing, renewables
2. All end-use sectors
Certification/Testing (v2.0)
Communication Standards Development:
1. Research and development
2. Pilots and field trials
3. Standards development
4. Conformance and interoperability
EI 1.0 standards - OpenADR profiles
OpenADR 2.0 specifications - Products, commercialization - International standards (IEC)
Over 250 MW
automated in
California
National outreach
with USGBC
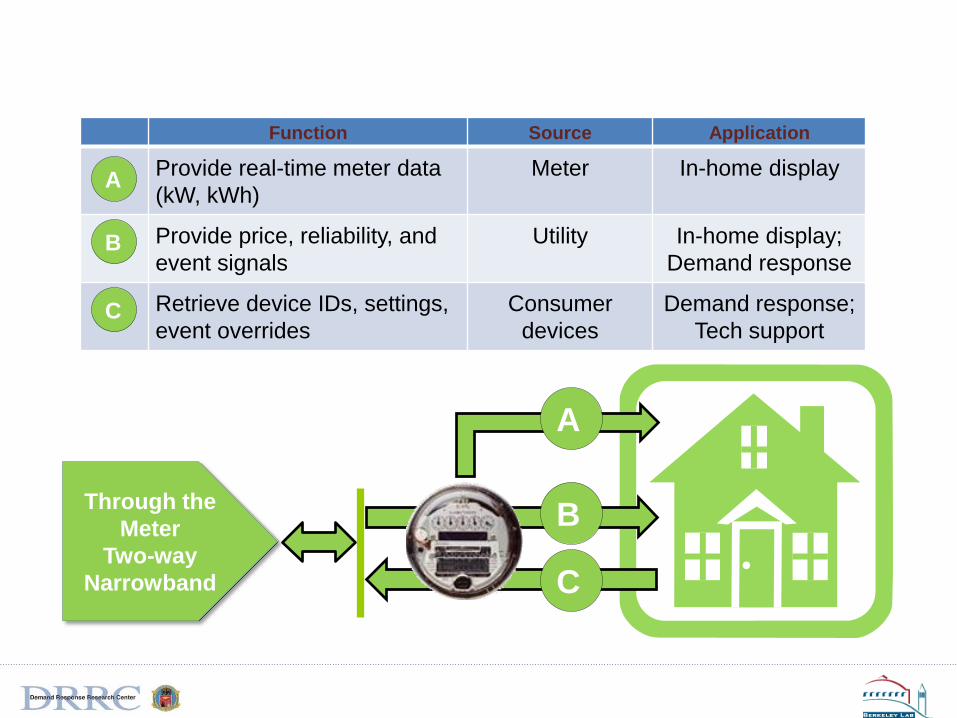
SEP Functionality
Function Source Application
A Provide real-time meter data
(kW, kWh)
Meter In-home display
B Provide price, reliability, and
event signals
Utility In-home display;
Demand response
C Retrieve device IDs, settings,
event overrides
Consumer
devices
Demand response;
Tech support
Through the
Meter
Two-way
Narrowband
B
A
C
A
B
C

Thermostats and Plug Load Meters
25
• Sub-metering of the attached device or
appliance at 10second frequency
• Remote on-off control
• The SmartPlug supports 110 Volt and 15
Amp or less
Historical Energy
Analytics
Web based
Monitoring/Contro
l
• Demonstrate DR capabilities using
OpenADR enabled Wi-Fi Thermostats
• OpenADR client and logic native to
the device
• DR events triggered with OpenADR
1.0 Servers AutoGrid DROMS or
Akuacom DRAS.
Web based
Monitoring/Contro
l
Programmable
Communicating
Thermostats
Smart Plug
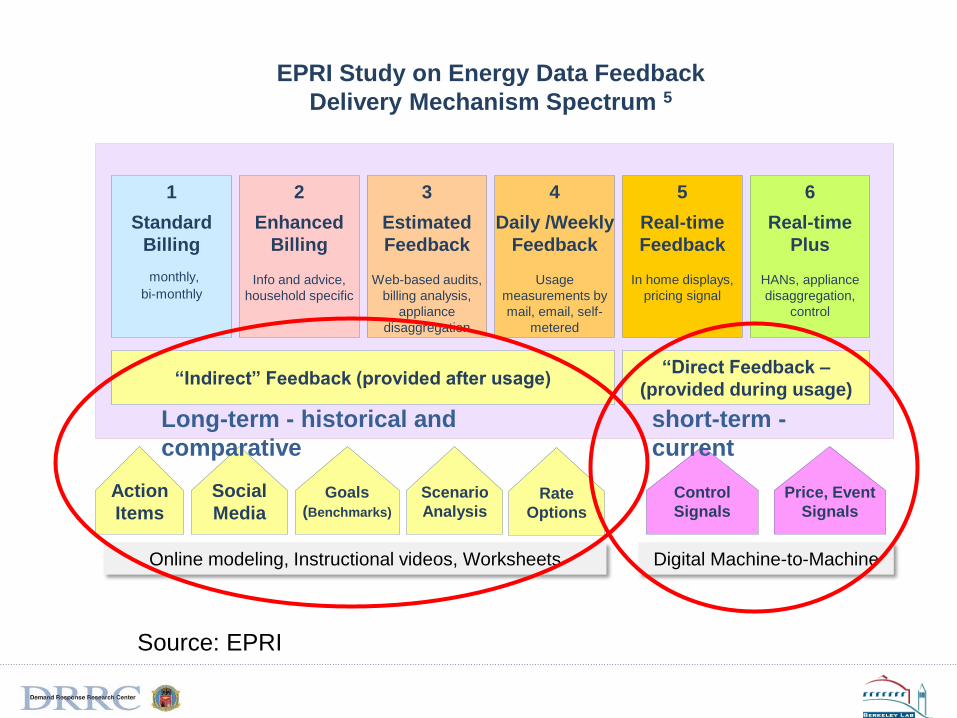
Action
Items
Social
Media Goals
(Benchmarks)
Control
Signals
Price, Event
Signals
Scenario
Analysis
EPRI Study on Energy Data Feedback
Delivery Mechanism Spectrum 5
Rate
Options
1
Standard
Billing
monthly,
bi-monthly
2
Enhanced
Billing
Info and advice,
household specific
3
Estimated
Feedback
Web-based audits,
billing analysis,
appliance
disaggregation
4
Daily /Weekly
Feedback
Usage
measurements by
mail, email, self-
metered
5
Real-time
Feedback
In home displays,
pricing signal
6
Real-time
Plus
HANs, appliance
disaggregation,
control
“Indirect” Feedback (provided after usage) “Direct Feedback –
(provided during usage)
Online modeling, Instructional videos, Worksheets Digital Machine-to-Machine
Customer Information and Feedback Continuum
Long-term - historical and
comparative
short-term -
current
Source: EPRI
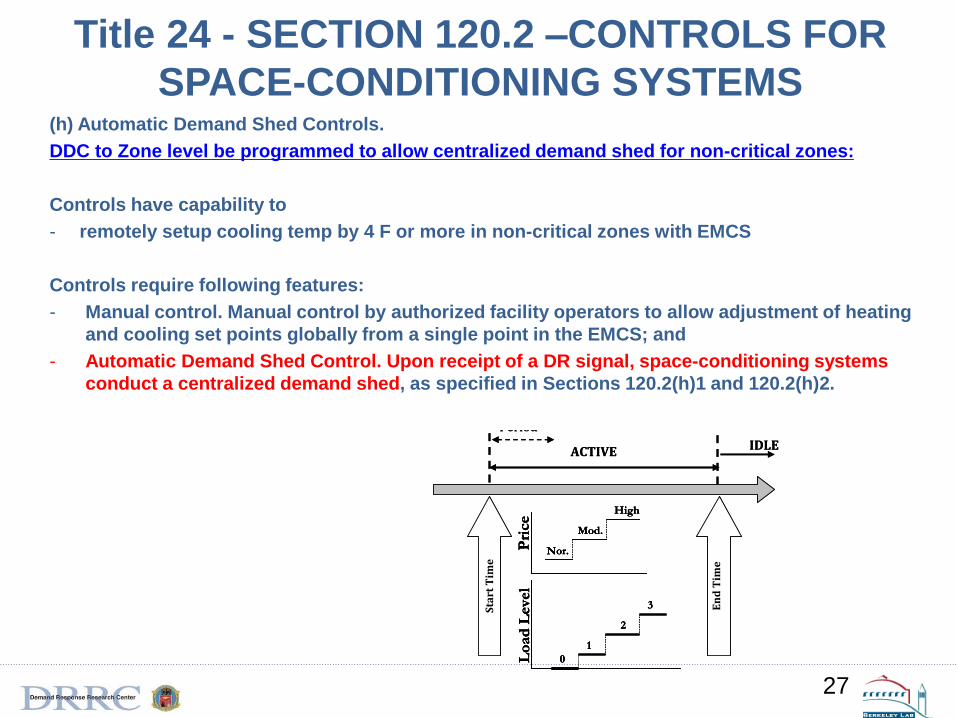
Title 24 - SECTION 120.2 –CONTROLS FOR
SPACE-CONDITIONING SYSTEMS (h) Automatic Demand Shed Controls.
DDC to Zone level be programmed to allow centralized demand shed for non-critical zones:
Controls have capability to
- remotely setup cooling temp by 4 F or more in non-critical zones with EMCS
Controls require following features:
- Manual control. Manual control by authorized facility operators to allow adjustment of heating
and cooling set points globally from a single point in the EMCS; and
- Automatic Demand Shed Control. Upon receipt of a DR signal, space-conditioning systems
conduct a centralized demand shed, as specified in Sections 120.2(h)1 and 120.2(h)2.
27
PLP Event
Sta
rt T
ime
En
d T
ime
ACTIVE IDLE
Ramp Period
Pri
ce
Nor.
Mod.
High
Lo
ad
Level
1
2
3
0
PLP Event
Sta
rt T
ime
En
d T
ime
ACTIVE IDLE
Ramp Period
Pri
ce
Nor.
Mod.
High
Pri
ce
Nor.
Mod.
High
Lo
ad
Level
1
2
3
0Lo
ad
Level
1
2
3
0
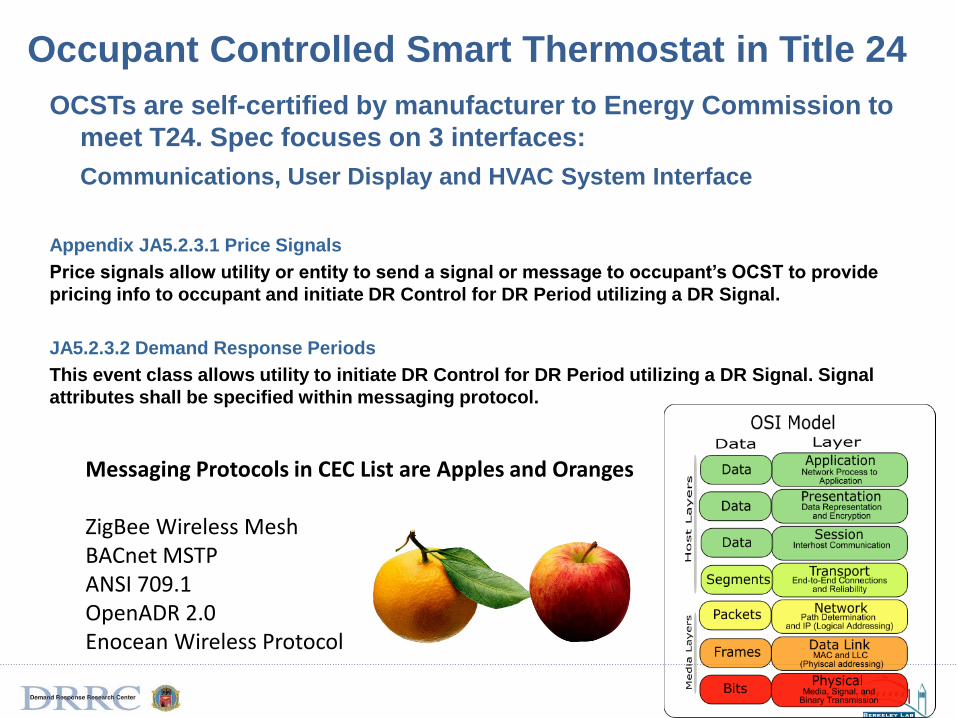
Occupant Controlled Smart Thermostat in Title 24
OCSTs are self-certified by manufacturer to Energy Commission to
meet T24. Spec focuses on 3 interfaces:
Communications, User Display and HVAC System Interface
Appendix JA5.2.3.1 Price Signals
Price signals allow utility or entity to send a signal or message to occupant’s OCST to provide
pricing info to occupant and initiate DR Control for DR Period utilizing a DR Signal.
JA5.2.3.2 Demand Response Periods
This event class allows utility to initiate DR Control for DR Period utilizing a DR Signal. Signal
attributes shall be specified within messaging protocol.
Messaging Protocols in CEC List are Apples and Oranges ZigBee Wireless Mesh BACnet MSTP ANSI 709.1 OpenADR 2.0 Enocean Wireless Protocol

Renewables and Managing the “Duck” Curve
Source: Sanders, H., “CEC IEPR Demand Response Workshop”, June 17, 2013, slide 3.
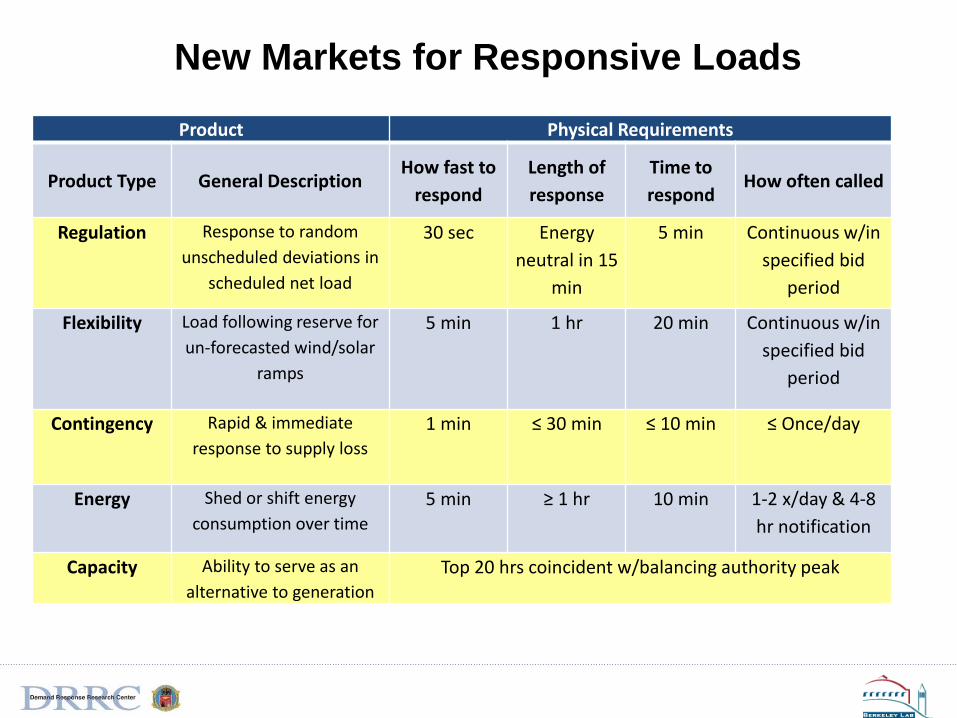
New Markets for Responsive Loads
Product Physical Requirements
Product Type General Description How fast to
respond
Length of
response
Time to
respond How often called
Regulation Response to random
unscheduled deviations in
scheduled net load
30 sec Energy
neutral in 15
min
5 min Continuous w/in
specified bid
period
Flexibility Load following reserve for
un-forecasted wind/solar
ramps
5 min 1 hr 20 min Continuous w/in
specified bid
period
Contingency Rapid & immediate
response to supply loss
1 min ≤ 30 min ≤ 10 min ≤ Once/day
Energy Shed or shift energy
consumption over time
5 min ≥ 1 hr 10 min 1-2 x/day & 4-8
hr notification
Capacity Ability to serve as an
alternative to generation
Top 20 hrs coincident w/balancing authority peak
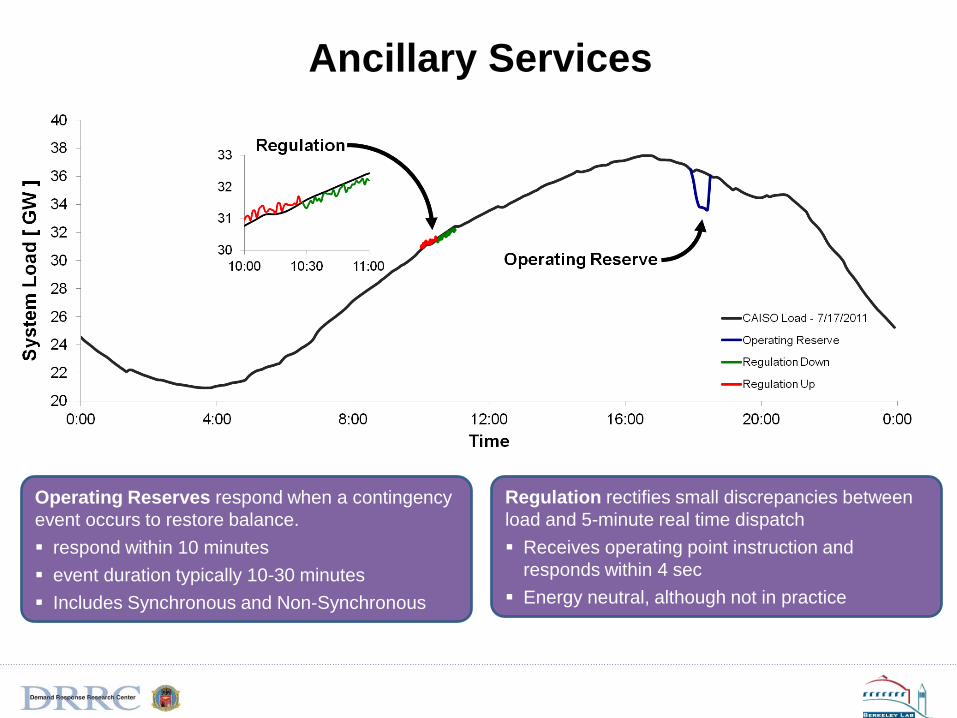
Ancillary Services
Regulation rectifies small discrepancies between
load and 5-minute real time dispatch
Receives operating point instruction and
responds within 4 sec
Energy neutral, although not in practice
Operating Reserves respond when a contingency
event occurs to restore balance.
respond within 10 minutes
event duration typically 10-30 minutes
Includes Synchronous and Non-Synchronous
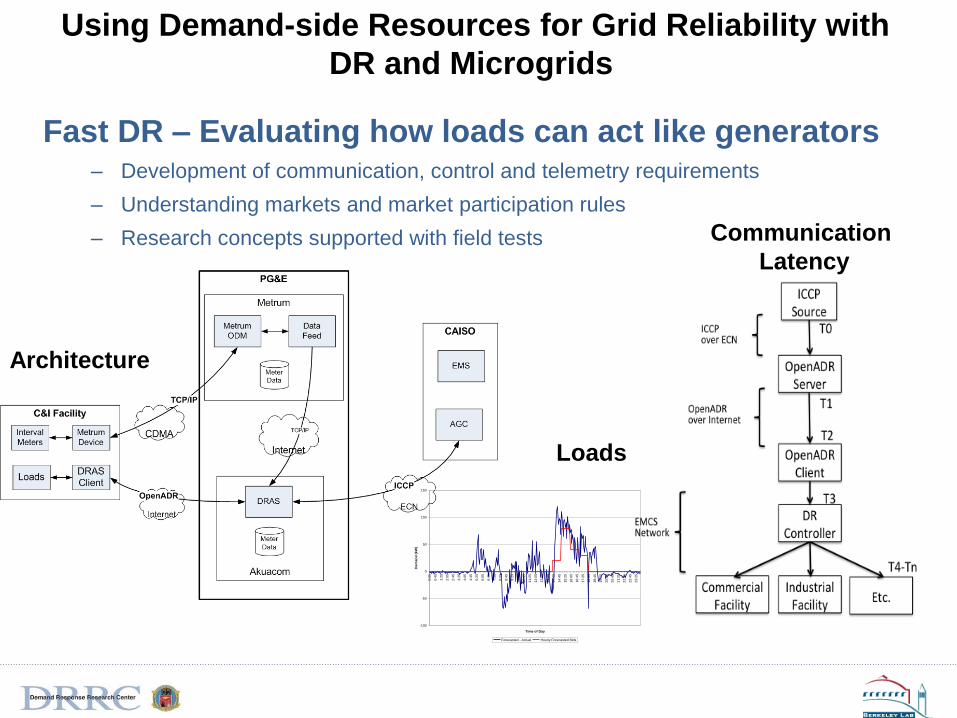
Fast DR – Evaluating how loads can act like generators – Development of communication, control and telemetry requirements
– Understanding markets and market participation rules
– Research concepts supported with field tests
-100
-50
0
50
100
150
0:0
5
0:4
5
1:2
5
2:0
5
2:4
5
3:2
5
4:0
5
4:4
5
5:2
5
6:0
5
6:4
5
7:2
5
8:0
5
8:4
5
9:2
5
10:0
5
10:4
5
11:2
5
12:0
5
12:4
5
13:2
5
14:0
5
14:4
5
15:2
5
16:0
5
16:4
5
17:2
5
18:0
5
18:4
5
19:2
5
20:0
5
20:4
5
21:2
5
22:0
5
22:4
5
23:2
5
Time of Day
Dem
an
d (
kW
)
Forecasted - Actual Hourly Forecasted Bids
Using Demand-side Resources for Grid Reliability with
DR and Microgrids
Architecture
Loads
Communication
Latency
Summary
Key Issues
• Demand Response is Growing Around US
• Growing capabilities of buildings to provide
services to the electric grid
• New telemetry and control systems provide
low cost automation
• Large need to education facility managers
• Economics are challenges for bill savings
Acknowledgements / Sponsors –
California Energy Commission, US DOE,
Bonneville Power Administration, PG&E, SCE