demand for public transport in germany and the usa: … · around the world, the rates of car...
TRANSCRIPT
Demand for Public Transport in Germany and the USA:
An Analysis of Rider Characteristics
RALPH BUEHLER∗ AND JOHN PUCHER∗∗
∗School of Public and International Affairs, Virginia Tech, Alexandria, VA, USA; ∗∗Bloustein
School of Planning and Public Policy, Rutgers University, New Brunswick, NJ, USA
(Received 23 March 2012; revised 12 June 2012; accepted 26 June 2012)
ABSTRACT This paper first provides a brief review of trends in public transport demand from 1980 to
2010 in 16 countries in Europe, North America, and Australia. The focus, however, is on a detailed analy-
sis of public transport demand in Germany and the USA, using uniquely comparable national travel
surveys from 2001/2002 and 2008/2009 for both countries. Public transport has been far more successful
in Germany than in the USA, with much greater growth in overall passenger volumes and trips per
capita. Even controlling for differences between the countries in demographics, socio-economics, and
land use, logistic regressions show that Germans are five times as likely as Americans to use public trans-
port. Moreover, public transport in Germany attracts a much broader cross-section of society and for a
greater diversity of trip purposes. The success of German public transport is due to a coordinated package
of mutually supportive policies that include the following: (1) more and better service, (2) attractive fares
and convenient ticketing, (3) full multimodal and regional integration, (4) high taxes and restrictions on
car use, and (5) land-use policies that promote compact, mixed-use developments. It is the integrated
package of complementary policies that explains why public transport in Germany can compete so
well with the private car, even among affluent households. Conversely, it is the lack of complementary
policies that explains the continuing struggle of public transport in the USA.
Introduction
For many decades, public transport has been struggling to compete with the auto-mobile. Around the world, the rates of car ownership have been increasing asincomes rise and cars become more affordable. The continuing decentralization ofcities into suburban and exurban areas has generated land-use patterns and tripsthat are difficult for public transport systems to serve. Especially during the decadesimmediately following the Second World War, demand for public transport declined,first in North America but then in Western Europe as well (Cervero, 1998; Downs, 2004;Dunn, 1981, 1998; Pacione, 2009; TRB, 2001; Webster & Bly, 1981, 1982; Yago, 1984).
Since the 1960s and 1970s, however, the number of annual public transport pas-sengers in North America and Western Europe has generally been increasing.Although there is much variation among countries, the market share of publictransport has stabilized in most countries (European Commission, 2011; ITF,
Correspondence Address: Ralph Buehler, School of Public and International Affairs, Virginia Tech,Alexandria Center, 1021 Prince Street, Suite 200, Alexandria, VA 22314, USA. Email: [email protected];ralph. [email protected]
Transport Reviews, Vol. 32, No. 5, 541–567, September 2012
0144-1647 print/1464-5327 Online/12/050541-27# 2012 Taylor & Francishttp://dx.doi.org/10.1080/01441647.2012.707695
Dow
nloa
ded
by [
Rut
gers
Uni
vers
ity]
at 1
3:02
31
Aug
ust 2
012
2011). It is encouraging that public transport has succeeded in raising overall pas-senger levels and maintaining its market share in spite of rising incomes and carownership and extensive, car-oriented suburban sprawl.
This paper first provides a brief review of international trends in public transportdemand from 1980 to 2010, documenting the differences among countries. It thenfocuses on a detailed analysis of public transport demand in Germany and theUSA, using uniquely comparable national travel surveys from 2001/2002 and2008/2009 for both countries. The questions of particular interest are as follows:
(1) Who rides public transport (disaggregated by gender, age, employmentstatus, income, car ownership, city size, population density, and urbanversus rural location)?
(2) What trip purposes does public transport serve (trips to work, school, shop-ping, recreation, and visiting friends and family)?
(3) How do rider characteristics and trip purposes differ between Germany andthe USA, and how have they changed over time?
As this paper demonstrates, Germany has been much more successful than theUSA at raising public transport use, both on a per capita basis and as a marketshare of total urban travel. We conclude the paper with an examination of thepublic policies in Germany that have contributed to the impressive success ofpublic transport and draw lessons that might be useful for other countries.
International Overview of Public Transport Demand
As shown in Figure 1, per capita levels of public transport use vary by roughly 10:1,ranging from 237 trips per year in Switzerland to only 24 trips per year in the USA. Itmay seem surprising that the Netherlands has the second lowest number of tripsper capita (51), but that is due to the extraordinary importance of cycling, whichaccounted for 26% of all trips by the Dutch in 2008, the highest bike share of anyEuropean country (Pucher & Buehler, 2010, 2012). It is noteworthy that Canadahas more than twice the level of public transport use in the USA, probably due tomore compact settlement patterns, lower car ownership, higher fuel prices, andearlier public ownership, operation, and financing of public transport systems(Filion, Bunting, McSpurren, & Tse, 2004; Grant, 2002; Miron, 2003; TRB, 2001).All of the European countries shown in Figure 1 have much higher public transportuse than that in the USA, but even within Europe, there are large differences.Studies suggest that the greater demand for public transport in Europe is due tohigher density cities, much higher taxes on fuel and car purchases, less (andmore expensive) car parking, and a wide range of restrictions on car use in cities.In addition, European cities generally offer more and better public transport ser-vices than the USA (Cervero, 1998; Mees, 2010; Newman & Kenworthy, 1999;Pucher & Kurth, 1996; TRB, 2001; Vuchic, 1999).
An alternative indicator of public transport demand is the mode share of publictransport as a percentage of trips by all means of travel. Figure 2 shows trends inmode share over the past three decades for ten countries. Similar to the per capitatrip numbers shown in Figure 1, Switzerland also has the highest share of trips bypublic transport (.20%), roughly two to three times higher than that in the otherEuropean countries (5–11%) but ten times as high as that in the USA (,2%).The mode share of public transport has been fairly stable in all the countries.
542 R. Buehler and J. Pucher
Dow
nloa
ded
by [
Rut
gers
Uni
vers
ity]
at 1
3:02
31
Aug
ust 2
012

Figure 1. Number of annual public transport trips per capita in Europe and North America, 2005–2010.Note: Due to differences in survey design, trip definitions, and timing, travel survey results among
countries are not entirely comparable.Sources: APTA, 2012; BFS, 2011; BMVBS, 1991–2012; CBS, 2011; DfT, 2011; DMT, 2010; ITF, 2011; SIKA,
2007; SOeS, 2010; TOI, 2011; USDOT, 2010; WSP, 2006.
Figure 2. Percentage of trips by public transport (all trip purposes).Notes: Due to differences in survey design, trip definitions, and timing, travel survey results among
countries are not entirely comparable. Data for the German survey in 1980 are for West Germanyonly. Data for German surveys from 1993 to 2010 are for the re-unified Germany. Survey data were col-lected for the following specific years in each country: Switzerland (1990, 2000, 2005, 2010); Germany(1980, 1993, 2000, 2005, 2010); Sweden (1999, 2007); Norway (1992, 2001, 2005, 2009); Great Britain (1989,2000, 2005, 2010); France (1994, 2008); Denmark (1981, 1992, 2005, 2009); Finland (1992, 1999, 2005);Netherlands (1990, 2000, 2005, 2010), and USA (1982, 1990, 2001, 2009).Sources: APTA, 2012; BFS, 2011; BMVBS, 1991–2010; CBS, 2011; DfT, 2011; DMT, 2010; ITF, 2011; SIKA,
2007; SOeS, 2010; TOI, 2011; USDOT, 2010; WSP, 2006.
Demand for Public Transport in Germany and the USA 543
Dow
nloa
ded
by [
Rut
gers
Uni
vers
ity]
at 1
3:02
31
Aug
ust 2
012
It increased slightly in Switzerland, Germany, Sweden, Norway, and the UK anddecreased slightly in France, Denmark, Finland, and the Netherlands. Theseaggregate national statistics mask variation within countries. For example,public transport use rose considerably in London but declined in many otherBritish metropolitan areas (DfT, 2010).
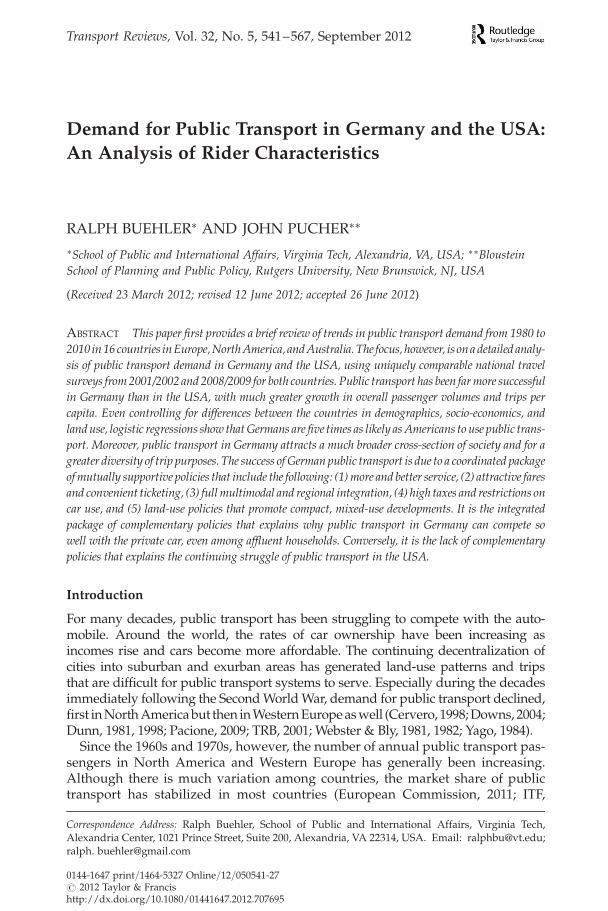
Whereas Figure 2 shows mode share for all trip purposes combined, Figure 3only reports mode share for the trip to work. Because Ireland, Canada, and Aus-tralia do not have national travel surveys, the only information available on modeshares is from their censuses, which report the share of workers using publictransport as their main means of travel for the journey to work. For comparison,mode shares of workers in Germany and the USA are also shown.
The largest increase in public transport mode share for work commuters was inGermany, rising from about 13% in 1993 to 16% in 2008. The censuses for Canadaand Australia report slight increases in public transport mode share over the pasttwo decades, while mode share declined in Ireland. There has been almost nochange in the share of American workers commuting by public transport, remain-ing about 5%, a third as high as the share in Germany.
It is beyond the scope of this paper to analyse in depth the many possiblereasons for the variation among the countries included in Figures 1–3. Thesethree exhibits are mainly intended as an overview to provide the internationalcontext for the detailed analysis of public transport demand trends and patternsin Germany and the USA, which is the focus of this paper.
Long-Term Trends in Public Transport Demand in Germany and the USA
Public transport use plummeted in the USA after the Second World War from 16.4billion trips in 1945 to only 4.7 billion in 1973 (Figure 4). The loss of 13.7 billionpassengers reduced overall demand by almost three-fourths. The initial decline
Figure 3. Percentage of workers using public transport as main means of transport to work.Notes: Due to differences in survey design, trip definitions, and timing, travel survey results amongcountries are not entirely comparable. Survey data were collected for the following specific years ineach country: Germany (1993, 2000, 2005, 2010); Ireland (1991, 2002, 2006); Canada (1996, 2001,2006), Australia (1991, 2001, 2006); and USA (1990, 2000, 2005, 2010).
Sources: ABS, 2011; BMVBS, 1991–2012; CSO, 2010; StatCan, 1996-2010; USDOT, 2000–2012.
544 R. Buehler and J. Pucher
Dow
nloa
ded
by [
Rut
gers
Uni
vers
ity]
at 1
3:02
31
Aug
ust 2
012

was due to the ending of wartime fuel and tire rationing and the resumption of carproduction, which had been interrupted by the use of factories to construct mili-tary vehicles. Throughout the 1950s and 1960s, however, rapidly rising per capitaincome and car ownership—as well as the resulting proliferation of car-orientedsuburban sprawl—undermined public transport demand (Altshuler, Womack,& Pucher, 1979; Yago, 1984). The lack of public financing led to rising fares, dete-riorating service, and widespread bankruptcies of public transport firms through-out the country. Streetcar services were almost completely terminated and onlypartially replaced by bus services. By 1970, most public transport services in theUSA were poorly maintained, undependable, and uncoordinated (Altshuleret al., 1979; Dunn, 1981; Yago, 1984).
During the 1970s, however, there was dramatic growth in federal governmentsupport for public transport, including both capital and operating subsidies. Stateand local government support also increased, with an almost complete transitionto public ownership, management, and financing by the end of the 1970s (Pucher,Markstedt, & Hirschman, 1983). There was a turnaround in public transportdemand in the mid-1970s, thanks to the considerable expansion and improvementof public transport services enabled by government funding. Although there havebeen many ups and downs, the general trend since 1973 has been upward. Thebiggest increase was from 1973 to 1980 (from 4.7 to 6.0 million passengers) when
Figure 4. Trend in total public transport trips and trips per capita in Germany and the USA,1945–2010.Notes: Data from 1950 to 1990 are for West Germany only. West German data from 1950 to 1960 excludeWest Berlin and the Saarland. German data from 1991 to 2010 are for the re-unified Germany, includingthe former East Germany. The strong increase in Germany between 2003 and 2004 is a statistical artifactdue to a change in data collection methodology. Public transport trips as shown in this graphic aredefined from origin to destination; thus, a trip involving transfers between public transport lines ormodes is counted as one trip (technically designated as a linked trip). Since 1970 official data for theUSA report unlinked trips, with transfers counted as additional trips. This study converted theunlinked trips to linked trips in order to ensure comparability with Germany, using a methodologyexplained in Polzin and Chu (2003).
Source: APTA, 2012; BMVBS, 1991–2012.
Demand for Public Transport in Germany and the USA 545
Dow
nloa
ded
by [
Rut
gers
Uni
vers
ity]
at 1
3:02
31
Aug
ust 2
012

the infusion of government funding was most dramatic. Since 1980, growth has beenmodest but steady, rising to 7.2 billion passengers by 2010 (APTA, 2012). In general,short-term declines in passengers have been due to recessions, while short-termspurts in demand have been due to economic booms or sharp rises in fuel prices.
Overall, it was a considerable accomplishment turning around the dramatic fallin public transport demand between 1945 and 1973. The total number of passen-gers rose by 57% between 1973 and 2010. Nevertheless, demand for publictransport barely kept pace with overall population growth, with only a slightincrease in trips per capita (from 22 in 1973 to 24 in 2010). This is consistentwith the roughly constant mode share of public transport shown for the USA inFigures 2 and 3. Moreover, the revival of public transport in the USA requiredan enormous infusion of subsidy funds. Including all levels of government andboth capital and operating subsidies, total financial assistance between 1975 and2010 exceeded $830 billion in inflation-adjusted, constant 2010 dollars, averagingmore than $23 billion per year (APTA, 2012; USDOT, 2012a).
There are no statistics available for Germany for the years immediately after theSecond World War. From 1950 to 1956, however, public transport demand rosesharply (Figure 4). Much of the public transport infrastructure had been destroyedduring the war, but by the early 1950s, most of the infrastructure was restored or atleast repaired enough so that it was again usable (Baron, 1995). In the 1950s, theWest German economy began its strong recovery, with increasing employmentand more trips to work. Because car ownership was still low (80 cars per 1000population), most travel was by public transport, walking, and cycling (BMVBS,1991–2012). Moreover, after the Second World War, over 6 million ethnicGermans from Poland, Czechoslovakia, and other Soviet-occupied countries inEastern Europe fled to West Germany (Baron, 1995). Crowded urban areas,increasing employment, and low car ownership levels contributed to risingdemand for public transport in West Germany in the 1950s (Yago, 1984).
Eventually, however, the economic recovery in West Germany led to steadyincreases in per capita income, rising car ownership, and declining demand forpublic transport (Baron, 1995; Dunn, 1981; Yago, 1984). Overall, the totalnumber of public transport passengers in West Germany fell by only 1%between 1956 and 1968, but trips per capita fell from 136 to 107, a 21% decline.During the same period, motorization almost tripled, reaching 230 cars per 1000population in 1968 (BMVBS, 1991–2012). Moreover, in response to crowdedhousing in cities, the federal government subsidized the construction of single-family houses at the urban fringe (Baron, 1995; BMVBS, 2008; Yago, 1984).
Public transport operators were not able to serve new low-density suburbanlocations. At the same time, the federal government subsidized reconstructionand expansion of the federal highway network, and most cities widened urbanroads, built new arterial highways, and constructed parking garages in theircity centres (Koeberlein, 1997). Faced with increasing competition from the auto-mobile and decreasing demand for public transport, West German public trans-port systems reduced or cut services, replaced trolley services with buses, andraised fares (Baron, 1995; Schmucki, 2001; Yago, 1984).
Between 1968 and 1982, public transport demand increased from 6.4 to 7.7billion passengers per year and from 107 to 125 annual trips per capita. Thisincrease is partially explained by the two oil price shocks of the 1970s. Over thesame period, public transport services were expanded and improved, thanks tofederal government subsidies for capital investments in local public transport.
546 R. Buehler and J. Pucher
Dow
nloa
ded
by [
Rut
gers
Uni
vers
ity]
at 1
3:02
31
Aug
ust 2
012
As in the USA, during the 1980s, governments in West Germany decreased theirsubsidies for public transport. By 1989, the year before German reunification, publictransport demand had fallen by about 15% to 6.5 billion annual passengers or 105trips per capita. Data shown in Figure 4 from 1991 onwards are for the reunifiedGermany and show a steady increase from 9.2 billion passengers in 1991 to 11.5billion in 2010. Per capita ridership increased from 114 to 139 trips per person peryear. The increase in ridership in the 1990s was concentrated in the former WestGermany. Between 1990 and 2000, public transport demand in the cities offormer East Germany fell from 24% to 12% of trips (Broeg & Erl, 2003). Moreover,motorization more than doubled in the former East Germany from 237 to 499cars per 1000 inhabitants (BMVBS, 1991–2012). In contrast, public transportdemand in the former West Germany increased by 20% during the 1990s—offset-ting the steep decline in the former East Germany. Since the early 2000s, publictransport demand has been increasing throughout Germany.
Rising public transport demand in Germany since 1990 is partly explained by adoubling in the gasoline (petrol) tax from $0.41 per litre in 1990 to $0.88 per litre in2010. Moreover, public transport systems have greatly improved their servicesthrough regional coordination of ticketing and timetables, new vehicles, real-time information at stations and on vehicles, and discounted monthly, semester,and annual tickets. Recent policies of German public transport agencies and gov-ernments are discussed in more detail later in this paper. The next sections focuson a detailed comparison of public transport demand in Germany and the USA in2001/2002 and 2008/2009.
Similarity of German and American Travel Surveys in 2001/2002 and 2008/2009
International comparative studies of travel behaviour typically are hampered byinconsistencies among country surveys in their timing, variable definitions, andsurvey methodology (Bassett, Pucher, Buehler, Thompson, & Crouter, 2008;Buehler, Pucher, Merom, & Bauman, 2011; Kunert, Kloas, & Kuhfeld, 2002;Pucher, Buehler, Merom, & Bauman, 2011). In contrast, the Mobility in Germany(MiD) surveys of 2002 and 2008 are almost entirely comparable with the 2001and 2009 National Household Travel Surveys (NHTS) in the USA. They aresimilar in their design and timing in almost every respect and thus offer aunique opportunity to compare public transport demand in two countries.Although the two countries’ survey names differ by 1 year, their data collectionperiods are almost identical. Indeed, both surveys would be more accuratelydesignated by their actual survey periods of 2001/2002 and 2008/2009.
Table 1 compares the MiD survey and NHTS along many dimensions. Forboth years, each country’s surveys used almost identical data collection methodsand included virtually the same variables. The surveys are so similar becauseGerman researchers used the 2001 NHTS as a model for their 2002 MiD survey.In fact, because of changes in methodology starting with the 2001 NHTS, andcopied by the 2002 MiD, the NHTS and MiD survey are more comparable to eachother than to any earlier surveys within their respective countries. The data collec-tion period was 14 months for all four surveys. After being contacted by phone andagreeing to participate, all US households completed a computer-assisted tele-phone interview (CATI). Most German households also completed the surveyusing CATI; only 17% of households completed the survey online or on paper.
Demand for Public Transport in Germany and the USA 547
Dow
nloa
ded
by [
Rut
gers
Uni
vers
ity]
at 1
3:02
31
Aug
ust 2
012

All household members recorded their travel in a 1-day travel diary during a ran-domly assigned day. The diary helped respondents report their travel day activitiesin a subsequent phone interview. All surveys included adults and children as targetpopulation. Travel information for children aged ,15 years was collected throughproxy interviews with parents.
Recent Trends in Public Transport Demand in Germany and the USA
As discussed above, the two most recent national travel surveys in Germany andthe USA are almost entirely comparable. Moreover, the two countries are similar
Table 1. Comparability of German and US travel surveys 2001/2002and 2008/2009
MiD 2001/2002 and 2008/2009(Germany)
NHTS 2001/2002and 2008/2009 (USA)
Collection rhythm KontinuierlicheVerkehrserhebung (KONTIV)’76, ’82, ’89; MID ’02, ’08
Nationwide Personal TransportationSurvey ‘69,‘77, ‘83, ‘90, ‘95; NHTS ‘01, ‘09
Survey period 14 months 14 months11/2001–
12/200202/2008–
04/200903/2001–
04/200203/2008–
04/2009
Sample sizeHouseholds 25, 848 (2002) 25, 922 (2008) 69, 817 (2001) 150, 147 (2009)Individuals 61, 729 (2002) 60, 713 (2008) 162, 758 (2001) 304, 184 (2009)
Survey method CATI (95% in 2002 and 83% ofhouseholds in 2008)
CATI (100% in 2001 and 2009)
Target population Civilian population
Eligibility ofhouseholdmembers
Adults and all children in 2002and 2008
Adults and all children in 2001; adultsand children aged 5 years and older in2009
Sampling technique Stratified random sample
Data collectionperiod perrespondent
1-day travel diary for randomly assigned travel day
Response rates(% of households)
42% (2002) 21% (2008) 41% (2001) 20% (2009)
Inclusion criterionfor households
At least 50% of householdmembers responding
At least 50% of household membersover 18 years old responding
Weights Selection reciprocal, non-response, household size, weekday,month, regional characteristics; trimming of large weights
Data level Household, person, trip, car
Representative For nation and individual states For nation and individual censusregions
Definition of trips From one address to another
Sources: Infas and DLR, 2010; DIW, 2004; Kunert et al., 2002; USDOT, 2010.
548 R. Buehler and J. Pucher
Dow
nloa
ded
by [
Rut
gers
Uni
vers
ity]
at 1
3:02
31
Aug
ust 2
012

in many ways that enable meaningful comparisons of public transport demand(International Monetary Fund, 2008; Wentzel & Wentzel, 2000). Both Germanyand the USA are affluent countries with market economies and federal systemsof democratic government. Both countries have vast roadway systems, highrates of car ownership, and roughly the same proportion of licensed drivers(BMVBS, 1991–2012; IRF, 2007; USDOT, 1990–2012). Just as in the USA, most sub-urban development in Germany occurred after the Second World War during aperiod of rapid motorization (Baron, 1995; BMVBS, 2000; Jackson, 1985). In spiteof these similarities, there are significant differences between the two countriesin public transport demand.
Differences Between Bus and Rail
In 2008/2009, both bus and rail accounted for a higher share of trips in Germanythan in the USA (Figure 5). The bus share of trips in Germany was 2.6 times greater(3.6% versus 1.4%) and the rail share of trips was 8.2 times greater (4.9% versus0.6%). Buses accounted for the vast majority (70%) of public transport trips inthe USA, compared with only 42% in Germany. During the last decade, the per-centage of trips by bus in Germany decreased from 3.9% to 3.6% of trips, whiledemand for rail travel (suburban rail, metro, light rail, and streetcars) increasedfrom 4.1% to 4.9% of trips. Shifting demand from bus to rail in Germany maybe partially explained by changes in public transport supply. Between 2000 and2010, vehicle kilometres of bus service in Germany declined by 11%, whilevehicle kilometres of rail service increased by 10% (Destatis, 2012; VDV, 2001–2008, 2011).
From 2001/2002 to 2008/2009, the NHTS indicate a slightly larger percentagepoint increase in mode share for bus than for rail in the USA (+0.3% versus+0.1%). Adjusting for the higher initial mode share for bus, however, the percen-tage growth rate in mode share was roughly the same (+25%) for bus and rail.
Figure 5. Percentage share of trips by rail and bus in Germany and the USA, 2008/2009.Note: Rail includes light rail/streetcar, suburban/regional rail, and metro/subway.
Source: Authors’ calculations based on NHTS and MiD.
Demand for Public Transport in Germany and the USA 549
Dow
nloa
ded
by [
Rut
gers
Uni
vers
ity]
at 1
3:02
31
Aug
ust 2
012

During the same time period, vehicle kilometres of service increased at similarrates for bus (+15%) and rail (+18%) (APTA, 2012).
Trip Purpose
During both the survey periods, work and work-related trips accounted for amuch higher share of public transport trips in the USA than in Germany (40.5%versus 23.5% in 2001/2002 and 35.3% versus 23.6% in 2008/2009) (Figure 6). Com-pared with Germany, public transport use in the USA is more concentrated duringthe peak hours, dominated by commuter travel from the suburbs to central citiesin the morning and from central cities back to the suburbs in the evening.
Nevertheless, the share of public transport trips for work declined in the USAbetween the two survey periods (from 40.5% to 35.3%), while the share of worktrips in Germany remained stable (23.5% versus 23.6%). Over the past threedecades, both countries have experienced an overall decline in the relative impor-tance of work trips for urban travel. In the USA, the share of work trips (for allmodes of transport combined) fell from 20% in 1983 to 16% in 2008/2009(USDOT, 2011). In Germany, the work share of all trips fell from 21% in 1982 to14% in 2008/2009 (Infas & DLR, 2010). The continued decline in work trips overthe last decade in the USA may be partly due to the economic recession in theUSA during the survey period in 2008/2009. The worldwide recession affectedGermany to a lesser degree than the USA, which may help explain Germany’sstable share of work trips by public transport between 2001/2002 and 2008/2009.
In 2001/2002 and 2008/2009, education accounted for twice as high a share ofpublic transport trips in Germany as in the USA: 26.6% versus 11.9% in 2001/2002 and 24.7% versus 11.6% in 2008/2009. In the USA, most school systems
Figure 6. Main purpose of public transport trips in Germany and the USA, 2001/2002 and 2008/2009.Note: The category ‘family and personal business’ includes trips for shopping, doctor’s visits, daycare,dog walking and other animal care, transporting someone else, using professional services, and attend-ing family events.
Source: Authors’ calculations based on NHTS and MiD.
550 R. Buehler and J. Pucher
Dow
nloa
ded
by [
Rut
gers
Uni
vers
ity]
at 1
3:02
31
Aug
ust 2
012
provide their own fleets of school buses; indeed, for the country as a whole, therewere five times more school buses than public buses in 2010 (USDOT, 2012b). In afew large American cities, school children also ride public transport, but in most ofthe USA, separate school bus systems are the norm, especially in the suburbs. Incontrast, German children generally ride public transport (or walk or bike) fortheir trips to and from school. The lack of American school children’s experiencewith public transport probably discourages their use of public transport later inlife as well. By comparison, many German children learn how to use public trans-port on their daily trips to school, thus facilitating their use of public transport asadults.
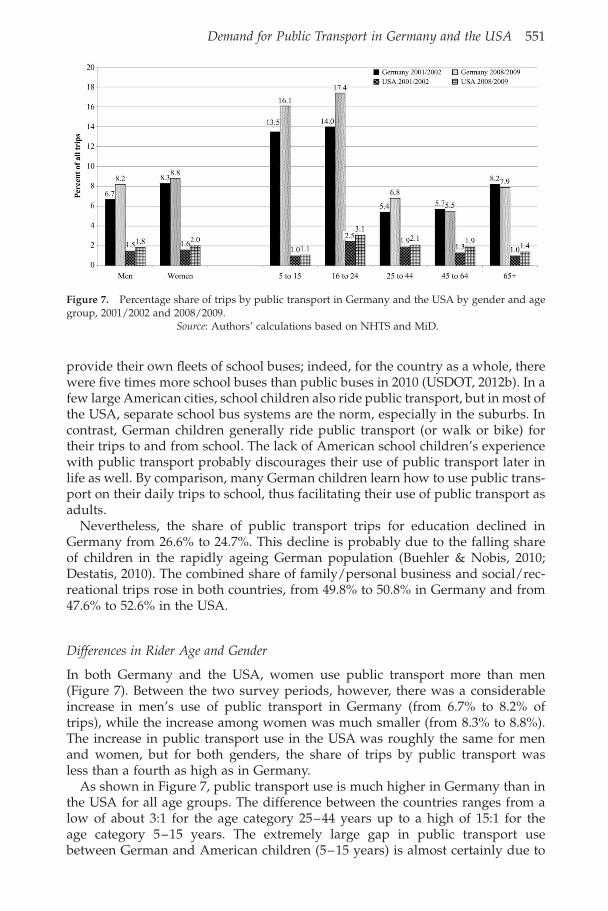
Nevertheless, the share of public transport trips for education declined inGermany from 26.6% to 24.7%. This decline is probably due to the falling shareof children in the rapidly ageing German population (Buehler & Nobis, 2010;Destatis, 2010). The combined share of family/personal business and social/rec-reational trips rose in both countries, from 49.8% to 50.8% in Germany and from47.6% to 52.6% in the USA.
Differences in Rider Age and Gender
In both Germany and the USA, women use public transport more than men(Figure 7). Between the two survey periods, however, there was a considerableincrease in men’s use of public transport in Germany (from 6.7% to 8.2% oftrips), while the increase among women was much smaller (from 8.3% to 8.8%).The increase in public transport use in the USA was roughly the same for menand women, but for both genders, the share of trips by public transport wasless than a fourth as high as in Germany.
As shown in Figure 7, public transport use is much higher in Germany than inthe USA for all age groups. The difference between the countries ranges from alow of about 3:1 for the age category 25–44 years up to a high of 15:1 for theage category 5–15 years. The extremely large gap in public transport usebetween German and American children (5–15 years) is almost certainly due to
Figure 7. Percentage share of trips by public transport in Germany and the USA by gender and agegroup, 2001/2002 and 2008/2009.
Source: Authors’ calculations based on NHTS and MiD.
Demand for Public Transport in Germany and the USA 551
Dow
nloa
ded
by [
Rut
gers
Uni
vers
ity]
at 1
3:02
31
Aug
ust 2
012
the much greater use of public transport for the trip to school in Germany com-pared with the use of special school buses in the USA. At the other end of theage spectrum, it is notable that elderly Germans are far more likely to usepublic transport than elderly Americans (7.9% versus 1.4% of trips). In 2008/2009, the share of licensed drivers among the elderly was almost identical inGermany (76%) and the USA (78%) (BMVBS, 2010; USDOT, 2010). The Germanelderly, however, have less access to a car: 0.5 cars per licensed driver in house-holds with elderly members compared with 0.9 in the USA (Buehler & Nobis,2010).
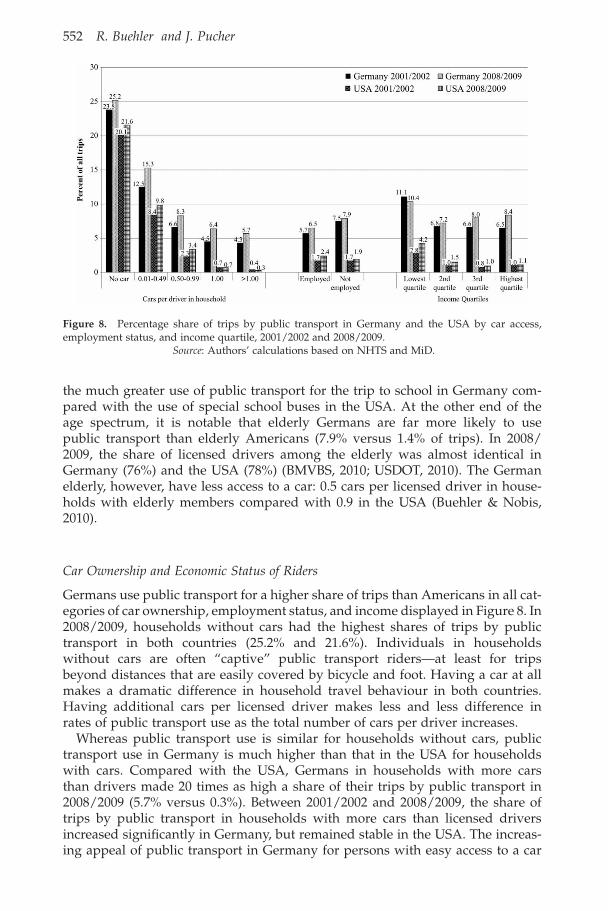
Car Ownership and Economic Status of Riders
Germans use public transport for a higher share of trips than Americans in all cat-egories of car ownership, employment status, and income displayed in Figure 8. In2008/2009, households without cars had the highest shares of trips by publictransport in both countries (25.2% and 21.6%). Individuals in householdswithout cars are often “captive” public transport riders—at least for tripsbeyond distances that are easily covered by bicycle and foot. Having a car at allmakes a dramatic difference in household travel behaviour in both countries.Having additional cars per licensed driver makes less and less difference inrates of public transport use as the total number of cars per driver increases.
Whereas public transport use is similar for households without cars, publictransport use in Germany is much higher than that in the USA for householdswith cars. Compared with the USA, Germans in households with more carsthan drivers made 20 times as high a share of their trips by public transport in2008/2009 (5.7% versus 0.3%). Between 2001/2002 and 2008/2009, the share oftrips by public transport in households with more cars than licensed driversincreased significantly in Germany, but remained stable in the USA. The increas-ing appeal of public transport in Germany for persons with easy access to a car
Figure 8. Percentage share of trips by public transport in Germany and the USA by car access,employment status, and income quartile, 2001/2002 and 2008/2009.
Source: Authors’ calculations based on NHTS and MiD.
552 R. Buehler and J. Pucher
Dow
nloa
ded
by [
Rut
gers
Uni
vers
ity]
at 1
3:02
31
Aug
ust 2
012
may be explained by the rising cost of driving as well as improved public trans-port service—as discussed further below.
In 2001/2002, Americans used public transport for 1.7% of trips regardless oftheir employment status (Figure 8). By 2008/2009, however, Americans withjobs used public transport for 2.4% of their trips compared with 1.9% of personswithout paid employment (including children, university students, stay-at-home parents, retirees, and the unemployed). In contrast, public transport rider-ship in Germany was higher both in 2001/2002 and in 2008/2009 for personswho were not employed.
In both Germany and the USA, the poorest income quartile used public trans-port much more than other income groups. Low-income persons are less likelyto own a car and thus have fewer travel options. In 2001/2002, public transportuse for the second, third, and highest income quartiles was almost identicalwithin each country, but about six times greater in Germany than in the USA(about 1.0% in the USA versus 6.5% in Germany).
Between the two survey periods, the share of public transport trips for the twohighest income quartiles rose only slightly in the USA, but increased significantlyin Germany (from 6.6% to 8.0% and from 6.5% to 8.4%). In 2008/2009, publictransport’s share of trips in the two highest income quartiles was eight timesgreater in Germany than in the USA. Even more strikingly, Germans in thehighest income quartile rode public transport at twice the rate of Americans inthe lowest income quartile (8.4% versus 4.2%).
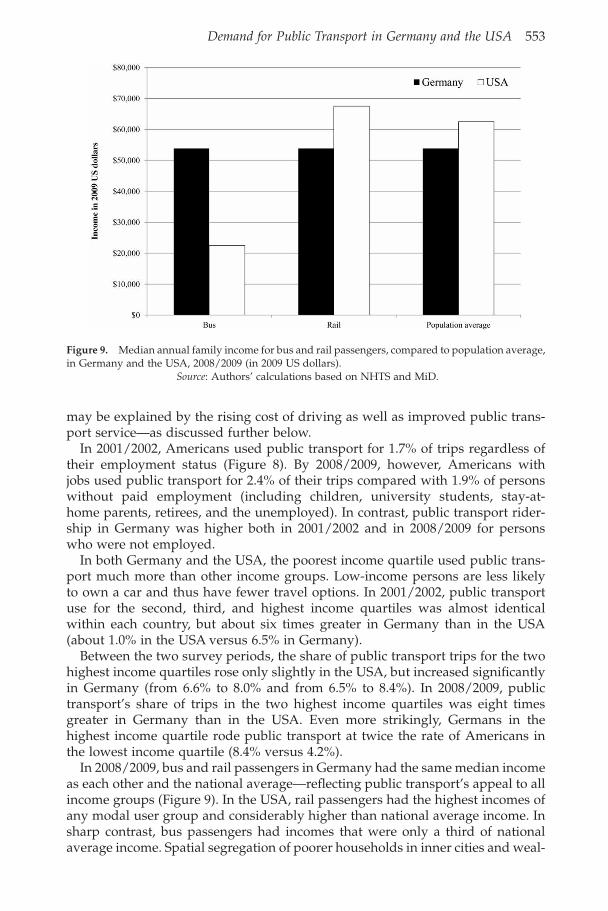
In 2008/2009, bus and rail passengers in Germany had the same median incomeas each other and the national average—reflecting public transport’s appeal to allincome groups (Figure 9). In the USA, rail passengers had the highest incomes ofany modal user group and considerably higher than national average income. Insharp contrast, bus passengers had incomes that were only a third of nationalaverage income. Spatial segregation of poorer households in inner cities and weal-
Figure 9. Median annual family income for bus and rail passengers, compared to population average,in Germany and the USA, 2008/2009 (in 2009 US dollars).
Source: Authors’ calculations based on NHTS and MiD.
Demand for Public Transport in Germany and the USA 553
Dow
nloa
ded
by [
Rut
gers
Uni
vers
ity]
at 1
3:02
31
Aug
ust 2
012

thier households in the suburbs may help explain the discrepancy in incomesbetween rail and bus in the USA (Bullard, 2004; Schaeffer & Sclar, 1980). Commu-ter rail services typically run from high-income suburbs into downtown businessdistricts with lucrative jobs. Poorer neighbourhoods are usually served by slower,more crowded, and less attractive bus service. Moreover, buses in the USA arestigmatized as the travel option of last resort, used mainly by poor people andethnic minorities (Altshuler et al., 1979; Bullard, 2004).
Given the much higher income of rail transit users in the USA, it is not surpris-ing that the median incomes of transit riders overall are much higher in cities withextensive rail systems. For example, the US Census Bureau (2012) reports medianhousehold incomes of work commuters by mode of travel. Over the period 2006–10 (5-year running average), the ratio of transit rider incomes to car driver incomeswas highest for cities such as Boston (0.90), New York (0.83), Washington (0.93),Chicago (0.97), and San Francisco (0.88), all of which have extensive metro andsuburban rail systems. By comparison, the transit rider/car driver income ratiowas much lower in cities without extensive rail systems, such as Dallas (0.60),Houston (0.62), Kansas City (0.56), and Phoenix (0.52).
Impacts of Urban versus Rural Location, City Size, and Population Density
In both countries, public transport accounts for a higher share of trips in urbanizedareas, large metropolitan regions, and high population densities (Figure 10).Between the two survey periods, public transport use in Germany increased sig-nificantly in both urban and rural areas, in both small and large metropolitanregions, and for most of the population density categories displayed inFigure 10. In the USA, by comparison, rising trip shares for public transportwere limited to urban areas, large metropolitan regions, and high population den-sities. Moreover, during both the survey periods, public transport was more con-centrated in urban areas, large metropolitan regions, and high densities in theUSA than in Germany.
In 2008/2009, public transport use was 20 times higher in urban areas than inrural areas in the USA. Urban–rural differences were far smaller in Germany.
Figure 10. Percentage share of trips by public transport in Germany and the USA by urban versusrural household location, metropolitan area size, and population density, 2001/2002 and 2008/2009.
Source: Authors’ calculations based on NHTS and MiD.
554 R. Buehler and J. Pucher
Dow
nloa
ded
by [
Rut
gers
Uni
vers
ity]
at 1
3:02
31
Aug
ust 2
012

For example, public transport’s mode share was only 60% higher in urban areasthan in rural areas in 2008/2009. Public transport’s share of trips in rural areaswas 30 times higher in Germany than in the USA (5.9% versus 0.2%). Indeed,Germans living in rural areas rode public transport at twice the rate of Americansliving in urbanized areas. In both countries, public transport use was higher inlarge metropolitan areas. The largest difference between the countries was forsmall metropolitan areas: Germans used public transport at 18 times the rate ofAmericans in 2008/2009 (7.3% versus 0.4%). Even for large metropolitan areas,the discrepancy between the countries was large, five times higher in Germanythan in the USA (17.7% versus 2.9%).
In both countries, public transport’s share of trips increases as populationdensity rises. The discrepancy in public transport mode shares between thecountries declines with increasing population density from 30:1 in the lowestpopulation density category to only 1.6:1 in the highest density category.Between the two survey periods, public transport use stagnated in the highestdensity category in Germany but increased significantly in the lower populationdensity categories (+1.1%, +1.3%, and +1.1%). In the USA, the highest popu-lation density had the greatest percentage point increase in public transportmode share (from 9.0% to 10.8%). Increases at lower population densities in theUSA were small (,0.2%).
Regional variation in public transport use is much greater in the USA than inGermany. For example, in 2008/2009, the transit share of all trips was 5.1% inthe Northeast Census Region, 2.0% in the West, 1.2% in the Midwest, and only1.0% in the South (USDOT, 2010). Compared with this 5:1 difference among thefour census regions of the USA, the transit share of trips among German states(excluding special city-states such as Berlin and Hamburg) ranged from 8.9% inHessen to 6.3% in Lower Saxony, which is a ratio of only 1.4:1 (BMVBS, 2010).
Logistic Regression Analysis of Public Transport Use
The bivariate analysis described above presents relationships betweenpublic transport use and individual explanatory variables, one at a time. Table 2compares two logistic regression models—one for each country—estimating thelikelihood of riding public transport while controlling for other variables.Explanatory variables in the multiple regression analysis include almost all ofthe demographic, socio-economic, and land-use variables introduced in Figures7, 8, and 10. Multi-collinearity prevented the inclusion of both automobile owner-ship and income in the same equation. Thus, the models in Table 2 include onlyautomobile ownership because the most important impact of income on travelbehaviour is through car ownership (Dargay & Gately, 1999; Giuliano & Dargay,2005).
Within each country, adjusted odds ratios (AORs) represent the population sub-group’s likelihood of riding public transport relative to a specific reference groupassigned the base value 1.00. Controlling for other explanatory factors, AORsshow that men in the USA are 1.07 times as likely as women to ride public trans-port. In Germany, by comparison, the likelihood of riding public transport is notsignificantly different between men and women. In both countries, the likelihoodof riding public transport is highest for the 16–24 age group and declines with age.
In the USA, employed individuals are 1.41 times as likely to ride public trans-port as persons unemployed or not in the workforce, whereas there is no statisti-
Demand for Public Transport in Germany and the USA 555
Dow
nloa
ded
by [
Rut
gers
Uni
vers
ity]
at 1
3:02
31
Aug
ust 2
012

cally significant difference for employment status in Germany. Differencesbetween households with and without cars are much larger for the USA thanfor Germany. For example, American households without cars are 50 timesmore likely to use public transport than households with three or more cars;German households without cars are only ten times as likely to use public trans-port as those with three or more cars.
Similarly, density has a larger impact in the USA than in Germany. Americansliving in areas with 4000 or more persons per square kilometer are 13 times aslikely to ride public transport as Americans living in areas with fewer than 300persons per square kilometre. By comparison, Germans living at high densitiesare only twice as likely to ride public transport as Germans living at low popu-
Table 2. Relative likelihood of riding public transport for population subgroups,2008/2009
Used public transport
Adj. odds ratioa,b
USA Germany
GenderFemale 1.00 1.00Male 1.07∗ 0.95
Age group16–24 1.00 1.0025–44 0.50∗∗ 0.19∗∗
45–64 0.44∗∗ 0.18∗∗
65+ 0.19∗∗ 0.13∗∗
EmploymentNot in workforce or unemployed 1.00 1.00Employed 1.41∗∗ 0.99
Number of cars in householdNo vehicles 1.00 1.00One car 0.10∗∗ 0.26∗∗
Two cars 0.03∗∗ 0.16∗∗
Three or more cars 0.02∗∗ 0.11∗∗
Population per square kilometre,300 1.00 1.00300,1500 1.98∗∗ 0.951500,4000 3.66∗∗ 1.19∗∗
4000+ 12.88∗∗ 1.89∗∗
Metropolitan area populationOutside of metro 1.00 1.00,500 000 1.05 1.20∗∗
500 000+ 2.27∗∗ 2.10∗∗
Day of the weekWeekday 1.00 1.00Weekend 0.44∗∗ 0.50∗∗
Observationsb 229 124 42 965
Source: Calculated by the authors based on NHTS 2008/2009 Version 2.0 and MiD 2008/2009.aRelative likelihoods were calculated using logistic regressions, which control for the influence of othervariables.bExcludes persons younger than 16 years.∗P , 0.05.∗∗P , 0.01.
556 R. Buehler and J. Pucher
Dow
nloa
ded
by [
Rut
gers
Uni
vers
ity]
at 1
3:02
31
Aug
ust 2
012

lation densities. Both Americans and Germans living in metropolitan areas withmore than 500 000 inhabitants are roughly twice as likely to ride public transportas their fellow countrymen living outside of metropolitan areas (AORs 2.22 and2.14). Finally, Americans as well as Germans are much less likely to ride publictransport on weekends than on weekdays (AORs 0.42 and 0.52).
Controlling for gender, age, employment, car ownership, population density,metropolitan area size, and day of the week, logistic regressions (not shown inTable 2) on a pooled USA–Germany data set indicate that Germans, comparedwith Americans, are five times more likely to ride public transport (AOR 5.12,95% CI 4.81–5.46). As discussed in the following section, Germany hasimplemented a wide range of measures that help explain Germany’s muchgreater and faster growing public transport use compared with the USA. Wediscuss some of the key policies that encourage public transport in Germanyand suggest possible lessons for the USA.
Comparison of Public Transport Policies in Germany and the USA
As discussed in Buehler and Pucher (2011), public transport agencies in Germanyhave been more successful at increasing productivity, reducing costs, and improv-ing financial efficiency. In 2010, for example, the total operating and capitalsubsidy per passenger trip was less than half as much in Germany as in theUSA ($1.82 versus $5.09) (APTA, 2012; VDV, 2011). Passenger revenues inGermany covered 77% of public transport operating costs compared with only33% in the USA (APTA, 2012; VDV, 2011).
In contrast to the productivity and cost analysis of the earlier paper, we focushere on measures to increase public transport use. Of course, higher productivityand lower costs enable the provision of more services at lower fares, thus encoura-ging more riders. But there are many strategies specifically designed to increasedemand. Such measures fall into the three general categories of (1) expandedand improved service; (2) attractive fares and convenient ticketing; and (3)regional and multimodal coordination of services and fares. In addition, thereare important complementary policies that can encourage public transport use,especially those restricting car use or increasing its price. Similarly, land-use pol-icies can either promote or inhibit public transport demand. Table 3 provides adetailed comparison of policies in Germany and the USA. In the following discus-sion, we focus on the successful German policies, which help explain the muchhigher and faster growing levels of public transport use in Germany than in theUSA.
Expanded and Improved Service
There is about three times more public transport service in Germany than in theUSA: 59 versus 20 vehicle kilometres of service per year per inhabitant in 2009.Moreover, 88% of Germans live within 1 km of a public transport stop, comparedwith only 43% of Americans (Buehler, 2009). Since the mid-1990s, most publictransport systems in Germany have modernized their vehicles and improvedthe comfort, convenience, and reliability of their services. Schedules and routesare integrated across public transport operators and modes, providing quickand easy connections for passengers.
Demand for Public Transport in Germany and the USA 557
Dow
nloa
ded
by [
Rut
gers
Uni
vers
ity]
at 1
3:02
31
Aug
ust 2
012
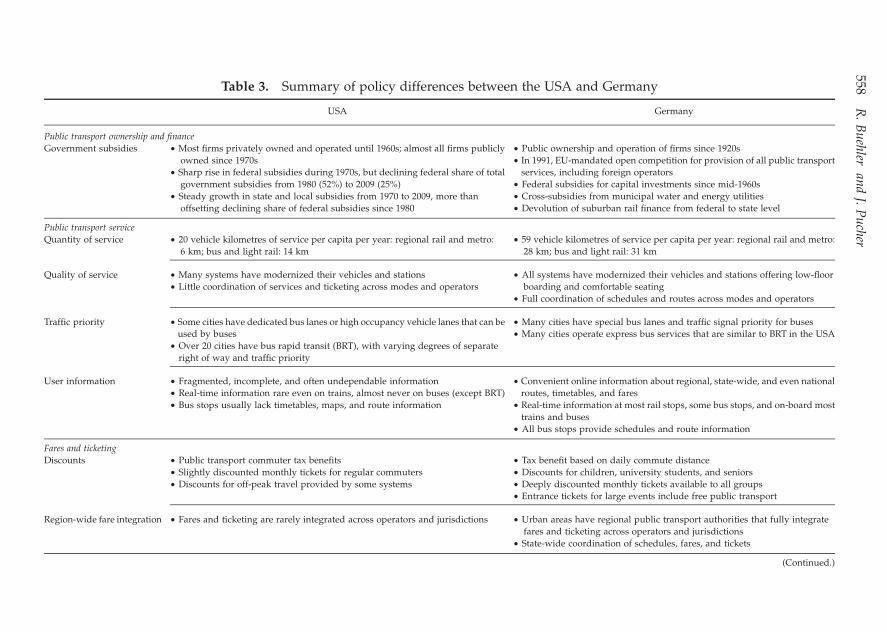
Table 3. Summary of policy differences between the USA and Germany
USA Germany
Public transport ownership and finance
Government subsidies † Most firms privately owned and operated until 1960s; almost all firms publicly
owned since 1970s
† Sharp rise in federal subsidies during 1970s, but declining federal share of total
government subsidies from 1980 (52%) to 2009 (25%)
† Steady growth in state and local subsidies from 1970 to 2009, more than
offsetting declining share of federal subsidies since 1980
† Public ownership and operation of firms since 1920s
† In 1991, EU-mandated open competition for provision of all public transport
services, including foreign operators
† Federal subsidies for capital investments since mid-1960s
† Cross-subsidies from municipal water and energy utilities
† Devolution of suburban rail finance from federal to state level
Public transport service
Quantity of service † 20 vehicle kilometres of service per capita per year: regional rail and metro:
6 km; bus and light rail: 14 km
† 59 vehicle kilometres of service per capita per year: regional rail and metro:
28 km; bus and light rail: 31 km
Quality of service † Many systems have modernized their vehicles and stations
† Little coordination of services and ticketing across modes and operators
† All systems have modernized their vehicles and stations offering low-floor
boarding and comfortable seating
† Full coordination of schedules and routes across modes and operators
Traffic priority † Some cities have dedicated bus lanes or high occupancy vehicle lanes that can be
used by buses
† Over 20 cities have bus rapid transit (BRT), with varying degrees of separate
right of way and traffic priority
† Many cities have special bus lanes and traffic signal priority for buses
† Many cities operate express bus services that are similar to BRT in the USA
User information † Fragmented, incomplete, and often undependable information
† Real-time information rare even on trains, almost never on buses (except BRT)
† Bus stops usually lack timetables, maps, and route information
† Convenient online information about regional, state-wide, and even national
routes, timetables, and fares
† Real-time information at most rail stops, some bus stops, and on-board most
trains and buses
† All bus stops provide schedules and route information
Fares and ticketing
Discounts † Public transport commuter tax benefits
† Slightly discounted monthly tickets for regular commuters
† Discounts for off-peak travel provided by some systems
† Tax benefit based on daily commute distance
† Discounts for children, university students, and seniors
† Deeply discounted monthly tickets available to all groups
† Entrance tickets for large events include free public transport
Region-wide fare integration † Fares and ticketing are rarely integrated across operators and jurisdictions † Urban areas have regional public transport authorities that fully integrate
fares and ticketing across operators and jurisdictions
† State-wide coordination of schedules, fares, and tickets
(Continued.)
558R
.B
ueh
leran
dJ.
Pu
cher
Dow
nloa
ded
by [
Rut
gers
Uni
vers
ity]
at 1
3:02
31
Aug
ust 2
012

Table 3. Continued
USA Germany
Regional and intermodal coordination
Regional integration † Regional transport planning authorities in most cities, but with much less
coordination and integration of services than in Germany
† Full coordination of operation and financing of public transport through
regional public transport authorities since late 1960s
Multimodal coordination † Limited integration of bus and rail
† Bike racks on 75% of buses; bike parking at many rail stations
† Park and ride lots in suburbs at rail stations and key bus stops
† Inconvenient walking and cycling access to bus and rail stops
† Convenient transfers between bus and rail
† Extensive, high-quality bicycle parking at rail stops
† Park and ride facilities for cars at suburban rail stations
† Bike and car rental programmes run by public transport firms
Pricing and restrictions of car ownership, use, and parking
Sales tax for new car
purchase
† State sales taxes for new car purchases range from 0% to 8.25%, with an average
of 4.9%
† 19% in all states
Driver licensing and cost † Easy and cheap driver training and licensing, costing about $100 in most states † Strict and expensive driver training and licensing, costing over $2000 per
license
Price of gasoline † In 2011: $0.91 per litre (15% of price is tax) † In 2011: $2.09 per litre (61% of price is tax)
Road revenues and
expenditures
† Road user taxes and fees account for 60% of roadway expenditures by all levels
of government
† Roadway user taxes and fees are 2.5 times higher than roadway expenditures
by all levels of government
Traffic calming and speed
limits in cities
† Few cities have any traffic-calmed neighbourhoods
† Speed limits on most city streets range from 35 to 45 mph (56–72 km/h)
† Most residential streets are traffic-calmed at 30 km/h or less, with speeds
reduced to 7 km/h on some residential streets
† General speed limit of 50 km/h (33 mph) in cities
Road supply and car
restrictions
† High-speed motorways and arterials criss-cross cities and suburbs
† A few cities have pedestrian malls, but not extensive zones
† High-speed motorways rarely penetrate into city centres
† Extensive car-free zones in centres of most city centres
Parking supply and cost † Municipal zoning codes require high levels of minimum parking
† 95% of all car parking is free of charge
† Free parking is provided by most firms for their employees and customers;
cheap and convenient on-street parking in most cities
† Most cities have reduced car parking in downtowns and increased parking
fees since the 1960s
† German cities have only 39% as many parking spaces per job than US cities
Land-use policies
Coordination with public
transport
† No coordination of public transport with land use, except for some TOD focused
around rail stations
† Strict land-use controls limit low-density sprawl and encourage compact
development around public transport stops
Land-use planning process † No federal land-use planning at all
† Very limited state land-use planning
† Metropolitan planning organizations can propose land-use plans, but have no
power to enforce plans
† Fragmented, uncoordinated, and often conflicting land-use planning by local
jurisdictions
† Federal, state, regional, and local land-use plans backed by power of law
† Coordination of land-use plans among levels of government and across
jurisdictions
† Integration of land-use, transport, and environmental planning at all levels of
government
Sources: APTA, 2006, 2008a, 2008b, 2012; Baron, 1995; Buehler, 2009; Buehler et al., 2009; FTA, 2012; Hass-Klau, 1993; Hirt, 2007; IEA, 2012; Koeberlein, 1997; Newman andKenworthy, 1999; Pucher, 1995a, 1995b; Pucher and Buehler, 2008; Schmidt and Buehler, 2007; Schmucki, 2001; Shoup, 2005; TRB, 2001; USDOT, 1990–2012, 2000–2012; Vande Velde, 2003; VDV, 2003, 2008, 2011; Vuchic, 1999; Wachs et al., 1992; Wiegandt, 2004; Yago, 1984.
Dem
and
forP
ublic
Tran
sport
inG
erman
yan
dth
eU
SA
559
Dow
nloa
ded
by [
Rut
gers
Uni
vers
ity]
at 1
3:02
31
Aug
ust 2
012
Real-time information about actual arrival and departure times is available atmost suburban rail, metro, and light rail stations as well as on board trains andbuses. Express bus services and dedicated bus-only lanes improve the speedand reliability of bus services. In many cities, signal priority for light rail andbuses triggers a green light when they approach intersections, making publictransport service faster and more dependable. In Freiburg, for example, trafficsignals give priority to light rail over cars at all but two intersections in the city(Hildebrandt, 2009). Integrated multimodal websites allow searches across oper-ators, public transport modes, and regions, providing up-to-date information onschedules, routes, and fares as well as walking, cycling, and driving access topublic transport stops.
Integrated and Attractive Fares
Most regional public transport authorities in Germany offer integrated daily,weekly, monthly, semester, and annual tickets, which allow passengers to useone ticket for the entire trip, regardless of the number of transfers and publictransport modes used during the trip. Over the last two decades, Germanpublic transport agencies expanded their programmes of deeply discountedtickets for school children, seniors, and university students. Most universitiescooperate with public transport agencies to offer inexpensive semester ticketsfor students at a fraction of the cost of regular monthly tickets. Similarly, manyfirms negotiate directly with public transport systems to finance deeply dis-counted monthly tickets for their employees. For Germany, on average, publictransport systems offer regular monthly tickets that cost about 60% less per tripthan single-trip fares (VDV, 2011). Annual tickets offer an additional discountranging from 10% to 25%, often by charging for only 10 months and offeringthe other 2 months of the year for free. Both monthly and annual tickets areespecially useful for attracting and keeping long-term public transport users.
Customer-tailored fare policy in many German cities makes it economical andconvenient to use public transport on a daily basis, increasing its competitivenesswith the private car (VDV, 2001–2008, 2011). During the last two decades, Germanpublic transport has expanded the share of passengers using weekly, monthly, orannual tickets from 60% in 1992 to 76% in 2010 (VDV, 2001–2008, 2011). In citiessuch as Hannover and Freiburg, monthly and annual tickets also include othertransport services, such as reduced rates for taxis, car-sharing services, rentalcars, and discounts for long-distance rail travel (Hildebrandt, 2009). Moreover,virtually all German states now offer state-wide public transport tickets forgroups of up to five travellers. Group tickets cost E30 ($39) per day and permituse of all regional and local public transport services in the entire state on week-ends, holidays, and during off-peak periods (Paetzold, 2008). Tickets for largeevents, such as professional soccer games and music concerts, often include freepublic transport access to such events.
In addition to conventional paper tickets, many public transport systems nowoffer smart cards with electronic chips that enable convenient re-charging andmultiple uses. Moreover, in an increasing number of cities, fully electronictickets can be purchased via mobile phone, eliminating the need to wait in lineat ticket booths or vending machines. Passengers simply show the screen oftheir mobile phone when asked for their ticket, similar to the web-based ticketingon many airlines (VDV, 2008).
560 R. Buehler and J. Pucher
Dow
nloa
ded
by [
Rut
gers
Uni
vers
ity]
at 1
3:02
31
Aug
ust 2
012

Regional and Intermodal Coordination
German public transport services are enhanced by the full coordination of routes,schedules, and fares within metropolitan regions (Bundesregierung, 1999; Pucher& Kurth, 1996). Starting in the 1960s, German cities created regional public trans-port organizations that fully integrate all aspects of public transport operationsand ticketing. Transfers between bus and rail are usually facilitated by coordi-nated schedules that minimize waiting time and by placement of bus stopswithin or directly adjacent to rail stations to minimize walking distance requiredfor transfers. Between 1991 and 2010, metropolitan areas with public transportauthorities, such as Berlin, Freiburg, Hamburg, Munich, Rhein-Main, and Stutt-gart, reported increases of at least 20% in passenger volumes (BMVBS, 1991–2012).
Extensive, safe, and convenient walking and cycling networks in German citiesfacilitate public transport use. Most public transport riders in Germany reachpublic transport stops by foot or bicycle (BMVBS, 2010). Since the 1970s, mostGerman cities have improved conditions for cycling and walking by trafficcalming nearly all neighbourhood streets to 30 km/h or less, establishing car-free zones in their centres, and expanding networks of separate bike paths andlanes (Pucher & Buehler, 2008, 2012). For example, even large cities such asBerlin and Munich have traffic calmed over 75% of their road networks (City ofBerlin, 2010; City of Munich, 2012). Most German cities provide safe and con-venient sidewalks, crosswalks, bike lanes, and cycle tracks leading to bus andrail stops, whereas walking and cycling to public transport stops in Americancities are often difficult as well as dangerous due to poor design or the lack offacilities.
German public transport systems allow bikes on trains and provide extensivebike parking facilities at rail stations. In fact, there are more parking spaces at sub-urban rail and metro stations in the Munich region than in the entire USA (45 000versus 38 000) (APTA, 2009; City of Munich, 2012). American public transportsystems, however, do a better job integrating buses with cycling. In the USA,75% of buses have bike racks, usually mounted on the front of the bus and accom-modating two bikes. No German buses have bike racks.
Pricing and Restrictions of Car Ownership, Use, and Parking
Transport, taxation, and land-use policies at all levels of government makeGerman public transport more competitive with the automobile. Federal taxationpolicies increase the cost of driving. For example, from 1999 to 2003, the federalgovernment increased the gasoline (petrol) tax by E0.03 ($0.04) per litre eachyear to a total of E0.15 ($0.22) over 5 years (BMF, 2005). In 2010, the share oftaxes in the price of gasoline was four times higher in Germany than in theUSA (60% versus 15%) (IEA, 2012). Sales taxes on new vehicle purchases werefour times higher in Germany than in the USA (BMF, 2008; USDOT, 2001). More-over, the USA heavily subsidizes road transport. In the USA, road user taxes andfees account for only 60% of roadway expenditures by all levels of government(Buehler et al., 2009; USDOT, 1990–2012). In sharp contrast, German road userspay taxes and fees that are 2.5 times higher than government roadway expendi-tures, yielding an important source of net tax revenues that can be used tofinance other sectors (BMVBS, 1991–2012; USDOT, 1990–2012).
Demand for Public Transport in Germany and the USA 561
Dow
nloa
ded
by [
Rut
gers
Uni
vers
ity]
at 1
3:02
31
Aug
ust 2
012

There are many more restrictions on car use and parking in Germany than in theUSA. Not only is the supply of roads per capita much less in German cities than inAmerican cities, but motorways are also mostly restricted to the outskirts ofGerman cities and rarely penetrate city centres. By comparison, most Americancities and suburbs are criss-crossed with extensive networks of high-speed motor-ways and wide arterials (Bratzel, 1995, 1999). Most German cities have reduced carparking supply and increased its cost, whereas most American cities continue tofocus their redevelopment plans on increased provision of low-cost or freeparking for cars (Shoup, 2005).
Traffic calming of residential neighbourhoods predominates in German cities,while it is rare in American cities and generally restricted to speed humps on afew isolated streets and not systematic. Almost all German cities feature extensivecar-free pedestrian zones in their city centres (Hass-Klau, 1993). Only a few Amer-ican cities have any car-free streets (usually pedestrian malls) and never an entirenetwork of connecting streets that form a comprehensive car-free zone. In short,there are many more restrictions on car use in German cities, making it less con-venient as well as more expensive than in American cities. This makes public trans-port far more attractive relative to the private car in Germany than in the USA.
Land-Use Policies
German land-use laws and regulations encourage dense and mixed-use settle-ments, which facilitate public transport use (Hirt, 2007; Schmidt & Buehler, 2007;Wiegandt, 2004). In the USA, local government land-use plans usually requiresingle-use zoning and discourage mixed use. Higher population density andmixed land uses in Germany facilitate short trip distances between public transportstops and trip origins and destinations. Many German cities specifically plan neigh-bourhood town centres that enable easy walking and cycling access to shoppingand other daily needs. German federal law mandates coordination of land-use plan-ning among municipalities, regions, and states as well as among jurisdictions at thesame level of government (Fuerst & Scholles, 2003). German planning law alsorequires the integration of land-use plans with transport, water, energy, andenvironmental plans. With the exception of some recent transit-oriented develop-ments (TODs), land-use planning in the USA is generally fragmented, inconsistent,and conflicting across local jurisdictions and rarely integrated with transport plans(Burchell, Lowenstein, Dolphin, & Galley, 2002; Levine, 2006).
Challenges for Public Transport in Germany
In spite of its relative success compared with the American public transport,German public transport faces several challenges. Over the coming decade,most urban rail systems that were built in the 1960s and 1970s will have to be reno-vated. There is still no dedicated funding source for this work because local, state,and federal governments have been quarrelling about how much each should pay.Cost cutting by public transport systems over the past two decades has succeededin reducing subsidy requirements but has taken a toll on labour by reducingwages and increasing work hours and the range of job responsibilities (Buehler& Pucher, 2011). As a consequence, the last 5 years have been marred by anincreasing number of short-term labour strikes for higher salaries and benefits,which have disrupted service and irritated customers in many German cities.
562 R. Buehler and J. Pucher
Dow
nloa
ded
by [
Rut
gers
Uni
vers
ity]
at 1
3:02
31
Aug
ust 2
012

Moreover, because of a reduction of the labour force and cut-backs in maintenanceexpenditures, some German cities have experienced disruptions in servicebecause vehicles broke down or were preemptively removed from service dueto defects that were discovered. To make matters worse, crime has been increasingon public transport systems. In recent years, for example, there have been highlypublicized assaults on passengers waiting at rail stations. Graffiti and vandalismof rail cars and buses have also become problems.
Suburbanization also presents a challenge. Although most German cities aremuch more compact than American cities, there is a trend towards decentraliza-tion of businesses, big-box retailers at the urban fringe, and more suburbanhousing developments (Mueller & Rohr, 2005). This type of settlement patternmakes it increasingly difficult for German public transport to compete with thecar in the suburbs. Demographic shifts also present a challenge: the ageing ofthe German population will further reduce the number of children and youngadults riding public transport (Buehler & Nobis, 2010).
German public transport will have to deal with all of these issues: fundingshortages, maintenance problems, labour disputes, service disruptions, suburba-nization, and an older population.
Conclusion and Lessons for the USA
Over the past four decades, public transport has been far more successful inGermany than in the USA, with much greater growth in overall passengervolumes and in trips per capita. Even controlling for differences between thecountries in demographics, socio-economics, and land use, logistic regressionsshow that Germans are five times as likely as Americans to make a trip bypublic transport. In both countries, public transport use declines with increasingcar ownership, rising incomes, and decreasing population densities. However,compared with that in the USA, public transport in Germany attracts a muchbroader cross-section of society and for a greater diversity of trip purposes.Most American public transport passengers are either work commuters in large,older cities or low-income captive riders without cars.
The success of German public transport is due to a coordinated package ofmutually supportive policies that include the following: (1) more and betterservice, (2) attractive fares and convenient ticketing, (3) full multimodal andregional integration, (4) high taxes and restrictions on car use, and (5) land-usepolicies that promote compact, mixed-use developments and densities highenough to support public transport. It is the integrated package of complementarypolicies that explains why public transport in Germany can compete so well withthe private car, even among affluent households. Conversely, it is the lack ofcomplementary policies that explains the continuing struggle of public transportin the USA.
Over the last two decades, public transport agencies in both countries haveimproved the quality and quantity of public transport service. As shown inthis paper, however, Germany is far ahead of the USA, offering more andbetter service, more attractive fares and ticketing, and superior multimodaland regional coordination. The most important difference between the twocountries, however, is that local, state, and federal governments in the USAhave failed to restrict car use in cities, raise the cost of driving, and improveland-use policies. Indeed, all levels of government in the USA have subsidized
Demand for Public Transport in Germany and the USA 563
Dow
nloa
ded
by [
Rut
gers
Uni
vers
ity]
at 1
3:02
31
Aug
ust 2
012

roadways, car use, and parking. Due to political opposition from motoristgroups, the US federal government and many state governments have notincreased the gasoline (petrol) tax for almost 20 years—in spite of large deficitsin state and federal highway trust funds. Local government zoning ordinancesusually require private developers and firms to supply large amounts of carparking, segregate residential from commercial land uses, and often ban high-density development of any kind. Free parking remains a tax-free fringebenefit for most employees and a tax-deductible expense for firms for bothstate and federal taxes.
Even $830 billion in government subsidies since 1975 have not succeededin raising public transport’s mode share in the USA, which remains atless than 2% of all trips. Without the necessary policies to restrict car useand make it more expensive, American public transport is doomed toremain a marginal means of transport, used mainly by those who have noother choice.
References
Australian Bureau of Statistics. (2011). Census of population and housing, journey to work files. Canberra:Author.
Altshuler, A., Womack, J.P., & Pucher, J. (1979). The urban transportation system: Politics and policy inno-vation. Cambridge, MA: MIT Press.
American Public Transportation Association. (2006). Annual report 2006: Growth investment forward.Washington, DC: Author.
American Public Transportation Association. (2008a). 2008 public transportation fare database. Washington,DC: Author.
American Public Transportation Association. (2008b). It pays to ride public transportation. Washington,DC: Author.
American Public Transportation Association. (2009). 2008 transit infrastructure database. Washington,DC: Author.
American Public Transportation Association. (2012). Public transportation factbook 2011. Washington,DC: Author.
Baron, P. (1995). Transportation in Germany: A historical overview. Transportation Research Part A: Policyand Practice, 29(1), 9–20.
Bassett, D., Pucher, J., Buehler, R., Thompson, D., & Crouter, S. (2008). Walking, cycling, and obesityrates in Europe, North America and Australia. Journal of Physical Activity and Health, 5(6), 795–814.
BFS. (2011). Mobility and transport 2010. Bern: Bundesamt fuer Statistik/Swiss Federal Office for Stat-istics.
Bundesministerien der Finanzen – German Federal Ministry of Finance. (2005). Die Mineraloelsteuer[Petroleum taxes]. Berlin: Author.
Bundesministerien der Finanzen – German Federal Ministry of Finance. (2008). Mehrwertsteuer [Valueadded tax]. Berlin: Author.
BMVBS. (1991–2012). Verkehr in Zahlen [German transport in figures]. Berlin: German Federal Ministryof Transportation and Urban Development.
BMVBS. (2000). Urban development and urban policy in Germany. Bonn: German Federal Ministry ofTransportation and Urban Development, Bundesamt fuer Bauwesen und Raumordnung.
BMVBS. (2008). Rueckblick: Staedtebau und Stadtentwicklung im Wandel [Changes in urban planning anddevelopment]. Bonn: German Federal Ministry of Transportation and Urban Development, BBR.
BMVBS. (2010). Mobilitaet in Deutschland 2008/2009. Bonn: German Federal Ministry of Transportation.Bratzel, S. (1995). Extreme der Mobilitat. Entwicklung und Folgen der Verkehrspolitik in Los Angeles. Basel:
Birkhauser Verlag.Bratzel, S. (1999). Conditions of success in sustainable urban transport policy—policy change in
“relatively successful” European cities. Transport Reviews, 19(2), 177–190.Broeg, W., & Erl, E. (2003). Verkehrsmittelwahl in Deutschland: Neue und Alte Bundeslaender [Transpor-
tation mode choice in East and West Germany]. Socialdata: Munich.
564 R. Buehler and J. Pucher
Dow
nloa
ded
by [
Rut
gers
Uni
vers
ity]
at 1
3:02
31
Aug
ust 2
012
Buehler, R. (2009). Promoting public transportation: A comparison of passengers and policies inGermany and the US. Transportation Research Record: Journal of the Transportation Research Board of
the National Academies of Science, 2110, 60–68.Buehler, R., & Nobis, C. (2010). Travel behavior in ageing societies: A comparison of Germany and the
United States. Transportation Research Record: Journal of the Transportation Research Board, 2182, 62–70.Buehler, R., & Pucher, J. (2011). Making public transport financially sustainable. Transport Policy, 18(1),
126–138.Buehler, R., Pucher, J., & Kunert, U. (2009). Making transportation sustainable: Insights from Germany.
Washington, DC: The Brookings Institution.Buehler, R., Pucher, R., Merom, D., & Bauman, A. (2011). Active travel in Germany and the USA: Con-
tributions of daily walking and cycling to physical activity. American Journal of Preventive Medicine,40(9), 241–250.
Bullard, R.D. (2004). Highway robbery. Cambridge, MA: South End Press.Bundesregierung. (1999). Bericht der Bundesregierung ueber den Oeffentlichen Nahverkehr in Deutschland
nach Vollendung der Deutschen Einheit. Berlin: German Federal Government.Burchell, R., Lowenstein, G., Dolphin, W.R., & Galley, C. (2002). Costs of sprawl 2000, TCRP report 74.
Washington, DC: Transportation Research Board, National Academy Press.CBS. (2011). Transport statistics. Amsterdam: Statistics Netherlands.Cervero, R. (1998). The transit metropolis. A global inquiry. Washington, DC: Island Press.City of Berlin. (2010). Cycling and walking in Berlin. Berlin: Senatsverwaltung fuer Stadtentwicklung.City of Munich. (2012). Bicycling and walking in Munich. Munich: Author.CSO. (2010). Travel to work, school, and college. Dublin: Central Statistics Office.Dargay, J., & Gately, D. (1999). Income’s effect on vehicle ownership, worldwide: 1960–2015.
Transportation and Research, Part A, 33(2), 101–138.Destatis. (2010). Genesis Online Database. Bevolkerung, Erwerbstatige, Erwerbslose, Erwerbspersonen,
Nichterwerbspersonen: Deutschland, Jahre, Altersgruppen. Wiesbaden: German Statistical Office.Destatis. (2012). Personenverkehr mit Bussen und Bahnen. Wiesbaden: Destatis, German Federal Office for
Statistics.Department for Transport. (2010). National travel survey. London: Author.Department for Transport. (2011). National travel statistics. London: Author.DMT. (2010). Danish national travel surveys. Copenhagen: Danish Institute of Transport Research.Downs, A. (2004). Still stuck in traffic. Washington, DC: Brookings Institution Press.Dunn, J. (1981). Miles to go: European and American transportation policies. Cambridge, MA: MIT Press.Dunn, J. (1998). Driving forces: The automobile, its enemies, and the politics of mobility. Washington, DC:
Brookings Institution Press.European Commission. (2011). Transport in figures. Statistical pocketbook 2011. Brussels: European Com-
mission, Directorate General for Energy and Transport.Filion, P., Bunting, T., McSpurren, K., & Tse, A. (2004). Canada–US metropolitan density patterns:
Zonal convergence and divergence. Urban Geography, 25(1), 42–65.FTA. (2012). National transit database (NTD). Washington, DC: U.S. Department of Transportation,
Federal Transit Administration.Fuerst, D., & Scholles, F. (2003). Landes- und Regionalplanung Teil 1: Verwaltungswissenschaftliche
Grundlagen. Institut fuer Landesplanung und Raumforschung. Hannover: University of Hannover.Giuliano, G., & Dargay, J. (2005). Car ownership, travel and land use: A comparison of the US and
Great Britain. Transportation Research Part A, 40, 106–124.Grant, J. (2002). Mixed use in theory and practice: Canadian experience with implementing a planning
principle. Journal of the American Planning Association, 68(1), 71–85.Hass-Klau, C. (1993). The pedestrian and city traffic. New York: Belhaven Press.Hildebrandt, A. (2009). Transit supply in Freiburg. Freiburg: Freiburger Verkehrs AG, Presse und
Oeffentlichkeitsarbeit.Hirt, S. (2007). The devil is in the definitions. Contrasting American and German approaches to zoning.
Journal of the American Planning Association, 73(4), 436–450.Institute of Transport Economics. (2011). Norwegian travel survey key results. Oslo: Author.International Energy Agency. (2012). Energy prices and taxes. New York: Author.Infas and DLR. (2010). Mobilitat in Deutschland 2008. Endbericht. Bonn: German Federal Ministry of
Transport.International Monetary Fund. (2008). World economic outlook database. Washington, DC: Author.International Road Federation. (2007). World road statistics. Brussels: Author.
Demand for Public Transport in Germany and the USA 565
Dow
nloa
ded
by [
Rut
gers
Uni
vers
ity]
at 1
3:02
31
Aug
ust 2
012

ITF. (2011). Transport for society: International demand for public transport. Paris: OECD/InternationalTransportation Forum.
Jackson, K.T. (1985). The crabgrass frontier. The suburbanization of the United States. Oxford: OxfordUniversity Press.
Koeberlein, C. (1997). Kompendium der Verkehrspolitik [Compendium of transport policies]. Munich:Oldenbourg Wissenschaftsverlag.
Kunert, U., Kloas, J., & Kuhfeld, H. (2002). Design characteristics of national travel surveys. Inter-national comparison for 10 countries. Transportation Research Record, 1804, 107–116.
Levine, J. (2006). Zoned out. Regulation, markets and choices in transportation and metropolitan land-use.Washington, DC: Resources for the Future.
Mees, P. (2010). Transport for Suburbia: Beyond the automobile age. New York City, NY: Earthscan.Miron, J. (2003). Urban sprawl in Canada and America: Just how dissimilar? Toronto: Department of
Geography, University of Toronto.Mueller, W., & Rohr-Zaecker, R. (2005). Amerikanisierung der Peripherie in Deutschland? In K. Barke &
G. Herfert (Eds.), Suburbanisierung in Deutschland (pp. 27–39). Opladen, Leske und Budrich.Newman, P., & Kenworthy, J. (1999). Sustainability and cities. Washington, DC: Island Press.Pacione, M. (2009). Urban geography: A global perspective. London: Routledge.Paetzold, J. (2008). VDV Landesgruppen Erfahrungsaustausch Baden-Wuerttemberg. Stuttgart: VDV.Polzin, S., & Chu, X. (2003). NHTS early findings on public transportation travel trends. Washington, DC:
FHWA.Pucher, J. (1995a). Urban passenger transport in the United States and Europe: A comparative analysis
of public policies. Part 1. Travel behavior, urban development and automobile use. Transport Reviews,15(2), 99–117.
Pucher, J. (1995b). Urban passenger transport in the United States and Europe: A comparative analysisof public policies. Part 2. Public transport, overall comparisons and recommendations. Transport
Reviews, 15(3), 211–227.Pucher, J., & Buehler, R. (2008). Making cycling irresistible: Lessons from the Netherlands, Denmark,
and Germany. Transport Reviews, 28(1), 495–528.Pucher, J., & Buehler, R. (2010). Walking and cycling for healthy cities. Built Environment, 36(4), 391–414.Pucher, J., & Buehler, R. (2012). City cycling. Cambridge, MA: MIT Press.Pucher, J., Buehler, R., Merom, D., & Bauman, A. (2011). Walking and cycling in the United States, 2001–
2009: Evidence from the NHTS. American Journal of Public Health, 101(S1), S310–S317.Pucher, J., & Kurth, C. (1996). Verkehrsverbund: The success of regional public transport in Germany,
Austria and Switzerland. Transport Policy, 2(4), 279–291.Pucher, J., Markstedt, A., & Hirschman, I. (1983). Impacts of subsidies on the costs of urban public
transport. Journal of Transport Economics and Policy, 17(2), 155–176.Schaeffer, K.H., & Sclar, E. (1980). Access for all: Transportation and urban growth. New York City, NY:
Columbia University Press.Schmidt, S., & Buehler, R. (2007). The planning process in the US and Germany: A comparative
analysis. International Planning Studies, 12(1), 55–75.Schmucki, B. (2001). Der Traum vom Verkehrsfluss: Stadtische Verkehrsplanung seit 1945 im deutsch-
deutschen Vergleich. Munich: Campus/Deutsches Museum Muenchen.Shoup, D. (2005). The high cost of free parking. Chicago, IL: APA Planners Press.SIKA. (2007). SIKA statistics: The national travel survey. Ostersund: Swedish Institute for Transport and
Communications Analysis.SOeS. (2010). Enquete nationale transports et deplacements (ENTD) 2008. France: Ministere de l’Ecologie,
de l’Energie, du Developpement durable et de la Mer (Meeddm), Service de l’observation et desstatistiques (SOeS) LaDefense.
StatCan. (1996–2010). Where Canadians work and how they get there. Ottawa: Statistics Canada.TRB. (2001). Making transit work: Insight from Western Europe, Canada and the United States. Washington,
DC: Transportation Research Board, National Research Council, National Academy Press.US Census Bureau. (2012). American community survey 2006–2010. Washington, DC: Author.USDOT. (1990–2012). Highway statistics. Washington, DC: US Department of Transportation, Federal
Highway Administration.USDOT. (2000–2012). Transportation statistics. Washington, DC: US Department of Transportation,
Federal Highway Administration.USDOT. (2001). Summary of state motor vehicle registration fee schedules. Washington, DC: US Department
of Transportation, Federal Highway Administration.
566 R. Buehler and J. Pucher
Dow
nloa
ded
by [
Rut
gers
Uni
vers
ity]
at 1
3:02
31
Aug
ust 2
012
USDOT. (2010). National Household Travel Survey 2008/2009. Washington, DC: US Department ofTransportation, Federal Highway Administration.
USDOT. (2011). Summary of travel trends: 2009 National Household Travel Survey. Washington, DC: USDepartment of Transportation, Federal Highway Administration.
USDOT. (2012a). FY 2010 statistical summary. Washington, DC: US Department of Transportation,Federal Transit Administration.
USDOT. (2012b). Bus registrations, table MV 10. Washington, DC: US Department of Transportation,Federal Transit Administration.
Van de Velde, D.M. (2003). Regulation and competition in the European land passenger industry:Some recent evolutions. In 8th Conference on Competition and Ownership in Land Passenger Transport,Rio de Janeiro. Retrieved from http://www.thredbo.itls.usyd.edu.au/downloads/thredbo8_pa-pers/thredbo8-plenary-van_de_Velde.pdf
Verband Deutscher Verkehrsunternehmen. (2001–2008). VDV Statistik. Cologne: Author.Verband Deutscher Verkehrsunternehmen. (2003). Jahresbericht 2002/2003. Cologne: Author.Verband Deutscher Verkehrsunternehmen. (2008). VDV Jahresbericht 2007/2008. Cologne: Author.Verband Deutscher Verkehrsunternehmen. (2011). VDV Statistik 2010. Berlin: Author.Vuchic, V. (1999). Transportation for livable cities. New Brunswick, NJ: Center for Urban Policy Research
(CUPR).Wachs, M., Crawford, M., Wirka, S., & Rikala, T. (1992). The car and the city: The automobile, the built
environment, and daily urban life. Ann Arbor: University of Michigan Press.Webster, F.V., & Bly, P.H. (1981). The demand for public transport. Part I. The changing environment in
which public transport operates. Transport Reviews, 1(4), 323–351.Webster, F.V., & Bly, P.H. (1982). The demand for public transport. Part II. Supply and demand factors of
public transport. Transport Reviews, 2(1), 23–46.Wentzel, B., & Wentzel, D. (2000). Wirtschaftlicher Systemvergleich Deutschland/USA. Stuttgart: Lucius &
Lucius Verlagsgesellschaft.Wiegandt, C. (2004). Mixed land use in Germany: Chances, benefits and constraints. In Conference paper:
International Planning Symposium on Incentives, Regulations and Plans—the role of states and nation-statesin smart growth. College Park, MD: Planning National Center for Smart Growth Research andEducation, University of Maryland.
WSP. (2006). Finnish national travel survey. Helsinki: WSP Finland.Yago, G. (1984). The decline of transit: Urban transportation in German and US cities, 1900–1970. New York,
NY: Cambridge University Press.
Demand for Public Transport in Germany and the USA 567
Dow
nloa
ded
by [
Rut
gers
Uni
vers
ity]
at 1
3:02
31
Aug
ust 2
012