delimiting sub-areas in water bodies using multivariate data analysis on the example of lake balaton...
TRANSCRIPT

at SciVerse ScienceDirect
Journal of Environmental Management 110 (2012) 151e158
Contents lists available
Journal of Environmental Management
journal homepage: www.elsevier .com/locate/ jenvman
Delimiting sub-areas in water bodies using multivariate data analysis on theexample of Lake Balaton (W Hungary)
József Kovács a, Mária Nagy b, Brigitta Czauner a, Ilona Székely Kovács c, Andrea K. Borsodi d,István Gábor Hatvani a,*a Eötvös Loránd University, Department of Physical and Applied Geology, H-1117 Budapest, Pázmány P. sétány 1/C, HungarybMiddle Transdanubian Environment Inspectorate, H-8000 Székesfehérvár, Balatoni út 6, HungarycBudapest Business School, Institute of Methodology, H-1054 Budapest, Alkotmány u. 9-11, Hungaryd Eötvös Loránd University, Department of Microbiology, H-1117 Budapest, Pázmány P. sétány 1/C, Hungary
a r t i c l e i n f o
Article history:Received 8 August 2011Received in revised form21 March 2012Accepted 4 June 2012Available online 9 July 2012
Keywords:Cluster analysisDiscriminant analysisEU Water Framework DirectiveLake BalatonMonitoringWater body sub-areasWilks’ lambda distribution
* Corresponding author. Eötvös Loránd University, Fof Physical and Applied Geology, H-1117 Budapest,Hungary. Tel.: þ36 70317 97 58; fax: þ36 1 31 91738
E-mail address: [email protected] (I.G. Hatvan
0301-4797/$ e see front matter � 2012 Elsevier Ltd.http://dx.doi.org/10.1016/j.jenvman.2012.06.002
a b s t r a c t
The main aim of the European Water Framework Directive (WFD, 2000) is to commit European UnionMember states to the achievement of good qualitative and quantitative status for all water bodies by2015. To achieve this, a reference state has to be determined and appropriate monitoring has to becarried out. Based on the fact that the WFD classifies Lake Balaton, the largest shallow freshwater lake inCentral Europe, as one water body, and due to the lack of funds, the number of sampling locations on thelake was decreased. The aim of this study was to determine how many sub-areas with different WFD-related attributes (in this case, parameters) can be delimited in the so-called one water body of LakeBalaton, so that a number of representative sampling locations might be retained. To determine LakeBalaton’s different water quality areas (i.e. sub-areas of water body) 23 parameters (inorganiccompounds) were examined from 10 sampling locations for the time interval 1985e2004 using cluster-and discriminant analysis, and Wilks’ lambda distribution. With cluster analysis we were able todetermine two time intervals (1985e1997 and 1998e2004) with three patterns of sub-areas, two fromthe first and one from the latter interval. These patterns pointed to the fact that for the whole investi-gated time interval (1985e2004) a total of five sub-areas were present, changing in number andalignment. Then the results were verified using discriminant analysis, and the parameters whichinfluenced the sub-areas the most were determined using Wilks’ lambda distribution. The conclusionwas that to be able to follow the changes in alignment of the sub-areas and to get a comprehensivepicture of Lake Balaton, a minimum of five sampling locations should be retained, one in each sub-area.Based on this study the Water Authorities chose to keep five out of ten sampling locations so that thesub-areas could be described. We consider this a great success and the methodology as an example forsetting up sub-areas in a water body.
� 2012 Elsevier Ltd. All rights reserved.
1. Introduction
The main aim of the European Water Framework Directive(WFD) is to commit European Union Member States to theachievement of good qualitative and quantitative status for allwater bodies by 2015. This is one of the biggest challenges natureconservation has ever faced; it underlines the water managements’foregoing approach to the conservation of the quality of water
aculty of Science, DepartmentPázmány Péter sétány 1/C,
.i).
All rights reserved.
bodies and their biological and ecological states (WFD, 2000).Similar actions have already been undertaken in the U.S.A. as well,following ecological surveys in the interests of the restoration andmanagement of lakes along with their watersheds and reservoirs(e.g. Cooke et al., 2005; Edmondson, 1991; USEPA, 2009; Zeng andRasmussen, 2004).
According to theWFD’s definition, a “water body” as a basic unithas to be ecologically “near homogeneous”, while as a legal(administrative) term (Sánchez et al., 2009) it includes themanagement of the water body as well (Ferreira et al., 2006). Theaim of the water bodies policy is to arrange them in such away thatthey could be managed, treated, and monitored with the highestefficiency, thus the collected data could represent their currentstate. Since in the EU Member States the single surface waters are

J. Kovács et al. / Journal of Environmental Management 110 (2012) 151e158152
generally considered one “water body”, the practice of delimitingthem based onwater quality parameters is not common aside fromsome exceptions. For instance, Ferreira et al. (2006) raised ques-tions regarding themonitoring of water bodies in estuaries. Muxikaet al. (2007) subdivided one water body into smaller parts beforedetermining its reference conditions according to theWFD by usingparameters regarding benthic communities. Earle and Blacklocke(2008) who tried to implement the WFD in Ireland, alsomentioned financial problems that every Member State had to face.Namely, a balance should be found between the financial andscientific aspects, for example by setting up enough monitoringlocations. Otherwise, “it is possible that no further degradation ofwater body could be observed” (László et al., 2007). Eventually,based on numerical simulations Dinesh (2008) established thatwater bodies are dynamic objects undergoing spatial and temporalchanges, such as floods and droughts.
Following of the WFD’s “one lake, one water body” approachalso raised significant questions in Hungary, particularly in case ofLake Balaton.
Lake Balaton (LB) is the largest (596 km2) shallow (averagedepth 3.2 m) fresh water lake in Central Europe (Istvánovics et al.,2007). It is 17,000e19,000 years old (Cserny and Nagy-Bodor, 2000)and located in W Hungary, in the S-SE foreground of the Trans-danubian Central Range (Fig. 1). According to paleolimnologicalresearch, trophic state of Lake Balatonwas changed betweenmeso-and eutrophy in the last Millennia (Korponai et al., 2011). It isconsidered as a Ramsar site; however, due to vast tourist activity itis only under the convention’s protection from late summer untillate spring CWIIWH, 1987.
The morphologically diverse watershed of the lake is approxi-mately 5,181 km2 (Cserny, 1993) in which 51 inflows are located ofwhich 20 are constant. Among the latter, the River Zala is the mostimportant, providing 45% of LB’s water supply, and 35e40% of itsnutrient input (Lotz, 1988). At the mouth of the River Zala the Kis-Balaton Water Protection System (KBWPS) was established in 1985in order to filter the nutrients entering LB with the river and thus toprevent the lake’s further eutrophication. It serves a crucial role inthe management of the lake. Regarding the KBWPS, Hatvani et al.(2011) published a study using methods being similar to thatapplied in this paper. Using cluster analysis to determine thesimilarity of the KBWPS’ sampling site, they pointed out that,because of its water level management, the reedy areas began todecrease this way affecting the water quality of LB. On the otherhand, LB’s only outflow is the Sió Canal, which was put into oper-ation in 1863 at the southeastern tip of the lake (Kovács et al., 2010).Consequently, the exterior nutrient load of LB varies systematicallyfrom the east to the west (e.g. Sagehashi et al., 2001).
However, water quality can also differ temporally and spatiallyin the four geographical basins that make up the lake’s bed (e.g.
Fig. 1. Orientation of Lake Balaton with its basins an
Hajnal and Padisák, 2008; Padisák et al., 2006; Pálffy and Vörös,2011) due to other factors as well. For instance, the lake’s ener-getic mass cycle is basically supported by the primary productionof the planktonic algae, which not only determine, but also indi-cate water quality (Vörös and Somogyi, 2009). Accordingly, in thewinters of 1974 and 1975 algae blooms were noticeable and fol-lowed by mass fish deaths. This water quality deterioration mainlyaffected the western part of the lake, but the middle part becomeseutrophic as well. Subsequently, the first lake-wide algae bloomwas witnessed in 1982 due to the mass reproduction of the Wolos-toxin-producing, filiform, N-fixing Cylindrospermopsis raciborskii(Istvánovics et al., 2007; Padisák, 1997; Parpala et al., 2003;Spr}ober et al., 2003). This event recurred in 1994 after a few yearsof drought and huge eel extinctions in 1992 and 1993, when theblue cyanobacteria turned the entire lake hypertrophic. However,thanks to a series of significant counter-measures and rainyweather LB’s water quality could already been classified as “good”in 1995, and also since then it has been improving irrespective ofwater level changes. Thus nowadays oligotrophic trends can beobserved (Hajnal and Padisák, 2008; Istvánovics et al., 2002, 2007),although it is still considered to be mesotrophic.
In spite of the spatial and temporal variability of LB’s waterquality described above, Hungarian typology still determines thelake as one water body (CDWE, 2010) (like every other lake in thecountry, and in the EU as well (WFD, 2000)). Consequently, and alsodue tofinancial constraints, in 2005 the spatial samplingof LB had tobe revised, and the number of sampling locations had to bedecreased. The new sampling points were settled according to thisstudy. One sampling sitewas retained at themouth of the River Zala,which is the main origin of LB’s nutrient loads (Tátrai et al., 2000).Furthermore, from 2006 monitoring was retuned according to therequirements of the WFD. Thus on one hand, the biologicalparameters such as phytoplankton, phytobenton, macrozoobenton,fish, and macrophyton came to the fore, while on the other handmonitoring of the chemical parameters (oxygen, trophic parame-ters, nutrients) became secondary. In other words, if the biologicalparameter values are satisfactory, samplingof the chemical ones caneven be discarded. Following the instructions of the WFD, moni-toring of the lake can be more effective in theory.
However, already the “one lake, one water body” approach isquestionable in the case of LB. It might been classified correctly bytheWFD in the 16th category as a calcareous, large lakewith an openwater space (open area larger than 33%), because its surface ismainlyconsists of open water-space, while the percentage of reeds is lessthan 2%, and nowadays there is no significant difference in theecological quality of the lake’s western and eastern parts. However,this ideamay not stand or has to be refined taking into account otherfacts such as the lake’s geological heterogeneity, the differingnutrient loads arriving from the lake’s watershed area (CDWE, 2010),
d sampling locations between 1985 and 2004.

1 A T-value was formed for each parameter, containing its annual information foreach sampling site.
J. Kovács et al. / Journal of Environmental Management 110 (2012) 151e158 153
or meteorological impacts. These clearly affect the reference state,the classification, and the results of the monitoring as well.
Bearing these facts in mind our aim was to design and presentan impartial method that is capable of refining the “one waterbody” idea by delimiting sub-areas in LB. This objective fortu-nately coincided with the following question on the WaterAuthority’s part. How many sub-areas characterized by differingwater quality can be delimited in the so called one water body ofLB, so that a number of representative sampling locations couldbe retained?
2. Applied data and methods
2.1. Sampling, analysis and data handling
We acquired data concerning LB from theMiddle TransdanubianEnvironment Inspectorate for the time interval 1985e2004. Thedata mainly consists of chemical parameters describing the lake’swater quality. Samples were taken from ten sampling locationsnear the lake’s centerline (Fig. 1).
The examined components were as follows: Dissolved O2;
5 day-Biological oxygen demand (BOD5); Chemical oxygendemand-potassium-dichromate (CODC); Chemical oxygen demand-potassium-permanganate (CODP); NH4eN, NO2eN, NO3eN,Organic-nitrogen (ON), Total suspended solids (TSS); CaO; Naþ;Kþ; Ca2þ; Mg2þ; HCO3
�; SO42�; Cl� (mg l�1); Total-phosphorous (TP);
PO4eP; Chlorophyll-a (mg l�1); pH; Conductivity (mS cm�1); Watertemperature (Wtemp; �C); Alkalinity (mmol l�1). The number ofreceived data was around 91,000. This amount would be sufficient,however not optimal, in solving the problem. The basic requirementof multivariate exploratory techniques is that data must not bemissing at any of the sampling events (Kovács et al., 2012). Thissituation, however, occurred many times, because during theinvestigated period the number of analyzed parameters changed,usually increased (e.g., in 1995 there were 25, in 1996e27, in1997e30, and between 2000 and 2004 there were 31 investigatedparameters). Thus, in order to avoid the incomparability of theresults, only 23 parameters which had been continuouslymeasured were used during the research. Moreover, the samplingmethods have also changed many times. If two methods calledforth similar results, then both of the parameters were retained.Another problem was that in LB the sampling was done with twodifferent frequencies, monthly (at the sampling points ofBalatonfüred, Balatonf}uzf}o, Balatongyörök, Révfülöp-Balatonboglár,and Szigliget Bay), and fortnightly (at the sampling points ofBalatonakali, Keszthely Bay, Siófok, Szigliget and the mouth of theRiver Zala). Also in winter, because of the ice cover, sampling couldnot be done in every occasion, so the number of examined datavaried between w210 and w420. Taking these facts intoconsideration, our tests were done for 85 points in time over theperiod 1985 to 2004, so that we were able to determine theconnections between the sub-areas of the water body.
During data preparation the extreme values were handled withcaution. The relative deviation of the parameters and otherdescriptive statistics were determined, since there may be valueswhich seem to be extreme but according to certain parameters’variability those can be all valid. As a result, except for the obviouslymistyped ones, all values were used.
2.2. Applied mathematical methods
To find the associations and the main trends in the acquireddatasets, multivariate data analysis, cluster analysis (CA), discrimi-nant analysis, and Wilks’ lambda distribution were applied. Ouraims could have been achieved by applying principal component
analysis (PCA) and afterwards hierarchical cluster analysis (HCA), asin the work of Neilson and Stevens (1986), who, by applyingT-values,1 were able to explain 100% of the T-values’ variance.Like other scientists (Cansu et al., 2008; Neilson and Stevens,1986; Simenov et al., 2003; Singh et al., 2004; Zeng andRasmussen, 2004) e using PCA e they too define the number ofprincipal components based on their eigenvalues. If it is higher orequal to 1 in the case of surface water analysis it usually results in3e5 factors, which are linear combinations of the original variables,which are uncorrelated. Using this new coordinate system, theoriginal sampling location can be transformed into one witha smaller number of dimensions. This way the cases could begrouped based on their similarity. Based on the studies cited earlierthe principal components define only 65e85%of the data’s variance.This brings forward the problem that usingHCAon the smaller set ofindependent variables can only approximate the cases in the spaceof the original variables. In this way the HCA result will only berepresentative of a part of the original variance. By using HCA on theoriginal dataset this loss in variance could be by-passed.
“Cluster analysis classifies a set of observations into two or moremutually exclusive “unknown” groups based on combinations ofinterval variables. The purpose of cluster analysis is to discovera system of organizing observations, usually people, into groupswhere members of the groups share properties in common”(Stockburger, 2001). In our study Ward’s method and squaredEuclidian distancewas applied. Itmust be stated that this tool cannotbe used on time-series (because consecutive data are dependent oneach other), only on distinctive sampling points in time.
During our study we used clustering on sampling locations(space) and points in time (time) as well in the order described inFig. 2.
To test the results of the CA, discriminant analysis can be used. Itshows to what extent the planes separating the groups can bedistinguished. The model is composed of a discriminant function(for more than two groups a set of discriminant functions) based onlinear combinations of the predictor variables that provide the bestdiscrimination between the groups. The functions are generatedfrom a sample of cases for which the group membership isknown; the functions can then be applied to new cases thathave measurements for the predictor variables but their groupmembership is as yet unknown (Afifi et al., 2004). The result of thediscriminant analysis is often visualized on a surface stretchedbetween the first two discriminating planes (Ketskeméty and Izsó,2005).
Subsequently, the data from the sampling points were examinedusing Wilks’ l distribution to define which parameters played thegreatest role in determining the formations of the cluster groups.During the analysis a Wilks’ l quotient was assigned to everyparameter for every year, where the quotient is:
l ¼
P
i
P
j
�xij � xi
�2
P
i
P
j
�xij � x
�2
Where xij is the jth element of group i, xi the average of group i, andxi the total groups average.
The value of l is the ratio of the within-group sum of squares tothe total sum of squares. It is a number between 0 and 1. If l ¼ 1,then the mean of the discriminant scores is the same in all groupsand there is no inter-group variability, so, in our case the parameter

Fig. 2. Step-by-step scheme of the clustering method applied in this study.
J. Kovács et al. / Journal of Environmental Management 110 (2012) 151e158154
did not affect the formation of the cluster groups (Afifi et al., 2004).On the contrary, if l¼ 0, then that particular parameter affected theformation of the cluster groups the most. The smaller the quotientis, themore it determines the content of the cluster groups (Hatvaniet al., 2011).
3. Results and discussion
3.1. Determining similar sampling locations for the points in time
Choosing the right method to segment the “one water body”is very important. Among the available cluster analysis seemedto be the most appropriate in selecting similar sampling locations.
During the study 85 points in time were examined employinghierarchical cluster analysis. As a result, 85 dendrograms wereproduced which show the groups’ varying spatial distribution(examples of which may be seen in Fig. 3). Examining thecomposition of the dendrograms, similar sampling points wereidentified. The linkage distance was allocated at 20% of the linkagedistance where only one group remains (every linkage distancepercentage was measured in this way in the study). This methodstandardized the procedure and facilitated comparison. If thelinkage distance had been set to a percentage less than 20%, thengroup number reduction would not have been possible, while if ithad been higher it would have resulted in too significant a reduc-tion in the number of groups.
At the beginning of the evaluation, it became clear that theprevious, geographically-based four-basin division had changedover the years. For instance, in the most extreme cases there weresix times between 1992 and 1997 when 10 sampling locationsformed 6 different groups. On the contrary, there were certainpoints in time when only two different groups could be identified.(It has to be stated that these groups may be considered as sub-areas, but later on it will become clear that these groups are notyet able to cover the final sub-areas.)
3.2. Determining time intervals with homogenous sub-areas in LB’swater body
After obtaining the 85 dendrograms, the time intervals had to bedetermined when homogenous sub-areas were to be found, whenthe results of the 85 dendrograms formed sub-areas. Because of thevarying results (regarding the 85 dendrograms) e meaning that atdifferent points in time the number of groups varied from 2 to 6 e
the sampling locations belonging to the same group at a certaintime have to be coded. The codes (Fig. 3) represent which group thesampling point belongs to.
As a starting point the westernmost group in LB alwaysreceived �2 code, while the easternmost was þ2. The groups thecoding these two end points received integers or fractions (Fig. 3).Irrespective of whether the groups received a fractional or a wholenumber, the point was that the cluster analysis could identify themas different groups. By coding the groups the problem originatingfrom the time-series character is solved as in the work of Neilsonand Stevens (1986), who, instead of coding, used single (T) values.
After each group at every point in time received a code, thesewere clustered in time (1985e2004). The results of the clusteranalysis conducted by using coding under consistent and preciseexecution can be considered as objective. As a result, time intervalswith similar behavior were obtained when homogeneous sub-areas were to be determined (Fig. 4). There were in practice twotime intervals with different behaviors, namely 1985e1997 and1998e2004. Between 1985 and 1997 two patterns were present atthe same time so we separated the interval into 1985e1997a and1985e1997b.
3.3. Determining the similar sampling locations for the timeintervals
As a final step, the points in time from the three time intervals(1985e1997a, 1985e1997b, and 1998e2004) were extracted and

Fig. 4. Dendrogram of the three time intervals with similar behavior (1985e1997a; 1985e1997b and 1998e2004).
Fig. 3. Examples on the 85 clustered points in time and the coding applied to the sampling locations, 07.12.1987 A); 10.10.1988 B); 02.04.1991 C); 03.07.1995 D).
J. Kovács et al. / Journal of Environmental Management 110 (2012) 151e158 155
J. Kovács et al. / Journal of Environmental Management 110 (2012) 151e158156
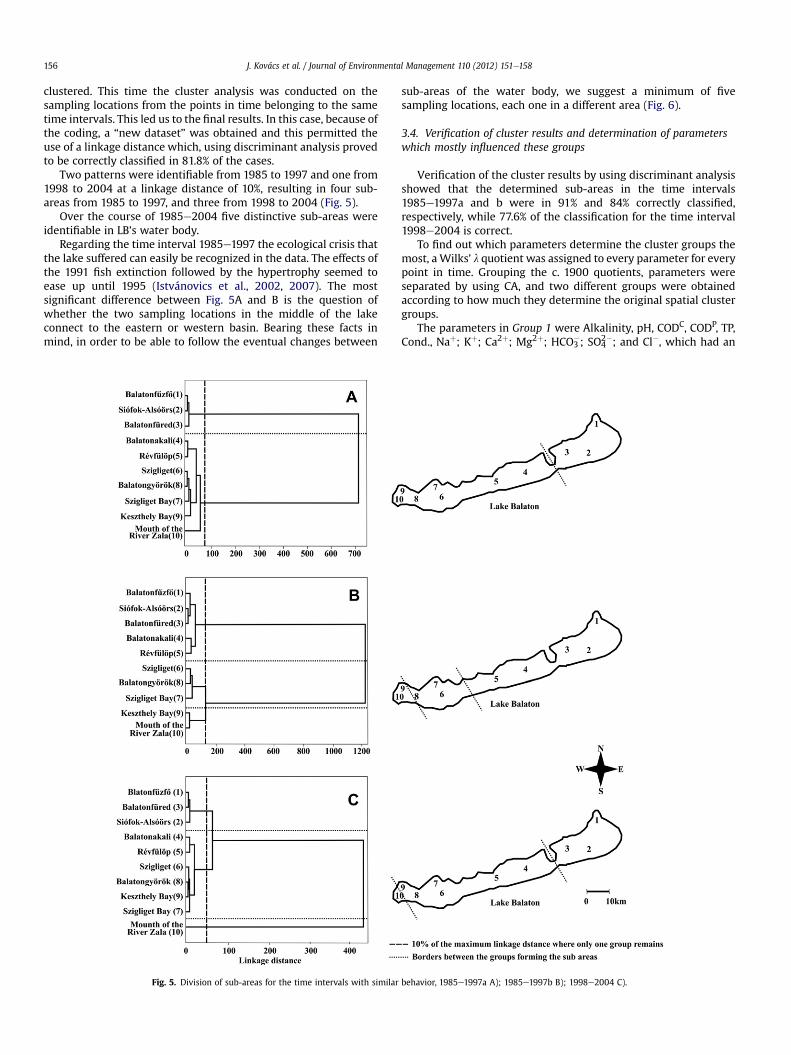
clustered. This time the cluster analysis was conducted on thesampling locations from the points in time belonging to the sametime intervals. This led us to the final results. In this case, because ofthe coding, a “new dataset” was obtained and this permitted theuse of a linkage distance which, using discriminant analysis provedto be correctly classified in 81.8% of the cases.
Two patterns were identifiable from 1985 to 1997 and one from1998 to 2004 at a linkage distance of 10%, resulting in four sub-areas from 1985 to 1997, and three from 1998 to 2004 (Fig. 5).
Over the course of 1985e2004 five distinctive sub-areas wereidentifiable in LB’s water body.
Regarding the time interval 1985e1997 the ecological crisis thatthe lake suffered can easily be recognized in the data. The effects ofthe 1991 fish extinction followed by the hypertrophy seemed toease up until 1995 (Istvánovics et al., 2002, 2007). The mostsignificant difference between Fig. 5A and B is the question ofwhether the two sampling locations in the middle of the lakeconnect to the eastern or western basin. Bearing these facts inmind, in order to be able to follow the eventual changes between
Fig. 5. Division of sub-areas for the time intervals with similar
sub-areas of the water body, we suggest a minimum of fivesampling locations, each one in a different area (Fig. 6).
3.4. Verification of cluster results and determination of parameterswhich mostly influenced these groups
Verification of the cluster results by using discriminant analysisshowed that the determined sub-areas in the time intervals1985e1997a and b were in 91% and 84% correctly classified,respectively, while 77.6% of the classification for the time interval1998e2004 is correct.
To find out which parameters determine the cluster groups themost, a Wilks’ l quotient was assigned to every parameter for everypoint in time. Grouping the c. 1900 quotients, parameters wereseparated by using CA, and two different groups were obtainedaccording to how much they determine the original spatial clustergroups.
The parameters in Group 1 were Alkalinity, pH, CODC, CODP, TP,Cond., Naþ; Kþ; Ca2þ; Mg2þ; HCO3
�; SO42�; and Cl�, which had an
behavior, 1985e1997a A); 1985e1997b B); 1998e2004 C).

Fig. 6. Sub areas discoverable during 1985e2004 in Lake Balaton, and the five sampling locations retained by the Water Authority based on our study.
J. Kovács et al. / Journal of Environmental Management 110 (2012) 151e158 157
average quotient of 0.125. In Group 2 the following parameters werefound: TSS, BOD5, NH4eN, NO2eN, Dissolved O2, CaO, Chl-a, ON,PO4eP, and Wtemp, which had a quotient of 0.243.
Regarding the effect of the parameters on the result statedabove, it can be said that the parameters which stand in closerelation to eutrophication play a smaller role in determining thesub-areas in LB’s water body than the inorganic ones. This shouldcome as no surprise, because LB’s water surface is in the mainlacking in coverage and the opposite is witnessed in eutrophic andmacrophyte covered waters (Hatvani et al., 2011).
4. Conclusions
According to the WFD, Lake Balaton currently consists of onlyone water body. During our research wewere able to point out thatpreconceived sub-areas of the water body change dynamically overtime, and on different scales this movement stands in closeconnectionwith the “recent” ecological events in the lake (e.g. massfish deaths (Molnár et al., 1991), oligotrophic trends (Istvánovicset al., 2002, 2007; Hajnal and Padisák, 2008) etc.). In the firsttime period (1985e1997) two patterns were noticeable: one of twoand one of three sub-areas. However, from 1998 only one pattern,namely that of three sub-areas, becomes apparent, thus the lakepresents a uniform picture. Considering that the intensive changesin the lake’s water quality described in the introduction ceased in1998, the coincidence is conspicuous.
Data analysis for the 20 year time interval explicitly showed thatthe borders between the five sub-areas of LB’s water body canmoveany time. At a given point in time the division of the whole waterbody into sub-areas is a key question in planning the monitoring ofthe lake. Namely, where the borders are expected to move, thespatial frequency of sampling should be increased.
The uniqueness of the study lies in the application of clusteranalysis, because if no transformation is made on the dataset, thenno variance loss is expected from the original data. As a result towhat extent the general pattern obtained exists in the identifiedtime intervals can be determined precisely.
Based on this study theWater Authority chose to keep five out often sampling locations so that the sub-areas could be described.Weconsider this as a great success and themethodology as an examplefor the setting up of sub-areas in a water body.
Acknowledgments
We the authors would like to thank Paul Thatcher for his workon our English version and say thanks for the help of Peter Tanos on
the artwork. The work of I.G. Hatvani was funded by the “Habilitas”scholarship of the Hungarian Development Bank Plc. (MFB Zrt.)which we are very grateful for.
References
Afifi, A., Clark, V.A., May, S., Raton, B., 2004. Computer-aided Multivariate Analysis,fourth ed. Chapman & Hall/CRC, Boca Raton, FL.
Cansu, F.I., Özgür, E., Semra, I., Naime, A., Veyesel, Y., Seyhan, A., 2008. Application ofmultivariate statistical techniques in the assessment of surface water quality inUluabat Lake, Turkey. Environmental Monitoring and Assessment 144,269e276.
CDWE, Central Directorate for Water and Environment, 2010. Watershed Manage-ment Plan, Domestic Implementation of the Water Framework DirectiveWatershed Management Plan. Hungarian Ministry of Rural Development,Budapest. http://www.vizeink.hu/files/Reszvizgyujto_VGT_Balaton_13.pdf.
Cooke, G.D., Welch, E.B., Peterson, S., Nichols, S.A., 2005. Restoration and Manage-ment of Lakes and Reservoirs, third ed. CRC Press, Boca Raton.
Cserny, T., Nagy-Bodor, E., 2000. Limnogeological investigations on Lake Balaton. In:Gierlowski-Kordesch, E., Kelts, K. (Eds.), Lake Basins Through Space and Time.AAPG Studies in Geology, vol. 46, pp. 605e618.
Cserny, T., 1993. Lake Balaton, Hungary. In: Gierlowski-Kordesch, E., Kelts, K. (Eds.),A Global Geological Record of Lake Basins. Cambridge University Press, Cam-bridge, pp. 397e401.
CWIIWH, 1987 Convention of International Importance especially as WaterflowHabitat. Ramsar (Iran), 2 February 1971. UN Treaty Series No. 14583. AsAmended by the Paris Protocol, 3 December 1982, and Regina Amendments, 28May 1987.
Dinesh, S., 2008. Characterization of influence zones of simulated droughts andfloods of water bodies in a floodplain. Computer and Geosciences 34,1791e1797.
Earle, R., Blacklocke, S., 2008. Master plan for water framework directive activitiesin Ireland leading to River Basin Management Plans. Desalination 226, 134e142.
Edmondson, W.T., 1991. The Uses of Ecology; Lake Washington and Beyond.University of Washington Press, Seattle.
Ferreira, J.G., Nobre, A.M., Simas, T.C., Silva, M.C., Newton, A., Bricker, S.B.,Wolff, W.J., Stacey, P.E., Sequeira, A., 2006. A methodology for defininghomogenous water bodies in estuaries e Application to the transitional systemsof the EU Water Framework Directive. Estuarine, Coastal and Shelf Science 66,468e482.
Hajnal, E., Padisák, J., 2008. Analysis of long-term ecological status of LakeBalaton based on the ALMOBAL phytoplankton database. Hydrobiologia 599,259e276.
Hatvani, I.G., Kovács, J., Kovácsné, Székely I., Jakusch, P., Korponai, J., 2011. Analysisof long term water quality changes in the Kis-Balaton Water Protection Systemwith time series-, cluster analysis and Wilks’ lambda distribution. EcologicalEngineering 37, 629e635.
Istvánovics, V., Somlyódi, L., Clement, A., 2002. Cyanobacteria-mediated internaleutrophication in shallow Lake Balaton after load reduction. Water Research 36,3314e3322.
Istvánovics, V., Clement, A., Somlyody, L., Specziar, A., G.-Toth, L., Padisak, J., 2007.Updating water quality targets for shallow Lake Balaton (Hungary), recoveringfrom eutrophication. Hydrobiologia 581, 305e318.
Ketskeméty, L., Izsó, L., 2005. Introduction to the SPSS Software. Methodical Guideand Task Collection for Statistical Analysis. Eötvös Kiadó, Budapest.
Korponai, J., Varga, K.A., Lengré, T., Papp, I., Tóth, A., Braun, M., 2011. Paleolimno-logical reconstruction of the trophic state in Lake Balaton (Hungary) usingCladocera remains. Hydrobiologia 676, 237e248.

J. Kovács et al. / Journal of Environmental Management 110 (2012) 151e158158
Kovács, J., Hatvani, I.G., Korponai, J., Kovácsné, Sz. I., 2010. Morlet wavelet andautocorrelation analysis of long term data series of the Kis-Balaton WaterProtection System (KBWPS). Ecological Engineering 36, 1469e1477.
Kovács, J., Tanos, P., Korponai, J., Kovácsné, Sz.I., Gondár, K., Gondár-S}oregi, K.,Hatvani, I.G., 2012. Analysis of water quality data for scientists. In:Voudouris, V., Voutsa, D. (Eds.), Water Quality and Water Pollution: Evaluationof Water Quality Data. In Tech Open Access Publisher, Rijeka, pp. 65e94.
László, B., Szilágyi, F., Szilágyi, E., Heltai, Gy., Licskó,, I., 2007. Implementation of theEU Water Framework Directive in monitoring of small water bodies in Hungary,I. Establishment of surveillance monitoring system for physical and chemicalcharacteristics for small mountain watercourses. Microchemical Journal 85,65e71.
Lotz, Gy, 1988. A Kis-Balaton Vizvedelmi Rendszer. Hidrologiai Tajekoztato (The Kis-Balaton Water Protection System. Hidrologycal Bulettin). Oktober 20e22.
Molnár, K., Székely, Cs., Baska, F., 1991. Mass mortality of eel in Lake Balaton due toAnguillicola crassus infection. Bulletin of the European Association of FishPathologists 11, 211.
Muxika, I., Borja, Á., Bald, J., 2007. Using historical data, expert judgment andmultivariate analysis in assessing reference conditions and benthic ecologicalstatus, according to the European Framework Directive. Marine PollutionBulletin 55, 16e29.
Neilson, M.A., Stevens, R.J.J., 1986. Determination of water quality zonation in LakeOntario. Developments in Water Science 27, 99e116.
Padisák, J., Borics, G., Grigorszky, I., Soroczki-Pintér, E., 2006. Use of phytoplanktonassemblages for monitoring ecological status of lakes within the WaterFramework Directive: the assemblage index. Hydrobiologia 553, 1e14.
Padisák, J., 1997. Cylindrospermopsis raciborskii (Wo1oszynska) Seenayya et SubbaRaju, an expanding, highly adaptive cyanobacterium: worldwide distributionand review of its ecology. Arch. Hydrobiologia 107, 563e593.
Pálffy, K., Vörös, L., 2011. A fitoplankton diverzitása a Balatonban: a fajösszetételt}ola funkcionális diverzitásig (Fitoplankton diversity in lake Balaton). Ecology oflake Balaton/A Balaton Ökológiája 1, 61e75.
Parpala, L., G.-Tóth, L., Zinevici, V., Németh, P., Szalontai, K., 2003. Structure andproduction of the metazoan zooplankton in Lake Balaton (Hungary) in summer.Hydrobiologia 506, 347e351.
Sagehashi, M., Sakoda, A., Suzuki, M., 2001. A mathematical model of a shallow andEutrophic Lake (The Keszthely Basin, Lake Balaton) and simulation of restor-ative manipulations. Water Research 35, 1675e1686.
Sánchez, D., Carrasco, F., Andreo, B., 2009. Proposed methodology to delineatebodies of groundwater according to the European Water framework directive.Application in a pilot Mediterranean river basin (Málaga, Spain). Journal ofEnvironmental Management 90, 1523e1533.
Simenov, V., Stratis, J.A., Samara, C., Zachariadis, G., Voutsa, D., Anthemidis, A.,Sofoniou, M., Kouimtzis, Th, 2003. Assessment of the surface water quality inNorthern Greece. Water Research 37, 4119e4124.
Singh, K.P., Malik, A., Mohan, D., Sinha, S., 2004. Multivariate statistical techniquesfor the evaluation of spatial and temporal variations in water quality of GomtiRiver (India): a case study. Water Research 38, 3980e3992.
Spr}ober, P., Hesham, M.S., Présing, M., Kovács, A.W., Herodek, S., 2003. Nitrogenuptake and fixation in the cyanobacterium Cylindrospermopsis raciborkii underdifferent nitrogen conditions. Hydrobiologia 506-509, 169e174.
Stockburger, W.D., 2001. Multivariatestatistics: Concepts, Models, and Applications.Missouri State University.
Tátrai, I., Kálmán, M., Korponai, J., Paulovits, G., Pomogyi, P., 2000. The role of theKis-Balaton water protection system in the control of water quality of lakeBalaton. Ecological Engineering 16, 73e78.
U.S. Environmental Protection Agency (USEPA), 2009. National Lakes Assessment:a Collaborative Survey of the Nation’s Lakes. EPA 841-R-09e001. U.S. Environ-mental Protection Agency, Office of Water and Office of Research and Devel-opment, Washington, D.C.
Vörös, L., Somogyi, B., 2009. A Balaton algaegyüteseinek szerepe a tó víz-min}oségének alakításában (The role of Lake Balaton’s algae composition inwater quality). In: Bíró, P., Banczerowsky, J. (Eds.), A Balaton kutatásának 2008.évi eredményei (The results of the research of Lake Balaton in the year 2008).Hungarian Academy of Sciences, Budapest, pp. 7e16.
WFD, 2000. Directive of the European Parliament and of the Council 2000/60/ECEstablishing a Framework for Community Action in the Field of Water Policy.European Union, Luxembourg. PE-CONS 3639/1/00 REV 1.
Zeng, X., Rasmussen, T.C., 2004. Multivariate statistical characterization of waterquality in lake Lanier, Georgia. Journal of Environmental Quality 34, 1980e1991.