definitive information statement_2011
TRANSCRIPT

SECURITIES AND EXCHANGE COMMISSION SEC FORM 20-1S
INFORMATION STATEMENT PURSUANT TO SECTION 20 OF THE SECURITIES REGULATION CODE
1. Check the appropriate box: [ ] Preliminary Information Statement [ X ] Definitive Information Statement 2. Name of Registrant as specified in its charter MEGAWORLD CORPORATION 3. Metro Manila Province, country or other jurisdiction of incorporation or organization 4. SEC Identification Number 167423 5. BIR Tax Identification Code 320-000-477-103 6. 28th Floor, The World Centre 330 Sen. Gil Puyat Avenue Makati City, Philippines 1227 Address of principal office 7. Registrant’s telephone number, including area code (+632) 867-8826 to 40 8. 17 June 2011 9:00 a.m. Grand Ballroom Eastwood Richmonde Hotel 17 Orchard Road, Eastwood City Bagumbayan, Quezon City, Philippines Date, time and place of the meeting of security holders 9. Approximate date on which the Information Statement is first to be sent or given to security holders 26 May 2011 10. Securities registered pursuant to Sections 8 and 12 of the Code or Sections 4 and 8 of the RSA Title of Each Class Number of Shares of Stock Outstanding Common 25,637,783,626 Preferred 6,000,000,000 Total 31,637,783,626 11. Are any or all of registrant’s securities listed on the Philippine Stock Exchange?
Yes [X] No [ ] If yes, disclose the name of such Stock Exchange and the class of securities listed therein: The shares of common stock of the Company are listed on the Philippine Stock Exchange.


PROXY MEGAWORLD CORPORATION 2011 STOCKHOLDERS’ MEETING
I/WE hereby name and appoint ______________________________________, or in his absence, the Chairman of the meeting, as my/our proxy at the annual stockholders’ meeting of MEGAWORLD CORPORATION (“Megaworld”) to be held on 17 June 2011 at the Grand Ballroom, Eastwood Richmonde Hotel, 17 Orchard Road, Eastwood City, Bagumbayan, Quezon City, Philippines, and/or at any postponement or adjournment thereof, and/or any annual stockholders’ meeting of Megaworld, which appointment shall not exceed five (5) years from date hereof. In particular, I/We hereby direct my/our said proxy to vote all my/our shares on the agenda items set forth below as I/We have expressly indicated by marking the same with an “X”.
Items No.
Subject Action
For Against Abstain 3 Approval of Minutes of the
Previous Annual Meeting
5 Appointment of External Auditors
6 Ratification of Acts and Resolutions of the Board of Directors, Board Committees and Management
7 Election of Directors a. Andrew L. Tan b. Katherine L. Tan c. Kingson U. Sian d. Enrique Santos L. Sy
e. Miguel B. Varela f. Gerardo C. Garcia g. Roberto S. Guevara
______________________________ ____________________________________ PRINTED NAME OF STOCKHOLDER SIGNATURE OF AUTHORIZED SIGNATORY THIS PROXY SHOULD BE RECEIVED BY THE CORPORATE SECRETARY ON OR BEFORE 10 JUNE 2011. THIS PROXY, WHEN PROPERLY EXECUTED, WILL BE VOTED IN THE MANNER AS DIRECTED HEREIN BY THE STOCKHOLDER(S). IF NO DIRECTION IS MADE, THIS PROXY WILL BE VOTED FOR THE ELECTION OF ALL NOMINEES AND FOR THE APPROVAL OF THE MATTERS STATED ABOVE AND FOR SUCH OTHER MATTERS AS MAY PROPERLY COME BEFORE THE MEETING IN THE MANNER DESCRIBED IN THE INFORMATION STATEMENT. A STOCKHOLDER GIVING A PROXY HAS THE POWER TO REVOKE IT AT ANY TIME BEFORE THE RIGHT GRANTED IS EXERCISED. A PROXY IS ALSO CONSIDERED REVOKED IF THE STOCKHOLDER ATTENDS THE MEETING IN PERSON AND EXPRESSED HIS INTENTION TO VOTE IN PERSON. THIS PROXY DOES NOT NEED TO BE NOTARIZED. (Partnerships, Corporations and Associations must attach certified resolutions thereof designating Proxy/Representative and Authorized Signatories)

INFORMATION STATEMENT
GENERAL INFORMATION
Date, Time and Place of Meeting of Security Holders The annual meeting of stockholders of the Company will be held on 17 June 2011, 9:00 a.m., at the Grand Ballroom, Eastwood Richmonde Hotel, 17 Orchard Road, Eastwood City, Bagumbayan, Quezon City, Philippines. The Company’s complete mailing address is at the 28/F The World Centre, 330 Sen. Gil Puyat Avenue, Makati City, Philippines 1227. Copies of this information statement will be sent on or before 27 May 2011 to all stockholders on record as of 20 April 2011. The Company is not soliciting proxies. We are not asking you for a proxy. Neither are you required to send us a proxy. Dissenters’ Right of Appraisal There is no proposed corporate action in the agenda for the annual meeting of stockholders that will grant appraisal rights pursuant to the Corporation Code of the Philippines to dissenting stockholders. Any stockholder of the Company shall have the right to dissent and demand payment of the fair value of his shares in the following instances: 1) in case any amendment to the articles of incorporation has the effect of changing or restricting the rights of any stockholders or class of shares, or of authorizing preferences in any respect superior to those of outstanding shares of any class, or of extending or shortening the term of corporate existence; 2) in case the corporation decides to invest its funds in another corporation or business or for any purpose outside of the primary purpose for which it was organized; (3) in case of sale, lease, exchange, transfer, mortgage, pledge or other disposition of all or substantially all of the corporate property and assets; and 4) in case of merger or consolidation. The appraisal right may be exercised by any stockholder who shall have voted against the proposed corporate action, by making a written demand on the Company within thirty (30) days after the date on which the vote was taken, for payment of the fair value of his shares. A stockholder must have voted against the proposed corporate action in order to avail himself of the appraisal right. Failure to make the demand within the 30-day period shall be deemed a waiver of the appraisal right. From the time of the demand until either the abandonment of the corporate action in question or the purchase of the dissenting shares by the Company, all rights accruing to the dissenting shares shall be suspended, except the stockholder’s right to receive payment of the fair value thereof. If the proposed corporate action is implemented or effected, the Company shall pay to such stockholder, upon surrender of the stock certificate(s) representing his shares, the fair value thereof as of the day prior to the date on which the vote was taken, excluding any appreciation or depreciation in anticipation of such corporate action. If the fair value is not determined, within sixty (60) days from the date the corporate action was approved by the stockholders, it will be determined by three (3) disinterested persons (one chosen by the Company, another chosen by the dissenting stockholder and the third to be chosen jointly by the Company and the stockholder). The findings of the majority of the appraisers shall be final, and their award shall be paid by the Company within thirty (30) days after such award is made. Upon payment by the Company of the awarded price, the dissenting stockholder shall forthwith transfer his shares to the Company.

2
No payment shall be made to any dissenting stockholder unless the Company has unrestricted retained earnings. Interest of Certain Persons in or Opposition to Matters to be Acted Upon No director or officer of the Company, or any nominee for election as a director of the Company, or any associate thereof, has any substantial interest, direct or indirect, by security holdings or otherwise, in any matter to be acted upon, other than election to office. No director of the Company has informed it in writing that he intends to oppose any action to be taken by the Company at the annual meeting of stockholders.
CONTROL AND COMPENSATION INFORMATION
Voting Securities and Principal Holders Thereof Number of Shares Outstanding As of 20 April 2011, the Company had outstanding shares of 31,637,783,626 common stock and 6,000,000,000 voting preferred stock. Each common share and preferred share shall be entitled to one (1) vote. Record Date of Meeting All stockholders on record as of 20 April 2011 will be entitled to notice of, and to vote at, the annual meeting of stockholders. Cumulative Voting Rights Each stockholder shall be entitled to one (1) vote with respect to all matters to be taken up during the annual meeting of stockholders. Provided that each stockholder shall have cumulative voting rights with respect to the election of the members of the board of directors of the Company. Cumulative voting entitles each stockholder to cumulate his shares and give one nominee as many votes as the number of directors to be elected multiplied by the number of his shares shall equal, or distribute them on the same principle among as many nominees as he shall see fit; provided, that the total number of votes cast by him shall not exceed the number of shares owned by him multiplied by the number of directors to be elected.

3
Security Ownership of Record and Beneficial Owners of more than 5% of the Company’s Shares as of April 30, 2011
Title of Class Name, address of Record Owner and Relationship with
Issuer
Name of Beneficial Owner and Relationship
with Record Owner
Citizenship No. of Shares Held
Percent of Class
Common Preferred
Alliance Global Group, Inc. (AGI)1 7th/F 1880 Eastwood Avenue, Eastwood City, E. Rodriguez Jr. Avenue, Bagumbayan, Quezon City
Alliance Global Group, Inc.2
Filipino
8,479,831,663
6,000,000,000 14,479,831,663
26,8029%
18.9647% 45.7675%
Common PCD Nominee Corporation (Non-Filipino), G/F MKSE Bldg. 6767 Ayala Avenue, Makati
Participants of the PCD composed of custodian banks and brokers.3
Non-Filipino
5,752,916,7874 18.1837%
Common
New Town Land Partners, Inc. (NTLPI)5, 6/F The World Centre, Sen. Gil Puyat, Avenue, Makati
New Town Land Partners, Inc.
Filipino 5,182,179,590
16.3797%
Common PCD Nominee Corporation (Filipino) G/F MKSE Bldg. 6767 Ayala Avenue, Makati
Participants of the PCD composed of custodian banks and brokers.
Filipino 5,166,764,624 16.3310%
Common PCD Nominee Corporation (Non-Filipino), G/F MKSE Bldg. 6767 Ayala Avenue, Makati
The Hongkong and Shanghai Banking Corp. Ltd. – Clients (HSBC)6.
Non-Filipino
3,475,772,629
10.9861%
1The Chairman of the Board of AGI, Mr. Andrew L. Tan, is also Chairman of the Board and President of the Company. 2 The Board of Directors of AGI has voting and investment power over AGI’s shares of stock in the Company. AGI has authorized its Chairman, or in his absence, the Chairman of the Meeting, to vote AGI’s shares of stock in the Company. 3 Among the PCD participants, HSBC owns 3,475,772,629 shares, representing 10.9861% of the Company’s outstanding capital stock. 4 This includes HSBC’s 3,475,772,629 shares. 5 The Board of Directors of NTLPI has voting and investment power over NTLPI’s shares of stock in the Company, NTLPI has authorized the Chairman of the Board of the Company, or in his absence the Chairman of the Meeting to vote NTLPI’s shares of stock in the Company. 6 HSBC is a participant of the PCD. The beneficial owners of the shares held by HSBC are not known to the Company.

4
Other than the persons identified above, there are no other beneficial owners of more than 5% of the Company’s outstanding capital stock known to the Company. Security Ownership of Management as of 30 April 2011
Title of Class Name of Beneficial Owner
Amount and Nature of Beneficial Ownership
Citizenship Percent of Class
Directors/Nominees Common Andrew L. Tan 100,000,000 (direct) Filipino .31607776% 1,891,6321 (indirect) Filipino .00597902% 14,479,831,6632 (indirect) Filipino 45.76752857% 5,182,179,5903 (indirect) Filipino 16.37971752% Common Gerardo C. Garcia 136,136 (direct) Filipino .00043029% Common Kingson U. Sian 612,501 (direct) Filipino .00193597% Common Katherine L. Tan 1,891,632 (direct) Filipino .00597902% 100,000,0004 (indirect) Filipino .31607776% Common Miguel B. Varela 4,422 (direct) Filipino .00001397% Common Roberto S. Guevara 1 (direct) Filipino .00000001% Common Enrique Santos L. Sy
80,553 (direct) Filipino .00025461%
CEO and Five Most Highly Compensated Officers Common Andrew L. Tan Same as above Common Kingson U. Sian Same as above Common Lourdes G. Clemente 839,866 (direct) Filipino .00265462% Common Francisco C. Canuto 318,150 (direct) Filipino .00100560% Common Philipps C. Cando 0 Filipino n/a Common Ma. Victoria M.
Acosta 0 Filipino n/a
Other Executive Officers Common Monica T. Salomon 0 Filipino n/a Common Garry V. de Guzman 0 Filipino n/a Common Kimberly Hazel A.
Sta. Maria 0 Filipino n/a
Common Edwin B. Maquinto 0 Filipino n/a Common Rolando D. Siatela 0 Filipino n/a Common All directors and
executive officers as a group
103,883,2615 (direct) .3283518%
Voting Trust Holders of 5% or More The Company is not aware of the existence of persons holding more than five percent (5%) of the Company’s common shares under a voting trust or similar agreement.
Changes in Control There has been no change in the control of the Company since it was incorporated in 1989. 1 The shares are beneficially owned by Katherine L. Tan, spouse of Andrew L. Tan. 2 The shares are held by Alliance Global Group, Inc. which has authorized Andrew L. Tan, in his capacity as Chairman of the Board, or in his absence the Chairman of the Meeting, to vote AGI’s common shares in the Company. 3 The shares are held by NTLPI which has authorized the Chairman of the Board of the Company, or in his absence the Chairman of the Meeting to vote NTLPI’s shares of stock in the Company. 4 The shares are beneficially owned by Andrew L. Tan, spouse of Katherine L. Tan. 5 No director or executive officer has the right to acquire additional shares of the Company within 30 days from options, warrants, rights, conversion privileges or similar obligations or otherwise.

5
Board of Directors and Senior Management Background of Directors and Executive Officers There are seven (7) members of the Company’s Board of Directors, three (3) of whom are independent directors. All incumbent directors were elected during the annual meeting of stockholders held on 18 June 2010 and will hold office for one (1) year and/or until their successors are elected and qualified. Information concerning the background of the directors and executive officers of the Company is provided in pages 9 to 14 of the Company’s Management Report. Procedure for Nomination and Election of Independent Directors Pursuant to Article II, Section 2 of the Company’s By-Laws, the nomination and election of independent directors shall be conducted in accordance with SRC Rule 38. SRC Rule 38 provides that the nomination and election of independent directors shall be conducted in accordance with the following rules:
1. Nomination of independent directors shall be conducted by the Nomination Committee prior to a stockholders’ meeting. All recommendations shall be signed by nominating stockholders and shall bear the conformity of the nominees.
2. The Nomination Committee shall pre-screen the nominees and prepare a final list of candidates. 3. The final list of candidates shall contain the business and/or professional experience of the
nominees for independent directors, which list shall be made available to the Commission and to all stockholders through the filing and distribution of the Information Statement, in accordance with SRC Rule 20, or in such other reports the Company is required to submit to the Commission. The name of the person or group of persons who recommended the nominees for independent directors shall be identified in such report including any relationship to the nominees.
4. Only nominees whose names appear in the final list of candidates shall be eligible for election as independent directors. No other nominations shall be entertained after the final list of candidates shall have been prepared. No further nominations shall be entertained or allowed on the floor during the actual annual stockholders’ meeting.
5. The conduct of the election of independent directors shall be made in accordance with the standard election procedures of the Company in its by-laws, subject to pertinent laws, rules and regulations of the Commission.
6. It shall be the responsibility of the Chairman of the Meeting to inform all stockholders in attendance of the mandatory requirement of electing independent directors. He shall ensure those independent directors are elected during the stockholders’ meeting.
7. In case of failure of election for independent directors, the Chairman of the Meeting shall call a separate election during the same meeting to fill up the vacancy.
Nominees Directors are elected annually by the stockholders at the annual stockholders’ meeting to serve until the election and qualification of their successors. The Nomination Committee composed of Enrique Santos L. Sy as Chairman, Gerardo C. Garcia and Roberto S. Guevara as members accepts nominees to the Board of Directors, including nominees for independent director. The Committee is responsible for screening and qualifying the list of nominees. The following is the complete and final list of nominees and candidates for members of the Board of Directors:
1. Andrew L. Tan 2. Katherine L. Tan 3. Kingson U. Sian 4. Enrique Santos L. Sy

6
5. Miguel B. Varela– Independent Director 6. Gerardo C. Garcia– Independent Director 7. Roberto S. Guevara– Independent Director
Independent Directors This year’s nominees for directors include three persons who qualify as independent directors. Mr. Luke Tan nominated incumbent independent director, Mr. Miguel B. Varela, for another term, while Ms. Maria Rosario Justo nominated the other two incumbent independent directors, namely, Messrs. Gerardo C. Garcia and Roberto S. Guevara, for another term. Ms. Justo and Messrs. Tan, Varela, Garcia and Guevara are not related by consanguinity or affinity up to the fourth civil degree. Significant Employees The business of the Company is not highly dependent on the services of personnel outside of Senior Management. Family Relationships Chairman and President Andrew L. Tan is married to Director Katherine L. Tan. Involvement in Certain Legal Proceedings The Company is not aware of the occurrence during the past five (5) years up to the date hereof of any of the following events that are material to an evaluation of the ability or integrity of any director, nominee for election as director, or executive officer: 1. Any bankruptcy petition filed by or against any business of a director, nominee for election as director, or executive officer who was a general partner or executive officer either at the time of the bankruptcy or within two years prior to that time; 2. Any director, nominee for election as director, or executive officer being convicted by final judgment in a criminal proceeding, domestic or foreign, or being subject to a pending criminal proceeding, domestic or foreign, excluding traffic violations and other minor offenses; 3. Any director, nominee for election as director, or executive officer being subject to any order, judgment, or decree, not subsequently reversed, suspended or vacated, of any court of competent jurisdiction, domestic or foreign, permanently or temporarily enjoining, barring, suspending or otherwise limiting his involvement in any type of business, securities, commodities or banking activities; and 4. Any director, nominee for election as director, or executive officer being found by a domestic or foreign court of competent jurisdiction (in a civil action), the Commission or comparable foreign body, or a domestic or foreign exchange or other organized trading market or self regulatory organization, to have violated a securities or commodities law or regulation, and the judgment has not been reversed, suspended, or vacated. Related Transactions Transactions with related parties include investments in and advances granted to or obtained from subsidiaries, associates and other related parties. Other related parties include joint venture partners [See Note 9 to the Audited Financial Statements (Advances to Landowners and Joint Ventures)] and investees which investments are accounted for at cost and other entities which are owned and managed by investors/owners of the Company [See Note 10 to the Audited Financial Statements (Investments in and Advances to Associates and Other Related Parties)]. Advances granted to joint venture partners are in the nature of cash advances made to landowners under agreements covering the development of parcels of land, which are to be used for pre-development expenses such as relocation of existing occupants. Repayment of these advances shall be made upon completion of the project development

7
either in the form of the developed lots corresponding to the landowner’s share in saleable lots or in the form of cash to be derived from sales of the landowner’s share in the saleable lots and residential and condominium units. The commitment for cash advances under the agreements has been fully satisfied by the Company. Advances granted to and obtained from associates and other related parties are for purposes of working capital requirements. For more information, see Note 10 to the Audited Financial Statements. The Company avails of the marketing services of Eastwood Property and Holdings, Inc. (EPHI), a wholly-owned subsidiary of Empire East Land Holdings, Inc. (EELHI), Megaworld Newport Property Holdings, Inc. and Megaworld Land, Inc. (MLI), which acts as a manager and leasing agent for the commercial properties of the Company. (See Note 23 to the Audited Financial Statements - Related Party Transactions). As consideration for said marketing services, the Company pays commission based on contracted terms. Commission expenses charged by EPHI and MLI are based on prevailing market rates. Other than those disclosed in the Company’s Financial Statements, the Company has not entered into any other related party transactions. Resignation/Disagreement No director has resigned or declined to stand for re-election to the Board of Directors since the date of the last annual meeting of stockholders because of a disagreement with the Company on any matter relating to the Company’s operations, policies or practices. Compensation of Directors and Executive Officers Summary Compensation Table The following tables identify the Company’s Chief Executive Officer and the five most highly compensated officers and summarize their aggregate compensation in 2009 and 2010 and the estimated aggregate compensation for 2011:
Annual Compensation
Name Position Year Salary Other Variable Compensation
A. CEO and Five Most Highly Compensated Officers
2011 23,465,879.00 11,720,066.64
1. Andrew L. Tan President 2. Lourdes G. Clemente SEVP for Finance and Administration 3. Phillips C. Cando FVP for Operations 4. Kingson U. Sian SVP, Executive Director5. Francisco C. Canuto SVP, Treasurer 6. Ma. Victoria M. Acosta
Managing Director
B. All other officers and directors as a group unnamed
39,252,632.00 7,852,409.98

8
Annual Compensation
Name Position Year Salary Other Variable Compensation
A. CEO and Five Most Highly Compensated Officers
2010 20,324,632.00 10,163,494.26
1. Andrew L. Tan President 2. Lourdes G. Clemente SVP for Finance and Administration 3. Phillips C. Cando FVP for Operations4. Kingson U. Sian SVP, Executive Director 5. Francisco C. Canuto FVP, Treasurer 6. Ma. Victoria M. Acosta
Managing Director
B. All other officers and directors as a group unnamed
33,867,671.78 6,852,236.77
Annual Compensation
Name Position Year Salary Other Variable
Compensation A. CEO and Five Most Highly Compensated Officers
2009 18,100,090.00 8,841,935.80
1. Andrew L. Tan President 2. Lourdes G. Clemente SVP for Finance and Administration 3. Antonio T. Tan SVP for Operations 4. Kingson U. Sian SVP, Executive Director 5. Francisco C. Canuto FVP, Treasurer 6. Ma. Victoria M. Acosta
Managing Director
B. All other officers and directors as a group unnamed
30,104,597.14 6,118,710.51
Compensation of Directors The members of the Board receive a standard per diem for attendance in Board meetings. In 2009 and 2010, the Company paid a total of Php250,000 and Php180,000, respectively, for directors’ per diem. For 2011, the Company has allocated Php250,000 for directors’ per diem. Other than payment of the per diem, there are no arrangements pursuant to which any director of the Company was compensated, or is to be compensated, directly or indirectly, during the year ended December 31, 2010 and the ensuing year, for any service provided as a director. There are no other compensatory plans or arrangements with respect to any named executive officer. Employment Contracts and Termination of Employment and Change-in-Control Arrangement Executive officers are appointed by the Board to their respective offices. The Company does not enter into employment contracts with its executive officers. There is no compensatory plan or arrangement with respect to an executive officer which results or will result from the resignation, retirement or any other termination of such executive officer’s employment with the Company and its subsidiaries other than standard benefits provided under the Company’s retirement plan covering all regular full-time employees,

9
or from a change-in-control of the Company, or a change in an executive officer’s responsibilities following a change-in-control of the Company. Warrants and Options Outstanding There are no warrants and options granted under the Company’s executive compensation plan to the Company’s President, the named executive officers, and all officers and directors as a group. Independent Public Accountants The Board of Directors of the Company, after consultation with the Audit Committee composed of Gerardo C. Garcia as Chairman and Andrew L. Tan and Roberto S. Guevara as members, will recommend to the stockholders the engagement of Punongbayan & Araullo as external auditors of the Company for 2011. In compliance with SRC Rule 68(3)(b)(iv) and the Company’s Manual of Corporate Governance, which require that the Company’s external auditor be rotated or the signing partner changed every five (5) years or earlier, the Company’s Board of Directors approved, on 26 March 2004, the designation of a new handling partner for the audit of the financial statements of the Company starting the year ending 31 December 2004. The handling partner then designated was Mr. Gregorio S. Navarro who was one of the Audit & Assurance Partners of Punongbayan & Araullo and the Managing Partner and Chief Executive Officer of Punongbayan & Araullo at that time. Punongbayan & Araullo was also the auditor of the Company for 2008, 2009 and 2010. The new signing partner designated for the financial statements starting the year ending 31 December 2009 is Ms. Dalisay B. Duque. There are no disagreements with the auditors on any matter of accounting principles or practices, financial statement disclosure, or auditing scope or procedure, which, if not resolved to their satisfaction, would have caused the auditors to make reference thereto in their reports on the financial statements of the Company and its subsidiaries. Representatives of Punongbayan & Araullo are expected to be present at the annual meeting of stockholders. They will have the opportunity to make a statement if they desire to do so and are expected to be available to respond to appropriate questions. Financial Information Financial Statements of the Company and its subsidiaries as of 31 December 2010 and 2009 and Interim Financial Statements of the Company and its subsidiaries as of 31 March 2011, as well as the Management’s Discussion and Analysis of Results of Operations and Financial Condition for the corresponding periods, are included in the Company’s Management Report and are incorporated herein by reference.
OTHER MATTERS Action with Respect to Reports The minutes of the annual meeting of stockholders held on 18 June 2010 will be submitted to the Company’s stockholders for approval. The minutes will refer to the adoption of stockholders’ resolutions pertaining to the following matters:
1. Approval of Minutes of the Previous Annual Meeting 2. Appointment of External Auditors 3. Ratification of Acts and Resolutions of the Board of Directors, Board Committees and Management 4. Election of Directors The approval or disapproval of the Minutes will constitute merely an approval or disapproval of the correctness of the Minutes but will not constitute an approval or disapproval of the matters referred to in the Minutes.

10
Other Proposed Action The stockholders will be asked to ratify all resolutions of the Board of Directors and the Board Committees and acts of Senior Management adopted during the period covering 1 January 2010 through 31 December 2010. These include the following matters: 1. Appointment of Contract Signatories 2. Application for Permits, Licenses, Clearances and Accreditations for Projects 3. Registration of Master Deeds and Restrictions covering Projects 4. Operation of Bank Accounts and other Bank Transactions 5. Appointment of Proxies and Nominees 6. Development and Operation of Projects 7. Approval of Plans and Titling of Projects 8. Property Acquisitions, Dispositions, Leases, and Joint Ventures 9. Declaration of Cash Dividends 10. Application for Telecommunication Subscriptions Voting Procedures Vote Required In the election of directors, the seven (7) nominees garnering the highest number of votes will be elected as members of the board of directors, provided that there shall be elected at least two (2) independent directors in the Company’s board of directors. For all other matters proposed to be acted upon, the vote of a majority of the outstanding capital stock will be required for approval. Method of Counting of Votes Each holder of common share will be entitled to one (1) vote with respect to all matters to be taken up during the annual meeting of stockholders. Provided, that in the election of directors, each stockholder may vote such number of shares for as many persons as there are directors to be elected or may cumulate said shares and give one nominee as many votes as the number of directors to be elected multiplied by the number of his shares shall equal, or he may distribute them on the same principle among as many nominees as he shall see fit; provided, that the total number of votes cast by him shall not exceed the number of shares owned by him multiplied by the number of directors to be elected. There will be seven (7) persons to be elected to the Company’s board of directors, including at least two (2) independent directors. In the event that the number of nominees to the board of directors exceeds the number of board seats, voting shall be done by ballot. However, if the number of nominees to the board of directors does not exceed the number of board seats, voting will be done by a show of hands. Election inspectors duly appointed during the meeting shall be responsible for counting the number of votes, subject to validation by representatives of Punongbayan & Araullo, the Company’s external auditors. The Company shall provide, without charge, to each stockholder a copy of its annual report on SEC Form 17-A, upon written request addressed to Megaworld Corporation, Attention: Mr. Edwin B. Maquinto, Corporate Secretary, 28/F The World Centre, 330 Sen. Gil Puyat Avenue, Makati City 1227.


MANAGEMENT REPORT BUSINESS Overview Megaworld Corporation is one of the leading property developers in the Philippines and is primarily engaged in the development of large scale mixed-use planned communities, or community townships, that integrate residential, commercial, educational/training, leisure and entertainment components. Founded in 1989, the Company initially established a reputation for building high quality residential condominiums and commercial properties located in convenient urban locations with easy access to offices as well as leisure and entertainment amenities in Metro Manila. Beginning 1996, in response to demand for a lifestyle convenience of having quality residences in close proximity to office and leisure facilities, the Company began to focus on the development of mixed-use communities, primarily for the middle-income market, by commencing the development of its Eastwood City project. The Company’s real estate portfolio includes residential condominium units, subdivision lots and townhouses as well as office projects and retail space. The Company has three primary business segments: (1) real estate sales of residential and office developments, (2) leasing of office space, primarily to business process outsourcing (“BPO”) enterprises, and retail space, and (3) management of hotel operations. The Company’s consolidated revenues for the year ended December 31, 2010 were P20,541.8 million compared to P17,758.7 million for the year ended December 31, 2009. Real estate sales of residential developments accounted for 64% of the Company’s consolidated revenues in 2010 and 71% in 2009. Rental income from leasing operations accounted for approximately 13% of the Company’s consolidated revenues in 2010 and 11% in 2009. The Company’s consolidated net profit for the year ended December 31, 2010 was P5,085.5 million compared to P4,066.6 million for the year ended December 31, 2009. Foreign sales contributed approximately 4% to the Company’s consolidated sales and revenues for the years 2009 and 2010. Current Portfolio of Projects The Company’s current portfolio of projects consists of mixed-use residential and commercial developments located throughout Metro Manila. The objective of each of the mixed-use developments is to provide an integrated community with high quality “live-work-play-learn” amenities within close proximity to each other. For each development, the Company’s real estate strategy is to lease all commercial and retail properties and sell all residential units. Where the Company is unable to sell all residential units in advance of completion, it leases the unsold residential units in order to generate additional rental income with a view to eventually selling the units at a price it considers attractive. Each of the Company’s main projects is described below.

2
Eastwood City
Eastwood City is a mixed-use project on approximately 18 hectares of land in Quezon City, Metro Manila that integrates corporate, residential, education/training, leisure and entertainment components. In response to growing demand for office space with infrastructure capable of supporting IT-based operations such as high-speed telecommunications facilities, 24-hour uninterrupted power supply and computer security, the Company launched the Eastwood City Cyberpark, the Philippines’ first IT park, within Eastwood City in 1997. The Eastwood City Cyberpark includes the headquarters of IBM Philippines and Citibank’s credit card and data center operations as anchor tenants. In connection with development of the cyberpark, the Company was instrumental in working with the Philippine Government to obtain the first PEZA-designated special economic zone status for an IT park in 1999. A PEZA special economic zone designation confers certain tax incentives such as an income tax holiday of four to six years and other tax exemptions upon businesses that are located within the zone. The planning of Eastwood City adopts an integrated approach to urban planning, with an emphasis on the development of the Eastwood City Cyberpark to provide offices with the infrastructure such as high-speed telecommunications and 24-hour uninterrupted power supply to support BPO and other technology-driven businesses, and to provide education/training, restaurants, leisure and retail facilities and residences to complement Eastwood City Cyberpark.
Once the entire residential zone of Eastwood City is fully developed, it is expected to consist of 20 high-rise towers. Each tower is designed according to a specific theme and style. Typical building amenities include 24-hour security, high-speed elevators, parking, a swimming pool and other recreational facilities. Each tower contains units that range in size from studios to two-bedroom units.
The office properties at Eastwood City consist of nine office buildings. Tenants in the Eastwood City Cyberpark include major multinational corporations, largely comprised of software developers, data encoding and conversion centers, call centers, system integrations, IT and computer system support. The tenants, which include Citibank, IBM and Dell, are able to benefit from a variety of business and tax incentives in conjunction with the PEZA special economic zone status conferred upon the Eastwood City Cyberpark.
The leisure and entertainment zone consists of Eastwood Mall, Eastwood Citywalk I, a dining and entertainment hub, and Eastwood Citywalk II, an amusement center with a state-of-the-art cinema complex, a billiard and bowling center, restaurants and specialty shops. This zone also includes Fashion Square, a beauty and lifestyle center, and Home Center, a one-stop home improvement hub. Eastwood Citywalk I and II, Fashion Square and Home Center are designed to complement the office and residential buildings in the community township. Forbes Town Center
The Forbes Town Center is located on five hectares of land in Bonifacio Global City, Taguig, Metro Manila, adjacent to the Manila Golf Club, the Manila Polo Club and the prestigious Forbes Park residential subdivision. Upon completion, Forbes Town Center is expected to consist of residential, retail and entertainment properties. Once completed, the residential zone is expected to consist of 13 towers comprising the Forbeswood Heights, Bellagio, Forbeswood Parklane, and 8 Forbes Town Road condominium projects. The leisure and entertainment zone is devoted to bars, restaurants and specialty shops, which are designed to complement the residential buildings in this development as well as the surrounding office areas in Bonifacio Global City.

3
McKinley Hill The McKinley Hill is a community township located on approximately 50 hectares of land in Fort Bonifacio, Taguig, Metro Manila. McKinley Hill consists of office, residential, retail, educational, entertainment and recreational centers. The residential zone consists of a subdivision project which is comprised of lots for the development of single-detached homes, several garden villa clusters with five or six-storey villas in each cluster, and residential condominiums. The office properties will include the McKinley Hill Cyberpark which is a PEZA-designated IT special economic zone. Tenants of the office properties will largely be comprised of software developers, data encoding and conversion centers, call centers, system integrations, IT and computer system support. The leisure and entertainment zone will consist of bars, restaurants, specialty shops, cinemas and sports complex, which are expected to complement the office and residential areas in the community township. Three international schools, the Chinese International School, the Korean International School and Enderun College, a hotel management institution affiliated with Les Roches of Switzerland, will initially comprise the “learn” component of the township. McKinley Hill is likewise home to the British Embassy which relocated on a 1.2 hectare property within the development. The Korean Embassy will also transfer to a 5,822 square meter site within the project. Newport City Newport City is a community township located on 25 hectares of land at the Villamor Air Base, Pasay City, Metro Manila, across from the NAIA Terminal 3 and adjacent to the Villamor golf course. The Newport City similarly integrates the live-work-play concept of Eastwood City, with the exception that it will be targeted towards tenants and buyers who consider proximity to the NAIA Terminal 3 an advantage. The residential zone will consist of 20 eight to nine-storey medium-rise buildings. The corporate zone is expected to be comprised of office buildings. The Company will establish a PEZA special economic zone cyberpark at Newport City. Tenants for the commercial area are expected to include multinational BPO companies, cargo logistics services and airline-related business. The leisure and entertainment zone is expected to consist of bars, restaurants, retail and tourist oriented shops, which are designed to complement the office and residential buildings in the community township. Newport City is home to the Company's joint venture development, Resorts World Manila, which is a leisure and entertainment complex comprising gaming facilities, restaurants, hotels and shopping outlets. Upon full development, the hotel zone shall comprise the four hotels namely, Marriot Hotel, Maxims Hotel, Remington Hotel and Belmont Hotel. Manhattan Garden City Manhattan Garden City is a residential development project which will consist of 20 residential towers on a 5.7-hectare property at the Araneta Center in Quezon City. The Manhattan Garden City will be the Philippines’ first major transit-oriented residential community, having direct links to two light rail transport lines, the MRT-3 and the LRT- 2. The MRT-3 line runs north to south along the EDSA highway in Metro Manila while the LRT-2 line runs east to west along Aurora Boulevard

4
across Metro Manila. All key areas along the transportation lines within Metro Manila will be easily accessible from the development. The amenities of the Araneta Center such as the Gateway Mall will be available to residents of Manhattan Garden City. Cityplace The Cityplace project is a mixed-use project under development on a 2.5-hectare lot in Binondo, Metro Manila. The development is expected to have over 2,000 residential condominium units and a shopping center to be called Lucky Chinatown Mall. The development is also expected to include new parks, a public car parking facility, new bypass roads and pedestrian overpasses to make the project environment and pedestrian-friendly. Bonifacio Uptown The Company is developing Bonifacio Uptown, an approximately 15.5-hectare property in Fort Bonifacio in Taguig, Metro Manila. Bonifacio Uptown is comprised of a residential portion in the northern part of Fort Bonifacio, and a portion for mixed-use on a parcel of land owned by NAPOLCOM. The Company will develop Bonifacio Uptown under a joint venture arrangement with the BCDA. McKinley West The Company is developing McKinley West, an approximately 34.5-hectare portion of the JUSMAG property owned by BCDA and located across from McKinley Hill in Taguig, Metro Manila. The development of McKinley West into a mixed-use project is another joint venture undertaking with the BCDA. Other properties
The Company also has ongoing residential condominium projects in Makati City and San Juan in the Metro Manila area. The Company plans to develop a 54.5 hectare parcel of land in Mandurriao, Iloilo which is the site of the old Iloilo airport into a central business district in Iloilo, with BPO offices. The planned development will comprise office buildings, educational facilities, residential projects, a hotel, a convention center as well as retail and recreational areas. A portion of the development will be registered as a special economic zone with the government, which will allow it to benefit from a tax holiday period as well as other incentives for investors.
The Company also plans to develop properties in Mactan, Cebu. The property is expected to comprise offices, BPO facilities and leisure facilities Business Strategy The Company’s objective is to increase its profitability and maintain its leading position as a major property developer in the Philippines, specifically in the middle residential condominium market and the market for BPO-related office developments. SUBSIDIARIES AND ASSOCIATES The Company’s subsidiaries and associates and their ownership in these subsidiaries and associates as of 31 December 2010 are set forth below. Subsidiaries Percentage Ownership Megaworld Land, Inc. 100% Prestige Hotels & Resorts, Inc. 100% Mactan Oceanview Properties and Holdings, Inc. 100%

5
Megaworld Cayman Islands, Inc. 100% Richmonde Hotel Group International Limited 100% Eastwood Cyber One Corporation 100% Forbes Town Properties and Holdings, Inc. 100% Megaworld Newport Property Holdings, Inc. 100% Oceantown Properties, Inc. 100% Piedmont Property Ventures, Inc. 100% Stonehaven Land, Inc. 100% Streamwood Property, Inc. 100% Megaworld-Daewoo Corporation 60% Megaworld Central Properties, Inc. 51% Megaworld Resort Estates, Inc. 51% Megaworld Globus Asia, Inc. 50% Philippine International Properties, Inc. 50% Townsquare Development, Inc. 31% Associates Percentage Ownership Empire East Land Holdings, Inc. 48.38% Suntrust Home Developers, Inc. 42.48% Palm Tree Holdings & Development Corporation 40% Gilmore Property Marketing Associates, Inc. 39.83% Alliance Global Properties, Ltd. 39.44% Travellers International Hotel Group, Inc. 10%
The Company spun off certain of its business operations due to financing or statutory requirements. It has incorporated separate companies for particular projects or business operations. Set out below is a description of each subsidiary or associate company and its main activities,
Megaworld Land, Inc. provides a leasing service to the Company by locating tenants for
rental properties and coordinating relations with brokers primarily in relation to the Eastwood CyberPark.
Prestige Hotels & Resorts, Inc. owns and operates the Richmonde Hotel located in Ortigas
Center, Pasig City and Eastwood Richmonde Hotel located in Eastwood City, Bagumbayan, Quezon City.
Mactan Oceanview Properties and Holdings, Inc. was organized to develop a resort property
in Cebu.
Megaworld Cayman Islands, Inc. was incorporated in the Cayman Islands to act as a promoter and entrepreneur, carry on the business as a financier, broker, dealer, agent, and importer and to undertake investments, financial, trading and other operations. It is currently a special purpose company whose primary activity is the servicing of high yield bonds that it issued in 2006.
Richmonde Hotel Group International Ltd. was incorporated in the British Virgin Islands to
undertake various investments on behalf of the Company and engage in trading, hotel, restaurant, and related businesses.
Eastwood Cyber One Corporation was set up as a special purpose entity to own and develop
certain BPO rental properties located in Eastwood City CyberPark.
6
Forbes Town Properties and Holdings, Inc. was organized primarily to act as a principal agent or broker, on commission basis or otherwise, and to acquire by purchase or lease, construct, manage or sell real estate properties.
Megaworld Newport Property Holdings, Inc. provides a sales and marketing service for
development of the Newport City projects.
Oceantown Properties, Inc. is a company that was incorporated to own land in Mactan, Cebu.
Piedmont Property Ventures, Inc. was registered with the Securities and Exchange Commission (“SEC”) on 28 August 1996. It is a company that was acquired in 2008.
Stonehaven Land, Inc. was registered with the SEC on 21 August 1996. It is a company that
was acquired in 2008.
Streamwood Property, Inc. was registered with the Securities and Exchange Commission (“SEC”) on 21 August 1996. It is a company that was acquired in 2008.
Megaworld-Daewoo Corporation is a joint venture between the Company and Daewoo Corporation that developed three residential condominium towers in Eastwood City.
Megaworld Central Properties, Inc. was formed to provide sales services for residential units
in the Manhattan Garden City project.
Megaworld Resort Estates, Inc. (MREI) is a company that was incorporated to engage in the real estate business.
Megaworld Globus Asia, Inc. was formed to develop and sell a project known as The Salcedo
Park, a twin-tower residential condominium project located in Makati City which has been completed.
Philippine International Properties, Inc. (PIPI) is a company that was incorporated to own,
use, improve, develop, subdivide, sell, exchange, lease, and hold for investment or otherwise, real estate of all kinds, including buildings, houses, apartments and other structures.
Townsquare Development, Inc. (TDI) is a company that was incorporated to provide services
to the affiliated companies of the Company.
Empire East Land Holdings, Inc. is a PSE-listed company that is engaged in the development and marketing of affordable housing projects either in the form of condominium communities or house-and-lot packages, and to a limited extent, commercial and office space and mixed-use complexes.
Suntrust Home Developers, Inc. is a PSE-listed company which owns an interest in a company engaged in the development and marketing of affordable housing projects.
Palm Tree Holdings & Development Corporation is a company that was acquired in connection with its landholdings adjacent to the Company’s Eastwood City township. It is currently engaged in the real estate business.
Gilmore Property Marketing Associates, Inc. (GPMAI) was incorporated on September 5,
1996 primarily to act as a principal agent or owner, on commission basis or otherwise, and to acquire, lease and construct or dispose of buildings and other real estate properties.

7
Alliance Global Properties, Ltd. was incorporated in the Cayman Islands to undertake various
investments. Travellers International Hotel Group, Inc. owns a 9.0 hectare integrated resort complex in
Newport City which will consist of, among others, upscale hotels with fine dining restaurants, a performing arts theatre and a shopping mall.
MARKET PRICE INFORMATION The common shares of the Company are traded on the Philippine Stock Exchange (“PSE”) under the symbol of MEG. The Company’s common stock was first listed on the PSE on June 15, 1994. The following table sets out, for the periods indicated, the high and low sales price for the Company’s common shares as reported on the PSE: Year First Quarter Second Quarter Third Quarter Fourth Quarter 2009 High 0.79 1.26 1.64 1.74 Low 0.44 .53 .94 1.32 2010 High 1.46 1.46 2.55 2.84 Low 1.04 1.16 1.32 2.20 2011 High 2.58 Low 1.96 5/18/11 Close 2.11 HOLDERS
As of 30 April 2011, the Company had 2,905 shareholders of record worldwide. The following table sets forth the twenty largest shareholders of the Company as of April 30, 2011. Rank Name of
Stockholder Number of Common
Shares Number of
Voting Preferred Shares
Percentage of Ownership
1. Alliance Global Group, Inc.
8,479,831,663 26.8029%
6,000,000,000 18.9647% 2. PCD Nominee
Corporation (Non-Filipino)
5,752,916,787 18.1837%
3. New Town Land Partners, Inc.
5,182,179,590 16.3797%
4. PCD Nominee Corporation (Filipino)
5,166,764,6241 16.3310%
5. First Centro, Inc. 873,012,500 2.7594% 6. Richmonde Hotel
Group International Limited
420,000,000 1.3275%
1 This includes 767,685,000 shares beneficially owned by First Centro, Inc. and 65,330,263 shares beneficially owned by Gilmore Property Marketing Associates, Incorporated.

8
7. Forbes Town Properties Holdings, Inc.
143,000,000 0.4520%
8. Gilmore Property Marketing Associates, Incorporated
117,024,754 0.3699%
9. Andrew L. Tan 100,000,000 0.3161% 10. Cygnet Dev. Corp. 20,000,000 0.0632% 11. Rivercrest Realty
Corporation 10,000,000 0.0316%
Alfonso U. Lim &/or Alfie Thomas C. Lim
10,000,000 0.0316%
12. Valentin T. Khoe 9,156,360 0.0289% 13. Simon Lee Sui Hee 8,845,200 0.0280% 14. OCBC Securities
Phils., Inc. (FAO: Santiago J. Tanchan, Jr.)
7,371,000 0.0233%
15. Luisa Co Li 5,525,697 0.0175% 16. Evangeline
Abdullah 5,400,000 0.0171%
17. Jasper Karl Tanchan Ong
5,370,300 0.0170%
18. Winston Co 5,180,760 0.0164% 19. Chua Lee Keng 4,721,477 0.0149% 20. Luis Ang and/or
Teresa W. Ang 3,785,532 0.0126%
DIVIDENDS AND DIVIDEND POLICY
The payment of dividends, either in the form of cash or stock, will depend upon the Company's earnings, cash flow and financial condition, among other factors. The Company may declare dividends only out of its unrestricted retained earnings. These represent the net accumulated earnings of the Company with its capital unimpaired, which are not appropriated for any other purpose. The Company may pay dividends in cash, by the distribution of property, or by the issue of shares of stock. Dividends paid in cash are subject to the approval by the Board of Directors. Dividends paid in the form of additional shares are subject to approval by both the Board of Directors and at least two-thirds of the outstanding capital stock of the shareholders at a shareholders' meeting called for such purpose. Cash dividends amounting to P402.9 Million, P478.46 Million and P479.29 Million were declared on the Company’s common shares in 2008, 2009 and 2010, respectively. The dividends were paid in July 2008, August 2009 and July 2010, respectively. Cash dividends were declared on the Company’s Series “A” Preferred Shares in 2009 and 2010 in the amount of Php600,000 for each year. The dividends were paid in August 2009 and July 2010. The Corporation Code prohibits stock corporations from retaining surplus profits in excess of 100% of their paid-in capital stock, except when justified by definite corporate expansion projects or programs approved by the Board of Directors, or when the corporation is prohibited under any loan agreement with any financial institution or creditor from declaring dividends without its consent, and such consent has not yet been secured, or when it can be clearly shown that such retention is necessary under special circumstances obtaining in the corporation.

9
The Company declares cash dividends to shareholders of record usually in the first half of each year. These dividends are paid from unrestricted retained earnings. The Company intends to maintain an annual cash dividend payment ratio of 20% of its net income from the preceding year, subject to the requirements of applicable laws and regulations and the absence of circumstances that may restrict the payment of such dividends, such as where the Company undertakes major projects and developments. The Company’s Board of Directors may, at any time, modify its dividend payout ratio depending upon the results of operations and future projects and plans of the Company.
RECENT SALES OF UNREGISTERED OR EXEMPT SECURITIES In 2009, the Company issued unsecured corporate notes (the “Notes”) in the aggregate amount of Php1.4 billion to not more than 19 primary institutional lenders. The Notes are issued as an exempt security under Rule 9.2(2)(B) of the Implementing Rules and Regulations of the SRC. The Notes may be purchased by and transferred to eligible buyers2 only, provided that there are a maximum of 19 note holders at any given time. The Notes will mature in seven years from issue date. In 2009, the Company issued 5,127,556,725 common shares with a par value of P1.00 per share pursuant to a 1:4 stock rights offering. The exercise price was at the par value of P1.00 per share. Fifty percent (50%) of the exercise price was payable upon submission of the application for subscription while the balance of the exercise price was to be payable one year after issue date of the underlying shares of the rights. The holders had the option of pre-paying the balance of the exercise price on the 6th month after the issue date. Fractional entitlements of eligible stockholders were to segregated and sold for the benefit of the Company. In 2011, the Company issued US$200,000,000 worth of corporate notes due in 2018 with a coupon of 6.75% and a yield of 6.875%. The US dollar-denominated corporate notes were sold outside the Philippines. UBS acted as sole global coordinator and bookrunner for the issue. BOARD OF DIRECTORS AND SENIOR MANAGEMENT There are seven (7) members of the Company’s Board of Directors, three of whom are independent directors. An independent director is a person who, apart from his fees and shareholdings, is independent of management and free from any business or other relationship which could, or could reasonably be perceived to, materially interfere with his exercise of independent judgment in carrying out his responsibilities as director [SRC Rule 38]. All directors were elected during the annual meeting of stockholders held on 18 June 2010 and will hold office until their successors have been duly elected and qualified. All the incumbent directors have been nominated for election to the Board of Directors of the Company for the ensuing calendar year. Information concerning the background of the directors/nominees for directors and executive officers of the Company indicating their principal occupation or employment and their business experience for the past five (5) years is provided below. The table sets forth each member of the Company’s Board of Directors and the Company’s executive officers as of 1 April 2011. Name Age Citizenship Position Andrew L. Tan . . . . . . 61 Filipino Director, Chairman and President
2 Persons deemed Primary Institutional Lenders under Rule 9.2(2)(B) of the Implementing Rules and Regulations of the SRC, and such other persons to whom an offer, transfer, assignment or resale of the Notes would not, under law at the relevant time, cause a registration requirement of the Notes under the SRC to become applicable.

10
Katherine L. Tan. . . . . 59 Filipino Director Kingson U. Sian. . . 49 Filipino Director, SVP and Executive Director Enrique Santos L.Sy…. 61 Filipino Director Miguel B. Varela. . . . . . 71 Filipino Independent Director Gerardo C. Garcia . . . . 69 Filipino Independent Director Roberto S.Guevara . . . 59 Filipino Independent Director The table below sets forth Megaworld’s executive officers in addition to its executive directors listed above as of 1 April 2011. Name Age Citizenship Position Lourdes G. Clemente .. 47 Filipino Senior Executive Vice President for
Finance and Administration Francisco C. Canuto….. 53 Filipino Senior Vice President, Treasurer and Compliance Officer Corporate Information Officer Monica T. Salomon…. 42 Filipino First Vice President for Corporate Management Garry V. de Guzman… 43 Filipino First Vice President for Legal Affairs Philipps C. Cando...... 52 Filipino First Vice President for Operations Ma. Victoria M. Acosta 49 Filipino Managing Director for International Sales Kimberly Hazel A. Sta. Maria 30 Filipino Assistant Vice President for Corporate
Communications and Advertising Edwin B. Maquinto …. 49 Filipino Corporate Secretary Rolando D. Siatela….. 50 Filipino Assistant Corporate Secretary Andrew L. Tan Chairman of the Board/President Mr. Tan is the founder of the Company. He has served as Chairman of the Board and President of the Company since its incorporation in 1989. He has extensive experience in real estate, the food and beverage industry and quick service restaurants. He concurrently serves as the Chairman of the Board of Empire East Land Holdings, Inc., Alliance Global Group, Inc., Global-Estate Resorts, Inc. (formerly, Fil-Estate Land, Inc.), Alliance Global Brands, Inc., Suntrust Properties, Inc., Adams Properties, Inc., Travellers International Hotel Group, Inc., Consolidated Distillers of the Far East, Inc. and Emperador Distillers, Inc. Mr Tan serves in the boards of Megaworld subsidiaries, Eastwood Cyber One Corporation, Inc., Megaworld Cayman Islands, Inc., Megaworld Central Properties, Inc., Forbes Town Properties & Holdings, Inc., and Townsquare Development, Inc. He is also Chairman of the Board and President of Megaworld Newport Property Holdings, Inc., The Bar Beverage, Inc., Megaworld Land, Inc., Megaworld Globus Asia, Inc., Richmonde Hotel Group International Limited and Yorkshire Holdings, Inc. He sits in the boards of The Andresons Group, Inc. and Raffles & Co. He is also a Director and Treasurer of Andresons Global Inc. In recognition of Mr. Tan’s role in spurring economic and societal development of the City of Taguig through the investments and development projects of the Company, the City of Taguig in April 2005 conferred on him the Forward Taguig Award in the Field of Business and Entrepreneurship. In 2004, the Quezon City government named Mr. Tan ‘‘Businessman of the Year’’ in recognition of his ‘‘visionary leadership’’ in transforming Eastwood City into a ‘‘magnet for investments’’ and the 31 ‘‘most dynamic growth center in Quezon City’’.

11
Katherine L. Tan Director Ms. Tan, has served as Director since 1989. She served as Treasurer of the Company from 1989 to 1994. She is concurrently Director and Treasurer of Alliance Global Group, Inc., Chairman and President of Andresons Global, Inc. and Choice Gourmet Banquet, Inc., Director and President of The Andresons Group, Inc., Consolidated Distillers of the Far East, Inc. and Raffles & Company, Inc., and is Director and Treasurer of Alliance Global Brands, Inc., Yorkshire Holdings, Inc., New Town Land Partners, Inc., and Emperador Distillers, Inc. Kingson U. Sian Director Mr. Sian has been a director of the Company since April 13, 2007. He joined the Megaworld Group in September 1995 as Senior Vice President and is currently Executive Director of the Company. He is concurrently Director and President of Alliance Global Group, Inc., Travellers International Hotel Group, Inc. Forbes Town Properties & Holdings, Inc., Adams Properties, Inc. and Eastwood Cyber One Corporation. He is also Chairman and President of Prestige Hotels & Resorts, Inc. He is the Chief Operating Officer of Megaworld Land, Inc. Mr. Sian was formerly a Vice President of FPB Asia Ltd/First Pacific Bank in Hong Kong from 1990 to 1995. Prior to that, he was connected with Citicorp Real Estate, Inc. in the United States from 1988 to 1990. Mr. Sian graduated from the University of the Philippines with the degree of Bachelor of Science in Business Economics. He obtained his Masters Degree in Business Administration for Finance and Business Policy from the University of Chicago. Enrique Santos L. Sy Director Mr. Sy joined the Company in August 1989. He was Vice President for Corporate Communications & Advertising Division until his retirement on 31 March 2011. He is concurrently a Director of Empire East Land Holdings, Inc. He also serves on the boards of First Oceanic Property Management Inc. and Eastin Holdings, Inc. He is a Director and the Corporate Secretary of Asia Finest Cuisine, Inc. Mr. Sy previously worked as Advertising Manager of Consolidated Distillers of the Far East, Inc., Creative Director of AdCentrum Advertising, Inc., Copy Chief of Admakers, Inc. and Peace Advertising Corporation, and Creative Associate of Adformatix, Inc. Mr. Sy graduated with honors from the Ateneo de Manila University with the degree of Bachelor of Arts in Communication Arts. Miguel B. Varela Independent Director/Vice Chairman A man who wears many hats, Miguel B. Varela holds significant positions in various public and private institutions. Mr. Varela has been a member of the Company’s Board of Directors since 30 June 2006. He is presently a Director of Manila Bulletin being formerly the President, Director of Ausphil Tollways Corporation, Director, NPC Alliance Corporation, among others. He is the Chairman of the Philippine Chamber of Commerce and Industry (PCCI), Chairman of the Employers Confederation of the Philippines (ECOP), Trustee of Philippines Trade Foundation, Inc. Chairman of Pribadong Institusyon Laban sa Kahirapan (PILAK). He is also Chairman for International and Trade Affairs of the PCCI, Chairman of the Philippine Association of Voluntary Arbitration Foundation (PAVAF), and Vice Chairman of Philippine Dispute Resolution Center, Inc. (PDRCI). He is also Vice President of the International Labor Organization Foundation, Inc. and Commissioner and Corporate Secretary of the Streetwatch Commission and Foundation for Crime Prevention. He is an accredited international arbitrator of the Paris-based International Court of Arbitration. A member of the Philippine Bar, he pursued his Bachelor of Laws in the

12
Ateneo de Manila Law School and his Associate in Liberal Arts from the San Beda College. He is a member of the Philippine Bar Association, a Commissioner of the Consultative Commission on Constitutional Reform and a Lifetime Member of the Philippine Constitution Association (PHILCONSA). He is the recipient of various awards and citations such as San Beda College’s Outstanding Alumni Award for Business Leadership, and San Beda Hall of Fame Awardee. Presidential Medal of Merit for Outstanding Service to the Republic of the Philippines, Tamaraw Leadership Award, Katipunan Leadership Award and Leadership Award from ECOP, PCCI and ASEAN Productivity Organization. He was also conferred by the Central Luzon State University with the degree of Doctor of Humanities (honoris causa), with Her Excellency, then President Gloria Macapagal Arroyo presiding at the Conferment rites, and by the Eulogio “Amang” Rodriguez University of Science and Technology with a Doctorate in Business Technology (honoris causa). Gerardo C. Garcia Independent Director Mr. Garcia has served in the Company’s Board of Directors since 1994. He concurrently serves as independent director in the boards of Empire East Land Holdings, Inc., Megaworld Land, Inc. and Suntrust Properties, Inc. From October 1994 to December 1997, Mr. Garcia served as President of Empire East Land Holdings, Inc. Prior to joining Empire East Land Holdings, Inc., Mr. Garcia as Executive Vice President of UBP Capital Corporation. He holds a bachelor’s degree in Chemical Engineering and a Masters Degree in Business Administration from the University of the Philippines. Roberto S. Guevara Independent Director Mr. Guevara has been a member of the Company’s Board of Directors since June 20, 2001. He is Chairman of the Board of Directors of Seed Capital Ventures, Inc. and First Centro Corp. He serves on the board of other companies, such as G & S Transport Corporation, a licensee of Avis Car Rentals, Tin Can Mobile Solutions Corp., Guevent Industrial Development Corporation and Radiowealth Finance Corporation. Mr. Guevara graduated from San Beda College in 1974 and pursued a post graduate course at the Institute for Management Development (IMD), in Lausanne, Switzerland. Lourdes G. Clemente Senior Executive Vice President for Finance and Administration Ms. Clemente joined the Company in 1990. She is a Certified Public Accountant and holds the rank of Senior Executive Vice President. She is a member of the Company’s Management Executive Committee. Ms. Clemente graduated Cum Laude from the Far Eastern University with the degree of Bachelor of Science major in Accounting. She is the Chairman of the Company’s property management arm, First Oceanic Property Management, Inc. She is currently a director of Suntrust Properties, Inc., Forbes Town Properties & Holdings, Inc., Megaworld Resort Estates, Inc., Megaworld Homes, Inc., Oceantown Properties, Inc., Palm Tree Holdings & Development Corporation, Eastwood Cyber One Corporation and Prestige Hotels & Resorts, Inc. She is a trustee and Corporate Secretary of Megaworld Foundation, Inc. Prior to joining the Company, she was Audit Manager of Philippine Aluminum Wheels, Inc. and Senior Auditor in Cabanero Katigbak Clemente & Associates and RubberWorld Philippines. Francisco C. Canuto Senior Vice President and Treasurer Mr. Canuto joined the Company in 1995. He is a Certified Public Accountant and currently holds the rank of Senior Vice President. He is the Treasurer of the Company and Senior Assistant to the Chairman. He is a member of the Company’s Management Executive Committee. He

13
graduated from the Polytechnic University of the Philippines with the degree of Bachelor of Science in Commerce major in Accounting. Mr. Canuto has a Masters Degree in Business Administration from the Ateneo Graduate School of Business. He is concurrently a director of Eastwood Property Holdings, Inc., Oceantown Properties, Inc. and Forbes Town Properties & Holdings, Inc. He is a Director and the Corporate Secretary of Megaworld Central Properties, Inc. and Megaworld Newport Property Holdings, Inc. He is also a Director and Treasurer of Megaworld Resort Estates, Inc., Megaworld Homes, Inc., Megaworld Land, Inc., Megaworld Daewoo Corporation, Eastwood Cyber One Corporation and Prestige Hotels & Resorts, Inc. He serves as a Director and President of Megaworld Cayman Islands, Inc. and Gilmore Property Marketing Associates, Inc. He is also the President of Megaworld Foundation, Inc. Before joining the Company, he worked as Audit Manager of SGV & Company and Controller of Federal Express Corporation. In 2004, Mr. Canuto was named Outstanding Alumnus in Financial Management by the Polytechnic University of the Philippines during its centennial year. Monica T. Salomon First Vice President for Corporate Management Ms. Salomon heads the Corporate Management Department of the Company and is a member of the Company’s Management Executive Committee. She joined the Company’s Legal and Corporate Management Division in January 1997 and has served as corporate counsel to the Company and its subsidiaries since 1997. She is concurrently a director of Megaworld Land, Inc., Prestige Hotels & Resorts, Inc., Megaworld Homes, Inc., Megaworld Central Properties, Inc., Megaworld Newport Property Holdings, Inc., Forbes Town Properties & Holdings, Inc., Townsquare Development Inc., and Eastwood Property Holdings, Inc. She is the Corporate Secretary of Oceantown Properties, Inc. and a Director and Corporate Secretary of Palm Tree Holdings & Development Corporation and Megaworld Resort Estates, Inc. She is also a trustee of Megaworld Foundation, Inc. Before joining Megaworld, she worked as an Associate at the ACCRA Law Offices and was Legislative Staff Assistant to then Congressman Raul S. Roco at the House of Representatives. Ms. Salomon pursued her law studies at the University of the Philippines where she graduated in April 1994 with honors. She was admitted to the Integrated Bar of the Philippines in 1995. Garry V. de Guzman First Vice President for Legal Affairs Mr. De Guzman heads the Legal Affairs Department of the Company. He joined the Company in April 1997 as a Senior Manager of its Legal and Corporate Management Division in April 1997. Mr. De Guzman has been in continuous litigation practice for more than twelve (12) years and is in charge of the Company’s litigation, licensing, registration and titling activities. Before joining Megaworld, he was an Associate at the ACCRA Law Offices and Tax Assistant in Punongbayan and Araullo, CPAs. He obtained his Bachelor of Laws in 1994 from San Beda College where he graduated Class Salutatorian and was admitted to the Integrated Bar of the Philippines in 1995. In 1989, he obtained his bachelor’s degree in Commerce major in Accounting from the same institution graduating Magna Cum Laude and Class Valedictorian. Mr. De Guzman serves as director in Global-Estate Resorts, Inc. (formerly, Fil-Estate Land, Inc.), ERA Real Estate Exchange, Inc., Megaworld Resort Estates, Inc. and Oceanic Realty International Group, Inc. Mr. De Guzman is a member of the Commercial Law Affiliates, AsiaLaw, Philippine Institute of Certified Accountants and is Past President of the Rotary Club, Parañaque City Chapter. Philipps C. Cando First Vice President for Operations Mr. Cando is a licensed civil engineer who has over 27 years of experience in project development and construction management. Mr. Cando joined the Company in 1994 as a construction manager and eventually rose to become head of the Company's project management team. Prior to joining Megaworld, Mr. Cando was employed for over 12 years in

14
construction design and consultancy firms, Arenas-Tugade Associates and Massive Design Group. During his more than 15 years with the Company, Mr. Cando was responsible for the construction management of over thirty-three (33) project developments of the Company including residential and office condominium projects, hotel, mall and retail complexes as well as large scale mixed-use developments such as McKinley Hill and Eastwood City. He now heads the Company’s Operations and is responsible for the construction and development of large scale developments to include, Newport City, Forbes Town Center at Global City, Manhattan Garden City at Araneta Center, Cityplace at Binondo and Bonifacio Uptown. Ma. Victoria M. Acosta Managing Director for International Sales Ms. Acosta is Managing Director for International Sales and has held this position since September 1999. Prior to her appointment, she had twenty years of marketing experience in real estate and consumer products with other companies. Ms. Acosta was Executive Vice President and Chief Operating Officer of Empire East Land Holdings, Inc. from 1997 to 1998 and was Executive Director for Marketing from 1996 to 1997. Earlier, she also served as Senior Vice President and General Manager of Raffles & Co., Inc. Ms. Acosta graduated from the University of the Philippines with the degree of Bachelor of Science in Business Administration major in Marketing and Finance. Kimberly Hazel A. Sta. Maria Assistant Vice President for Corporate Communications and Advertising Ms. Sta. Maria holds the rank of Assistant Vice President and heads the Corporate Communication and Advertising Division of the Company. She joined the Company in 2002 as Head Writer and is responsible for the creative conceptualization and production of advertising and marketing campaigns and materials for the Company’s projects. Ms. Sta. Maria is a cum laude graduate of the University of the Philippines Manila and holds a bachelor’s degree in Organizational Communication. Edwin B. Maquinto Corporate Secretary Mr. Maquinto is the Corporate Secretary of the Company and has held this position since 1997. He is currently Corporate Counsel of Emperador Distillers, Inc., Anglo-Watson Glass, Inc., The Andresons Group, Inc., Consolidated Distillers of the Far East, Inc., Raffles & Company, Inc. and Andresons Global, Inc. He graduated from the University of the Philippines, with degrees in law and economics. He served as Special Assistant to the Legal and Corporate Manager of the Philippine Coconut Authority, Chief Legal Counsel of the FORZA group of companies, Legal Officer of the Office of Legal Affairs and Hearing Officer of the Garments and Textiles Export Board, both of the Department of Trade and Industry. Rolando D. Siatela Assistant Corporate Secretary Mr. Siatela serves as Assistant Corporate Secretary of the Company. He is also Assistant Vice President for Corporate Management of the Company. He concurrently serves in PSE-listed Suntrust Home Developers, Inc. as Corporate Secretary and Corporate Information Officer, and Alliance Global Group, Inc. and Global-Estate Resorts, Inc. (formerly, Fil-Estate Land, Inc.) as Assistant Corporate Secretary. He is also Corporate Secretary of Oceanic Realty Group International, Inc and ERA Real Estate Exchange, Inc. Documentation Officer of Megaworld Foundation, Inc. and Assistant Corporate Secretary and Chief Administrative Officer of The Andresons Group, Inc. He is a member of the board of Asia Finest Cuisine, Inc. Prior to joining Megaworld Corporation, he was employed as Administrative and Personnel Officer with Batarasa Consolidated, Inc.
15
EXTERNAL AUDIT FEES AND SERVICES The external auditors of the Company billed the amounts of Php1,476,200 in 2010, Php1,342,000.00 in 2009 and Php1,302,200 in 2008 in fees for professional services rendered for the audit of the Company’s annual financial statements and services that are normally provided by the external auditor in connection with statutory and regulatory filings or engagements for 2010, 2009 and 2008. In addition to the professional fees, the external auditors billed a fee of Php1,200,000 for additional services rendered for the year 2009 relative to the review of the Company’s June 2009 financial statements for the issuance of a comfort letter in connection with bonds issued by the Company. Except as disclosed above, no other services were rendered or fees billed by the external auditors of the Company for 2010, 2009 and 2008. The Board of Directors, after consultation with the Audit Committee, will recommend to the stockholders the engagement of the external auditors of the Company. The selection of external auditors is made on the basis of credibility, professional reputation, accreditation with the Philippine Securities and Exchange Commission, and affiliation with a reputable foreign partner. The professional fees of the external auditors of the Company are approved by the Company’s Audit Committee after approval by the stockholders of the engagement and prior to the commencement of each audit season. CORPORATE GOVERNANCE Compliance with Leading Practices on Corporate Governance In 2002, the Company adopted a Manual on Corporate Governance in order to institutionalize the principles of good corporate governance in the entire organization. Pursuant to the Company’s Manual on Corporate Governance, the Company’s Board of Directors created each of the following committees and appointed board members thereto. Audit Committee The Audit Committee assists the Board in the performance of its oversight responsibility for the financial reporting process, system of internal control, audit process and monitoring of compliance with applicable laws, rules and regulations, provides oversight over financial management functions and over internal and external auditors, reviews internal audit plans, reports submitted by internal and external auditors and the financial statements of the Company. The Audit Committee has three members, two of whom are independent directors. An independent director serves as the head of the committee. Compensation and Remuneration Committee The Compensation and Remuneration Committee is responsible for establishing a formal and transparent procedure for developing a policy on remuneration of the directors and officers to ensure that their compensation is consistent with the Company’s culture, strategy and the business environment in which it operates. The Compensation and Remuneration Committee consists of three members, including at least one independent director. Nomination Committee The Nomination Committee reviews and evaluates the qualifications of all persons nominated to the Board and other appointments that require Board approval. The Nomination Committee has three members, including at least one independent director.

16
In 2005, the Company engaged the services of the Institute of Corporate Directors (ICD) to facilitate a Corporate Governance Training/Seminar for its Board of Directors and executives. The Training/Seminar included a discussion on the Main Principles of Corporate Governance contained in the Organization for Economic Cooperation and Development (OECD), the Pacific Economic Cooperation Council (PECC) and the Philippine SEC Corporate Governance Code, Responsible Citizenship and Corporate Social Responsibility, Finance in the Corporate Governance Setting and Best Practices of Corporate Governance. In 2004, the Company designated a new engagement partner of Punongbayan and Araullo for the audit of its financial statements beginning the year ending December 31, 2004 in compliance with its Manual on Corporate Governance requirement that the Company rotate its external auditor or change the handling partner every five (5) years or earlier. In 2004, Ms. Dalisay B. Duque was designated as the new signing partner for the audit of the Company’s financial statements as of 31 December 2009. During the same year, the Company increased the number of independent directors in its Audit Committee, from one independent director to two (2) independent directors, and appointed an independent director to head the Audit Committee, in accordance with SEC Memorandum Circular No. 6. Evaluation System The Company has designated a Compliance Officer who is tasked with monitoring compliance with the provisions and requirements of its Manual on Corporate Governance. The Compliance Officer has established an evaluation system to measure or determine the level of compliance by the Company with its Manual. Deviations from Manual and Sanctions Imposed In 2010, the Company substantially complied with its Manual on Corporate Governance and did not materially deviate from its provisions. No sanctions were imposed on any director, officer or employee on account of non-compliance with the Company’s Manual on Corporate Governance. Plan to Improve Corporate Governance Pursuant to SEC Memorandum Circular No. 6, Series of 2009, the Company revised its Manual of Corporate Governance to make the same compliant with the Revised Code of Corporate Governance. FINANCIAL INFORMATION Financial Statements of the Company and its subsidiaries (the “Group”) as of 31 December 2009 and 2010 and Interim Financial Statements as of 31 March 2011 are attached hereto and incorporated herein by reference. Management’s Discussion and Analysis of Results of Operations and Financial Condition (Based on Financial Statements adopted in accordance with the Philippine Financial Reporting Standards) Review of 2010 versus 2009 During the year 2010 consolidated net income amounted to Php5.09 billion 25.06% higher than the previous year net income of Php4.07 billion. Consolidated total revenues composed of real

17
estate sales, rental income, hotel income, and other revenues elevated by 15.67% from Php17.76 billion to P20.54 billion resulting from strong property sales and increased leasing income. Development. Among product portfolios, the bulk of generated consolidated revenues came from the sale of condominium units and residential lots amounting to Php13.11 billion in 2010 compared to Php12.57 billion in 2009, an increase of 4.26%. The Group’s registered sales came from the following projects: Belagio, Forbeswood Park Lane 1 & 2 and Eight Forbes Town in Fort Bonifacio; Eastwood Le Grand in Eastwood City; McKinley West, McKinley Hill Tuscany, Stamford, Morgan Suites, and The Venice Luxury Residences in Taguig City; Manhattan Parkview, Manhattan Heights and El Jardine Del Presidente in Quezon City; and Newport City in Pasay; City Place in Binondo, Manila and One Central, Greenbelt Chancellor and Excelsior in Makati City. Leasing. Rental income contributed 13.12% to the consolidated revenue and amounted to Php2.70 billion compared to Php 2.00 billion reflected last year, a 34.68% increase. Contributing to the growth are the escalation and completion of additional leasing properties. Hotel Operations. The Group’s hotel operations posted an amount of Php232.76 million in 2010, an increase of 7.69%, from Php216.14 million in 2009. The increase is primarily due to the increase in the number of hotel rooms and hotel occupancy rates. In general, the increase in cost and expenses by 12.89% from Php13.69 billion in 2009 to Php15.46 billion in 2010 was due mainly to increase in recognized real estate sales, as well as marketing and selling expenses particularly commission expenses, resulting from aggressive marketing activities. Income tax expense in 2010 amounting to Php1.61 billion resulted to a 11.93% from 2009 reported amount of Php1.44 billion attributed by higher taxable income and tax effects of deductible temporary differences. Operating expenses as a percentage of consolidated total revenues were 10% for the year 2010 and 2009. During 2010, there were no seasonal aspects that had a material effect on the financial condition or financial performance of the Group. Neither were there any trends, events or uncertainties that have had or that are reasonably expected to have a material impact on net sales or revenues or income from continuing operations. The Group is not aware of events that will cause material change in the relationship between costs and revenues. There are no significant elements of income or loss that did not arise from the Group’s continuing operations. Financial Condition The Group maintains a prudent financial policy as it engages to a more competitive and challenging environment. The Group’s Statement of Financial Position reflects stable financial growth. Total resources as of December 31, 2010 Php97.03 billion compared to Php85.25 billion as of December 31, 2009, listing a 13.81% increase. Cash and cash equivalents increased by 5.54% from P20.88 billion in 2009 to P22.03 billion in 2010 due to efficient collection of receivables and financing activities. A 22.51% increase from its current and non-current trade and other receivables - Php29.75 billion as of December 31, 2010 compared to Php24.28 billion as of December 31, 2009, due to higher sales for the period. An increase in the completed portion of costs attributable to on-going projects resulted in the increase in the number of residential and condominium units for sale by 9.91% from P5.72 billion in 2009 to P6.29 billion in 2010. . Property development costs increased to 2.08% in 2010 figure of Php3.80 billion to last year-end’s amount of Php3.72 billion due to the development and construction costs of various ongoing projects

18
The company shows liquid position by having current assets amounting to Php46.81 billion in 2010 with an increase of 7.00% from December 31, 2009 balance of Php43.75 billion. On the other hand the group’s current obligations stood at Php17.41 billion which reflected a 60.39% increase year on year and this is the result of currently maturing financial commitments of the company. The group investment in available-for-sale securities increase by 112.24%, from Php2.93 billion in 2009 to Php6.21 billion in 2010 was due to market value changes of its different invested securities. Trade and other payables amounted to P4.04 billion and P3.66 billion as of December 31, 2010 and 2009, respectively. The increase of 10.25% was due to additional costs to be paid to contractors and suppliers for new projects. Current customers’ deposits as of December 31, 2010 amounted to P1.01 billion compared to P.96 billion as of December 31, 2009. The 5.51% increase was due largely to aggressive marketing and pre-sales for of various projects. The combined effect of current and non-current deferred income on real estate sales increased by 39.33% which amounted to P3.81 billion as of December 31, 2010 compared to P2.73 billion as of December 31, 2009 due mainly to an increase in unearned revenue. During 2010, the Interest-bearing loans and borrowings current and non-current amounted to Php7.44 billion representing a 10.36% decrease from previous year-end’s Php8.30 billion mainly due to principal payments. Total Equity ( including minority interest) increased by 17.42% from Php49.84 billion as of December 31, 2009 to Php58.52 billion as of December 31, 2010 due to the Group’s continuous profitability. The top five (5) key performance indicators of the Group are shown below:
Year 2010 Year 2009
Current Ratio *1 2.69:1 4.03:1 Quick Ratio *2 1.27:1 1.92:1
Debt to Equity Ratio *3 0.27:1 0.34:1 Return on Assets *4 5.18% 4.76%
Return on Equity *5 8.70% 8.26%
*1 – Current Assets / Current Liabilities *2 – Cash and Cash Equivalents / Current Liabilities *3 – Interest Bearing Loans and Borrowings and Bonds payable / Equity attributable to Parent Company *4 – Net Income / Total Assets (Computed using figures attributable only to parent Company shareholder) *5 – Net Income / Equity (Computed using figures attributable only to parent company shareholders)
With its strong financial position, the Group will continue investing in and pursuing expansion activities as it focuses on identifying new markets, maintaining established markets and tapping business opportunities. Material Changes in the Year 2010 Financial Statements (Increase/decrease of 5% or more versus December 31, 2009) Statement of Financial Position 5.54% increase on Cash and cash Equivalents Increase due to efficient collection of its receivables and financing activities

19
22.51% increase in Trade and other receivables – current and non-current Primarily due to higher sales booking 201.20% increase in Financial Assets at fair value through profit or loss Brought by changes in market value of financial assets 9.91% increase in Residential and condominium units for sale Mainly due to increase in completed portion of cost attributable to on-going projects 18.89% increase in Prepayments and other current assets – net Increase in Prepaid Expenses 100.00% decrease in Subscription Receivable Full collection of subscription receivables from stock rights offering 124.17% increase in Advances to landowners and joint ventures Primarily due additional advances made to joint venture partner 16.78% increase in Land for Future Development Due to acquisition of additional land for future development 112.24% increase in Investment in available-for-sale securities Due to changes in market value of the Company’s equity instruments. 7.94% increase in Investment in and advances to associates and other related parties -net Additional advances and increase in equity share from associates 6.71% increase in Investment in Property - net Due to increase on real properties for lease and hotel improvements 5.42% decrease in Property and equipment, net Due to depreciation for the year 2010 8.71% increase in other non-current assets Due to an increase in guarantee deposits in 2010 10.36% decrease in Interest bearing loans and borrowings Due to repayment of loans 10.25% increase in Trade and other payables Due to increase in amounts payable to the Company’s suppliers and contractors in relation to its real estate developments. 20.65% increase in Customer’s Deposit – current and non-current Due to aggressive marketing and pre-selling of various projects 36.43% increase in Reserve for Property Development - current and non-current Pertains to estimated cost to complete the development of various projects 39.33% increase in Deferred Income on Real Estate Sales - current and non-current Represents increase in unearned revenue 42.00% decrease in Income Tax Payable Due to higher prepaid tax availed for the current year 23.00% increase in Deferred Tax Liability - net Pertains to tax effects of taxable and deductible temporary differences

20
53.69% decrease in Advances from other related parties Due to reclassification of some advances accounts 27.84% increase in Retirement benefit obligation Additional accrual of retirement benefits 16.92% increase in Other Liabilities Additional increase on deferred income (Increase/decrease of 5% or more versus December 31, 2009) Income Statements 30.69% increase in Interest Income on real estate sales Due to realization of interest income from prior years’ sales that have been recognized during the year 6.15% increase in Realized Gross Profit on prior’s years Mainly due to revenue recognition on prior year sales 34.68% increase in Rental Income Due to escalation and the completion of additional leasing property 7.69% increase in Hotel Operations Due to increase in hotel occupancy rates 127.02% increase in Equity share in net earnings/(losses) of associates, interest and other income Due to increase in equity in net earnings of associates and other income 8.39% increase in Real Estate Sales Expenses Due to increase in real estate sales 33.96% increase in Deferred Gross Profit Due to increase in sales bookings 20.82% increase in Hotel Operations Expenses Due to increase in hotel bookings 18.37% increase in Operating expenses Due to aggressive marketing activities and increase in other administrative and corporate overhead expenses 7.34% decrease in Interest and other charges Due to decrease in finance costs 11.93% increase in Income Tax Expense Due to higher taxable income and tax effects of deductible temporary differences There are no other significant changes in the Group’s financial position (5% or more) and condition that will warrant a more detailed discussion. Further, there are no material events and uncertainties known to management that would have impact or change reported financial information and condition on the Group.
21
There are no known trends or demands, commitments, events or uncertainties that will result in or that are reasonably likely to result in increasing or decreasing the Group’s liquidity in any material way. The Group does not anticipate having any cash flow or liquidity problems. The Group is not in default or breach of any note, loan, lease or other indebtedness or financing arrangement requiring it to make payments. There are no material off-balance sheet transactions, arrangements, obligations (including contingent obligations), and other relationships of the Group with unconsolidated entities or other persons created during the reporting period. The Group has no unusual nature of transactions or events that affects assets, liabilities, equity, net income or cash flows. There were no seasonal aspects that had a material effect on the financial condition or results of operations of the Group. There were no material events subsequent to the end of the year that have not been reflected in the Group's Financial Statement for the December 31, 2010. There were no changes in estimates of amount reported in the current financial year or changes in estimates of amounts reported in prior financial years. There was no contingent liability reflected in the most recent annual financial statement, the same in the current year consolidated financial statement as of December 31, 2010. There are commitments, guarantees and contingent liabilities that arise in the normal course of operations of the Group which are not reflected in the accompanying interim consolidated financial statements. The management of the Group is of the opinion that losses, if any, from these items will not have any material effect on its interim consolidated financial statements. There are no material commitments for capital expenditures, events or uncertainties that have had or that are reasonable expected to have a material impact on the continuing operations of the Group. (Based on Financial Statements adopted in accordance with the Philippine Financial Reporting Standards) Review of 2009 versus 2008 During the year 2009, the consolidated net income amounted to Php 4.07 billion, 7.17% higher than the previous year’s net income of Php3.79 billion. Consolidated total revenues composed of real estate sales, rental income, hotel income, interest income, dividend income and other revenues, grew by 2.66% from Php17.30 billion to Php17.76 billion resulting from strong property sales and increase leasing income. Development. Among product groupings, the bulk of generated consolidated revenues came from the sale of residential lots and condominium units at 70.81% of total, amounting to Php 12.57 billion in 2009 compared to Php12.43 billion in 2008, an increase of 1.16%. The Group’s registered sales mostly came from the following projects: Bellagio, Forbeswood Park Lane 1 & 2 and Eight Forbes Town in Fort Bonifacio; Eastwood Le Grand in Eastwood City; McKinley Hill Tuscany, Stamford and Morgan Suites in Taguig City; Manhattan Parkview in Quezon City; and Newport City in Pasay; City Place in Binondo, Manila; and One Central, Greenbelt Chancellor and Excelsior in Makati City. Leasing. Rental income contributed 11.26% to consolidated revenues and amounted to Php2.00 billion compared to Php1.30 billion posted in the same period last year, a 53.78% increase. The growth was due to escalation and the completion of additional leasing property.

22
Hotel Operations. The Group’s hotel operations contributed Php216.14 million in 2009 from Php246.92 million in 2008 or a 12.46% decrease. In general, the growth in cost and expenses by 1.40% from Php13.50 billion of the year 2008 to Php 13.69 billion for the year 2009, was due mainly to an increase in recognized real estate sales as well as marketing and selling expenses, particularly commission expenses resulting from aggressive marketing activities as well as other administrative and corporate overhead expenses. Income tax expense increased by 51.14% from Php951.10 million in 2008 to Php1.44 billion in 2009 due to higher taxable income and tax effects of deductible temporary differences. Operating expenses as a percentage of consolidated total revenues were 10% for the year 2009 and 2008. For the year 2009, the management believes that there were no seasonal aspects that had a material effect on the financial condition or financial performance of the Group. Neither were there any trends, events or uncertainties that have had or that are reasonably expected to have a material impact on net sales or revenues or income from continuing operations. The Group is not aware of events that will cause a material change in the relationship between costs and revenues. There are no significant elements of income or loss that did not arise from the Group’s continuing operations. FINANCIAL CONDITION The Group maintains a prudent financial strategy as it faces a more competitive and challenging environment. The Group’s statement of financial position reflects stable financial growth. Total resources as of December 31, 2009 were Php 85.25 billion compared to Php64.90 billion as of December 31, 2008, registering a 31.36% increase. The Group recorded an increase of 69.37% from its own Cash and Cash Equivalents primarily due to efficient collection of its receivables and successful financing activities. To give a picture of the ease by which the Group can pay-off its currently maturing commitments, Current Assets amounted to Php43.75 billion compared to last year’s Php32.82 billion. On the other hand, current obligations posted an amount of Php10.85 billion as of December 31, 2009 compared to Php8.26 billion as of December 31, 2008. The figures reflect the consistent liquidity of the Company making sure that right amounts of money and lines of credit are available to the business at all times. This year, as a result of the issuance of stock rights, there are Subscription Receivables amounting to Php2.27 billion. Current and Non-current Trade and other receivables increased by 34.30% from Php18.08 billion to Php24.28 billion due to increased sales brought by aggressive fiscal and marketing strategies. Due to the development and construction costs of the various on-going projects of the Group, a 31.87% growth resulted from this year’s Php3.72 billion compared to last year’s Php2.82 billion in Property development costs. As a result of the fair market value gains enjoyed by the Group during the year, the Financial Assets at fair value through profit or loss significantly increased to Php41.50 million as compared to the previous year’s Php17.40 million leading to a 138.51% growth. Land for future development decreased by 29.85% from Php1.81 billion as of December 31, 2008 to Php1.27 billion as of December 31, 2009. The decrease is due to reclassification of account resulting from recognition of sales. Investment in available-for-sale securities declined by 32.73% from Php4.35 billion in December 31, 2008 to Php2.93 billion as of December 31, 2009, due to disposal of investment by a subsidiary. Investment property increased from Php7.14 billion as of December 31, 2008 to Php9.11 as of December 31, 2009. This increase of 27.53% is due to reclassification of accounts resulting from rental income recognition.

23
The Group, with a healthy financial condition, availed of additional loans from different financial institutions to support its expansion programs for the next few years and posted Php8.30 billion total Interest-bearing loans and borrowings this year as compared to Php6.26 billion last year, an increase of 32.68%. Current and non-current Customer’s deposit decreased by 7.09% resulting to a recorded amount of Php1.85 billion as of this year as compared to Php1.99 as of last year. Reserve for Property Development, on a current and noncurrent classification, recorded an aggregate amount of Php4.49 billion differentiating an increase of 17.51% from last year’s data of Php3.82 billion. Combining current and non-current other liabilities posted a total amount of Php2.36 billion as compared to Php1.78 billion providing a gap of 32.39% as a result of an increase in deferred rental income of the Group.
Total equity rose by 25.55% to Php49.84 billion as of December 31, 2009 from Php39.69 billion as of December 31, 2008 due to the Group’s continuous profitability and increase in capital stock.
The top five (5) key performance indicators of the Group are shown below:
Year 2009 Year 2008 Current Ratio *1 4.03:1 3.97:1 Quick Ratio *2 1.92:1 1.49:1 Debt to Equity Ratio *3 0.34:1 0.26:1 Return on Assets *4 4.76% 5.81% Return on Equity *5 8.26% 9.67%
*1 – Current Assets / Current Liabilities *2 – Cash and Cash Equivalents / Current Liabilities *3 – Interest Bearing Loans and Borrowings / Equity *4 – Net Income / Total Assets (Computed using figures attributable only to parent company shareholders) *5 – Net Income / Equity (Computed using figures attributable only to parent company shareholders)
With its strong financial position, the Group will continue investing in and pursuing expansion activities as it focuses on identifying new markets, maintaining established markets and tapping business opportunities. Material Changes in the year 2009 Financial Statements (Increase/decrease of 5% or more versus December 31, 2008) Financial Position 69.37% increase in Cash and Cash Equivalents Significant increase due to efficient collection of its receivable and successful financing activities 34.30% increase in Trade and other receivables – current and non-current Primarily due increase in sales booking 138.51% increase in financial assets at fair value through profit and loss. Due to changes in market value 31.87% increase in Property development cost Mainly due to the costs attributable to the development of various projects 260.55% increase in Advances to landowners and joint ventures Additional advances made to different joint venture partners

24
29.85% decrease in Land for future development Due to reclassification of accounts resulting from recognition of sales 32.73% decrease in Investment in available-for-sale securities Due to disposal of investment by a subsidiary 15.32% increase in Investments in and advances to associates and other related parties-net Additional advances/investment made to associates and other related parties 27.53% increase in Investment property – net Due to completion of certain properties held for lease 11.39% decrease in Property and equipment – net Mainly due to depreciation of existing property and equipment 32.68% increase in Interest-bearing loans and borrowings Additional long-term loans 36.20% increase in Trade and other payables Additional trade commitment for the year 7.09% decrease in Customers’ deposit – current and non-current Reclassification of account resulting from recognition of sales 17.51% increase in Reserve for Property Development - current and non-current Represents estimated cost to complete the development of various sold properties 24.49% increase in Deferred Income on Real Estate Sales - current and non-current Represents increase in unearned revenue 363.28% increase on Income tax payable Due to higher taxable net income 132.89% increase on Bonds Payable - net Due to additional issuance of bonds 25.15% decrease in Advances from other related parties Payments made during the year 43.30% increase in Deferred tax liabilities Pertains to tax effects of taxable and deductible temporary differences 11.76% increase in Retirement benefit obligation Additional accrual of retirement benefits 32.39% increase in Other current & non-current liabilities Due to increase in deferred rental income (Increase/decrease of 5% or more versus December 31, 2008) Income Statements 16.64% increase in Interest income on real estate sales Due to realization of interest income from prior years’ sales that have been recognized during the year

25
69.72% increase in Realized Gross Profit on prior’s years Mainly due to revenue recognition in prior year sales 53.78% increase in Rental Income Due to escalation and the completion of additional leasing property 12.46% decrease in Hotel Operations Due to decline on hotel bookings 50.10% decrease in Equity share in net earnings of associates, interest and other income – net Mainly due to decrease in interest and other income 11.74% increase in Deferred Gross Profit Pertaining to uncompleted portion of various sales generating projects 40.70% decrease in Interest and other charges – net Due to decrease in other charges 6.49% decrease in Hotel operations cost Primarily in proportion to decrease in hotel operations’ revenues 51.14% increase in Income Tax Expenses Due to higher taxable income and tax effects of deductible temporary differences There are no other significant changes in the Group’s financial position (5% or more) and condition that will warrant a more detailed discussion. Further, there are no material events and uncertainties known to management that would have impact or change reported financial information and condition on the Group. There are no known trends or demands, commitments, events or uncertainties that will result in or that are reasonably likely to result in increasing or decreasing the Group’s liquidity in any material way. The Group does not anticipate having any cash flow or liquidity problems. The Group is not in default or breach of any note, loan, lease or other indebtedness or financing arrangement requiring it to make payments. There are no material off-balance sheet transactions, arrangements, obligations (including contingent obligations), and other relationships of the Group with unconsolidated entities or other persons created during the reporting period. The Group has no unusual nature of transactions or events that affects assets, liabilities, equity, net income or cash flows. There were no seasonal aspects that had a material effect on the financial condition or results of operations of the Group. There were no material events subsequent to the end of the year that have not been reflected in the Group's Financial Statement as of December 31, 2009. Newly acquired associates have no material effect in financial condition and results of operations of the Group. There were no changes in estimates of amount reported in the current financial year or changes in estimates of amounts reported in prior financial years. There was no contingent liability reflected in the most recent annual financial statement, the same in the current year consolidated financial statement as of December 31, 2009. There are

26
commitments, guarantees and contingent liabilities that arise in the normal course of operations of the Group which are not reflected in the accompanying interim consolidated financial statements. The management of the Group is of the opinion that losses, if any, from these items will not have any material effect on its interim consolidated financial statements. There are no material commitments for capital expenditures, events or uncertainties that have had or that are reasonably expected to have a material impact on the continuing operations of the Group. (Based on Financial Statements adopted in accordance with the Philippine Financial Reporting Standards) Review of 2008 versus 2007 During the year 2008, the consolidated net income amounted to Php 3.79 billion, 25.1% higher than the previous year’s net income of Php3.03 billion. Consolidated total revenues composed of real estate sales, rental income, hotel income, interest income, dividend income and other revenues, grew by 18% from Php14.64 billion to Php17.30 billion resulting from strong property sales and increase leasing & hotel operations. Development. Among product groupings, the bulk of generated consolidated revenues came from the sale of residential lots and condominium units at 71.9% of total, amounting to Php 12.43 billion in 2008 compared to Php10.61 billion in 2007, an increase of 17.2%. The Group’s registered sales came from the following projects: Belagio 1, 2 & 3, Forbeswood Parklane in Fort Bonifacio; One Central Park in Eastwood City; McKinley Hill; Eastwood Le Grand in Quezon City; Cityplace Binondo in Manila, Newport City and Greenbelt Chancellor in Makati. Leasing. Rental income contributed 7.5% to the consolidated revenue and amounted to Php1.30 billion compared to Php931.88 million posted in the same period last year, a 39.6% increase. The growth was due to escalation and the completion of additional leasing property. Hotel Operations. The Group’s hotel operations contributed Php246.92 million in 2008 from Php247.68 million in 2007 or a 0.30% decrease. In general, the growth in cost and expenses by 17% from Php11.54 billion of the year 2007 to Php 13.50 billion for the year 2008, was due mainly to increase in recognized real estate sales as well as marketing and selling expenses, particularly commission expenses resulting from aggressive marketing activities as well as other administrative and corporate overhead expenses. Income tax expense increased by 79% from Php531.44 million in 2007 to Php951.10 million in 2008 due to higher taxable income and tax effects of deductible temporary differences. Operating expenses as a percentage of consolidated total revenues were pegged at 10% and 12% for the year 2008 and 2007, respectively. For the year 2008, there were no seasonal aspects that had a material effect on the financial condition or financial performance of the Group. Neither were there any trends, events or uncertainties that have had or that are reasonably expected to have a material impact on net sales or revenues or income from continuing operations. The Group is not aware of events that will cause material change in the relationship between costs and revenues. There are no significant elements of income or loss that did not arise from the Group’s continuing operations.
27
FINANCIAL CONDITION The Group maintains a prudent financial strategy as it faces a more competitive and challenging environment. The Group’s balance sheet reflects stable financial growth. Total resources as of December 31, 2008 totaled Php 64.90 billion compared to Php56.52 billion as of December 31, 2007, registering 15% increase. Cash and Cash Equivalents decreased by 9.6% from Php13.64 billion to Php 12.33 billion. Also, the Group remained liquid with Current Assets amounting to Php 32.82 billion as of December 31, 2008, up from Php28.59 billion as of December 31, 2007. Its current obligations stood at Php 8.26 billion and Php7.13 billion as of December 31, 2008 and December 31, 2007, respectively. Current and non-current trade and other receivables increased by 59% from Php11.37 billion to Php 18.08 billion due to higher sales. As of December 31, 2008, the residential and condominium units for sale increased by 12.1% from Php5.22 billion in 2007 to Php 5.85 billion as of December 31, 2008. Property development cost increased by 18.6% from Php2.38 billion in 2007 to Php 2.82 billion as of December 31, 2008 due to cost attributable to the development of various projects. Prepayments & other current and non-current assets totalled to Php757 million as of December 31, 2008 and Php857 million as of December 31, 2007, posting a 12% decrease due to amortization of prepayments. Interest-bearing loans and borrowings current and non-current amounted to Php 6.26 billion and Php2.21 billion as of December 31, 2008 and December 31, 2007 respectively, representing a 182.7% increase due to additional loans made during the year. Current and non-current customers’ deposits as of December 31, 2008 amounted to Php 1.99 billion compared to Php2.39 billion as of December 31, 2007. The 17% decrease or Php 398 million was due to reclassification of account as a result of recognition of sales. Total Equity rose by 5.5% to Php 39.69 billion as of December 31, 2008 from Php37.60 billion as of December 31, 2007 due to the Group’s continuous profitability and increase in capital stock and additional paid-in capital through public offer and issuance of stock rights. The top five (5) key performance indicators of the Group are shown below:
Year 2008 Year 2007
Current Ratio *1 3.97:1 4.01:1 Quick Ratio *2 1.49:1 1.91:1
Debt to Equity Ratio *3 0.26:1 0.17:1 Return on Assets *4 5.81% 5.32%
Return on Equity *5 9.67% 8.17%
*1 – Current Assets / Current Liabilities *2 – Cash and Cash Equivalents / Current Liabilities *3 – Interest Bearing Loans and Borrowings / Equity *4 – Net Income / Total Assets (Computed using figures attributable only to parent company shareholders) *5 – Net Income / Equity (Computed using figures attributable only to parent company shareholders)
With its strong financial position, the Group will continue investing in and pursuing expansion activities as it focuses on identifying new markets, maintaining established markets and tapping business opportunities. Certain accounts in financial statements for the year ended December 31, 2007 have been reclassified to conform to the presentation and classification of financial statements for the year ended December 31, 2008.

28
Material Changes in the year 2008 Financial Statements (Increase/decrease of 5% or more versus December 31, 2007) Balance Sheet 9.6% decrease in Cash and Cash Equivalents Largely due to capital expenditure and operating activities for business expansion 59.1 % increase in Trade and other receivables – current and non-current Primarily due to higher sales 98.4% decrease in financial assets at fair value through profit and loss. Disposal of investment by a subsidiary 12.1% increase in Residential and condominium units for sale Primarily due to increase in completed portion of cost attributable to various on-going projects 18.6% increase in Property development cost Mainly due to cost attributable to the development of various projects 11.6% decrease in Prepayments and other current and non-current assets Due to amortization of prepayments 97.8% increase in Advances to landowners and joint ventures Additional advances made to joint venture partners 17.7% decrease in Land for future development Reclassification of account due to the start of project development 19.2% increase in Investments in and advances to associates and other related parties-net Additional advances/investment made to associates and other related parties 30.2% increase in Investment property – net Due to completion of certain properties held for lease 14.10% decrease in Property and equipment – net Reclassification of account and depreciation of existing property and equipment 182.7% increase in Interest-bearing loans and borrowings Additional long-term loans 16.6% decrease in Customers’ deposit – current and non-current Reclassification of account resulting from recognition of sales 47.4% increase in Reserve for Property Development - current and non-current Represents estimated cost to complete the development of various sold properties 65.8% increase in Deferred Income on Real Estate Sales - current and non-current Represents increase in unearned revenue 45.5% increase in Advances from other related parties Due to increase in advances arising from its related party transaction

29
10.7% decrease in Bonds payable - net Primarily due to bond acquisition by a subsidiary which was eliminated in consolidated financial statements. 27.4% increase in Deferred tax liabilities Pertains to tax effects of taxable and deductible temporary differences 46.4% increase in Retirement benefit obligation Additional accrual of retirement benefits 20.7% increase in Other current & non-current liabilities Additional non-trade payables (Increase/decrease of 5% or more versus December 31, 2007) Income Statements 17.2% increase in Real Estate Sales Principally due to higher sales bookings, sales of new projects and additional sales 60.1% increase in Interest income on real estate sales Due to continuous increase on recognized real estate sales 59.3% increase in Realized Gross Profit on prior’s years Mainly due to revenue recognition in prior year sales 39.6% increase in Rental Income Due to escalation and the completion of additional leasing property 11.7% increase in Costs of Real Estate Sales Primarily in proportion to increase in real estate sales 51.5% increase in Deferred Gross Profit Pertaining to uncompleted portion of various sales generating projects 20.1% increase in Interest and other charges Largely due to the accrual and payment of interest expense on long-term borrowings 79% increase in Income Tax Expenses Due to higher taxable income and tax effects of deductible temporary differences There are no other significant changes in the Group’s financial position (5% or more) and condition that will warrant a more detailed discussion. Further, there are no material events and uncertainties known to management that would have impact or change reported financial information and condition on the Group. There are no known trends or demands, commitments, events or uncertainties that will result in or that are reasonably likely to result in increasing or decreasing the Group’s liquidity in any material way. The Group does not anticipate having any cash flow or liquidity problems. The Group is not in default or breach of any note, loan, lease or other indebtedness or financing arrangement requiring it to make payments. There are no material off-balance sheet transactions, arrangements, obligations (including contingent obligations), and other relationships of the Group with unconsolidated entities or other persons created during the reporting period.

30
There are no material commitments for capital expenditures, events or uncertainties that have had or that are reasonably expected to have a material impact on the continuing operations of the Group. There were no seasonal aspects that had a material effect on the financial condition or results of operations of the Group. Review of March 31, 2011 versus March 31, 2010 Please refer to the Interim Financial Statements as of 31 March 2011 attached hereto and incorporated herein by reference. CHANGES IN AND DISAGREEMENTS WITH ACCOUNTANTS ON ACCOUNTING AND FINANCIAL DISCLOSURE In compliance with SEC Memorandum Circular No. 8, Series of 2003, which was subsequently incorporated in SRC Rule 68, paragraph 3(b)(iv), and the Company’s Manual of Corporate Governance, which require that the Company’s external auditor be rotated or the signing partner changed every five (5) years or earlier, the Company’s Board of Directors approved, on 26 March 2004, the designation of a new handling partner for the audit of the financial statements of the Company starting the year ending 31 December 2004. The handling partner then designated was Mr. Gregorio S. Navarro who was one of the Audit & Assurance Partners of Punongbayan & Araullo and the Managing Partner and Chief Executive Officer of Punongbayan & Araullo at that time. Punongbayan & Araullo was also the auditor of the Company for 2008, 2009 and 2010. The new signing partner designated for the financial statements starting the year ending 31 December 2009 is Ms. Dalisay B. Duque. There are no disagreements with the auditors on any matter of accounting principles or practices, financial statement disclosure, or auditing scope or procedure, which, if not resolved to their satisfaction, would have caused the auditors to make reference thereto in their reports on the financial statements of the Company and its subsidiaries. The Company shall provide, without charge, to each stockholder a copy of its annual report on SEC Form 17-A, upon written request addressed to Megaworld Corporation, Attention: Mr. Edwin B. Maquinto, Corporate Secretary, 28/F The World Centre, 330 Sen. Gil Puyat Avenue, Makati City 1227.


Notes 2010 2009 2008
A S S E T S
CURRENT ASSETS
Cash and cash equivalents 5 22,031,584,943 P 20,876,005,473 P 12,325,333,064 P
Trade and other receivables - net 6 14,133,801,384 10,749,643,934 11,420,125,379
Subscriptions receivable 24 - 2,272,642,649 -
Financial assets at fair value through profit or loss 7 125,000,000 41,500,000 17,400,000
Residential and condominium units for sale 3 6,286,477,215 5,719,854,891 5,847,104,417
Property development costs 3 3,798,108,537 3,720,702,927 2,821,399,894
Prepayments and other current assets - net 437,227,590 367,756,457 390,067,827
Total Current Assets 46,812,199,669 43,748,106,331 32,821,430,581
NON-CURRENT ASSETS
Trade and other receivables 6 15,617,214,463 13,534,302,355 6,661,850,041
Advances to landowners and joint ventures 9 2,708,026,497 1,208,026,496 335,048,101
Land for future development 2 1,482,561,015 1,269,561,000 1,809,743,589
Investments in available-for-sale securities 8 6,211,184,496 2,926,531,713 4,350,224,672
Investments in and advances to associates and other
related parties 10 13,671,332,490 12,665,714,849 10,982,670,783
Investment property - net 11 9,716,530,045 9,105,785,069 7,140,319,564
Property and equipment - net 12 360,518,201 381,176,983 430,180,785
Deferred tax assets - net 22 7,860,539 7,887,713 2,418,273
Other non-current assets 13 442,095,396 406,679,936 367,389,073
Total Non-current Assets 50,217,323,142 41,505,666,114 32,079,844,881
TOTAL ASSETS 97,029,522,811 P 85,253,772,445 P 64,901,275,462 P
MEGAWORLD CORPORATION AND SUBSIDIARIES
CONSOLIDATED STATEMENTS OF FINANCIAL POSITION
DECEMBER 31, 2010, 2009 AND 2008
(Amounts in Philippine Pesos)

Notes 2010 2009 2008
LIABILITIES AND EQUITY
CURRENT LIABILITIES
Interest-bearing loans and borrowings 14 1,311,354,897 P 850,744,029 P 348,831,327 P
Bonds payable 15 3,416,062,159 - -
Trade and other payables 16 4,037,713,348 3,662,373,258 2,689,022,672
Customers' deposits 2 1,013,053,489 960,106,021 1,024,881,409
Income tax payable 29,061,975 50,108,777 10,816,032
Reserve for property development 2 3,640,068,354 2,468,349,023 2,078,799,883
Deferred income on real estate sales 2 2,220,540,650 1,515,687,720 1,180,849,892
Other current liabilities 17 1,741,665,060 1,347,443,261 931,751,599
Total Current Liabilities 17,409,519,932 10,854,812,089 8,264,952,814
NON-CURRENT LIABILITIES
Interest-bearing loans and borrowings 14 6,128,583,476 7,449,057,858 5,906,746,354
Bonds payable 15 5,000,000,000 8,608,407,826 3,696,290,569
Customers' deposits 2 1,222,422,709 892,800,498 969,510,257
Reserve for property development 2 2,487,557,735 2,023,028,273 1,743,300,891
Deferred income on real estate sales 2 1,588,240,851 1,217,863,024 1,014,902,786
Deferred tax liabilities - net 22 3,249,030,654 2,641,563,555 1,843,353,761
Advances from other related parties 23 289,868,257 625,936,481 836,258,246
Retirement benefit obligation 21 116,039,185 90,767,520 81,219,560
Other non-current liabilities 17 1,019,123,375 1,013,818,761 851,789,377
Total Non-current Liabilities 21,100,866,242 24,563,243,796 16,943,371,801
Total Liabilities 38,510,386,174 35,418,055,885 25,208,324,615
EQUITY 24
Total equity attributable to
parent company's shareholders 57,776,023,630 49,111,847,183 38,980,292,755
Non-controlling interest 743,113,007 723,869,377 712,658,092
Total Equity 58,519,136,637 49,835,716,560 39,692,950,847
TOTAL LIABILITIES AND EQUITY 97,029,522,811 P 85,253,772,445 P 64,901,275,462 P
See Notes to Consolidated Financial Statements.
-2-

Notes 2010 2009 2008
REVENUES
Real estate sales 6 13,110,567,020 P 12,574,801,962 P 12,430,321,088 P
Interest income on real estate sales 6 933,424,160 714,213,230 612,320,924
Realized gross profit on prior years' sales 2 1,355,982,007 1,277,434,472 752,681,262
Rental income 11 2,694,310,554 2,000,477,427 1,300,910,039
Hotel operations 2 232,757,023 216,143,646 246,919,573
Equity in net earnings of associates,
interest and other income - net 19 2,214,742,331 975,587,944 1,954,942,770
20,541,783,095 17,758,658,681 17,298,095,656
COSTS AND EXPENSES
Real estate sales 2 8,606,699,164 7,940,756,662 8,082,125,043
Deferred gross profit 2 2,431,379,388 1,815,065,914 1,624,410,655
Operating expenses 18 2,140,225,634 1,808,120,886 1,744,978,492
Interest and other charges - net 20 544,401,114 587,544,169 990,784,498
Hotel operations 2 124,463,666 103,017,443 110,169,420
Tax expense 22 1,609,101,525 1,437,541,131 951,101,304
15,456,270,491 13,692,046,205 13,503,569,412
NET PROFIT FOR THE YEAR 5,085,512,604 P 4,066,612,476 P 3,794,526,244 P
Net profit attributable to:
Parent company's shareholders 5,026,180,575 P 4,055,401,191 P 3,771,127,007 P
Non-controlling interest 59,332,029 11,211,285 23,399,237
5,085,512,604 P 4,066,612,476 P 3,794,526,244 P
Earnings per Share
Basic and Diluted 25 0.200 P 0.176 P 0.187 P
MEGAWORLD CORPORATION AND SUBSIDIARIES
CONSOLIDATED STATEMENTS OF INCOME
FOR THE YEARS ENDED DECEMBER 31, 2010, 2009 AND 2008
(Amounts in Philippine Pesos)
See Notes to Consolidated Financial Statements.

Notes 2010 2009 2008
NET PROFIT FOR THE YEAR 5,085,512,604 P 4,066,612,476 P 3,794,526,244 P
OTHER COMPREHENSIVE INCOME (LOSS)
Net unrealized gains (losses) on
available-for-sale (AFS) financial assets 8 4,031,843,227 1,211,879,519 1,250,778,389 )(
Reversal of unrealized losses on AFS financial
assets of a deconsolidated subsidiary 63,656,553 - -
Reclassification adjustments for gains (losses)
of disposed AFS financial assets
included in profit or loss 8 473,319,584 )( 276,543,393 51,926,367 )(
Share in other comprehensive income
of associates 71,176,649 - -
3,693,356,845 1,488,422,912 1,302,704,756 )(
Translation adjustments 186,558,030 )( 86,806,621 )( 410,292,926
Less related tax 22, 2.4 55,967,408 26,041,986 11,728,077 )(
130,590,622 )( 60,764,635 )( 398,564,849
3,562,766,223 1,427,658,277 904,139,907 )(
TOTAL COMPREHENSIVE INCOME
FOR THE YEAR 8,648,278,827 P 5,494,270,753 P 2,890,386,337 P
Total comprehensive income attributable to:
Parent company's shareholders 8,588,946,798 P 5,483,059,468 P 2,866,987,100 P
Non-controlling interest 59,332,029 11,211,285 23,399,237
8,648,278,827 P 5,494,270,753 P 2,890,386,337 P
MEGAWORLD CORPORATION AND SUBSIDIARIES
CONSOLIDATED STATEMENTS OF COMPREHENSIVE INCOME
FOR THE YEARS ENDED DECEMBER 31, 2010, 2009 AND 2008
(Amounts in Philippine Pesos)
See Notes to Consolidated Financial Statements.

Notes 2010 2009 2008
CAPITAL STOCK 24
Balance at beginning of year 25,829,203,626 P 20,701,646,901 P 20,701,646,901 P
Additional issuance during the year - 5,127,556,725 -
Balance at end of year 25,829,203,626 25,829,203,626 20,701,646,901
ADDITIONAL PAID-IN CAPITAL 24 8,432,990,413 8,432,990,413 8,432,990,413
TREASURY STOCK - at cost 24
Balance at beginning of year 1,188,836,744 )( 1,188,836,744 )( 871,543,094 )(
Reduction representing the shares
held by a deconsolidated subsidiary 555,115,114 - -
Additions during the year - - 317,293,650 )(
Balance at end of year 633,721,630 )( 1,188,836,744 )( 1,188,836,744 )(
NET UNREALIZED GAINS (LOSSES) ON
AVAILABLE-FOR-SALE FINANCIAL ASSETS 8
Balance at beginning of year 116,256,567 1,372,166,345 )( 69,461,589 )(
Other comprehensive income (loss) for the year 3,693,356,845 1,488,422,912 1,302,704,756 )(
Balance at end of year 3,809,613,412 116,256,567 1,372,166,345 )(
ACCUMULATED TRANSLATION
ADJUSTMENTS 2.4
Balance at beginning of year 121,744,648 )( 60,980,013 )( 459,544,862 )(
Other comprehensive income (loss) for the year, net of tax 130,590,622 )( 60,764,635 )( 398,564,849
Balance at end of year 252,335,270 )( 121,744,648 )( 60,980,013 )(
RETAINED EARNINGS
Balance at beginning of year 16,043,977,969 12,467,638,543 9,098,865,349
Net profit attributable to parent company's shareholders 5,026,180,575 4,055,401,191 3,771,127,007
Cash dividends 24 479,885,465 )( 479,061,765 )( 402,353,813 )(
Balance at end of year 20,590,273,079 16,043,977,969 12,467,638,543
Total Equity Attributable to
Parent Company's Shareholders 57,776,023,630 49,111,847,183 38,980,292,755
NON-CONTROLLING INTEREST
Balance at beginning of year 723,869,377 712,658,092 772,956,023
Deductions 40,088,399 )( - 83,697,168 )(
Net profit attributable to non-controlling interest 59,332,029 11,211,285 23,399,237
Balance at end of year 743,113,007 723,869,377 712,658,092
TOTAL EQUITY 58,519,136,637 P 49,835,716,560 P 39,692,950,847 P
MEGAWORLD CORPORATION AND SUBSIDIARIES
CONSOLIDATED STATEMENTS OF CHANGES IN EQUITY
FOR THE YEARS ENDED DECEMBER 31, 2010, 2009 AND 2008
(Amounts in Philippine Pesos)
See Notes to Consolidated Financial Statements.

Notes 2010 2009 2008
CASH FLOWS FROM OPERATING ACTIVITIES
Profit before tax 6,694,614,129 P 5,504,153,607 P 4,745,627,548 P
Adjustments for:
Interest income 19 835,944,617 )( 690,238,144 )( 1,486,040,236 )(
Finance costs 20 516,440,321 556,326,705 766,416,111
Depreciation and amortization 18 443,203,639 365,795,590 238,834,323
Equity in net earnings of associates 10, 19 442,281,307 )( 157,958,213 )( 109,464,838 )(
Fair value losses (gains) - net 19, 20 83,500,000 )( 24,100,000 )( 42,653,717
Dividend income 19 40,630,134 )( 44,247,127 )( 48,880,085 )(
Operating profit before working capital changes 6,251,902,031 5,509,732,418 4,149,146,540
Increase in trade and other receivables 5,467,069,558 )( 6,201,387,858 )( 5,394,041,435 )(
Decrease (increase) in residential and
condominium units for sale 412,044,886 127,249,526 37,609,566 )(
Decrease (increase) in property development costs 77,405,610 )( 112,428,459 557,922,101
Decrease (increase) in prepayments and other current assets 69,471,133 )( 22,311,370 104,566,830
Increase in advances to landowners and
joint ventures 1,500,000,001 )( 872,978,395 )( 165,664,462 )(
Increase (decrease) in trade and other payables 204,094,188 854,376,714 222,761,682 )(
Increase (decrease) in customers' deposits 382,569,679 141,485,147 )( 397,825,551 )(
Increase in deferred income on real estate sales 1,075,230,757 537,798,066 871,380,840
Increase in reserve for property development 1,636,248,793 669,276,522 1,228,583,888
Increase in other liabilities 424,798,078 415,691,663 283,434,290
Cash generated from operations 3,272,942,110 1,033,013,338 977,131,793
Cash paid for income taxes 946,782,440 )( 559,614,717 )( 568,856,191 )(
Net Cash From Operating Activities 2,326,159,670 473,398,621 408,275,602
CASH FLOWS FROM INVESTING ACTIVITIES
Additions to:
Investment property 11 991,266,588 )( 2,261,263,607 )( 1,759,545,786 )(
Land for future development 213,000,015 )( - 204,162,180 )(
Property and equipment 12 62,373,098 )( 33,162,257 )( 64,209,436 )(
Interest received 835,944,617 689,655,133 1,228,937,506
Net decrease (increase) in other non-current assets 221,527,843 )( 17,607,943 19,963,210 )(
Net decrease (increase) in available-for-sale securities 472,360,615 2,912,115,871 1,237,996,955 )(
Net increase in investments in and advances
to associates and other related parties 408,034,396 )( 238,527,057 )( 2,631,219,346 )(
Dividends received 19 40,630,134 44,247,127 48,880,085
Payments made for the subscribed common stock of an associate 10 - 1,583,687,182 )( 1,967,194,514 )(
Proceeds from disposals of property and equipment - - 341,384
Proceeds from sale of investments in subsidiaries and associate - - 1,205,107,503
Net decrease in financial assets at fair value through profit or loss - - 1,016,639,571
Payments made for the acquisitions of new subsidiaries - - 140,725,295 )(
Net Cash Used in Investing Activities 547,266,574 )( 453,014,029 )( 4,525,110,673 )(
CASH FLOWS FROM FINANCING ACTIVITIES
Proceeds from exercise of stock rights 24 2,272,642,649 2,854,914,076 -
Interest paid 1,323,861,629 )( 896,733,166 )( 519,186,181 )(
Payments of long-term liabilities 1,052,209,181 )( 348,831,328 )( 457,345,854 )(
Cash dividends paid 24 519,885,465 )( 479,061,765 )( 402,353,813 )(
Proceeds from long-term liabilities 14 - 7,400,000,000 4,500,000,000
Acquisition of treasury stock 24 - - 317,293,650 )(
Net Cash From (Used in) Financing Activities 623,313,626 )( 8,530,287,817 2,803,820,502
NET INCREASE (DECREASE) IN CASH
AND CASH EQUIVALENTS 1,155,579,470 8,550,672,409 1,313,014,569 )(
CASH AND CASH EQUIVALENTS
AT BEGINNING OF YEAR 20,876,005,473 12,325,333,064 13,638,347,633
CASH AND CASH EQUIVALENTS
AT END OF YEAR 22,031,584,943 P 20,876,005,473 P 12,325,333,064 P
Supplemental Information on Non-cash Investing and Financing Activities
MEGAWORLD CORPORATION AND SUBSIDIARIES
CONSOLIDATED STATEMENTS OF CASH FLOWS
FOR THE YEARS ENDED DECEMBER 31, 2010, 2009 AND 2008
(Amounts in Philippine Pesos)
See Notes to Consolidated Financial Statements.
In the normal course of business, the Group enters into non-cash transactions such as exchanges or purchases on account of real estate and other assets. Other non-cash transactions include transfers of property from Land for Future Development to Property Development Costs or Investment Property as the property goes through its various stages of development. These non-cash activities are not reflected in the consolidated statements of cash flows (see Notes 9 and 11) .

MEGAWORLD CORPORATION AND SUBSIDIARIES NOTES TO CONSOLIDATED FINANCIAL STATEMENTS
DECEMBER 31, 2010, 2009 AND 2008 (Amounts in Philippine Pesos)
1. CORPORATE INFORMATION Megaworld Corporation (the Company or parent company) was incorporated in the
Philippines on August 24, 1989, primarily to engage in the development of large scale mixed-use planned communities or townships that integrate residential, commercial, leisure and entertainment components. The Company is presently engaged in property-related activities, such as, project design, construction and property management. The Company’s real estate portfolio includes residential condominium units, subdivision lots and townhouses, as well as office projects and retail space.
All of the Company’s common shares of stock are listed at the Philippine Stock
Exchange (PSE).
The registered office of the Company, which is also its principal place of business, is located at the 28th Floor, The World Centre Building, Sen. Gil Puyat Avenue, Makati City.
Alliance Global Group, Inc. (AGI), also a publicly listed company in the Philippines, is the Group’s ultimate parent company. AGI is a holding company and also presently engaged in the food and beverage business, real estate and quick service restaurant. AGI’s registered office, which is also its primary place of business, is located at the 1880 Eastwood Avenue, Eastwood City CyberPark, 188 E. Rodriguez Jr. Avenue, Quezon City.
The Company holds interests in the following subsidiaries and associates: Explanatory Percentage of Ownership
Subsidiaries/Associates Notes 2010 2009 2008
Subsidiaries:
Megaworld Land, Inc. (MLI) 100% 100% 100%
Prestige Hotels and Resorts, Inc. (PHRI) (a) 100% 100% 100%
Mactan Oceanview Properties
and Holdings, Inc. (MOPHI) 100% 100% 100%
Megaworld Cayman Islands, Inc. (MCII) 100% 100% 100%
Richmonde Hotel Group International (RHGI) 100% 100% 100%
Eastwood Cyber One Corporation (ECOC) 100% 100% 100%
Forbes Town Properties and Holdings, Inc. (FTPHI) 100% 100% 100%
Megaworld Newport Property
Holdings, Inc. (MNPHI) 100% 100% 100%
Oceantown Properties, Inc. (OPI) 100% 100% 100%
Piedmont Property Ventures, Inc. (PPVI) (b) 100% 100% 100%
Stonehaven Land, Inc. (SLI) (b) 100% 100% 100%
Streamwood Property, Inc. (SPI) (b) 100% 100% 100%
Megaworld-Daewoo Corporation (MDC) 60% 60% 60%
Megaworld Central Properties, Inc. (MCPI) 51% 51% 51%
Megaworld Resort Estates, Inc. (MREI) (c) 51% 51% 51%
Megaworld Globus Asia, Inc. (MGAI) 50% 50% 50%
Philippine International Properties, Inc. (PIPI) (d) 50% 50% 50%
Townsquare Development, Inc. (TDI) (e) 31% 31% 31%
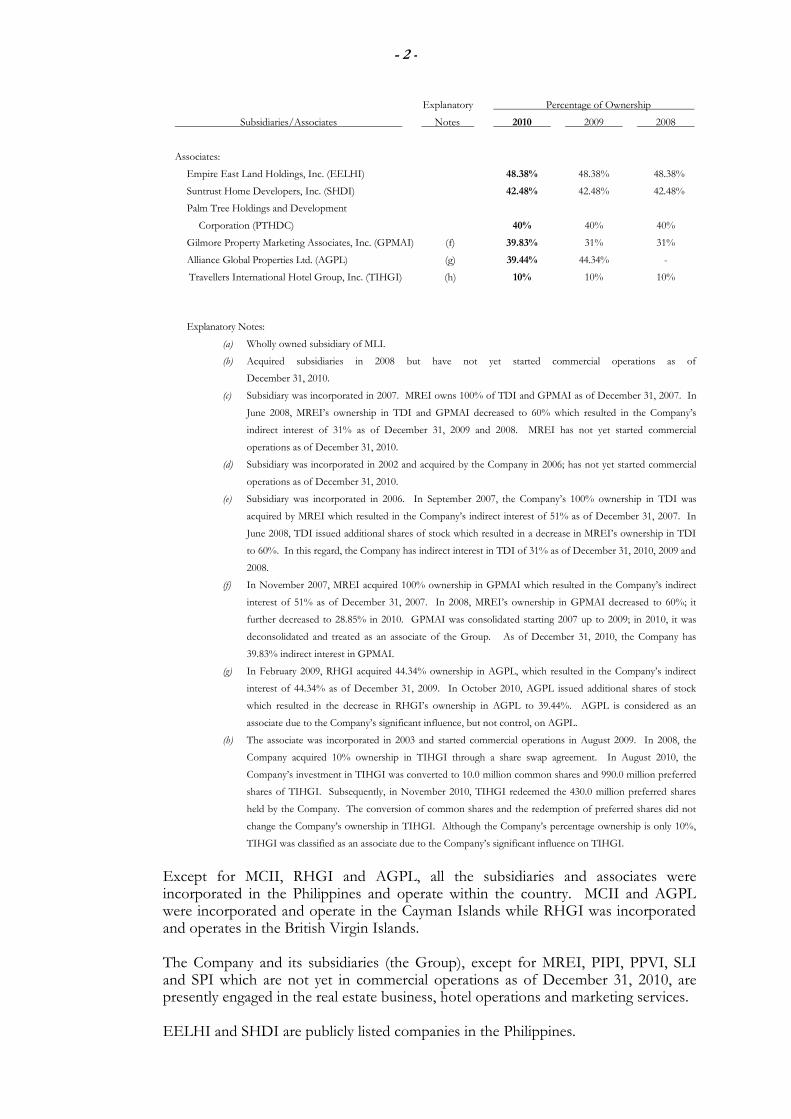
- 2 -
Explanatory Percentage of Ownership
Subsidiaries/Associates Notes 2010 2009 2008
Associates:
Empire East Land Holdings, Inc. (EELHI) 48.38% 48.38% 48.38%
Suntrust Home Developers, Inc. (SHDI) 42.48% 42.48% 42.48%
Palm Tree Holdings and Development
Corporation (PTHDC) 40% 40% 40%
Gilmore Property Marketing Associates, Inc. (GPMAI) (f) 39.83% 31% 31%
Alliance Global Properties Ltd. (AGPL) (g) 39.44% 44.34% -
Travellers International Hotel Group, Inc. (TIHGI) (h) 10% 10% 10%
Explanatory Notes:
(a) Wholly owned subsidiary of MLI.
(b) Acquired subsidiaries in 2008 but have not yet started commercial operations as of
December 31, 2010. (c) Subsidiary was incorporated in 2007. MREI owns 100% of TDI and GPMAI as of December 31, 2007. In
June 2008, MREI’s ownership in TDI and GPMAI decreased to 60% which resulted in the Company’s
indirect interest of 31% as of December 31, 2009 and 2008. MREI has not yet started commercial
operations as of December 31, 2010. (d) Subsidiary was incorporated in 2002 and acquired by the Company in 2006; has not yet started commercial
operations as of December 31, 2010.
(e) Subsidiary was incorporated in 2006. In September 2007, the Company’s 100% ownership in TDI was
acquired by MREI which resulted in the Company’s indirect interest of 51% as of December 31, 2007. In
June 2008, TDI issued additional shares of stock which resulted in a decrease in MREI’s ownership in TDI
to 60%. In this regard, the Company has indirect interest in TDI of 31% as of December 31, 2010, 2009 and
2008.
(f) In November 2007, MREI acquired 100% ownership in GPMAI which resulted in the Company’s indirect
interest of 51% as of December 31, 2007. In 2008, MREI’s ownership in GPMAI decreased to 60%; it
further decreased to 28.85% in 2010. GPMAI was consolidated starting 2007 up to 2009; in 2010, it was
deconsolidated and treated as an associate of the Group. As of December 31, 2010, the Company has
39.83% indirect interest in GPMAI. (g) In February 2009, RHGI acquired 44.34% ownership in AGPL, which resulted in the Company’s indirect
interest of 44.34% as of December 31, 2009. In October 2010, AGPL issued additional shares of stock
which resulted in the decrease in RHGI’s ownership in AGPL to 39.44%. AGPL is considered as an
associate due to the Company’s significant influence, but not control, on AGPL.
(h) The associate was incorporated in 2003 and started commercial operations in August 2009. In 2008, the
Company acquired 10% ownership in TIHGI through a share swap agreement. In August 2010, the
Company’s investment in TIHGI was converted to 10.0 million common shares and 990.0 million preferred
shares of TIHGI. Subsequently, in November 2010, TIHGI redeemed the 430.0 million preferred shares
held by the Company. The conversion of common shares and the redemption of preferred shares did not
change the Company’s ownership in TIHGI. Although the Company’s percentage ownership is only 10%,
TIHGI was classified as an associate due to the Company’s significant influence on TIHGI.
Except for MCII, RHGI and AGPL, all the subsidiaries and associates were incorporated in the Philippines and operate within the country. MCII and AGPL were incorporated and operate in the Cayman Islands while RHGI was incorporated and operates in the British Virgin Islands.
The Company and its subsidiaries (the Group), except for MREI, PIPI, PPVI, SLI
and SPI which are not yet in commercial operations as of December 31, 2010, are presently engaged in the real estate business, hotel operations and marketing services.
EELHI and SHDI are publicly listed companies in the Philippines.

- 3 -
The consolidated financial statements of the Group for the year ended December 31, 2010 (including the comparatives for the years ended December 31, 2009 and 2008) were authorized for issue by the Company’s Board of Directors (BOD) on March 15, 2011.
2. SUMMARY OF SIGNIFICANT ACCOUNTING POLICIES
The significant accounting policies that have been used in the preparation of these consolidated financial statements are summarized below. The policies have been consistently applied to all the years presented, unless otherwise stated. 2.1 Basis of Preparation of Consolidated Financial Statements
(a) Statement of Compliance with Philippine Financial Reporting Standards
The consolidated financial statements of the Group have been prepared in accordance with Philippine Financial Reporting Standards (PFRS). PFRS are adopted by the Financial Reporting Standards Council (FRSC), from the pronouncements issued by the International Accounting Standards Board. The consolidated financial statements have been prepared using the measurement basis specified by PFRS for each type of asset, liability, income and expense. The measurement bases are more fully described in the accounting policies that follow.
(b) Presentation of Consolidated Financial Statements
The consolidated financial statements are presented in accordance with Philippine Accounting Standard (PAS 1) (Revised 2007), Presentation of Financial Statements. The Group presents all items of income and expense in two statements: a consolidated statement of income and a consolidated statement of comprehensive income. Two comparative periods are presented for the consolidated statement of financial position when the Group applies an accounting policy retrospectively or makes a retrospective restatement of items in its consolidated financial statements, or reclassifies items in the consolidated financial statements. The Group has opted to present two comparative periods for the consolidated statement of financial position even when it is not required to do so.
(c) Functional and Presentation Currency
These consolidated financial statements are presented in Philippine pesos, the Company’s presentation and functional currency, and all values represent absolute amounts except when otherwise indicated. Items included in the consolidated financial statements of the Group are measured using the Company’s functional currency. Functional currency is the currency of the primary economic environment in which an entity operates.
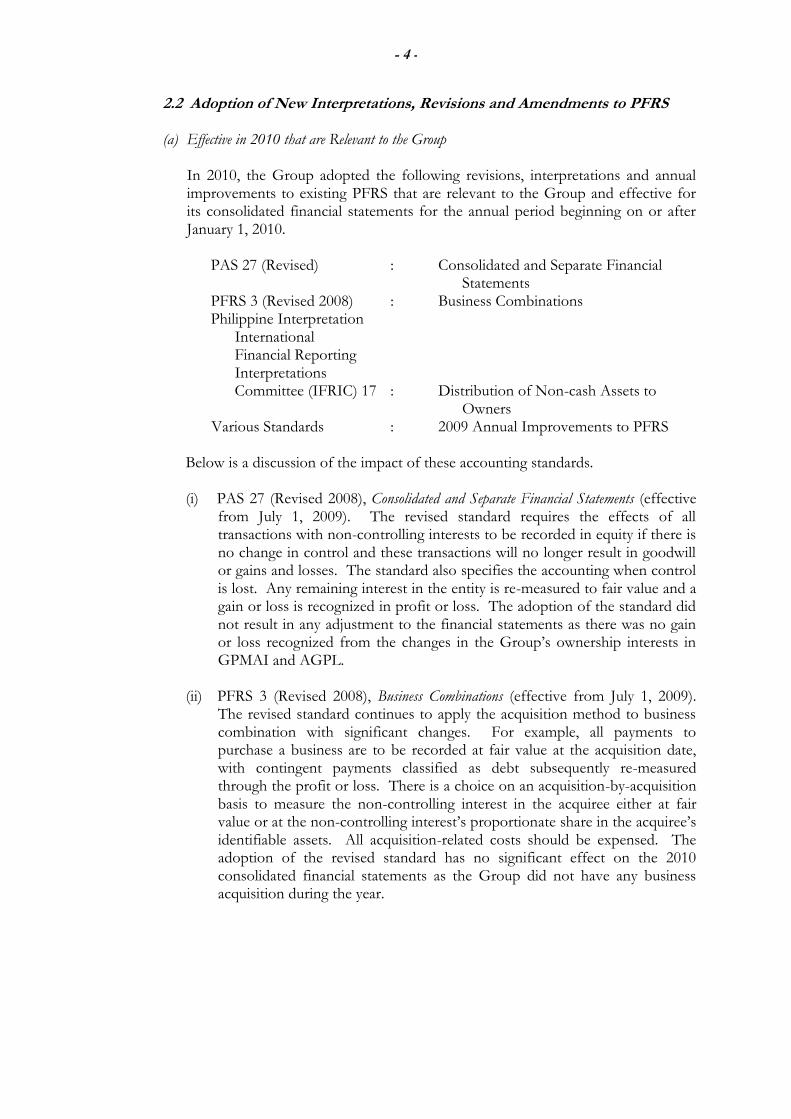
- 4 -
2.2 Adoption of New Interpretations, Revisions and Amendments to PFRS
(a) Effective in 2010 that are Relevant to the Group
In 2010, the Group adopted the following revisions, interpretations and annual improvements to existing PFRS that are relevant to the Group and effective for its consolidated financial statements for the annual period beginning on or after January 1, 2010.
PAS 27 (Revised) : Consolidated and Separate Financial
Statements PFRS 3 (Revised 2008) : Business Combinations Philippine Interpretation International Financial Reporting Interpretations Committee (IFRIC) 17 : Distribution of Non-cash Assets to
Owners Various Standards : 2009 Annual Improvements to PFRS
Below is a discussion of the impact of these accounting standards. (i) PAS 27 (Revised 2008), Consolidated and Separate Financial Statements (effective
from July 1, 2009). The revised standard requires the effects of all transactions with non-controlling interests to be recorded in equity if there is no change in control and these transactions will no longer result in goodwill or gains and losses. The standard also specifies the accounting when control is lost. Any remaining interest in the entity is re-measured to fair value and a gain or loss is recognized in profit or loss. The adoption of the standard did not result in any adjustment to the financial statements as there was no gain or loss recognized from the changes in the Group’s ownership interests in GPMAI and AGPL.
(ii) PFRS 3 (Revised 2008), Business Combinations (effective from July 1, 2009). The revised standard continues to apply the acquisition method to business combination with significant changes. For example, all payments to purchase a business are to be recorded at fair value at the acquisition date, with contingent payments classified as debt subsequently re-measured through the profit or loss. There is a choice on an acquisition-by-acquisition basis to measure the non-controlling interest in the acquiree either at fair value or at the non-controlling interest’s proportionate share in the acquiree’s identifiable assets. All acquisition-related costs should be expensed. The adoption of the revised standard has no significant effect on the 2010 consolidated financial statements as the Group did not have any business acquisition during the year.

- 5 -
(iii) Philippine Interpretation IFRIC 17, Distribution of Non-cash Assets to Owners
(effective from July 1, 2009). IFRIC 17 clarifies that dividend payable should be recognized when the dividend is appropriately authorized and is no longer at the discretion of the entity. Also, an entity should measure the dividend payable at the fair value of the net assets to be distributed and the difference between the dividend paid and the carrying amount of the net assets distributed should be recognized in profit or loss. The Group’s adoption of this interpretation did not have a material impact on the financial statements because the Group did not distribute non-cash assets to stockholders during the year.
(iv) 2009 Annual Improvements to PFRS. The FRSC has adopted the
Improvements to PFRS 2009. Most of these amendments became effective for annual periods beginning on or after July 1, 2009, or January 1, 2010. Among those improvements, only the following amendments were identified to be relevant to the Group’s consolidated financial statements but which did not also have any material impact on its consolidated financial statements:
PAS 1 (Amendment), Presentation of Financial Statements (effective from January 1, 2010). The amendment clarifies the current and non-current classification of a liability that can, at the option of the counterparty, be settled by the issue of the entity’s equity instruments.
PAS 7 (Amendment), Statement of Cash Flows (effective from January 1, 2010). The amendment clarifies that only an expenditure that results in a recognized asset can be classified as a cash flow from investing activities. Under its current policies, only recognized assets are classified by the Group as cash flows from investing activities.
PAS 17 (Amendment), Leases (effective from January 1, 2010). The amendment clarifies that when a lease includes both land and building elements, an entity assesses the classification of each element as finance or an operating lease separately in accordance with the general guidance on lease classification set out in PAS 17. The Group currently has no lease agreements that include both land and building.
PAS 18 (Amendment), Revenue (effective from January 1, 2010). The amendment provides guidance on determining whether an entity is acting as a principal or as an agent. Presently, the Group is the principal in all of its business undertakings.
PAS 36 (Amendment), Impairment of Assets (effective from January 1, 2010). PAS 36 clarifies that the largest unit permitted for the purpose of allocating goodwill to cash-generating units for goodwill impairment is the operating segment level defined in PFRS 8 before aggregation.
PAS 38 (Amendment), Intangible Assets (effective from July 1, 2009). The amendment clarifies the description of valuation techniques commonly used by entities when measuring the fair value of intangible assets acquired in a business combination that are not traded in active markets.

- 6 -
PFRS 8 (Amendment), Operating Segments (effective from January 1, 2010). It clarifies that a measure of segment assets should be disclosed only if the amount is regularly provided to the chief operating decision maker (CODM). The Company reports total assets for each of its reportable segments as they are regularly provided to the CODM, hence, does not have any significant effect on the Company’s segment reporting.
(b) Effective in 2010 that are not Relevant to the Group
The following amendment and interpretations to published standards are mandatory for accounting periods beginning on or after January 1, 2010 but are not relevant to the Group’s consolidated financial statements:
PAS 39 (Amendment) : Financial Instruments: Recognition and
Measurement – Eligible Hedged Items PFRS 1 (Amendment) : Additional Exemptions for First-time
Adopters PFRS 2 (Amendment) : Group Cash-settled Shared-based
Payment Transactions Philippine Interpretations IFRIC 9 : Embedded Derivatives – Amendments
to IFRIC 9 and PAS 39 IFRIC 18 : Transfers of Assets from Customers
(c) Effective Subsequent to 2010
There are new PFRS and revisions, amendments, annual improvements and interpretations to existing standards that are effective for periods subsequent to 2010. Management has initially determined the following pronouncements, which the Group will apply in accordance with their transitional provisions, to be relevant to its consolidated financial statements: (i) PAS 12 (Amendment), Income Taxes (effective from January 1, 2012). An
entity is required to measure the deferred tax relating to an asset depending on whether the entity expects to recover the carrying amount of the asset through use or sale. However, when the asset is measured using the fair value model in PAS 40, Investment Property, it can be difficult and subjective to assess whether recovery will be through use or through sale; accordingly, an amendment to PAS 12 was made. As a practical solution to the problem, the amendment introduces a presumption that recovery of the carrying amount will be or normally be through sale. Consequently, Standing Interpretations Committee (SIC) - 21 Income Taxes – Recovery of Revalued Non-Depreciable Assets would no longer apply to investment properties carried at fair value. The amendments also incorporate into PAS 12 the remaining guidance previously contained in SIC-21, which is accordingly withdrawn.

- 7 -
Since the amendment is related to the issuance of PFRS 9 in 2009, management is still evaluating the effect of this amendment to the Company’s financial statements in conjunction with its adoption of PFRS 9 in 2013 (see PFRS 9 below).
(ii) PAS 24 (Revised), Related Party Disclosures (effective from January 1, 2011). Earlier application of the standard, in whole or in part, is permitted but the Group opted not to early adopt the standard. The revised standard clarifies and simplifies the definition of a related party and removes the requirement for government-related entities to disclose details of all transactions with the government and other government-related entities. The Group is currently reviewing the impact of the standard on its related party disclosures in time for its adoption of the revised standard in 2011.
(iii) PAS 32 (Amendment), Financial Instruments: Presentation – Classification of Rights Issues (effective from February 1, 2010). The amendment addresses the accounting for rights issues (rights, options or warrants) that are denominated in a currency other than the functional currency of the issuer. In particular, when the amendment is applied, rights (and similar derivatives) to acquire a fixed number of an entity’s own equity instruments for a fixed price stated in a currency other than the entity’s functional currency, would be equity instruments, provided the entity offers the rights pro rata to all of its existing owners of the same class of its own non-derivative equity instruments. The adoption of this amendment is not expected to have a significant effect on the Group’s financial statements as it does not frequently issue rights that are denominated in currency other than its functional currency.
(iv) Philippine Interpretation IFRIC 14, Prepayments of a Minimum Funding Requirement – Amendment to IFRIC 14 (effective from January 1, 2011). This interpretation addresses unintended consequences that can arise from the previous requirements when an entity prepays future contributions into a defined benefit pension plan. It sets out guidance on when an entity recognizes an asset in relation to a PAS 19, Employee Benefits, surplus for defined benefit plans that are subject to a minimum funding requirement. Management does not expect that its future adoption of the amendment will have a material effect on its consolidated financial statements because it does not usually make substantial advance contributions to its retirement fund.
(v) Philippine Interpretation IFRIC 15, Agreements for Construction of Real Estate,
(effective from January 1, 2012). This interpretation provides guidance on how to determine whether an agreement for the construction of real estate is within the scope of PAS 11, Construction Contracts, or PAS 18, Revenue, and accordingly, when revenue from the construction should be recognized. The main expected change in practice is a shift from recognizing revenue using the percentage-of-completion method (i.e., as a construction progresses, by reference to the stage of completion of the development) to recognizing revenue at a single time (i.e., at completion upon or after delivery). The Group will adopt this interpretation in 2012 and is currently evaluating the impact of such adoption in the consolidated financial statements.

- 8 -
(vi) Philippine Interpretation IFRIC 19, Extinguishing Financial Liabilities with Equity
Instruments (effective from July 1, 2010). It addresses accounting by an entity when the terms of a financial liability are renegotiated and result in the entity issuing equity instruments to a creditor to extinguish all or part of the financial liability. These transactions are sometimes referred to as “debt for equity” exchanges or swaps. The interpretation requires the debtor to account for a financial liability which is extinguished by equity instruments as follows:
the issue of equity instruments to a creditor to extinguish all or part of a financial liability is consideration paid in accordance with PAS 39, Financial Instruments: Recognition and Measurement;
the entity measures the equity instruments issued at fair value, unless this cannot be reliably measured;
if the fair value of the equity instruments cannot be reliably measured, then the fair value of the financial liability extinguished is used; and,
the difference between the carrying amount of the financial liability extinguished and the consideration paid is recognized in profit or loss.
Management has determined that the adoption of the interpretation will not have a material effect on its consolidated financial statements as management does not anticipate to extinguish financial liabilities through equity swap in the subsequent periods.
(vii) PFRS 7 (Amendment), Financial Instruments: Disclosures (effective for annual periods beginning on or after July 1, 2011). The amendments will allow users of financial statements to improve their understanding of transfer transactions of financial assets (e.g., securitizations), including understanding the possible effects of any risks that may remain with the entity that transferred the assets. The amendments also require additional disclosures if a disproportionate amount of transfer transactions are undertaken at the end of a reporting period. The Group believes that adoption of the amendments in 2012 will not have any significant effect on its consolidated financial statements as they only affect disclosures and the Group usually provides adequate information in its financial statements in compliance with disclosure requirements.
(viii) PFRS 9, Financial Instruments (effective from January 1, 2013). PAS 39 will be
replaced by PFRS 9 in its entirety which is being issued in phases. The main phases are (with a separate project dealing with derecognition):
Phase 1: Classification and Measurement
Phase 2: Impairment Methodology
Phase 3: Hedge Accounting To date, the chapters dealing with recognition, classification, measurement and derecognition of financial assets and liabilities have been issued. These chapters are effective for annual periods beginning January 1, 2013. Other chapters dealing with impairment methodology and hedge accounting are still being finalized.

- 9 -
Management is yet to assess the impact that this amendment is likely to have on the consolidated financial statements of the Group. However, it does not expect to implement the amendments until all chapters of PFRS 9 have been published at which time the Group expects it can comprehensively assess the impact of the revised standard.
(ix) 2010 Annual Improvements to PFRS. The FRSC has adopted the Improvements to PFRS 2010 (the 2010 Improvements). Most of these amendments became effective for annual periods beginning on or after July 1, 2010, or January 1, 2011. The 2010 Improvements amend certain provisions of PFRS 3 (Revised 2008), clarify presentation of the reconciliation of each of the components of other comprehensive income and clarify certain disclosure requirements for financial instruments. The Group’s preliminary assessments indicate that the 2010 Improvements will not have a material impact on its consolidated financial statements.
2.3 Basis of Consolidation The Company obtains and exercises control through voting rights. The Group’s consolidated financial statements comprise the accounts of the Company and its subsidiaries as enumerated in Note 1, after the elimination of material intercompany transactions. All intercompany balances and transactions with subsidiaries, including income, expenses, and dividends and unrealized profits and losses from intercompany transactions that are recognized in assets are also eliminated in full. Unrealized profits and losses from intercompany transactions that are recognized in assets are also eliminated in full. In addition, shares of stock of the Company held by the subsidiaries are recognized as treasury stock and these are presented as deduction in the consolidated statement of changes in equity. Any changes in the market values of such shares as recognized separately by the subsidiaries are likewise eliminated in full. Intercompany losses that indicate impairment are recognized in the consolidated financial statements.
The financial statements of subsidiaries are prepared for the same reporting period as the Company, using consistent accounting policies. Adjustments are made to bring into line any dissimilar accounting policies that may exist. The Company accounts for its investments in subsidiaries, associates, interests in jointly controlled operations and non-controlling interest (previously called “minority interest”) as follows: (a) Investments in Subsidiaries
Subsidiaries are all entities over which the Company has the power to control the financial and operating policies generally accompanying a shareholding of more than one half of the voting rights. The existence and effect of potential voting rights that are currently exercisable or convertible are considered when assessing whether the Company controls another entity. Subsidiaries are consolidated from the date the Company obtains control, direct or indirect, until such time that such control ceases.

- 10 -
The acquisition method is applied to account for acquired subsidiaries. This requires recognizing and measuring the identifiable assets acquired, the liabilities assumed and any non-controlling interest in the acquiree. The consideration transferred for the acquisition of a subsidiary is the fair values of the assets transferred, the liabilities incurred and the equity interests issued by the Company, if any. The consideration transferred also includes the fair value of any asset or liability resulting from a contingent consideration arrangement. Acquisition-related costs are expensed as incurred and subsequent change in the fair value of contingent consideration is recognized directly in profit or loss. Identifiable assets acquired and liabilities and contingent liabilities assumed in a business combination are measured initially at their fair values at the acquisition date. On an acquisition-by-acquisition basis, the Group recognizes any non-controlling interest in the acquiree either at fair value or at the non-controlling interest’s proportionate share of the acquiree’s net assets. The excess of the consideration transferred, the amount of any non-controlling interest in the acquiree and the acquisition-date fair value of any previous equity interest in the acquiree over the fair value of the group’s share of the identifiable net assets acquired is recognized as goodwill (see also Note 2.10). If this is less than the fair value of the net assets of the subsidiary acquired in the case of a bargain purchase, the difference is recognized directly in profit or loss as gain.
(b) Investments in Associates
Associates are those entities over which the Company is able to exert significant influence but not control and are neither subsidiaries nor interests in a joint venture. Investments in associates are initially recognized at cost and subsequently accounted for in the consolidated financial statements using the equity method. Acquired investments in associates are also subject to purchase accounting. However, any goodwill or fair value adjustment attributable to the share in the associate is included in the amount recognized as Investment in Associates. All subsequent changes to the share of interest in the equity of the associate are recognized in the Group’s carrying amount of the investment. Changes resulting from the profit or loss generated by the associate are shown as part of Equity in Net Earnings of Associates, Interest and Other Income - net in the Group’s consolidated statement of income and, therefore, affect the net results of the Group. Changes resulting from other comprehensive income of the associates or items recognized directly in the associates’ equity are recognized in other comprehensive income or equity of the Group, as applicable. When the Group’s share of losses in an associate equals or exceeds its interest in the associate, including any other unsecured receivables, the Group does not recognize further losses, unless it has commitments, has incurred obligations or made payments on behalf of the associate.

- 11 -
Unrealized gains on transactions between the Group and its associates are eliminated to the extent of the Group’s interest in the associates. Unrealized losses are also eliminated unless the transaction provides evidence of an impairment of the assets transferred. Accounting policies of associates have been changed where necessary to ensure consistency with the policies adopted by the Group.
(c) Interests in Jointly Controlled Operations
For interests in jointly controlled operations, the Group recognized in its consolidated financial statements the assets that it controls, the liabilities and the expenses that it incurs and its share in the income from the sale of goods or services by the joint venture. The amounts of these related accounts are presented as part of the regular asset and liability accounts and income and expense accounts of the Group.
No adjustment or other consolidation procedures are required for the assets, liabilities, income and expenses of the joint venture that are recognized in the separate financial statements of the venturers.
(d) Transactions with Non-controlling Interest
The Group applies a policy of treating transactions with non-controlling interest as transactions with equity owners of the Group. Any difference between any consideration paid and the relevant share acquired of the carrying value of the net assets of the subsidiary is recognized in equity. Disposals of equity investments to non-controlling interests result in gains and losses that are also recognized in equity. When the Company ceases to have control over a subsidiary, any retained interest in the entity is remeasured to its fair value, with the change in carrying amount recognized in profit or loss. The fair value is the initial carrying amount for the purposes of subsequently accounting for the retained interest as an associate, joint venture or financial asset. In addition, any amounts previously recognized in other comprehensive income in respect of that entity are accounted for as if the Company had directly disposed of the related assets or liabilities. This may mean that amounts previously recognized in other comprehensive income are reclassified to profit or loss. Upon adoption in 2010 of PAS 27 (Revised 2008), Consolidated and Separate Financial Statements, the Group has changed its accounting policy for transactions with non-controlling interests and the accounting for loss of control or significant influence. It has applied the new policy prospectively as required by the standards beginning January 1, 2010. As a result, no adjustments were necessary to any of the amounts previously recognized and reported in the consolidated financial statements. Before the adoption of the revised PAS 27, transactions with non-controlling interests were treated as transactions with parties external to the Group. As such, disposals resulted in gains or losses in profit or loss and purchases resulted in the recognition of goodwill. On disposal or partial disposal, a proportionate interest in reserves attributable to the subsidiary was reclassified to profit or loss or directly to retained earnings.

- 12 -
Also previously, when the Group ceased to have control or significant influence over an entity, the carrying amount of the investment at the date control or significant influence was lost became its cost for the purposes of subsequently accounting for the retained interests as associates, jointly controlled entity or financial assets.
2.4 Foreign Currency Transactions
(a) Functional and Presentation Currency
Except for MCII, RHGI and AGPL, which use the U.S. dollars as their functional currency, the accounting records of the Group are maintained in Philippine pesos. Items included in the consolidated financial statements of the Group are measured using the currency of the primary economic environment in which the Company operates (the functional currency). The consolidated financial statements are presented in Philippine pesos, which is the Company’s functional and presentation currency.
(b) Transactions and Balances
Foreign currency transactions during the year are translated into the functional currency at exchange rates which approximate those prevailing on transaction dates. Foreign currency gains and losses resulting from the settlement of such transactions and from the translation at year-end exchange rates of monetary assets and liabilities denominated in foreign currencies are recognized under Interest and Other Charges – net in the consolidated statement of income.
(c) Translation of Financial Statements of Foreign Subsidiaries and an Associate
The operating results and financial position of MCII and RHGI, which are measured using the U.S. dollars, their functional currency, are translated to Philippine pesos, the Company’s functional currency, as follows:
(i) Assets and liabilities for each statement of financial position presented are
translated at the closing rate at the reporting date;
(ii) Income and expenses for each profit or loss account are translated at the annual average exchange rates (unless this average is not a reasonable approximation of the cumulative effect of the rates prevailing on the transaction dates, in which case income and expenses are translated at the dates of the transactions); and,
(iii) All resulting exchange differences are recognized as a separate component of
equity. On consolidation, exchange differences arising from the translation of the net investment in MCII and RHGI are recognized as Translation Adjustments in the consolidated statement of comprehensive income. As these entities are wholly owned subsidiaries, the translation adjustments are fully allocated to the parent company’s shareholders.
Goodwill arising on the acquisition of a foreign entity is treated as an asset of the foreign entity and translated at the closing rate.

- 13 -
The translation of the financial statements into Philippine pesos should not be construed as a representation that the U.S. dollar amounts could be converted into Philippine peso amounts at the translation rates or at any other rates of exchange.
The Company’s equity in net earnings or loss of AGPL, which is also measured in U.S. dollars, is translated to Philippine pesos using the annual average exchange rates.
2.5 Financial Assets Financial assets are recognized when the Group becomes a party to the contractual terms of the financial instruments. Financial assets other than those designated and effective as hedging instruments are classified into the following categories: financial assets at fair value through profit or loss (FVTPL), loans and receivables, held-to-maturity investments and available-for-sale (AFS) financial assets. Financial assets are assigned to the different categories by management on initial recognition, depending on the purpose for which the investments were acquired. Regular purchases and sales of financial assets are recognized on their trade date. All financial assets that are not classified as at fair value through profit or loss are initially recognized at fair value plus any directly attributable transaction costs. Financial assets carried at fair value through profit or loss are initially recorded at fair value and transaction costs related to it are recognized in profit or loss. The Group’s financial instruments are currently lodged in the following classifications: (a) Financial Assets at FVTPL
This category includes financial assets that are either classified as held for trading or that meet certain conditions and are designated by the entity to be carried at fair value through profit or loss upon initial recognition. All derivatives fall into this category, except for those designated and effective as hedging instruments. Assets in this category are classified as current assets if they are either held for trading or are expected to be realized within 12 months from the end of the reporting period.
Financial assets at FVTPL are measured at fair value, and changes therein are recognized in profit or loss. Financial assets (except derivatives and financial instruments originally designated as financial assets at FVTPL) may be reclassified out of FVTPL category if they are no longer held for the purpose of being sold or repurchased in the near term.
(b) Loans and Receivables
Loans and receivables are non-derivative financial assets with fixed or determinable payments that are not quoted in an active market. They arise when the Group provides money, goods or services directly to a debtor with no intention of trading the receivables. These are included in current assets, except for maturities greater than 12 months after the reporting period which are classified as non-current assets.

- 14 -
Loans and receivables are subsequently measured at amortized cost using the
effective interest method, less impairment losses. Any change in their value is recognized in profit or loss. Impairment loss is provided when there is objective evidence that the Group will not be able to collect all amounts due to it in accordance with the original terms of the receivables. The amount of the impairment loss is determined as the difference between the assets’ carrying amount and the present value of estimated cash flows.
Loans and receivables are presented as Cash and Cash Equivalents, Trade and Other Receivables, and Advances to Associates and Other Related Parties in the consolidated statement of financial position. Cash and cash equivalents are defined as cash on hand, demand deposits and short-term, highly liquid investments readily convertible to known amounts of cash and which are subject to insignificant risk of changes in value. Trade receivables, which generally have one-year to five-year terms, are noninterest-bearing instruments recognized initially at fair value and subsequently stated at amortized cost using the effective interest method, less accumulated impairment losses, if any. An impairment loss is provided when there is objective evidence that the Group will not be able to collect all amounts due according to the original terms of receivables. Significant financial difficulties of the debtor, probability that the debtor will enter bankruptcy or financial reorganization, and default or delinquency in payments are considered indicators that the trade receivable is impaired.
(c) AFS Financial Assets
This includes non-derivative financial assets that are either designated to this category or do not qualify for inclusion in any of the other categories of financial assets. They are included as Investments in Available-for-Sale Securities under non-current assets section in the consolidated statement of financial position unless management intends to dispose of the investment within 12 months of the reporting period.
All AFS financial assets are measured at fair value, unless otherwise disclosed, with changes in value recognized in other comprehensive income, net of any effects arising from income taxes. When the asset is disposed of or is determined to be impaired, the cumulative gain or loss recognized in other comprehensive income is reclassified from Net Unrealized Gains (Losses) on AFS Financial Assets to profit or loss and presented as reclassification adjustment within other comprehensive income.
Reversal of impairment loss is recognized in other comprehensive income, except for financial assets that are debt securities which are recognized in profit or loss only if the reversal can be objectively related to an event occurring after the impairment loss was recognized.
All income and expenses, including impairment losses, relating to financial assets that are recognized in profit or loss are presented as part of Equity in Net Earnings of Associates, Interest and Other Income - net and Interest and Other Charges – net accounts in the consolidated statement of income.

- 15 -
For investments that are actively traded in organized financial markets, fair value is determined by reference to stock exchange-quoted market bid prices at the close of business on the reporting period. For investments where there is no quoted market price, fair value is determined by reference to the current market value of another instrument which is substantially the same or is calculated based on the expected cash flows of the underlying net asset base of the investment.
A financial asset is presented net of a financial liability when the Group: (a) currently has a legally enforceable right to set off the recognized amounts; and (b) intends either to settle on a net basis, or to realize the asset and settle the liability simultaneously.
Non-compounding interest, dividend income and other cash flows resulting from holding financial assets are recognized in profit or loss when earned, regardless of how the related carrying amount of financial assets is measured. Derecognition of financial assets occurs when the rights to receive cash flows from the financial instruments expire or are transferred and substantially all of the risks and rewards of ownership have been transferred.
2.6 Real Estate Transactions
Acquisition costs of raw land intended for future development, including other costs and expenses incurred to effect the transfer of title of the property to the Group, are charged to the Land for Future Development account. These costs are reclassified to the Property Development Costs account when the development of the property starts. Related property development costs are then accumulated in this account.
Borrowing costs on certain loans incurred during the development of the real estate properties are also capitalized by the Group as part of the property development costs.
The cost of real estate property sold before completion of the development is determined based on the actual costs incurred to date plus estimated costs to complete the development of the property. The estimated expenditures for the development of sold real estate property, as determined by the project engineers, are charged to the cost of residential and condominium units sold presented in the consolidated statement of income with a corresponding credit to the liability account Reserve for Property Development account. Property Development Costs and Residential and Condominium Units for Sale are valued at the lower of cost and net realizable value. Net realizable value is the estimated selling price in the ordinary course of business, less estimated costs to complete and the estimated costs necessary to make the sale. The Group recognizes the effect of revisions in the total project cost estimates in the year in which these changes become known. Any impairment loss from a real estate project is charged to operations during the period in which the loss is determined (see also Note 2.15).

- 16 -
2.7 Investment Property Properties held for lease under operating lease agreements, which comprise mainly of land, buildings and condominium units, are classified as Investment Property, and carried at cost, net of accumulated depreciation and any impairment in value, except for land which is not subjected to depreciation, (see also Note 2.15). Depreciation of investment property is computed using the straight-line method over the estimated useful lives of the assets ranging from 5 to 25 years. Investment property is derecognized upon disposal or when permanently withdrawn from use and no future economic benefit is expected from its disposal. Any gain or loss on the retirement or disposal of an investment property is recognized in the consolidated statement of income in the year of retirement or disposal.
2.8 Property and Equipment Property and equipment are carried at acquisition or construction cost less subsequent depreciation, amortization and any impairment losses. The cost of an asset comprises its purchase price and directly attributable costs of bringing the asset to working condition for its intended use. Expenditures for additions, major improvements and renewals are capitalized; expenditures for repairs and maintenance are charged to expenses as incurred. When assets are sold, retired or otherwise disposed of, their cost and related accumulated depreciation and amortization and any impairment losses are removed from the accounts and any resulting gain or loss is reflected in income for the period. Depreciation is computed on the straight-line basis over the estimated useful lives of the assets. Amortization of office and land improvements is recognized over the estimated useful lives of improvements or the term of the lease, whichever is shorter. The depreciation and amortization periods for property and equipment, based on the above policies, are as follows:
Condominium units 10-25 years Office and land improvements 5-20 years Transportation equipment 5 years Office furniture, fixtures and equipment 3-5 years
An asset’s carrying amount is written down immediately to its recoverable amount if the asset’s carrying amount is greater than its estimated recoverable amount (see also Note 2.15). The residual values and estimated useful lives of property and equipment are reviewed, and adjusted if appropriate, at the end of each reporting period. An item of property and equipment is derecognized upon disposal or when no future economic benefits are expected to arise from the continued use of the asset. Any gain or loss arising on derecognition of the asset (calculated as the difference between the net disposal proceeds and the carrying amount of the item) is included in the profit or loss in the year the item is derecognized.

- 17 -
2.9 Financial Liabilities
Financial liabilities of the Group include Interest-bearing Loans and Borrowings, Bonds Payable, Trade and Other Payables and Advances from Other Related Parties. Financial liabilities are recognized when the Group becomes a party to the contractual terms of the instrument. All interest related charges are recognized as expense in profit or loss under the caption Interest and Other Charges – net account in the consolidated statement of comprehensive income. Interest-bearing Loans and Borrowings and Bonds Payable are raised for support of long-term funding of operations. These are recognized at proceeds received, net of direct issue costs. Finance charges, including premiums payable on settlement or redemption and direct issue costs, are charged to profit or loss on an accrual basis using the effective interest method and are added to the carrying amount of the instrument to the extent that these are not settled in the period in which they arise.
Trade and Other Payables are initially recognized at their fair value and subsequently measured at amortized cost less settlement payments. Dividend distributions to shareholders are recognized as financial liabilities when the dividends are approved by the BOD. A financial liability is presented net of a financial asset when the Group: (a) currently has a legally enforceable right to set off the recognized amounts; and (b) intends either to settle on a net basis, or to realize the asset and settle the liability simultaneously. Financial liabilities are derecognized from the consolidated statement of financial position only when the obligations are extinguished either through discharge, cancellation or expiration. 2.10 Business Combination Business acquisitions are accounted for using the acquisition method of accounting (previously called “purchase method”).
Goodwill represents the excess of the cost of an acquisition over the fair value of the Group’s share of the net identifiable assets of the acquired subsidiary at the date of acquisition. Subsequent to initial recognition, goodwill is measured at cost less any accumulated impairment losses. Goodwill is tested annually for impairment and carried at cost less accumulated impairment losses (see also Note 2.15). Impairment losses on goodwill are not reversed. Negative goodwill, which is the excess of the Company’s interest in the net fair value of net identifiable assets acquired over acquisition cost, is charged directly to income.
For the purpose of impairment testing, goodwill is allocated to cash-generating units or groups of cash-generating units that are expected to benefit from the business combination in which the goodwill arose. The cash-generating units or groups of cash-generating units are identified according to operating segment.
Gains and losses on the disposal of an interest in a subsidiary include the carrying amount of goodwill relating to it.

- 18 -
Prior to January 1, 2010, certain items are treated as follows as opposed to how they will now be treated based on the changes in accounting policy of the Group as a result of the adoption of the revised PFRS 3 and PAS 27 (see Note 2.2): (a) Transaction costs directly attributable to business acquisition previously formed part
of the acquisition costs. These costs are now required to be expensed.
(b) The non-controlling interest was previously measured at the proportionate share of the acquiree’s identifiable net assets. There is now an option to measure this at fair value.
(c) Business combinations achieved in stages were accounted for as separate steps or
acquisitions. Any additional shares acquired of interest did not affect previously recognized goodwill. Currently, business combination achieved in stages requires the acquirer to remeasure its previously held equity interest in the acquiree at its acquisition-date fair value and recognize the resulting gain or loss, if any, in profit or loss or other comprehensive income, as appropriate.
(d) Contingent consideration was recognized if, and only if, payment was probable;
i.e. the Group had a present obligation, the economic outflow was more likely than not, and a reliable estimate is determinable. Subsequent adjustment to the contingent consideration was recognized as an adjustment to goodwill. Changes in the fair value of contingent consideration as a result of additional information that existed after the acquisition date are now accounted for as follows:
(i) Contingent consideration classified as equity is not remeasured and its
subsequent settlement is accounted for within equity.
(ii) Contingent consideration classified as an asset or liability that:
is a financial instrument and is within the scope of PFRS 9 or PAS 39 is measured at fair value, with any resulting gain or loss recognized either in profit or loss or in other comprehensive income in accordance with PFRS 9 or PAS 29, as applicable.
is not within the scope of PFRS 9 or PAS 39 is accounted for in accordance with PAS 37 or other PFRSs, as appropriate.
2.11 Segment Reporting
Operating segments are reported in a manner consistent with the internal reporting provided to the Group’s Strategic Steering Committee (SSC); its chief operating decision-maker. The SSC is responsible for allocating resources and assessing performance of the operating segments. In identifying its operating segments, management generally follows the Group’s products and service lines as disclosed in Note 4, which represent the main products and services provided by the Group. Each of these operating segments is managed separately as each of these service lines requires different technologies and other resources as well as marketing approaches. All inter-segment transfers are carried out at arm’s length prices.

- 19 -
The measurement policies the Group uses for segment reporting under PFRS 8 is the same as those used in its consolidated financial statements. In addition, corporate assets which are not directly attributable to the business activities of any operating segment are not allocated to a segment. There have been no changes from prior periods in the measurement methods used to determine reported segment profit or loss.
2.12 Provisions and Contingencies
Provisions are recognized when present obligations will probably lead to an outflow of economic resources and they can be estimated reliably even if the timing or amount of the outflow may still be uncertain. A present obligation arises from the presence of a legal or constructive commitment that has resulted from past events.
Provisions are measured at the estimated expenditure required to settle the present obligation, based on the most reliable evidence available at the end of the reporting period, including the risks and uncertainties associated with the present obligation. Where there are a number of similar obligations, the likelihood that an outflow will be required in settlement is determined by considering the class of obligations as a whole. When time value of money is material, long-term provisions are discounted to their present values using a pretax rate that reflects market assessments and the risks specific to the obligation. Provisions are reviewed at the end of each reporting period and adjusted to reflect the current best estimate. In those cases where the possible outflow of economic resource as a result of present obligations is considered improbable or remote, or the amount to be provided for cannot be measured reliably, no liability is recognized in the consolidated financial statements. Similarly, probable inflows of economic benefits to the Group that do not yet meet the recognition criteria of an asset are considered contingent assets, hence, are not recognized in the consolidated financial statements. On the other hand, any reimbursement that the Group can be virtually certain to collect from a third party with respect to the obligation is recognized as a separate asset not exceeding the amount of the related provision. 2.13 Revenue and Expense Recognition Revenue comprises revenue from the sale of goods and the rendering of services measured by reference to the fair value of consideration received or receivable by the Group for goods sold and services rendered, excluding value-added tax (VAT) and trade discounts. Revenue is recognized to the extent that it is probable that the economic benefits will flow to the Group and the revenue can be reliably measured. The following specific recognition criteria must also be met before revenue is recognized:
(a) Sale of residential and condominium units – For financial reporting purposes, revenues
from transactions covering sales of residential and condominium units are recognized under the percentage-of-completion method. Under this method, realization of gross profit is recognized by reference to the stage of development of the properties, i.e., revenue is recognized in the period in which the work is performed. The unrealized gross profit on a year’s sales is presented as Deferred Gross Profit in the consolidated statement of income; the cumulative unrealized gross profit as of the end of the year is shown as Deferred Income on Real Estate Sales (current and non-current liabilities) in the consolidated statement of financial position.

- 20 -
The sale is recognized when a certain percentage of the total contract price has already been collected. The amount of real estate sales recognized in the consolidated statement of income is equal to the total contract price, net of day-one loss related to the discounting of noninterest-bearing receivables. If the transaction does not yet qualify as sale, the deposit method is applied until all conditions for recording the sale are met. Pending the recognition of sale, payments received from buyers are presented under the Customers’ Deposits account in the liabilities section of the consolidated statement of financial position.
For tax reporting purposes, a modified basis of computing the taxable income for the year based on collections from sales is used by the parent company, MGAI and ECOC, while MDC report revenues for tax purposes based also on the percentage-of-completion method.
Any adjustments relative to previous years’ sales are recorded in the current year as they occur.
(b) Sale of undeveloped land – Revenues on sale of undeveloped land are recognized using
the full accrual method. Under the full accrual method, revenue is recognized when the risks and rewards of ownership on the undeveloped land have passed to the buyer and the amount of revenue can be measured reliably.
(c) Rental and hotel income – Revenue is recognized when the performance of
contractually agreed tasks has been substantially rendered. Rental income is recognized on a straight-line basis over the lease term.
Advance rentals and refundable rental deposits are recorded as deferred rental income. Deferred rental income is measured at amortized cost using the effective interest rate method.
(d) Construction contracts – Revenue is recognized when the performance of contractually
agreed tasks have been substantially rendered using the cost recovery and percentage-of-completion methods. Provisions for estimated losses on uncompleted contracts are made in the period in which such losses are determined.
(e) Interest – Revenue is recognized as the interest accrues taking into account the effective yield on the asset.
(f) Dividends – Revenue is recorded when the stockholders’ right to receive the payment
is established. Costs of residential and condominium units sold before completion of the projects include the acquisition cost of the land, development costs incurred to date, applicable borrowing costs (see Note 2.17) and estimated costs to complete the project, determined based on estimates made by the project engineers (see also Note 2.6). Operating expenses and other costs (other than costs of real estate sold) are recognized in the profit or loss upon utilization of the service or receipt of goods or at the date they are incurred.

- 21 -
2.14 Leases The Group accounts for its leases as follows: (a) Group as Lessee
Leases which do not transfer to the Group substantially all the risks and benefits of ownership of the asset are classified as operating leases. Operating lease payments are recognized as expense in the profit or loss on a straight-line basis over the lease term. Associated costs, such as repairs and maintenance and insurance, are expensed as incurred.
(b) Group as Lessor
Leases which do not transfer to the lessee substantially all the risks and benefits of ownership of the asset are classified as operating leases. Operating lease income is recognized as income in profit or loss on a straight-line basis over the lease term.
The Group determines whether an arrangement is, or contains, a lease based on the substance of the arrangement. It makes an assessment of whether the fulfillment of the arrangement is dependent on the use of a specific asset or assets and the arrangement conveys a right to use the asset. 2.15 Impairment of Non-financial Assets
The Group’s Investments in Associates, Goodwill (included as part of Other Non-current Assets), Investment Property, Land for Future Development, and Property and Equipment are subject to impairment testing. For purposes of assessing impairment, assets are grouped at the lowest levels for which there are separately identifiable cash flows (cash-generating units). As a result, assets are tested for impairment either individually or at the cash-generating unit level. Impairment loss is recognized for the amount by which the asset’s or cash-generating unit’s carrying amount exceeds its recoverable amount. The recoverable amount is the higher of fair value, reflecting market conditions less costs-to-sell, and value-in-use, based on an internal discounted cash flow evaluation. Impairment loss is charged pro-rata to other assets in the cash generating unit. All assets are subsequently reassessed for indications that an impairment loss previously recognized may no longer exist and the carrying amount of the asset is adjusted to the recoverable amount resulting in the reversal of impairment loss.

- 22 -
2.16 Employee Benefits
(a) Post-employment Benefit
Post-employment benefit is provided to employees through a defined benefit plan.
A defined benefit plan is a post-employment plan that defines an amount of post-employment benefit that an employee will receive on retirement, usually dependent on one or more factors such as age, years of service and salary. The legal obligation for any benefits from this kind of post-employment plan remains with the Group, even if plan assets for funding the defined benefit plan have been acquired. Plan assets may include assets specifically designated to a long-term benefit fund, as well as qualifying insurance policies. The Group’s post-employment defined benefit plan covers all regular full-time employees. The pension plan is tax-qualified, non-contributory and administered by a trustee.
The liability recognized in the consolidated statement of financial position for post-employment defined benefit pension plans is the present value of the defined benefit obligation (DBO) at the end of reporting period less the fair value of plan assets, together with adjustments for unrecognized actuarial gains or losses and past service costs. The DBO is calculated annually by independent actuaries using the projected unit credit method. The present value of the DBO is determined by discounting the estimated future cash outflows using interest rates of high quality corporate bonds that are denominated in the currency in which the benefits will be paid and that have terms to maturity approximating to the terms of the related post-employment liability. Actuarial gains and losses are not recognized as an income or expense unless the total unrecognized gain or loss exceeds 10% of the greater of the obligation and related plan assets. The amount exceeding this 10% corridor is charged or credited to profit or loss over the employees’ expected average remaining working lives. Actuarial gains and losses within the 10% corridor are disclosed separately. Past-service costs are recognized immediately in profit or loss, unless the changes to the post-employment plan are conditional on the employees remaining in service for a specified period of time (the vesting period). In this case, the past service costs are amortized on a straight-line basis over the vesting period.
(b) Compensated Absences Compensated absences are recognized for the number of paid leave days (including holiday entitlement) remaining at the end of the reporting period. They are included in the Trade and Other Payables account of the consolidated statement of financial position at the undiscounted amount that the Group expects to pay as a result of the unused entitlement.

- 23 -
2.17 Borrowing Costs
For financial reporting purposes, borrowing costs are recognized as expenses in the period in which they are incurred, except to the extent that they are capitalized. Borrowing costs that are attributable to the acquisition, construction or production of a qualifying asset (i.e., an asset that takes a substantial period of time to get ready for its intended use or sale) are capitalized as part of the cost of such asset. The capitalization of borrowing costs commences when expenditures for the asset are being incurred, borrowing costs are being incurred and activities that are necessary to prepare the asset for its intended use or sale are in progress. Capitalization ceases when substantially all such activities are complete. For income tax purposes, interest and other borrowing costs are charged to expense when incurred. 2.18 Income Taxes Tax expense recognized in profit or loss comprises the sum of deferred tax and current tax not recognized in other comprehensive income or directly in equity, if any. Current income tax assets or liabilities comprise those claims from, or obligations to, fiscal authorities relating to the current or prior reporting period, that are uncollected or unpaid at the reporting period. They are calculated using the tax rates and tax laws applicable to the fiscal periods to which they relate, based on the taxable profit for the year. All changes to current tax assets or liabilities are recognized as a component of tax expense in the profit or loss. Deferred tax is provided, using the liability method on temporary differences at the end of the reporting period between the tax base of assets and liabilities and their carrying amounts for financial reporting purposes. Under the liability method, with certain exceptions, deferred tax liabilities are recognized for all taxable temporary differences and deferred tax assets are recognized for all deductible temporary differences and the carry forward of unused tax losses and unused tax credits to the extent that it is probable that taxable profit will be available against which the deferred income tax asset can be utilized.
The carrying amount of deferred tax assets is reviewed at the end of each reporting period and reduced to the extent that it is probable that sufficient taxable profit will be available to allow all or part of the deferred tax asset to be utilized. Deferred tax assets and liabilities are measured at the tax rates that are expected to apply to the period when the asset is realized or the liability is settled provided such tax rates have been enacted or substantively enacted at the end of the reporting period. Most changes in deferred tax assets or liabilities are recognized as a component of tax expense in the profit or loss. Only changes in deferred tax assets or liabilities that relate to a change in value of assets or liabilities that is charged directly to equity are charged or credited directly to equity.
- 24 -
2.19 Related Party Transactions
Related party transactions are transfers of resources, services or obligations between the entities in the Group and their related parties, regardless whether a price is charged.
Parties are considered to be related if one party has the ability to control the other party or exercise significant influence over the other party in making financial and operating decisions. This includes: (a) individuals owning, directly or indirectly through one or more intermediaries, control or are controlled by, or under common control with the Company; (b) associates; and (c) individuals owning, directly or indirectly, an interest in the voting power of the Company that gives them significant influence over the Company and close members of the family of any such individual.
In considering each possible related party relationship, attention is directed to the substance of the relationship and not merely on the legal form.
2.20 Equity Capital stock is determined using the nominal value of shares that have been issued. Additional paid-in capital includes any premiums received on the issuance of capital stock. Any transaction costs associated with the issuance of shares are deducted from additional paid-in capital, net of any related income tax benefits. Treasury stock is stated at the cost of re-acquiring such shares.
Net unrealized gains (losses) on AFS financial assets represent gains or losses recognized due to changes in fair values of these assets. Accumulated translation adjustments represent the translation adjustments resulting from the conversion of foreign-currency denominated financial statements of certain subsidiaries into the Group’s functional and presentation currency. Retained earnings include all current and prior period results of operations as reported in the consolidated statement of income. 2.21 Earnings Per Share Basic earnings per share is computed by dividing consolidated net profit attributable to equity holders of the parent company by the weighted average number of shares issued and outstanding, adjusted retroactively for any stock dividend declared, stock split and reverse stock split during the current year, if any.
Diluted earnings per share is computed by adjusting the weighted average number of ordinary shares outstanding to assume conversion of potential dilutive common shares. As of December 31, 2010, 2009 and 2008, the Group does not have potential dilutive common shares.

- 25 -
3. SIGNIFICANT ACCOUNTING ESTIMATES AND JUDGMENTS
The Group’s consolidated financial statements prepared in accordance with PFRS
require management to make judgments and estimates that affect amounts reported in the consolidated financial statements and related notes. Judgments and estimates are continually evaluated and are based on historical experience and other factors, including expectations of future events that are believed to be reasonable under circumstances. Actual results may ultimately vary from these estimates.
3.1 Critical Management Judgments in Applying Accounting Policies
In the process of applying the Group’s accounting policies, management has made the
following judgments, apart from those involving estimation, which have the most significant effect on the amounts recognized in the consolidated financial statements:
(a) Impairment of AFS Securities
The determination when an investment is other-than-temporarily impaired requires significant judgment. In making this judgment, the Group evaluates, among other factors, the duration and extent to which the fair value of an investment is less than its cost; and the financial health of and near-term business outlook for the investee, including factors such as industry and sector performance, changes in technology and operational and financing cash flows. Based on the recent evaluation of information and circumstances affecting the Group’s AFS financial assets, management concluded that the assets are not impaired as of December 31, 2010, 2009 and 2008. Future changes in those information and circumstance might significantly affect the carrying amount of the assets.
(b) Distinction Between Investment Properties, Owner-Occupied Properties and Land for Future Development
The Group determines whether a property qualifies as investment property. In making its judgment, the Group considers whether the property generates cash flows largely independently of the other assets held by an entity. Owner-occupied properties generate cash flows that are attributable not only to property but also to other assets used in the production or supply process while Land for Future Development are properties intended solely for future development.
(c) Operating and Finance Leases
The Group has entered into various lease agreements. Critical judgment was exercised by management to distinguish each lease agreement as either an operating or finance lease by looking at the transfer or retention of significant risk and rewards of ownership of the properties covered by the agreements. Failure to make the right judgment will result in either overstatement or understatement of assets and liabilities.
(d) Provisions and Contingencies
Judgment is exercised by management to distinguish between provisions and contingencies. Accounting policies on recognition and disclosure of provision are discussed in Note 2.12 and relevant disclosures of contingencies are presented in Note 26.

- 26 -
3.2 Key Sources of Estimation Uncertainty The following are the key assumptions concerning the future, and other key sources of estimation uncertainty at the end of the reporting period, that have a significant risk of causing a material adjustment to the carrying amounts of assets and liabilities within the next financial year: (a) Revenue Recognition Using the Percentage-of-Completion Method
The Group uses the percentage-of-completion method in accounting for its realized gross profit on real estate sales. The use of the percentage-of-completion method requires the Group to estimate the portion completed using relevant information such as costs incurred to date as a proportion of the total budgeted cost of the project and estimates by engineers and other experts.
(b) Determining Net Realizable Value of Residential and Condominium Units for Sale and
Property Development Costs
In determining the net realizable value of residential and condominium units for sale and property development costs, management takes into account the most reliable evidence available at the times the estimates are made. The future realization of the carrying amounts of real estate for sale and property development costs is affected by price changes in the different market segments as well as the trends in the real estate industry.
These are considered key sources of estimation and uncertainty and may cause significant adjustments to the Company’s Residential and Condominium Units for Sale and Property Development Costs within the next financial year.
Considering the Group’s pricing policy, the net realizable values of real estate units for sale are higher than their related costs.
The carrying value of the Company’s Residential and Condominium Units for Sale and Property Development Costs amounted to P6.3 billion and P3.8 billion, respectively, as of December 31, 2010, P5.7 billion and P3.7 billion, respectively, as of December 31, 2009 and P5.8 billion and P2.8 billion, respectively, as of December 31, 2008.
(c) Principal Assumptions for Management’s Estimation of Fair Value
Investment Property is measured using the cost model. The fair value disclosed in Note 11 to the consolidated financial statements is determined by the Group using the discounted cash flows valuation technique since the information on current or recent prices of investment property is not available. The Group uses assumptions that are mainly based on market conditions existing at each reporting period, such as: the receipt of contractual rentals; expected future market rentals; void periods; maintenance requirements; and appropriate discount rates. These valuations are regularly compared to actual market yield data and actual transactions by the Group and those reported by the market. The expected future market rentals are determined on the basis of current market rentals for similar properties in the same location and condition.
For financial assets, fair value determination is discussed in Note 2.5.

- 27 -
(d) Useful Lives of Property and Equipment and Investment Property
The Group estimates the useful lives of property and equipment and investment property based on the period over which the assets are expected to be available for use. The estimated useful lives of property and equipment and investment property are reviewed periodically and are updated if expectations differ from previous estimates due to physical wear and tear, technical or commercial obsolescence and legal or other limits on the use of the assets. In addition, estimation of the useful lives of property and equipment and investment property is based on collective assessment of industry practice, internal technical evaluation and experience with similar assets. It is possible, however, that future results of operations could be materially affected by changes in estimates brought about by changes in the factors mentioned above. The amounts and timing of recorded expenses for any period would be affected by changes in these factors and circumstances. A reduction in the estimated useful lives of property and equipment and investment property would increase recorded operating expenses and decrease non-current assets.
Investment Property, net of accumulated depreciation, amounted to P9.7 billion, P9.1 billion and P7.1 billion as of December 31, 2010, 2009 and 2008, respectively (see Note 11). Property and equipment, net of accumulated depreciation and amortization, amounted to P360.5 million, P381.2 million and P430.2 million as of December 31, 2010, 2009 and 2008, respectively (see Note 12).
(e) Allowance for Impairment of Trade and Other Receivables
Allowance is made for specific and groups of accounts, where objective evidence of impairment exists. The Group evaluates these accounts based on available facts and circumstances, including, but not limited to, the length of the Group’s relationship with the customers, the customers’ current credit status based on third party credit reports and known market forces, average age of accounts, collection experience and historical loss experience.
Allowance for impairment on Trade and Other Receivables amounted to P3.3 million at the end of 2010, P7.9 million at the end of 2009 and P8.0 million at the end of 2008 (see Note 6).
(f) Valuation of Financial Assets Other than Trade and Other Receivables
The Group carries certain financial assets at fair value, which requires the extensive use of accounting estimates and judgment. In cases when active market quotes are not available, fair value is determined by reference to the current market value of another instrument which is substantially the same or is calculated based on the expected cash flows of the underlying net base of the instrument. The amount of changes in fair value would differ had the Group utilized different valuation methods and assumptions. Any change in fair value of these financial assets and liabilities would affect profit and loss and equity. The carrying amounts of cash and cash equivalents, financial assets at FVTPL and AFS financial assets are disclosed in Notes 5, 7 and 8, respectively.

- 28 -
(g) Realizable Amount of Deferred Tax Assets
The Group reviews its deferred tax assets at the end of each reporting period and reduces the carrying amount to the extent that it is no longer probable that sufficient taxable profit will be available to allow all or part of the deferred tax asset to be utilized.
Net deferred tax assets amounted to P7.9 million as of December 31, 2010 and 2009, and P2.4 million as of December 31, 2008 (see Note 22).
(h) Impairment of Non-financial Assets
Except for intangible assets with indefinite useful lives, PFRS requires that an impairment review be performed when certain impairment indicators are present. The Group’s policy on estimating the impairment of non-financial assets is discussed in detail in Note 2.15. Though management believes that the assumptions used in the estimation of fair values reflected in the consolidated financial statements are appropriate and reasonable, significant changes in these assumptions may materially affect the assessment of recoverable values and any resulting impairment loss could have a material adverse effect on the results of operations.
There were no impairment losses required to be recognized in 2010, 2009 and 2008 based on management’s assessment.
(i) Post-employment Benefit
The determination of the Group’s obligation and cost of post-employment benefits is dependent on the selection of certain assumptions used by actuaries in calculating such amounts. Those assumptions are described in Note 21.2 and include, among others, discount rates, expected return on plan assets and salary increase rate. In accordance with PFRS, actual results that differ from the assumptions are accumulated and amortized over future periods and, therefore, generally affect the recognized expense and recorded obligation in such future periods. The retirement benefit obligation amounted to P116.0 million, P90.8 million and P81.2 million as of December 31, 2010, 2009 and 2008, respectively (see Note 21.2).

- 29 -
4. SEGMENT INFORMATION
4.1 Business Segments
The Group’s operating businesses are organized and managed separately according to the nature of products and services provided, with each segment representing a strategic business unit that offers different products and serves different markets. The Group is engaged in the development of residential and office units including urban centers integrating office, residential and commercial components. The Real Estate segment pertains to the development and sale of residential and office developments. The Rental segment includes leasing of office and commercial spaces. The Hotel Operations segment relates to the management of hotel business operations. The Corporate and Others segment includes marketing services, general and corporate income and expense items. Segment accounting policies are the same as the policies described in Note 2.11. The Group generally accounts for intersegment sales and transfers as if the sales or transfers were to third parties at current market prices.
4.2 Segment Assets and Liabilities
Segment assets are allocated based on their physical location and use or direct association with a specific segment and they include all operating assets used by a segment and consist principally of operating cash, receivables, real estate inventories, property and equipment, and investment property, net of allowances and provisions. Similar to segment assets, segment liabilities are also allocated based on their use or direct association with a specific segment. Segment liabilities include all operating liabilities and consist principally of accounts, wages, taxes currently payable and accrued liabilities.
4.3 Intersegment Transactions
Segment revenues, expenses and performance include sales and purchases between business segments. Such sales and purchases are eliminated in consolidation.
4.4 Analysis of Segment Information
The following tables present revenue and profit information regarding industry segments for the years ended December 31, 2010, 2009 and 2008 and certain asset and liability information regarding segments at December 31, 2010, 2009 and 2008.
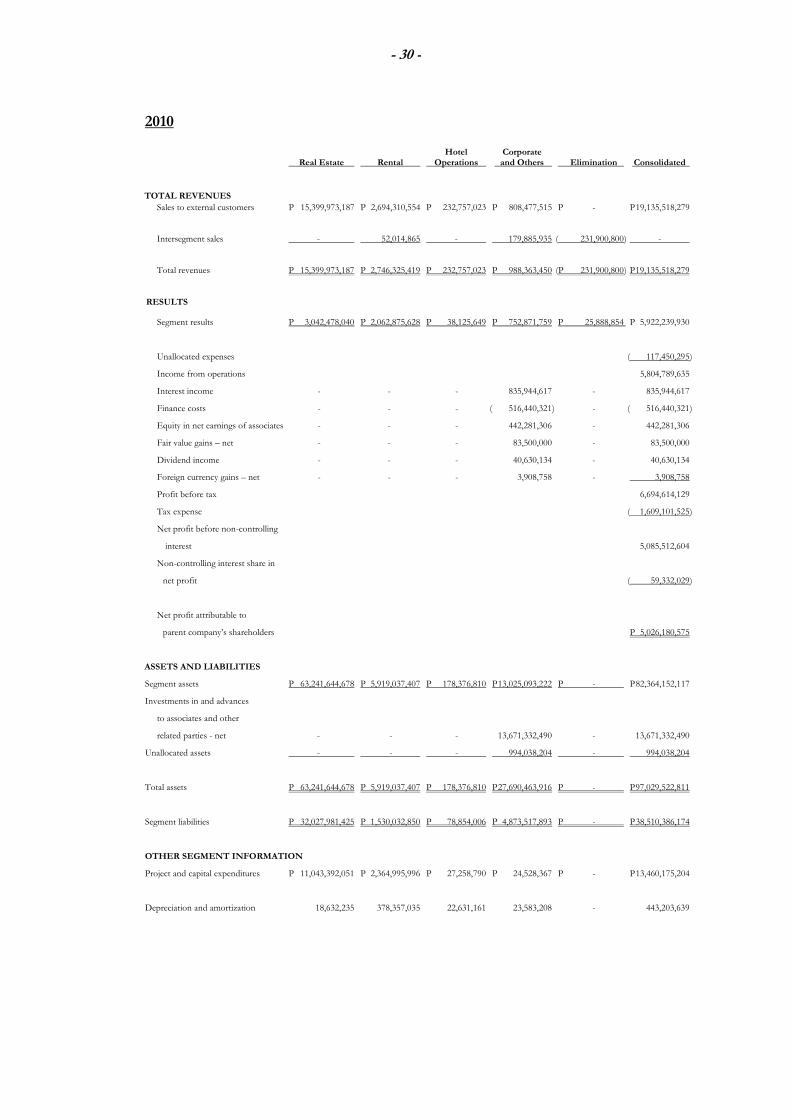
- 30 -
2010
Hotel Corporate Real Estate Rental Operations and Others Elimination Consolidated
TOTAL REVENUES
Sales to external customers P 15,399,973,187 P 2,694,310,554 P 232,757,023 P 808,477,515 P - P 19,135,518,279
Intersegment sales - 52,014,865 - 179,885,935 ( 231,900,800 ) -
Total revenues P 15,399,973,187 P 2,746,325,419 P 232,757,023 P 988,363,450 (P 231,900,800 ) P 19,135,518,279
RESULTS
Segment results P 3,042,478,040 P 2,062,875,628 P 38,125,649 P 752,871,759 P 25,888,854 P 5,922,239,930
Unallocated expenses ( 117,450,295)
Income from operations 5,804,789,635
Interest income - - - 835,944,617 - 835,944,617
Finance costs - - - ( 516,440,321) - ( 516,440,321)
Equity in net earnings of associates - - - 442,281,306 - 442,281,306
Fair value gains – net - - - 83,500,000 - 83,500,000
Dividend income - - - 40,630,134 - 40,630,134
Foreign currency gains – net - - - 3,908,758 - 3,908,758
Profit before tax 6,694,614,129
Tax expense ( 1,609,101,525)
Net profit before non-controlling
interest 5,085,512,604
Non-controlling interest share in
net profit ( 59,332,029)
Net profit attributable to
parent company’s shareholders P 5,026,180,575
ASSETS AND LIABILITIES
Segment assets P 63,241,644,678 P 5,919,037,407 P 178,376,810 P 13,025,093,222 P - P 82,364,152,117
Investments in and advances
to associates and other
related parties - net - - - 13,671,332,490 - 13,671,332,490
Unallocated assets - - - 994,038,204 - 994,038,204
Total assets P 63,241,644,678 P 5,919,037,407 P 178,376,810 P 27,690,463,916 P - P 97,029,522,811
Segment liabilities P 32,027,981,425 P 1,530,032,850 P 78,854,006 P 4,873,517,893 P - P 38,510,386,174
OTHER SEGMENT INFORMATION
Project and capital expenditures P 11,043,392,051 P 2,364,995,996 P 27,258,790 P 24,528,367 P - P 13,460,175,204
Depreciation and amortization 18,632,235 378,357,035 22,631,161 23,583,208 - 443,203,639

- 31 -
2009
Hotel Corporate Real Estate Rental Operations and Others Elimination Consolidated
TOTAL REVENUES
Sales to external customers P 14,566,449,663 P 2,000,477,427 P 216,143,646 P 59,044,461 P - P 16,842,115,197
Intersegment sales - 62,047,938 - 71,112,463 ( 133,160,401 ) -
Total revenues P 14,566,449,663 P 2,062,525,365 P 216,143,646 P 130,156,924 (P 133,160,401 ) P 16,842,115,197
RESULTS
Segment results P 3,721,385,850 P 1,535,784,727 P 44,321,641 P 31,021,942 P 25,888,853 P 5,358,403,013
Unallocated expenses ( 206,001,589)
Income from operations 5,152,401,424
Interest income - - - 690,238,144 - 690,238,144
Finance costs - - - ( 556,326,705) - ( 556,326,705)
Equity in net earnings of associates - - - 157,958,213 - 157,958,213
Dividend income - - - 44,247,127 - 44,247,127
Fair value gains – net - - - 24,100,000 - 24,100,000
Foreign currency loss – net - - - ( 8,464,596) - ( 8,464,596)
Profit before tax 5,504,153,607
Tax expense ( 1,437,541,131)
Net profit before non-controlling
interest 4,066,612,476
Non-controlling interest share in
net profit ( 11,211,285)
Net profit attributable to
parent company’s shareholders P 4,055,401,191
ASSETS AND LIABILITIES
Segment assets P 55,378,759,577 P 5,072,588,995 P 182,070,130 P 11,172,314,788 P - P 71,805,733,490
Investments in and advances
to associates and other
related parties - net - - - 12,665,714,849 - 12,665,714,849
Unallocated assets - - - 782,324,106 - 782,324,106
Total assets P 55,378,759,577 P 5,072,588,995 P 182,070,130 P 24,620,353,743 P - P 85,253,772,445
Segment liabilities P 28,887,111,381 P 1,102,204,707 P 51,504,125 P 5,377,235,672 P - P 35,418,055,885
OTHER SEGMENT INFORMATION
Project and capital expenditures P 8,450,184,072 P 2,212,988,366 P 36,106,669 P 1,205,765 P - P 10,700,484,872
Depreciation and amortization 13,553,509 325,257,171 7,729,572 19,255,338 - 365,795,590

- 32 -
2008 Hotel Corporate Real Estate Rental Operations and Others Elimination Consolidated
TOTAL REVENUES
Sales to external customers P 13,795,323,274 P 1,300,910,039 P 246,919,573 P 310,557,611 P - P 15,653,710,497
Intersegment sales - 76,532,769 - 76,702,719 ( 153,235,488 ) -
Total revenues P 13,795,323,274 P 1,377,442,808 P 246,919,573 P 387,260,330 (P 153,235,488 ) P 15,653,710,497
RESULTS
Segment results P 3,081,106,749 P 998,942,887 P 54,807,975 P 194,364,735 P 25,888,852 P 4,355,111,198
Unallocated expenses ( 267,810,547)
Income from operations 4,087,300,651
Interest income - - - 1,486,040,236 - 1,486,040,236
Finance costs - - - ( 766,416,111) - ( 766,416,111)
Foreign currency loss – net - - - ( 176,988,434) - ( 176,988,434)
Equity in net earnings of associates - - - 109,464,838 - 109,464,838
Dividend income - - - 48,880,085 - 48,880,085
Fair value losses – net - - - ( 42,653,717) - ( 42,653,717)
Profit before tax 4,745,627,548
Tax expense ( 951,101,304)
Net profit before non-controlling
interest 3,794,526,244
Non-controlling interest share in
Net profit ( 23,399,237)
Net profit attributable to
parent company’s shareholders P 3,771,127,007
ASSETS AND LIABILITIES
Segment assets P 40,952,630,176 P 3,013,855,655 P 167,402,312 P 9,289,609,706 P - P 53,423,497,849
Investment in and advances
to associates and other
related parties - net - - - 10,982,670,783 - 10,982,670,783
Unallocated assets - - - 495,106,830 - 495,106,830
Total assets P 40,952,630,176 P 3,013,855,655 P 167,402,312 P 20,767,387,319 P - P 64,901,275,462
Segment liabilities P 19,236,885,198 P 553,618,261 P 54,366,165 P 5,363,454,991 P - P 25,208,324,615
OTHER SEGMENT INFORMATION
Project and capital expenditures P 8,688,100,952 P 1,978,303,096 P 1,875,428 P 142,646,426 P - P 10,810,925,902
Depreciation and amortization 17,368,238 182,199,244 796,349 38,470,492 - 238,834,323

- 33 -
5. CASH AND CASH EQUIVALENTS
Cash and cash equivalents include the following components as of December 31:
2010 2009 2008
Cash on hand and in banks P 1,109,041,947 P 6,384,861,752 P 731,319,856
Short-term placements 20,922,542,996 14,491,143,721 11,594,013,208
P 22,031,584,943 P 20,876,005,473 P 12,325,333,064
Cash in banks and short-term placements generally earn interest at rates based on daily bank deposit rates. Short-term placements are made for varying periods between 15 to 30 days and earn effective interest ranging from 3.5% to 4.8% in 2010, 3.5% to 8.5% in 2009 and 3.0% to 8.5% in 2008.
6. TRADE AND OTHER RECEIVABLES
This account is composed of the following:
2010 2009 2008
Current:
Trade receivables P 12,899,356,339 P 9,938,940,019 P 11,012,739,154
Allowance for impairment ( 3,324,211) ( 7,895,021) ( 8,043,660)
12,896,032,128 9,931,044,998 11,004,695,494
Advances to contractors
and suppliers 710,223,731 570,214,061 382,752,035
Others 527,545,525 248,384,875 32,677,850
14,133,801,384 10,749,643,934 11,420,125,379
Non-current:
Trade receivables 15,617,214,463 13,533,275,932 6,660,823,617
Others - 1,026,423 1,026,424
15,617,214,463 13,534,302,355 6,661,850,041
P 29,751,015,847 P 24,283,946,289 P 18,081,975,420
A reconciliation of the allowance for impairment at the beginning and end of 2010, 2009 and 2008 is shown below.
2010 2009 2008
Balance at beginning of year P 7,895,021 P 8,043,660 P 3,502,310
Write-off of trade receivables
previously provided
with allowance ( 4,570,810) ( 937,382 ) ( 1,783,690)
Impairment loss during the year - 788,743 6,325,040
P 3,324,211 P 7,895,021 P 8,043,660

- 34 -
The installment period of sales contracts averages to five years. Trade receivables are noninterest-bearing and are remeasured at amortized cost using the effective interest rate of 10%. Interest income recognized amounted to P933.4 million in 2010, P714.2 million in 2009 and P612.3 million in 2008; these amounts are presented as Interest Income on Real Estate Sales in the consolidated statements of income.
All trade receivables are subject to credit risk exposure. However, the Group does
not identify specific concentrations of credit risk with regard to Trade and Other Receivables as the amounts recognized resemble a large number of receivables from various customers. Certain receivables from trade customers are covered by postdated checks. Certain past due accounts are not provided with allowance for impairment to the extent of the expected market value of the property sold to the customer. The title to the real estate properties remains with the Group until the receivables are fully collected.
The fair values of trade and other receivables are disclosed in Note 28.
7. FINANCIAL ASSETS AT FAIR VALUE THROUGH PROFIT OR LOSS
This account consists of investments in marketable securities which are presented at their fair values determined directly by reference to published prices quoted in an active market as of December 31, 2010, 2009 and 2008. The changes in fair values of these financial assets are presented as Fair Value Gains - net in 2010 and 2009 under Equity in Net Earnings of Associates, Interest and Other Income - net (see Note 19) and as Fair Value Losses - net in 2008 under Interest and Other Charges - net (see Note 20) in the consolidated statements of income. RHGI has sold certain marketable securities and recognized a net loss amounting to P5.3 million in 2008 which amounts are presented as part of Miscellaneous - net under the Interest and Other Charges account in the 2008 consolidated statement of income (see Note 20). In addition, RHGI entered into forward contracts covering U.S. dollars in 2007, which were settled in 2008. Foreign exchange losses on this transaction are presented as part of Foreign Currency Losses - net under Interest and Other Charges - net account in the 2008 consolidated statement of income (see Note 20).
8. INVESTMENTS IN AVAILABLE-FOR-SALE SECURITIES
AFS financial assets comprise the following as of December 31:
2010 2009 2008
Investment in equity instruments P 5,535,716,669 P 2,778,231,823 P 1,076,571,258
Investment in debt instruments 675,467,827 148,299,890 3,273,653,414
P 6,211,184,496 P 2,926,531,713 P 4,350,224,672
The fair values of AFS financial assets have been determined directly by reference to published prices in an active market.

- 35 -
The aggregate cost of AFS financial assets as of December 31, 2010, 2009 and 2008 amounted to P2.4 billion, P2.8 billion and P5.7 billion, respectively. The fair value gains/losses arising from these financial assets which significantly comprised the movements in the carrying amounts of AFS, are reported as part of Net Unrealized Gains (Losses) on AFS Financial Assets in the consolidated statements of comprehensive income.
A portion of the AFS financial assets of RHGI placed with a certain bank is covered by a set-off provision. The amount of compensating loan set-off against AFS financial assets amounted to U.S.$3.1 million (P145.8 million) and U.S.$6.9 million (P325.6 million) as of December 31, 2009 and 2008, respectively. There was no compensating loan set-off against AFS financial assets in 2010. A portion of the AFS financial assets are owned by RHGI and FTPHI, which are wholly owned subsidiaries of the Company. Hence, the movements in the AFS financial assets arising from fair value gains/losses are fully allocated to the parent company’s shareholders.
9. ADVANCES TO LANDOWNERS AND JOINT VENTURES
The Group enters into numerous joint venture agreements for the joint development of various projects. These are treated as jointly controlled operations; there were no separate entities created by these joint venture agreements. The joint venture agreements stipulate that the Group’s joint venturer shall contribute parcels of land and the Group shall be responsible for the planning, conceptualization, design, demolition of existing improvements, construction, financing and marketing of condominium to be constructed on the properties. Costs incurred by the Group for these projects are recorded under the Property Development Costs account in the consolidated statements of financial position (see Note 2.6). The amounts of other related accounts are presented as part of the regular asset and liability accounts and income and expense accounts of the Group (see Note 2.3) The Group also grants noninterest-bearing, secured cash advances to a number of landowners and joint ventures under agreements they entered into with landowners covering the development of certain parcels of land. Under the terms of the agreements, the Group, in addition to providing specified portion of total project development costs, also commits to advance mutually agreed-upon amounts to the landowners to be used for pre-development expenses such as the relocation of existing occupants.
Repayment of these advances shall be made upon completion of the project development either in the form of the developed lots corresponding to the owner’s share in saleable lots or in the form of cash to be derived from the sales of the landowner’s share in the saleable lots and residential and condominium units. Total amount of advances made by the Group less repayments, is presented as part of the Advances to Landowners and Joint Ventures account in the consolidated statements of financial position.

- 36 -
The net commitment for cash advances under the joint venture agreements amounts to:
2010 2009 2008
Total commitment for cash advances P 1,500,000,000 P 958,720,120 P 247,730,000
Total cash advances granted ( 1,500,000,000) ( 958,720,120 ) ( 247,730,000)
P - P - P -
The net commitment for construction expenditures amounts to:
2010 2009 2008
Total commitment for
construction expenditures P 7,911,278,595 P 6,999,089,356 P 6,164,100,646
Total expenditures incurred ( 5,505,759,467) ( 4,014,820,948 ) ( 3,244,787,600)
P 2,405,519,128 P 2, 984,268,408 P 2,919,313,046
The Group’s interests in jointly-controlled operations and projects range from 72% to 95% in 2010, 2009 and 2008. The listing and description of the Group’s jointly controlled projects are as follows:
McKinley Hills
Newport City
Manhattan Parkway Residences
Greenbelt Excelsior
Forbeswood Heights
Forbeswood Parklane 1 & 2
The aggregate amounts of the current assets, long-term assets, current liabilities, long-term liabilities, income and expenses as of and for the years ended December 31, 2010, 2009 and 2008 related to the Group’s interests in joint ventures are not presented as the joint ventures in which the Group is involved are not jointly-controlled entities (see Note 2.3). As of December 31, 2010 and 2009, the Group either has no other contingent liabilities with regard to these joint ventures or has assessed that the probability of loss that may arise from contingent liabilities is remote.

- 37 -
10. INVESTMENTS IN AND ADVANCES TO ASSOCIATES AND OTHER RELATED PARTIES
The details of investments in and advances to associates and other related parties, are as follows:
% Interest Held
as of End of 2010
(see Note 1) 2010 2009 2008
Investments in associates – at equity
Acquisition costs:
EELHI 48.38% P 5,726,128,415 P 5,726,128,415 P 5,726,128,415
SHDI 42.48% 875,445,000 875,445,000 875,445,000
PTHDC 40.00% 64,665,000 64,665,000 64,665,000
GPMAI 39.83% 98,806,194 - -
AGPL 39.44% 2,463,056,417 1,583,687,182 -
TIHGI 10.00% 570,000,000 1,000,000,000 1,000,000,000
9,798,101,026 9,249,925,597 7,666,238,415
Accumulated equity in comprehensive
income :
Balance at beginning of year 1,403,518,676 1,245,560,463 1,148,146,700
Dividends received from TIHGI ( 90,736,000) - -
Equity in net earnings
for the year (see Note 19) 442,281,307 157,958,213 109,464,838
Share in other comprehensive income 71,176,649 - -
Deduction due to sale of investment - - ( 12,051,075)
Balance at end of year 1,826,240,632 1,403,518,676 1,245,560,463
Advances to associates and other related parties
(see Note 23.3) 2,046,990,832 2,012,270,576 2,070,871,905
P 13,671,332,490 P 12,665,714,849 P 10,982,670,783
The shares of stock of EELHI and SHDI are listed in the PSE. The total quoted or market value of investments in these two listed associates amounted to P3.3 billion, P2.7 billion and P2.4 billion as of December 31, 2010, 2009 and 2008, respectively. Overall, the related book values of the Group’s holdings in all of its associates are substantially in excess of both the investments’ cost and market values, hence, management has assessed that the recognition of impairment losses was not deemed necessary. On April 30, 2008, AGI, TIHGI and the Company entered into a Deed of Exchange to swap certain real estate properties for TIHGI’s shares of stock. The Company and AGI initially received 6.125 billion shares of TIHGI in exchange for parcels of land and the hotel and office buildings with approximate aggregate values of P6.125 billion at the time of exchange. Several transactions with other related parties covering the TIHGI’s shares held by the Company took place thereafter, and as a result of these transactions, the Company holds 1.0 billion shares or 10% ownership in TIHGI as of December 31, 2010, 2009 and 2008.

- 38 -
In August 2010, TIHGI amended its Articles of Incorporation to convert P9.9 billion or 99% of its common shares to redeemable, voting and participating preferred shares. This was approved by the Securities and Exchange Commission on October 14, 2010. Consequently, the investment of the Company in TIHGI of 1.0 billion common shares was converted to 10.0 million common shares and 990.0 million preferred shares of TIHGI. As this was just a conversion of shares and did not change the Company’s 10% ownership in TIHGI, no gain or loss from the transaction was recorded in the Company’s books. In November 2010, TIHGI redeemed 430.0 million preferred shares held by the Company at par value. There are no outstanding receivables as of December 31, 2010 arising from TIHGI’ redemption of preferred shares held by the Company. Despite of the 10% ownership, the Company considers TIHGI as an associate due to the presence of significant influence over TIHGI’s operations since two out of the five directors of TIHGI are also members of the Company’s BOD. In 2010, the Company received cash dividends from TIHGI amounting to P90.7 million. The amount received is considered a return of investment and is presented as deduction from the Accumulated Equity in Comprehensive Income shown in the previous table presented. In October 2010, AGPL issued additional 57.7 million common shares. Out of the total number of shares that AGPL issued, RHGI, a 100% owned subsidiary of the Company, subscribed to only 19.1 million shares (lesser than its proportionate share) at a cost of P20.4 million. This resulted in the decline of RHGI’s percentage ownership in AGPL to 39.44% in 2010. Also, in October 2010, GPMAI issued additional 27.0 million shares to EELHI resulting in the decline of TDI’s percentage ownership in GPMAI to 48.08% and MREI’s and the Company’s indirect ownership to 28.85% and 39.83%, respectively. Accordingly, GPMAI was deconsolidated and treated as an associate as of December 31, 2010. GPMAI’s issuance of new shares was made at book value, hence, no dilution gain or loss was recognized. The balance of the Accumulated Equity in Comprehensive Income of P1.8 billion, P1.4 billion and P1.3 billion as of December 31, 2010, 2009 and 2008, respectively, which is mainly lodged in the Group’s Retained Earnings as of those dates, is not available for declaration as dividend. The aggregated amounts of assets, liabilities and net profit (loss) of the associates are as follows:
Net Profit
Assets Liabilities Revenues (Loss)
2010:
EELHI P 27,830,579,495 P 8,313,108,199 P 2,313,768,713 P 225,222,976
SHDI 574,744,907 463,771,003 8,263,029 4,730,857
PTHDC 1,137,581,235 1,005,298,094 64,128 ( 178,157 )
GPMAI 748,619,721 157,143,964 252,107,804 165,840,133
AGPL 6,352,873,392 7,846,770 205,630,984 95,518,781
TIHGI 41,043,334,923 27,086,278,378 14,876,965,463 3,220,646,817
P 77,687,733,673 P 37,033,446,408 P 17,656,800,121 P 3,711,781,407
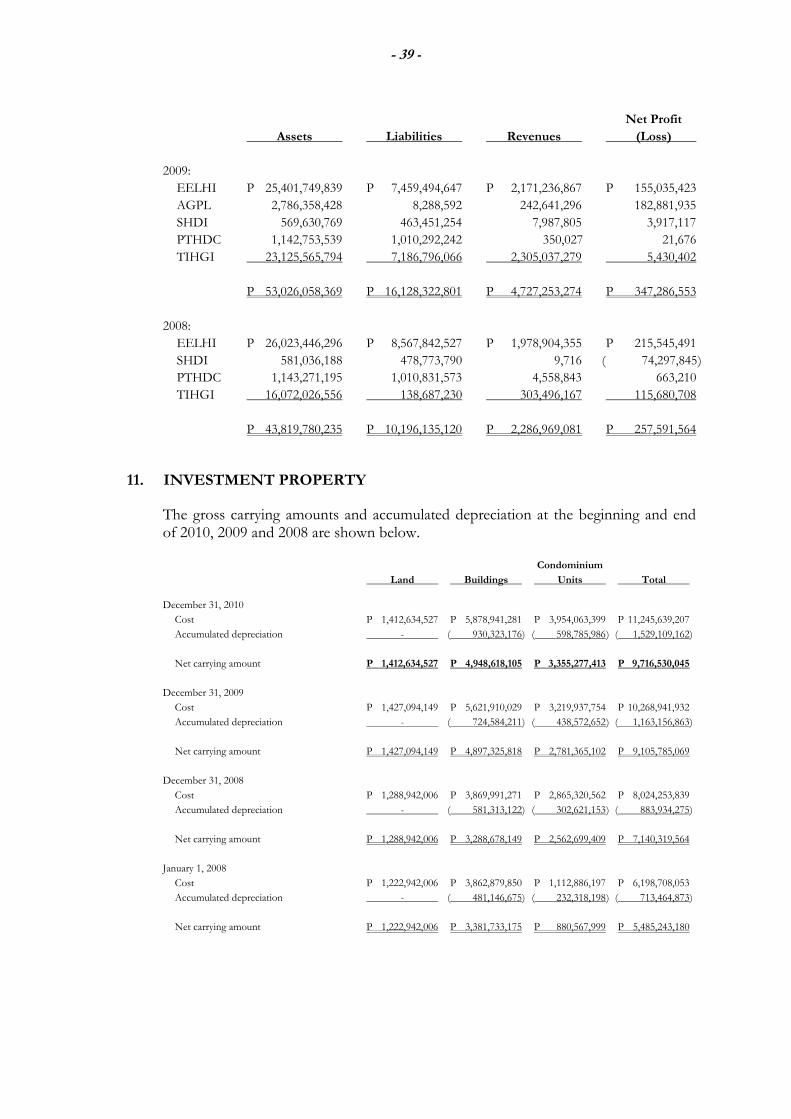
- 39 -
Net Profit
Assets Liabilities Revenues (Loss)
2009:
EELHI P 25,401,749,839 P 7,459,494,647 P 2,171,236,867 P 155,035,423
AGPL 2,786,358,428 8,288,592 242,641,296 182,881,935
SHDI 569,630,769 463,451,254 7,987,805 3,917,117
PTHDC 1,142,753,539 1,010,292,242 350,027 21,676
TIHGI 23,125,565,794 7,186,796,066 2,305,037,279 5,430,402
P 53,026,058,369 P 16,128,322,801 P 4,727,253,274 P 347,286,553
2008:
EELHI P 26,023,446,296 P 8,567,842,527 P 1,978,904,355 P 215,545,491
SHDI 581,036,188 478,773,790 9,716 ( 74,297,845 )
PTHDC 1,143,271,195 1,010,831,573 4,558,843 663,210
TIHGI 16,072,026,556 138,687,230 303,496,167 115,680,708
P 43,819,780,235 P 10,196,135,120 P 2,286,969,081 P 257,591,564
11. INVESTMENT PROPERTY
The gross carrying amounts and accumulated depreciation at the beginning and end of 2010, 2009 and 2008 are shown below.
Condominium
Land Buildings Units Total
December 31, 2010
Cost P 1,412,634,527 P 5,878,941,281 P 3,954,063,399 P 11,245,639,207
Accumulated depreciation - ( 930,323,176) ( 598,785,986 ) ( 1,529,109,162)
Net carrying amount P 1,412,634,527 P 4,948,618,105 P 3,355,277,413 P 9,716,530,045
December 31, 2009
Cost P 1,427,094,149 P 5,621,910,029 P 3,219,937,754 P 10,268,941,932
Accumulated depreciation - ( 724,584,211) ( 438,572,652 ) ( 1,163,156,863)
Net carrying amount P 1,427,094,149 P 4,897,325,818 P 2,781,365,102 P 9,105,785,069
December 31, 2008
Cost P 1,288,942,006 P 3,869,991,271 P 2,865,320,562 P 8,024,253,839
Accumulated depreciation - ( 581,313,122) ( 302,621,153 ) ( 883,934,275)
Net carrying amount P 1,288,942,006 P 3,288,678,149 P 2,562,699,409 P 7,140,319,564
January 1, 2008
Cost P 1,222,942,006 P 3,862,879,850 P 1,112,886,197 P 6,198,708,053
Accumulated depreciation - ( 481,146,675) ( 232,318,198 ) ( 713,464,873)
Net carrying amount P 1,222,942,006 P 3,381,733,175 P 880,567,999 P 5,485,243,180

- 40 -
A reconciliation of the carrying amounts at the beginning and end of 2010, 2009 and 2008 of investment property is shown below.
Condominium
Land Buildings Units Total
Balance at January 1, 2010, net of
accumulated depreciation P 1,427,094,149 P 4,897,325,818 P 2,781,365,102 P 9,105,785,069
Additions - 257,140,943 734,125,645 991,266,588
Transfers - ( 109,691) - ( 109,691 )
Investment property of a
deconsolidated subsidiary ( 14,459,622 ) - - ( 14,459,622 )
Depreciation charges for the year - ( 205,738,965) ( 160,213,334 ) ( 365,952,299 )
Balance at December 31, 2010,
net of accumulated depreciation P 1,412,634,527 P 4,948,618,105 P 3,355,277,413 P 9,716,530,045
Balance at January 1, 2009, net of
accumulated depreciation P 1,288,942,006 P 3,288,678,149 P 2,562,699,409 P 7,140,319,564
Additions 138,152,143 1,751,918,758 371,192,706 2,261,263,607
Transfers - - ( 12,168,571 ) ( 12,168,571)
Depreciation charges for the year - ( 143,271,089) ( 140,358,442 ) ( 283,629,531)
Balance at December 31, 2009,
net of accumulated depreciation P 1,427,094,149 P 4,897,325,818 P 2,781,365,102 P 9,105,785,069
Balance at January 1, 2008, net of
accumulated depreciation P 1,222,942,006 P 3,381,733,175 P 880,567,999 P 5,485,243,180
Additions - 7,111,421 1,752,434,365 1,759,545,786
Transfers 66,000,000 - - 66,000,000
Depreciation charges for the year - ( 100,166,447) ( 70,302,955 ) ( 170,469,402)
Balance at December 31, 2008,
net of accumulated depreciation P 1,288,942,006 P 3,288,678,149 P 2,562,699,409 P 7,140,319,564
Certain properties held for lease with a net book value of P2.0 billion as of December 31, 2007 were used as collateral for ECOC’s Interest-bearing Loan (see Note 14). In 2008, ECOC asked for the partial release of the mortgage which was approved by the creditor. As of December 31, 2010, 2009 and 2008, the carrying value of investment properties that remained as collateral to this loan amounted to P800.0 million. Rental income earned from these properties amount to P2.7 billion, P2.0 billion and P1.3 billion in 2010, 2009 and 2008, respectively, and are shown as Rental Income in the consolidated statements of income. The direct operating costs, exclusive of depreciation, incurred by the Group relating to the investment property amounted to P91.4 million in 2010, P94.7 million in 2009 and P109.7 million in 2008. The operating lease commitments of the Group as a lessor are fully disclosed in Note 26.1. The fair market values of these properties are P52.9 billion, P36.1 billion and P22.7 billion as of December 31, 2010, 2009 and 2008, respectively. These are determined by calculating the present value of the cash inflows anticipated until the end of the life of the investment property using a discount rate of 10% in 2010, 2009 and 2008.

- 41 -
12. PROPERTY AND EQUIPMENT
The gross carrying amounts and accumulated depreciation and amortization at the beginning and end of 2010, 2009 and 2008 are shown below.
Office Furniture, Office and Condominium Fixtures and Land Transportation Units Equipment Improvements Equipment Land Total
December 31, 2010
Cost P 629,423,370 P 208,009,574 P 125,515,520 P 73,056,949 P - P1,036,005,413 Accumulated depreciation and amortization ( 419,607,035) ( 137,705,039) ( 68,848,502) ( 49,326,636 ) - ( 675,487,212 ) Net carrying amount P 209,816,335 P 70,304,535 P 56,667,018 P 23,730,313 P - P 360,518,201
December 31, 2009 Cost P 636,068,482 P 164,774,710 P 110,228,731 P 68,340,932 P - P 979,412,855 Accumulated depreciation and amortization ( 384,211,287) ( 112,828,976) ( 62,091,448) ( 39,104,161 ) - ( 598,235,872 ) Net carrying amount P 251,857,195 P 51,945,734 P 48,137,283 P 29,236,771 P - P 381,176,983
December 31, 2008
Cost P 632,401,752 P 143,937,386 P 109,833,026 P 62,607,743 P - P 948,779,907 Accumulated depreciation and amortization ( 339,497,192) ( 92,673,661) ( 55,230,345) ( 31,197,924 ) - ( 518,599,122 ) Net carrying amount P 292,904,560 P 51,263,725 P 54,602,681 P 31,409,819 P - P 430,180,785
January 1, 2008 Cost P 601,292,072 P 123,945,281 P 109,663,808 P 50,010,694 P 66,000,000 P 950,911,855 Accumulated depreciation and amortization ( 300,540,877) ( 74,922,406) ( 47,108,599) ( 27,662,319 ) - ( 450,234,201 ) Net carrying amount P 300,751,195 P 49,022,875 P 62,555,209 P 22,348,375 P 66,000,000 P 500,677,654
A reconciliation of the carrying amounts at the beginning and end of 2010, 2009 and 2008 of property and equipment is shown below.
Office Furniture, Office and Condominium Fixtures and Land Transportation Units Equipment Improvements Equipment Land Total
Balance at January 1, 2010, net of accumulated depreciation and amortization P 251,857,195 P 51,945,734 P 48,137,283 P 29,236,771 P - P 381,176,983 Additions 2,476,163 43,273,546 14,583,113 2,040,275 - 62,373,098 Transfers ( 9,121,275) ( 38,682) 703,675 2,675,742 - ( 5,780,540 ) Depreciation and amortization charges for the year ( 35,395,748) ( 24,876,063) ( 6,757,054) ( 10,222,475 ) - ( 77,251,340 ) Balance at December 31, 2010, net of accumulated depreciation and amortization P 209,816,335 P 70,304,535 P 56,667,018 P 23,730,313 P - P 360,518,201

- 42 -
Office Furniture, Office and Condominium Fixtures and Land Transportation Units Equipment Improvements Equipment Land Total
Balance at January 1, 2009, net of accumulated depreciation and amortization P 292,904,560 P 51,263,725 P 54,602,681 P 31,409,819 P - P 430,180,785 Additions 3,666,730 20,837,324 395,705 8,262,498 - 33,162,257 Depreciation and amortization charges for the year ( 44,714,095) ( 20,155,315) ( 6,861,103) ( 10,435,546 ) - ( 82,166,059 ) Balance at December 31, 2009 net of accumulated depreciation and amortization P 251,857,195 P 51,945,734 P 48,137,283 P 29,236,771 P - P 381,176,983
Balance at January 1, 2008, net of accumulated depreciation and amortization P 300,751,195 P 49,022,875 P 62,555,209 P 22,348,375 P 66,000,000 P 500,677,654 Additions 31,109,680 19,992,105 185,825 12,921,826 - 64,209,436 Transfers - - ( 16,607) ( 324,777 ) ( 66,000,000) ( 66,341,384 ) Depreciation and amortization charges for the year ( 38,956,315) ( 17,751,255) ( 8,121,746) ( 3,535,605 ) - ( 68,364,921 ) Balance at December 31, 2008 net of accumulated depreciation and amortization P 292,904,560 P 51,263,725 P 54,602,681 P 31,409,819 P - P 430,180,785
13. OTHER NON-CURRENT ASSETS
This account consists of:
2010 2009 2008
Goodwill P 264,768,344 P 264,768,344 P 264,768,344
Guarantee and
other deposits 174,767,810 135,516,056 99,014,532
Others 2,559,242 6,395,536 3,606,197
P 442,095,396 P 406,679,936 P 367,389,073
Goodwill is subject to impairment testing at least annually. No impairment losses were recognized in 2010, 2009 and 2008. Guarantee deposits pertain mainly to payments made for compliance with construction requirements in relation to the Group’s real estate projects.

- 43 -
14. INTEREST-BEARING LOANS AND BORROWINGS
Interest-bearing Loans and Borrowings account represents the following loans of the Group as of December 31:
2010 2009 2008
Current:
Megaworld Corporation P 1,203,380,952 P 736,690,476 P 232,000,000
ECOC 107,973,945 114,053,553 116,831,327
1,311,354,897 850,744,029 348,831,327
Non-current:
Megaworld Corporation 6,074,595,238 7,277,976,191 5,614,666,667
ECOC 53,988,238 171,081,667 292,079,687
6,128,583,476 7,449,057,858 5,906,746,354
P 7,439,938,373 P 8,299,801,887 P 6,255,577,681
In 2008, the Company signed a financing deal with local bank in which the Company may avail of a P5.0 billion unsecured loan, divided into Tranche A (P3.5 billion) and Tranche B (P1.5 billion). The Company had availed of P4.5 billion out of the P5.0 billion facility in 2008 while the remaining P500.0 million was availed of in 2009. The proceeds of the loan were used to fund the development of the Group’s various real estate projects. The loan is payable in seven years with a grace period of two years, divided into 21 consecutive equal quarterly payments. Interest is payable every quarter based on the Philippine Dealing System Treasury Fixing rate (PDSTF-R) plus a certain spread. In February 2009, the Company issued unsecured corporate notes to several financial institutions in the aggregate principal amount of P1.4 billion which will mature in seven years from the issue date. The principal repayments on this loan shall commence in February 2010 and interest shall be paid semi-annually based on a 9.0% annual interest rate. Also, in May 2009, the Company obtained an unsecured long-term loan from a local bank amounting to P500.0 million. The loan is payable for a term of seven years and interest is payable semi-annually based on a floating six-month PDSTF-R plus a certain spread, subject to semi-annual reprising. The remaining portion of the loans payable by the Company pertains to the balance of a long-term loan obtained in 2003 from a local bank with an original amount of P950.0 million which is payable in 10 years, inclusive of a three-year grace period on principal payments. Interest is payable every quarter based on 91-day treasury bill plus a certain spread. The Company also obtained an additional loan with original amount of P403.0 million in 2006 from the same local bank subject to the same terms and conditions. Collateral for the loans consisted of a mortgage over certain investment property of the Company (see Note 11).

- 44 -
The amount payable by ECOC pertains to the balance of a long-term loan facility obtained in 2002 with an original amount of U.S.$25 million (approximately P1.3 billion) from a foreign financial institution. The proceeds of the loan were used in the construction of several information technology buildings at the Eastwood CyberPark which is operated by ECOC. The drawdown from the loan facility amounting to U.S.$20 million (P1.06 billion) was made on October 15, 2002. The loan is payable in 10 years, inclusive of a two-and-a-half year grace period on principal payment. Interest is payable every six months at London Inter-bank Offer Rate plus certain spread. Collaterals for the loan consisted of a mortgage over ECOC’s certain Investment Property (see Note 11), and a full guarantee from the parent company. The Group complied with loan covenants, including maintaining certain financial ratios at the reporting date. Total finance costs attributable to these loans amounted to P620.6 million, P647.0 million, and P394.4 million in 2010, 2009 and 2008, respectively. Of these amounts, the balance of the interest is presented as part of Finance Costs under Interest and Other Charges - net in the consolidated statements of income (see Note 20). Interest charges capitalized in 2010 and 2009 amount to P384.1 million and P408.0 million, respectively. Capitalization rate used in determining the amount of interest charges qualified for capitalization is 8.29%. There were no interest charges capitalized in 2008.
15. BONDS PAYABLE
On November 18, 2009, the Group issued P5.0 billion fixed rate unsecured bonds with a term of five years and six months which bear an interest of 8.46% per annum. The bonds were issued at par and will be redeemed at 100% of the face value on maturity date. The proceeds received are intended to be used by the Group to finance its capital expenditures from 2009 until 2011 mainly for the development of its real estate projects. Interest charges capitalized arising from these bonds amounted to P423.0 million and P50.5 million in 2010 and 2009, respectively.
On August 4, 2006, the Group issued five-year term bonds totalling U.S.$100 million at a discount of U.S.$1.5 million. The bonds bear interest at 7.875% per annum payable semi-annually in arrears every February 4 and August 4 of each year, starting on February 4, 2007. The bond will mature in August 2011. Interest expense from bonds payable is presented as part of Finance Costs under Interest and Other Charges in the consolidated statements of income (see Note 20). During 2008, RHGI bought a portion of the five-year term bonds aggregating to U.S.$22.2 million (P1.1 billion) and these were classified as financial assets at FVTPL by RHGI. The bonds’ fair market value as of December 31, 2010, 2009 and 2008 amounted to U.S.$22.2 million (P972.4 million), U.S.$20.5 million (P950.3 million) and U.S.$20.5 million (P972.7 million), respectively. The effects of this transaction were eliminated in the preparation of consolidated financial statements.

- 45 -
16. TRADE AND OTHER PAYABLES
This account consists of:
2010 2009 2008
Trade P 2,203,109,184 P 2,141,390,249 P 1,557,670,470
Retention 1,211,950,863 1,022,182,625 746,002,184
Accrued interest 285,314,152 278,921,115 178,849,672
Accrued construction cost 77,369,336 119,191,945 126,320,491
Miscellaneous 259,969,813 100,687,324 80,179,855
P 4,037,713,348 P 3,662,373,258 P 2,689,022,672
Trade payables mainly represent obligations to subcontractors and suppliers of construction materials for the Group’s projects. Retention payable pertains to amount withheld from payments made to contractors to ensure compliance and completion of contracted projects equivalent to 10% of every billing made by the contractor. Upon completion of the contracted projects, the amounts are returned to the contractors. Miscellaneous payable consist primarily of withholding taxes payable and accrual of salaries and wages and utilities.
17. OTHER LIABILITIES
This account consists of:
2010 2009 2008
Current:
Unearned income P 939,203,207 P 917,778,341 P 724,444,707
Deferred rent 797,618,036 429,664,920 203,755,106
Other payables 4,843,817 - 3,551,786
P 1,741,665,060 P 1,347,443,261 P 931,751,599
Non-current:
Deferred rent P 732,378,814 P 554,608,690 P 320,518,099
Other payables 286,744,561 459,210,071 531,271,278
P 1,019,123,375 P 1,013,818,761 P 851,789,377
Other payables is mainly comprised of commission payable to the Group’s real estate agents.

- 46 -
18. OPERATING EXPENSES
Presented below are the details of this account. Notes 2010 2009 2008
Commission P 467,977,819 P 471,837,004 P 418,549,272
Depreciation and
amortization 11, 12 443,203,639 365,795,590 238,834,323
Salaries and employee
benefits 21 437,045,219 343,257,217 310,302,336
Advertising and
promotions 189,619,585 148,996,615 147,650,445
Utilities and supplies 141,065,957 79,752,963 118,649,476
Taxes and licenses 110,188,073 134,286,970 97,278,394
Transportation 103,626,296 100,083,640 172,123,399
Professional fees and
outside services 68,426,284 28,773,878 30,601,649
Rent 60,263,992 47,103,336 94,944,445
Association dues 51,261,055 28,355,868 31,242,652
Miscellaneous 67,547,715 59,877,805 84,802,101
P 2,140,225,634 P 1,808,120,886 P 1,744,978,492
19. EQUITY IN NET EARNINGS OF ASSOCIATES, INTEREST AND OTHER INCOME – Net
Presented below are the details of this account.
Notes 2010 2009 2008
Interest income P 835,944,617 P 690,238,144 P 1,486,040,236
Gain on sale of
AFS financial
assets 646,720,788 - -
Equity in net
earnings of
associates 10 442,281,307 157,958,213 109,464,838
Construction
income – net 101,962,175 26,473,236 216,754,914
Fair value gains – net 7 83,500,000 24,100,000 -
Dividend income 40,630,134 44,247,127 48,880,085
Foreign currency
gains – net 3,908,758 - -
Miscellaneous – net 59,794,552 32,571,224 93,802,697
P 2,214,742,331 P 975,587,944 P 1,954,942,770
In 2008, RHGI entered into contracts wherein it sold certain European bond put options and knock-out put options. In consideration of these contracts, RHGI received premiums amounting to U.S.$2,094,000 (P93,129,812) in 2008, which are shown as part of Miscellaneous Income above.

- 47 -
20. INTEREST AND OTHER CHARGES - Net
Presented below are the details of this account.
Notes 2010 2009 2008
Finance costs 14, 15 P 516,440,321 P 556,326,705 P 766,416,111
Underwriting fees - 21,505,376 -
Foreign currency
losses – net 7 - 8,464,596 176,988,434
Fair value losses – net 7 - - 42,653,717
Miscellaneous – net 7 27,960,793 1,247,492 4,726,236
P 544,401,114 P 587,544,169 P 990,784,498
21. EMPLOYEE BENEFITS
21.1 Salaries and Employee Benefits Expenses recognized for salaries and employee benefits are presented below (see Note 18).
2010 2009 2008
Salaries and wages P 271,233,637 P 229,301,717 P 196,098,245
Retirement benefit expense 37,271,665 23,547,960 34,747,913
13th month and other
employee benefits 128,539,917 90,407,540 79,456,178
P 437,045,219 P 343,257,217 P 310,302,336
21.2 Post-employment Benefit
The Group maintains a funded, tax-qualified, non-contributory retirement plan that is
being administered by a trustee covering all regular full-time employees. Actuarial valuations are made annually to update the retirement benefit costs and the amount of contributions.
The amounts of retirement benefit obligation, presented as non-current liability in the
consolidated statements of financial position, are determined as follows: 2010 2009 2008
Present value of the obligation P 209,714,448 P 163,802,833 P 91,871,990
Fair value of plan assets ( 53,207,861) ( 40,427,396 ) ( 26,200,243 )
Deficiency of plan assets 156,506,587 123,375,437 65,671,747
Unrecognized actuarial
gains (losses) ( 40,467,402) ( 32,607,917) 15,547,813
P 116,039,185 P 90,767,520 P 81,219,560

- 48 -
The movements in the present value of the retirement benefit obligation recognized in the books are as follows:
2010 2009 2008
Balance at beginning of year P 163,802,833 P 91,871,990 P 128,399,196
Actuarial loss (gain) 11,732,057 47,992,843 ( 70,297,468 )
Current service costs 23,934,917 14,995,640 23,074,609
Interest costs 15,086,241 10,363,160 10,695,653
Benefits paid ( 4,841,600) ( 1,420,800) -
Balance at end of year P 209,714,448 P 163,802,833 P 91,871,990
The movements in the fair value of plan assets are presented below.
2010 2009 2008
Balance at beginning of year P 40,427,396 P 26,200,243 P 21,000,000
Expected return on plan assets 2,425,644 1,545,814 651,000
Contributions paid into the plan 12,000,000 14,000,000 9,000,000
Actuarial gain (loss) 3,196,421 102,139 ( 4,450,757 )
Benefits paid ( 4,841,600) ( 1,420,800) -
Balance at end of year P 53,207,861 P 40,427,396 P 26,200,243
The Group’s plan assets as of December 31, 2010, 2009 and 2008 are solely in the form of cash and cash equivalents which are being administered by a trustee. The contributions to the plan are made annually by the Company based on availability of funds. The amounts of retirement benefits expense recognized in the consolidated statements of income are as follows:
2010 2009 2008
Current service costs P 23,934,917 P 14,995,640 P 23,074,609
Interest costs 15,086,241 10,363,160 10,695,653
Expected return on
plan assets ( 2,425,644) ( 1,545,814 ) ( 651,000)
Net actuarial losses (gains)
recognized during
the year 676,151 ( 265,026 ) 1 ,628,651
P 37,271,665 P 23,547,960 P 34,747,913
Presented below are the historical information related to the present value of the retirement benefit obligation, fair value of plan assets and deficiency of plan assets.
2010 2009 2008 2007 2006
Present value of the obligation P 209,714,448 P 163,802,833 P 91,871,990 P 128,399,196 P 51,601,897 Fair value of plan assets ( 53,207,861) ( 40,427,396) ( 26,200,243) ( 21,000,000 ) ( 5,000,000 ) Deficiency of plan assets P 156,506,587 P 123,375,437 P 65,671,747 P 107,399,196 P 46,601,897

- 49 -
In determining the amount of retirement benefit obligation, the following actuarial assumptions were used:
2010 2009 2008
Discount rates 9.2% 11.3% 8.3%
Expected rate of return on
plan assets 6.0% 5.9% 3.1%
Expected rate of salary increase 10.0% 10.0% 10.0%
Assumptions regarding future mortality are based on published statistics and mortality tables. The average life expectancy of an individual retiring at the age of 65 is 29 for both males and females.
22. TAXES
22.1 Current and Deferred Tax
The components of tax expense (income) as reported in the consolidated statements of income and consolidated statements of comprehensive income are as follows:
2010 2009 2008
Reported in consolidated statements of income:
Current tax expense:
Regular corporate income tax
(RCIT) at 30% in 2010 and
and 2009 and 35% in 2008 P 813,802,554 P 512,512,346 P 463,489,162
Final tax at 20% and 7.5% 111,933,084 86,375,275 87,996,370
Special tax rate at 5% 19,479,041 15,866,373 14,373,247
Minimum corporate income
tax (MCIT) at 2% 425,765 26,324 97,773
945,640,444 614,780,318 565,956,552
Deferred tax expense relating to
origination and reversal of
temporary differences 663,461,081 822,760,813 385,144,752
P 1,609,101,525 P 1,437,541,131 P 951,101,304
Reported in consolidated statements of
comprehensive income –
Deferred tax expense (income)
relating to origination and reversal
of temporary differences (P 55,967,408) ( P 26,041,986) P 11,728,077

- 50 -
A reconciliation of tax on pretax profit computed at the applicable statutory rates to income tax expense reported in the consolidated statements of income is as follows:
2010 2009 2008
Tax on pretax profit at 30% in 2010 and 2009
and 35% in 2008 P 2,008,384,239 P 1,651,246,082 P 1,660,969,642
Adjustment for income subjected to
lower income tax rates ( 152,228,235 ) ( 139,778,356 ) ( 156,474,496 )
Tax effects of:
Non-taxable income ( 462,560,168 ) ( 170,042,598 ) ( 921,295,050 )
Non-deductible expenses 214,450,368 50,688,383 496,265,189
Dividend income ( 52,444,145 ) ( 1,356,764 ) ( 45,613,386 )
Non-deductible interest expense 49,245,102 38,308,284 60,251,011
Unrecognized deferred tax assets 10,225,726 3,514,346 934,000
Excess of optional standard deduction
over itemized deductions ( 5,784,318 ) ( 3,672,931 ) -
Net operating loss carry over (NOLCO) 1,000,962 8,483,984 11,121,784
Reduction in deferred tax rate - - ( 150,082,436 )
Miscellaneous ( 1,188,006 ) 150,701 ( 4,974,954 )
Tax expense P 1,609,101,525 P 1,437,541,131 P 951,101,304
The deferred tax assets and liabilities relate to the following as of December 31:
2010 2009 2008
Deferred tax assets:
NOLCO P 4,141,606 P 4,935,423 P 44,797
Retirement benefit obligation 3,186,559 2,585,319 1,987,731
Accrued rent expense 68,417 218,344 358,495
Allowance for impairment
on receivables - - 24,859
Others 463,957 148,627 2,391
P 7,860,539 P 7,887,713 P 2,418,273
Deferred tax liabilities:
Uncollected gross profit P 2,697,434,301 P 2,294,929,189 P 1,527,833,787
Capitalized interest 443,717,090 222,651,148 108,100,501
Difference between the tax
reporting base and financial
reporting base of:
Investment property 201,696,863 148,804,564 172,865,496
Property and equipment ( 19,790,916) ( 20,050,630 ) ( 19,478,257 )
Translation adjustments ( 70,281,317) ( 14,313,909 ) 11,728,077
Accrued retirement cost ( 43,301,756) ( 33,170,257 ) ( 33,095,868 )
Uncollected rental income - - 32,091,485
Others 39,556,389 42,713,450 43,308,540
P 3,249,030,654 P 2,641,563,555 P 1,843,353,761

- 51 -
The components of deferred tax expense (income) are as follows: Consolidated Consolidated Statements Statements of Income of Comprehensive Income 2010 2009 2008 2010 2009 2008 Changes in deferred tax assets: NOLCO P 793,817 ( P 4,890,626 ) ( P 231,143 ) P - P - P - Retirement benefit obligation ( 601,240 ) ( 597,588 ) ( 340,712 ) - - - Accrued rent expense 149,927 140,151 55,402 - - - Allowance for impairment losses on receivables - 24,859 947,948 - - - Depreciation expense - - ( 7,667 ) - - - Others ( 315,330) ( 146,236 ) ( 425,483 ) - - - Changes in deferred tax liabilities: Uncollected gross profit 402,504,512 767,095,402 359,278,205 - - - Capitalized interest 221,065,942 114,550,647 ( 26,071,447 ) - - - Difference between tax reporting base and financial reporting base of: - Investment property 52,892,299 ( 24,060,932 ) 32,345,673 - - - - Property and equipment 259,714 ( 572,373 ) 2,592,215 - - - Translation adjustments - - - ( 55,967,408 ) ( 26,041,986 ) 11,728,077 Accrued retirement cost ( 10,131,499 ) ( 74,389 ) ( 6,330,792 ) - - - Uncollected rental income - ( 32,091,485 ) 26,374,103 - - - Amortization of preoperating expenses - - 30,415 - - - Others ( 3,157,061 ) 3,383,383 ( 3,071,965 ) - - - Deferred Tax Expense (Income) P 663,461,081 P822,760,813 P 385,144,752 ( P 55,967,408 ) ( P 26,041,986) P11,728,077
No deferred tax liability has been recognized on the accumulated equity in net earnings of associates. The Group has no liability for tax should the amounts be declared as dividends since dividend income received from domestic corporation is not subject to income tax. Majority of the entities within the Group are subject to the MCIT which is computed at 2% of gross income, as defined under the tax regulations. The details of MCIT paid by certain subsidiaries, which can be applied as deduction from their respective future RCIT payable within three years from the year the MCIT was incurred, are shown below. Valid Subsidiary Year incurred Amount Until MNPHI 2010 P 233,530 2013 2009 230,427 2012 MLI 2010 37,479 2013 2008 83,571 2011 FTPHI 2010 7,052 2013 2009 2,386 2012 2008 1,909 2011 P 596,354 Certain subsidiaries within the Group did not recognize the deferred tax assets on their MCIT.

- 52 -
The details of NOLCO incurred by certain subsidiaries, which can be claimed as deduction from their respective future taxable income within three years from the year the loss was incurred, are shown below. Valid Subsidiary Year incurred Amount Until MCPI 2009 P 29,346,465 2012 2008 27,347,116 2011 MLI 2010 12,118,518 2013 2009 9,932,923 2012 2008 4,950,545 2011 OPI 2010 4,508,189 2013 2009 4,036,439 2012 2008 4,169,609 2011 MNPHI 2010 227,849 2013 2009 189,760 2012 FTPHI 2010 159,226 2013 2009 323,508 2012 2008 72,322 2011 PIPI 2010 81,682 2013 2009 83,140 2012 P 97,547,291 Certain subsidiaries within the Group did not recognize the deferred tax assets on their NOLCO. The aggregated amounts of assets, retained earnings (deficit), revenues and net profit (loss) of the subsidiaries which incurred NOLCO are as follows: 2010 Retained Earnings Net Profit
Assets (Deficit) Revenues (Loss)
OPI P 924,044,751 ( P 11,869,688) P 5,409 ( P 3,231,949 )
MLI 163,934,861 ( 59,590,765) 4,467,567 7,673,047
FTPHI 126,445,219 24,324,992 967,688 84,000,630
MNPHI 88,640,039 2,485,828 75,840,143 334,225
MCPI 73,900,576 ( 136,355,521) 68,714,334 ( 40,417,472 )
PIPI 5,049,628 ( 16,522) 40,251 ( 47,949 )
P 1,382,015,074 (P 181,021,676) P 150,035,392 P 48,310,532

- 53 -
2009
Retained Earnings Net Profit
Assets (Deficit) Revenues (Loss)
OPI P 889,329,679 (P 8,637,739 ) P 23,930 ( P 2,808,135 )
GPMAI 658,718,614 251,993,072 2,554,950 938,907
MLI 191,642,758 ( 51,917,718 ) 2,334,341 ( 12,171,355 )
MREI 63,360,474 814,274 1,345,935 1,030,840
MCPI 47,291,076 ( 96,024,989 ) 5,672,878 29,399,277
FTPHI 42,639,638 ( 59,675,638 ) 136,043 23,886,928
PIPI 5,094,427 31,427 49,960 ( 40,055 )
P 1,898,076,666 P 36,582,689 P 12,118,037 P 40,236,407
2008
GPMAI P 308,020,556 P 250,064,414 P - P 962,384
MLI 202,369,120 242,937,331 7,258,976 ( 3,355,478 )
MCPI 43,726,583 79,102,295 4,570,750 ( 27,278,908 )
PIPI 5,131,482 60,000 185,846 132,358
P 559,247,741 P 572,164,040 P 12,015,572 (P 29,539,644 )
Management has assessed that the net losses incurred, as well as the related NOLCO, can be recovered through future operations and are not significant to the overall financial condition and financial performance of the Group. 22.2 Optional Standard Deduction
Effective July 2008, Republic Act (RA) 9504 was approved giving corporate taxpayers
an option to claim itemized deductions or optional standard deduction (OSD) equivalent to 40% of gross sales. Once the option to use OSD is made, it shall be irrevocable for that particular taxable year.
In 2010, 2009 and 2008, the Group opted to continue claiming itemized deductions,
except for MDC which opted to use OSD for 2010 and 2009. 22.3 Change in Applicable Tax Rate
In accordance with RA 9337, RCIT rate was reduced from 35% to 30% and nonallowable deductions for interest expense from 42% to 33% of interest income subjected to final tax effective January 1, 2009.
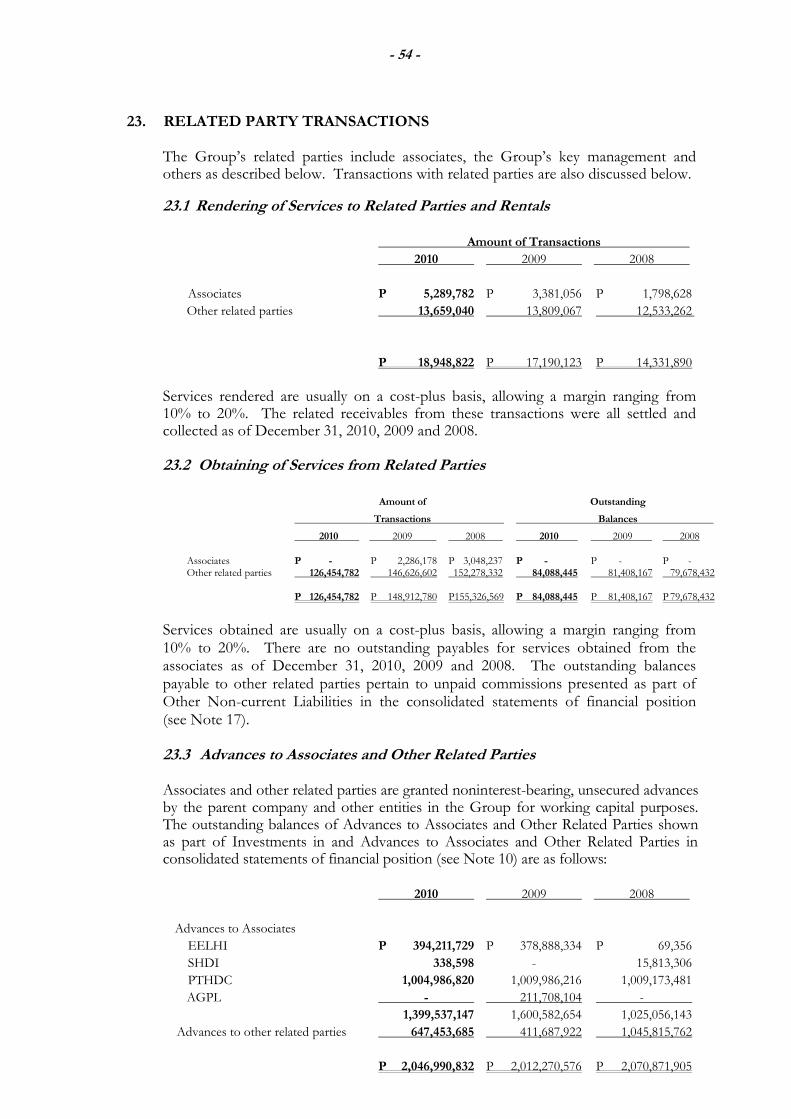
- 54 -
23. RELATED PARTY TRANSACTIONS
The Group’s related parties include associates, the Group’s key management and others as described below. Transactions with related parties are also discussed below.
23.1 Rendering of Services to Related Parties and Rentals
Amount of Transactions
2010 2009 2008
Associates P 5,289,782 P 3,381,056 P 1,798,628
Other related parties 13,659,040 13,809,067 12,533,262
P 18,948,822 P 17,190,123 P 14,331,890
Services rendered are usually on a cost-plus basis, allowing a margin ranging from 10% to 20%. The related receivables from these transactions were all settled and collected as of December 31, 2010, 2009 and 2008.
23.2 Obtaining of Services from Related Parties
Amount of Outstanding
Transactions Balances
2010 2009 2008 2010 2009 2008
Associates P - P 2,286,178 P 3,048,237 P - P - P - Other related parties 126,454,782 146,626,602 152,278,332 84,088,445 81,408,167 79,678,432 P 126,454,782 P 148,912,780 P155,326,569 P 84,088,445 P 81,408,167 P 79,678,432
Services obtained are usually on a cost-plus basis, allowing a margin ranging from 10% to 20%. There are no outstanding payables for services obtained from the associates as of December 31, 2010, 2009 and 2008. The outstanding balances payable to other related parties pertain to unpaid commissions presented as part of Other Non-current Liabilities in the consolidated statements of financial position (see Note 17). 23.3 Advances to Associates and Other Related Parties
Associates and other related parties are granted noninterest-bearing, unsecured advances by the parent company and other entities in the Group for working capital purposes. The outstanding balances of Advances to Associates and Other Related Parties shown as part of Investments in and Advances to Associates and Other Related Parties in consolidated statements of financial position (see Note 10) are as follows:
2010 2009 2008
Advances to Associates
EELHI P 394,211,729 P 378,888,334 P 69,356
SHDI 338,598 - 15,813,306
PTHDC 1,004,986,820 1,009,986,216 1,009,173,481
AGPL - 211,708,104 -
1,399,537,147 1,600,582,654 1,025,056,143
Advances to other related parties 647,453,685 411,687,922 1,045,815,762
P 2,046,990,832 P 2,012,270,576 P 2,070,871,905

- 55 -
Advances to other related parties pertain to advances granted to entities under common ownership of the ultimate parent company.
23.4 Advances from Other Related Parties Certain expenses of the entities within the Group are paid by other related parties on behalf of the former. The outstanding balances from these transactions are presented as Advances from Other Related Parties account in the consolidated statements of financial position and are broken down as follows:
2010 2009 2008
EELHI P 209,116,174 P 547,523,599 P 721,047,847
TIHGI 12,906,530 - -
Others 67,845,553 78,412,882 115,210,399
P 289,868,257 P 625,936,481 P 836,258,246
23.5 Key Management Personnel Compensations The Group’s key management personnel compensation includes the following:
2010 2009 2008
Short-term benefits P 47,174,219 P 42,243,477 P 38,009,337
Post-employment benefits 4,962,292 4,437,829 4,002,041
P 52,136,511 P 46,681,306 P 42,011,378
24. EQUITY
Capital stock consists of: Shares Amount
2010 2009 2008 2010 2009 2008
Preferred shares Series A
– P0.01 par value
Authorized 6,000,000,000 6,000,000,000 6,000,000,000 P 60,000,000 P 60,000,000 P 60,000,000
Issued and outstanding: 6,000,000,000 6,000,000,000 6,000,000,000 P 60,000,000 P 60,000,000 P 60,000,000
Common shares – P1 par value
Authorized 30,140,000,000 30,140,000,000 30,140,000,000 P 30,140,000,000 P 30,140,000,000 P 30,140,000,000
Issued and outstanding:
Balance at beginning of year 25,769,203,626 20,641,646,901 20,641,646,901 P 25,769,203,626 P 20,641,646,901 P 20,641,646,901
Issued during the year - 5,127,556,725 - - 5,127,556,725 -
Balance at end of year 25,769,203,626 25,769,203,626 20,641,646,901 P 25,769,203,626 P 25,769,203,626 P 20,641,646,901
Subscribed:
Balance at beginning of year - - - P - P P -
Subscribed during the year - 5,127,556,725 - - 5,127,556,725 -
Issued during the year - ( 5,127,556,725 ) - - ( 5,127,556,725 ) -
Balance at end of year - - - P - P - P -
Total Capital Stock P 25,829,203,626 P 25,829,203,626 P 20,701,646,901

- 56 -
24.1 Preferred Shares Series “A”
The preferred shares are voting, cumulative, non-participating, non-convertible and non-redeemable with a par value of P0.01 per share. The shares earn dividends at 1% of par value per annum cumulative from date of issue. Dividends paid on cumulative preferred shares amounted to P600,000 in 2010, 2009 and 2008. 24.2 Common Shares On April 28, 2009, the Company offered 5,127,556,725 common shares, by way of pre-emptive stock rights offering, to eligible existing common shareholders at the rate of one right for every four common shares held as of May 4, 2009 at an exercise price of P1 per share. Moreover, shareholders were given four additional stock warrants for every five stock rights subscribed. For every stock warrant, shareholders can avail of one common share at P1 per share. As a result of the stock rights offering, 5,127,556,725 common shares were subscribed and issued on June 1, 2009. Of the total exercise price, 50% was paid as of May 31, 2009 and the remaining 50% shall be paid within one year from issue date. Unpaid subscriptions amounted to P2.3 billion as of December 31, 2009 and are presented as Subscriptions Receivable under the current assets section of the 2009 consolidated statement of financial position. The amount was fully paid by the subscribers in 2010. Relative to the issuance of pre-emptive stock rights, 4,102,045,380 stock warrants were issued and these will be exercisable beginning on the second year until five years from issue date. 24.3 Additional Paid-in Capital
The additional paid-in capital pertains to the excess of the total proceeds received from the Company’s shareholders over the total par value of the common shares. There were no movements in the Company’s Additional Paid-in Capital accounts in 2010, 2009 and 2008. 24.4 Cash Dividends
The details of the Company’s cash dividend declarations, both for preferred and common shares, are as follows:
2010 2009 2008
Declaration date / date
of approval by BOD May 18, 2010 June 19, 2009 June 5, 2008
Date of record July 6, 2010 July 17, 2009 July 4, 2008
Date paid July 30, 2010 August 12, 2009 July 30, 2008
Amounts declared and paid P 479,885,465 P 479,061,765 P 402,353,813
On May 18, 2010, MDC’s BOD approved the declaration of cash dividends amounting to P100.0 million to stockholders of record as of said date. Out of the P100.0 million dividends declared, P60.0 million was eliminated during consolidation.

- 57 -
24.5 Treasury Shares
In 2008, the Company’s BOD approved the buy-back of shares of up to P2.0 billion worth of common shares in the open market at prevailing market prices. The share buy-back program is made through the trading facilities of the PSE and the funds used for the buy-back were taken from internally-generated funds. As of December 31, 2008, the Company reacquired 131.4 million shares at a total cost of P118.6 million. This account also includes the Company’s common shares held and acquired by RHGI and GPMAI. The number of treasury common shares aggregated to 537.4 million as of December 31, 2009 and 2008. The changes in market values of these shares recognized as fair value gains (losses) by RHGI and GPMAI were eliminated in full and were not recognized in the consolidated financial statements. Accordingly, in 2010, the cost of the treasury held by GPMAI of P555.1 million was removed from the Treasury Stock account presented under equity. GPMAI was deconsolidated starting 2010 (see Note 10). A portion of the Company’s retained earnings is restricted up to the cost of treasury stock as of the end of the reporting period.
25. EARNINGS PER SHARE
Earnings per share amounts were computed as follows:
2010 2009 2008
Net profit attributable to
parent company’s shareholders P 5,026,180,575 P 4,055,401,191 P 3,771,127,007
Dividends on cumulative
preferred shares series “A” ( 600,000) ( 600,000 ) ( 600,000)
Profit available to parent company’s
common shareholders P 5,025,580,575 P 4,054,801,191 P 3,770,527,007
Divided by weighted number
of outstanding common shares 25,130,015,061 23,088,192,857 20,132,817,980
Basic and diluted
earnings per share P 0.200 P 0.176 P 0.187
There were no outstanding convertible preferred shares and bonds or other stock
equivalents that may be considered as potential dilutive common shares as of December 31, 2010, 2009 and 2008.

- 58 -
26. COMMITMENTS AND CONTINGENCIES
26.1 Operating Lease Commitments – Group as Lessor The Group is a lessor under several operating leases covering real estate properties for commercial use (see Note 11). The leases have terms ranging from 3 to 20 years, with renewal options, and include annual escalation rates of 5% to 10%. The average annual rental covering these agreements amounts to about P2.7 billion for the consolidated balances. Future minimum lease payments receivable under these agreements are as follows:
2010 2009 2008
Within one year P 3,145,772,222 P 3,000,082,437 P 2,001,508,184
After one year but not
more than five years 14,998,070,516 10,809,294,660 7,582,583,273
More than five years 4,731,453,360 3,410,016,874 1,922,768,964
P 22,875,296,098 P 17,219,393,971 P 11,506,860,421
26.2 Operating Lease Commitments – Group as Lessee The Group is a lessee under several operating leases covering condominium units for administrative use. The leases have terms ranging from 1 to 11 years, with renewal options, and include a 5% to 10% annual escalation rate. The average annual rental covering these agreements amounts to about P10.0 million for the consolidated balances. The future minimum rental payables under these non-cancelable leases as of December 31, are as follows:
2010 2009 2008
Within one year P 12,247,168 P 16,891,737 P 17,583,865
After one year but not
more than five years 19,039,825 17,951,311 26,489,885
More than five years 18,908,935 23,528,646 27,886,864
P 50,195,928 P 58,371,694 P 71,960,614 26.3 Others There are commitments, guarantees and contingent liabilities that arise in the normal course of operations of the Group which are not reflected in the accompanying consolidated financial statements. The management of the Group is of the opinion that losses, if any, from these items will not have any material effect on its consolidated financial statements.

- 59 -
27. RISK MANAGEMENT OBJECTIVES AND POLICIES
The Group has various financial instruments such as cash and cash equivalents, financial assets at FVTPL, AFS securities, bank loans, bonds, trade receivables and payables which arise directly from the Group’s business operations. The financial liabilities were issued to raise funds for the Group’s capital expenditures. The Group does not actively engage in the trading of financial assets for speculative purposes. 27.1 Foreign Currency Sensitivity
Most of the Group’s transactions are carried out in Philippine pesos, its functional currency. Exposures to currency exchange rates arise mainly from the Group’s U.S. dollar-denominated cash and cash equivalents, and bonds payable which have been used to fund new projects. Foreign currency-denominated financial assets and liabilities, translated into Philippine pesos at the closing rate are as follows:
2010 2009 2008 U.S. Dollars Pesos U.S. Dollars Pesos U.S. Dollars Pesos Financial assets $ 245,812,793 P10,790,198,346 $ 186,778,590 P 8,658,308,333 $ 138,542,551 P 6,578,693,016 Financial liabilities ( 7,098,646) ( 311,602,166) ( 87,449,638 ) ( 4,053,815,436) ( 90,043,539 ) ( 4,275,717,458 ) $ 238,714,147 P10,478,596,180 $ 99,328,952 P 4,604,492,897 $ 48,499,012 P 2,302,975,558
The following table illustrates the sensitivity of the consolidated net results for the year in regards to the Group’s financial assets and financial liabilities as shown previously and the U.S. dollar – Philippine peso exchange rate:
Increase (decrease) Effect on consolidated profit before tax
in exchange rate 2010 2009 2008
P1 P 238,714,147 P 99,328,952 P 48,499,011
(P1) ( 238,714,147) ( 99,328,952 ) ( 48,499,011)
Exposures to foreign exchange rates vary during the year depending on the volume of overseas transactions and only affect consolidated profit or loss of the Group. There are no exposures on foreign exchange rate that affect the Group’s other comprehensive income (loss). Nonetheless, the analysis above is considered to be representative of the Group’s currency risk. 27.2 Interest Rate Sensitivity The Group interest risk management policy is to minimize interest rate cash flow risk exposures to changes in interest rates. The Group maintains a debt portfolio unit of both fixed and floating interest rates. These long-term borrowings and all other financial assets and liabilities are subject to variable interest rates.
The Group’s ratio of fixed to floating rate debt stood at 88.12, 87.13 and 86.14 as of December 31, 2010, 2009 and 2009, respectively.

- 60 -
The following table illustrates the sensitivity of the consolidated net result for the year and consolidated equity to a reasonably possible change in interest rates of +1% and –1% in 2010, 2009 and 2008. The calculations are based on the Group’s financial instruments held at each reporting date. All other variables are held constant.
2010 2009 2008 +1% -1% +1% -1% +1% -1% Consolidated net results for the year (P 15,873,037) P 15,873,037 (P 23,850,402) P 23,850,402 ( P 30,111,330 ) P 30,111,330 Consolidated equity ( 11,111,126) 11,111,126 ( 16,695,282) 16,695,282 ( 19,572,364 ) 19,572,364
27.3 Credit Risk Generally, the Group’s credit risk is attributable to trade receivables, rental receivables and other financial assets. The Group maintains defined credit policies and continuously monitors defaults of customers and other counterparties, identified either individually or by group, and incorporate this information into its credit risk controls. Where available at a reasonable cost, external credit ratings and/or reports on customers and other counterparties are obtained and used. The Group’s policy is to deal only with creditworthy counterparties. In addition, for a significant proportion of sales, advance payments are received to mitigate credit risk. Generally, the maximum credit risk exposure of financial assets is the carrying amount of the financial assets as shown in the consolidated statements of financial position (or in the detailed analysis provided in the notes to consolidated financial statements), as summarized below.
Notes 2010 2009 2008
Cash and cash
equivalents 5 P 22,031,584,943 P 20,876,005,473 P 12,325,333,064
Trade and other
receivables 6 29,040,792,116 23,713,732,228 17,699,223,385
Advances to associates
and other related
parties 10, 23.3 2,046,990,832 2,012,270,576 2,070,871,905
AFS financial assets 8 675,467,827 148,299,890 3,273,653,414
P 53,794,835,718 P 46,750,308,167 P 35,369,081,768
(a) Cash and Cash Equivalents
The credit risk for cash and cash equivalents is considered negligible since the counterparties are reputable banks with high quality external credit ratings.
(b) Trade and Other Receivables
All trade receivables are subject to credit risk exposure. However, the Group does not identify specific concentrations of credit risk with regard to Trade and Other Receivables as the amounts recognized resemble a large number of receivables from various customers. Certain receivables from trade customers are covered by post-dated checks. Certain past due accounts are not provided with allowance for impairment to the extent of the expected market value of the property sold to the customer. The title to the real estate properties remains with the Group until the receivables are fully collected.

- 61 -
27.4 Liquidity Risk The Group manages its liquidity needs by carefully monitoring scheduled debt servicing payments for long-term financial liabilities as well as cash outflows due in a day-to-day business. Liquidity needs are monitored in various time bands, on a day-to-day and week-to-week, as well as on the basis of a rolling 30-day projection. Long-term needs for a six-month and one-year period are identified monthly. The Group maintains cash to meet its liquidity requirements for up to 60-day periods. Excess cash is invested in time deposits or short-term marketable securities. Funding for long-term liquidity needs is additionally secured by an adequate amount of committed credit facilities and the ability to sell long-term financial assets.
As at December 31, 2010, 2009 and 2008, the Group’s financial liabilities have contractual maturities which are presented below.
2010
Current Non-current
Within 6 to 12 1 to 5 Later
6 Months Months Years 5 Years
Interest-bearing loans and borrowings P 655,677,449 P 655,677,448 P 6,128,583,476 P - Bonds payable - 3,416,062,159 5,000,000,000 -
Trade and other payables 1,847,488,610 2,190,224,738 - -
Advances from other related parties - - 289,868,257 -
P2,503,166,059 P 6,261,964,345 P 11,418,451,733 P -
2009
Current Non-current
Within 6 to 12 1 to 5 Later
6 Months Months Years 5 Years
Interest-bearing loans and borrowings P 192,026,776 P 658,717,253 P 5,672,557,858 P 1,776,500,000 Bonds payable - - 8,608,407,826 -
Trade and other payables 1,474,550,021 2,187,823,237 - -
Advances from other related parties - - 625,936,481 -
P1,666,576,797 P 2,846,540,490 P14,906,902,165 P 1,776,500,000
2008
Current Non-current
Within 6 to 12 1 to 5 Later
6 Months Months Years 5 Years
Interest-bearing loans and borrowings P 174,415,663 P 174,415,664 P 5,257,857,465 P 648,888,889 Bonds payable - - 3,696,290,569 -
Trade and other payables 1,227,141,699 1,461,880,973 - -
Advances from other related parties - - 836,258,246 -
P1,401,557,362 P 1,636,296,637 P 9,790,406,280 P 648,888,889
The above contractual maturities reflect the gross cash flows, which may differ from the carrying values of the liabilities at the reporting dates.

- 62 -
27.5 Other Price Risk Sensitivity
The Group’s market price risk arises from its investments carried at fair value (financial assets classified as financial assets at FVTPL and AFS financial assets). It manages its risk arising from changes in market price by monitoring the changes in the market price of the investments. For corporate bonds and equity securities listed in other countries, an average volatility of 105%, 71% and 107% has been observed during 2010, 2009 and 2008, respectively. If quoted price for these securities increased or decreased by that amount, profit before tax would have changed by P2.7 billion, P14.6 million, P21.7 million in 2010, 2009 and 2008, respectively.
For equity securities listed in the Philippines, the observed volatility rates of the fair values of the Group’s investments held at fair value and their impact on the Group’s consolidated net profit in 2010 and consolidated equity as of December 31, 2010 are summarized as follows:
Observed Volatility Rates Impact of Increase Impact on Decrease Increase Decrease Net Profit Equity Net Profit Equity Investment in equity securities in: Holding company +51.53% -51.53% P 64,414,912 P 2,073,193,927 ( P 64,414,912 ) ( P 2,073,193,927 ) Property company +51.54% -51.54% - 71,024,936 - ( 71,024,936 ) P 64,414,912 P 2,144,218,863 ( P 64,414,912 ) (P2,144,218,863 )
This compares with the following volatility rates and impact on consolidated net profit in 2009 and 2008: 2009
Observed Volatility Rates Impact of Increase Impact on Decrease Increase Decrease Net Profit Equity Net Profit Equity Investment in equity securities in: Holding company +50.32% -50.32% P 20,883,283 P 900,762,327 ( P 20,883,283 ) (P 900,762,327) Property company +61.55% -61.55% - 85,613,014 - - P 20,883,283 P 986,375,341 ( P 20,883,283 ) (P 900,762,327 )
2008 Observed Volatility Rates Impact of Increase Impact on Decrease Increase Decrease Net Profit Equity Net Profit Equity Investment in equity securities in: Holding company +78.04% -78.04% P 240,225 P 426,127,945 ( P 240,225 ) (P 426,127,945 ) Property company +106.24% -106.24% - 145,010,939 - ( 145,010,939 ) Bank +111.21% -111.21% - 324,464 - ( 324,464 ) P 240,225 P 571,463,348 ( P 240,225 ) (P 571,463,348 )
The investments in listed equity securities are considered long-term strategic investments. In accordance with the Group’s policies, no specific hedging activities are undertaken in relation to these investments. The investments are continuously monitored and voting rights arising from these equity instruments are utilized in the Group’s favour.

- 63 -
28. CATEGORIES AND FAIR VALUES OF FINANCIAL ASSETS AND
LIABILITIES
28.1 Comparison of Carrying Amounts and Fair Values
The carrying amounts and fair values of the categories of financial assets and liabilities presented in the consolidated statements of financial position are shown below.
2010 2009 2008 Carrying Fair Carrying Fair Carrying Fair Values Values Values Values Values Values Financial Assets Loans and receivables: Cash and cash equivalents P 22,031,584,943 P 22,031,584,943 P 20,876,005,473 P 20,876,005,473 P 12,325,333,064 P 12,325,333,064 Trade and other receivables – net 29,040,792,116 29,040,792,116 23,713,732,228 23,713,732,228 17,699,223,385 17,699,223,385 Advances to associates and other related parties 2,046,990,832 2,046,990,832 2,012,270,576 2,012,270,576 2,070,871,905 2,070,871,905 P 53,119,367,891 P 53,119,367,891 P 46,602,008,277 P 46,602,008,277 P 32,095,428,354 P 32,095,428,354 Financial assets at FVTPL P 125,000,000 P 125,000,000 P 41,500,000 P 41,500,000 P 17,400,000 P 17,400,000 AFS financial assets: Equity instruments P 5,535,716,669 P 5,535,716,669 P 2,778,231,823 P 2,778,231,823 P 1,076,571,258 P 1,076,571,258 Debt instruments 675,467,827 675,467,827 148,299,890 148,299,890 3,273,653,414 3,273,653,414 P 6,211,184,496 P 6,211,184,496 P 2,926,531,713 P 2,926,531,713 P 4,350,224,672 P 4,350,224,672 Financial Liabilities Financial liabilities at amortized cost Interest-bearing loans and borrowings P 7,439,938,373 P 7,439,938,373 P 8,299,801,887 P 8,299,801,887 P 6,255,577,681 P 6,255,577,681 Bonds payable 8,416,062,159 8,416,062,159 8,608,407,826 8,608,407,826 3,696,290,569 3,696,290,569 Trade and other payables 4,037,713,348 4,037,713,348 3,662,373,258 3,662,373,258 2,689,022,672 2,689,022,672 Advances from other related parties 289,868,257 289,868,257 625,936,481 625,936,481 836,258,246 836,258,246 P 20,183,582,137 P 20,183,582,137 P 21,196,519,452 P 21,196,519,452 P 13,477,149,168 P 13,477,149,168
See Notes 2.5 and 2.9 for a description of the accounting policies for each category of financial instrument. A description of the Group’s risk management objectives and policies for financial instruments is provided in Note 27.
28.2 Fair Value Hierarchy
The Group’s investments in financial assets at FVTPL and AFS financial assets are comprised of equity and debt instruments listed in foreign and local stocks exchange. Fair value measurements of these financial assets were determined directly by reference to published prices quoted in an active market (Level 1 of the fair value hierarchy).

- 64 -
29. CAPITAL MANAGEMENT OBJECTIVES, POLICIES AND
PROCEDURES
The Group’s capital management objective is to ensure its ability to continue as a going concern and to provide an adequate return to shareholders by pricing products and services commensurately with the level of risk. The Group manages its capital structure and makes adjustments to it, in the light of changes in economic conditions. It monitors capital using the debt-to-equity ratio.
2010 2009 2008 Interest-bearing loans and
borrowings P 7,439,938,373 P 8,299,801,887 P 6,255,577,681
Bonds payable 8,416,062,159 8,608,407,826 3,696,290,569
P 15,856,000,532 P 16,908,209,713 P 9,951,868,250
Equity attributable to parent
company’s shareholders P 57,776,023,630 P 49,111,847,183 P 38,980,292,755
Debt-to-equity ratio 0.27 : 1 0.34 : 1 0.26 : 1
The Group has complied with its covenant obligations, including maintaining the required debt-to-equity ratio for the years presented above.
30. OTHER MATTERS
30.1 Registration with Philippine Economic Zone Authority (PEZA) ECOC, as operator of the Eastwood City CyberPark, is registered with PEZA. As a PEZA registered entity, it is entitled to a preferential tax rate of 5% on gross income earned from its PEZA registered activities, in lieu of all local and national taxes, and to other tax privileges. 30.2 International Organization for Standardization (ISO) Certification The parent company was awarded a Certificate of Registration ISO 9001:1994 effective November 26, 1999 by Certification International Philippines, Inc. Effective November 21, 2002, the parent company has upgraded its Certification to ISO 9001:2000 series. The scope of the certification covers all areas of the parent company’s operations, which include planning, design, project management and customer service for its real estate business. Among others, the parent company is required to undergo surveillance audits every six months.

- 65 -
30.3 Awards As a testament to the Company’s industry leadership, the Company was recognized by various award-giving bodies in 2009 and 2008 as follows: 2009
Best Investor Relations by Finance Asia
Best Managed Philippine Company by Finance Asia
Asia’s Best Managed Company by Finance Asia
2008
Small Cap Corporate of the Year by Asia Money Polls
Best in Investor Relations by Finance Asia
Best Managed Philippine Company by Finance Asia

MEGAWORLD CORPORATION INTERIM FINANCIAL STATEMENTS
AS OF 31 MARCH 2011

EXHIBIT 1MEGAWORLD CORPORATION AND SUBSIDIARIES
CONSOLIDATED STATEMENTS OF FINANCIAL POSITION
Unaudited Audited31-Mar-11 31-Dec-10
CURRENT ASSETSCash and cash equivalents 23,161,016 P 22,031,585 P Trade and other receivables - net 14,463,710 14,133,801 Financial assets at fair value through profit or loss 412,335 125,000 Residential and condominium units for sale 6,613,069 6,286,477 Property development costs 6,821,667 3,798,109 Prepayments and other current assets - net 476,480 437,228
Total Current Assets 51,948,277 46,812,200
NON-CURRENT ASSETSTrade and other receivables - net 16,807,474 15,617,214 Advances to landowners and joint ventures 2,708,026 2,708,027 Land for future development 1,864,734 1,482,561 Investment in available-for-sale securities 5,630,392 6,211,184 Investments in and advances to associates and other
related parties - net 13,792,287 13,671,333 Investment property - net 10,048,832 9,716,530 Property and equipment - net 371,925 360,518 Deferred tax assets 9,416 7,861 Other non-current assets 463,364 442,095
Total Non-current Assets 51,696,450 50,217,323
TOTAL ASSETS 103,644,727 P 97,029,523 P
(In Thousands)
A S S E T S
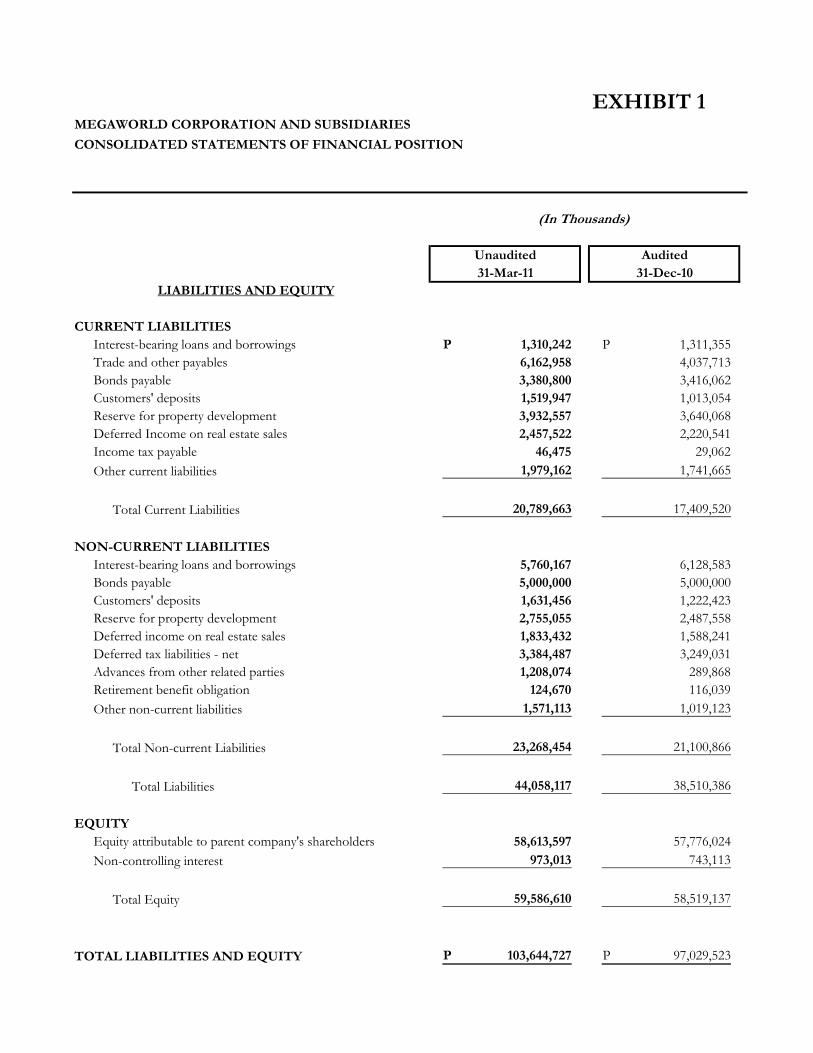
EXHIBIT 1MEGAWORLD CORPORATION AND SUBSIDIARIES
CONSOLIDATED STATEMENTS OF FINANCIAL POSITION
Unaudited Audited31-Mar-11 31-Dec-10
(In Thousands)
CURRENT LIABILITIESInterest-bearing loans and borrowings 1,310,242 P 1,311,355 P Trade and other payables 6,162,958 4,037,713 Bonds payable 3,380,800 3,416,062 Customers' deposits 1,519,947 1,013,054 Reserve for property development 3,932,557 3,640,068 Deferred Income on real estate sales 2,457,522 2,220,541 Income tax payable 46,475 29,062 Other current liabilities 1,979,162 1,741,665
Total Current Liabilities 20,789,663 17,409,520
NON-CURRENT LIABILITIESInterest-bearing loans and borrowings 5,760,167 6,128,583 Bonds payable 5,000,000 5,000,000 Customers' deposits 1,631,456 1,222,423 Reserve for property development 2,755,055 2,487,558
Deferred income on real estate sales 1,833,432 1,588,241 Deferred tax liabilities - net 3,384,487 3,249,031 Advances from other related parties 1,208,074 289,868 Retirement benefit obligation 124,670 116,039 Other non-current liabilities 1,571,113 1,019,123
Total Non-current Liabilities 23,268,454 21,100,866
Total Liabilities 44,058,117 38,510,386
EQUITYEquity attributable to parent company's shareholders 58,613,597 57,776,024 Non-controlling interest 973,013 743,113
Total Equity 59,586,610 58,519,137
TOTAL LIABILITIES AND EQUITY 103,644,727 P 97,029,523 P
LIABILITIES AND EQUITY

MEGAWORLD CORPORATION AND SUBSIDIARIESCONSOLIDATED STATEMENTS OF INCOME
2011 Unaudited 2010 UnauditedJan 1 - Mar 31 Jan 1 - Mar 31
REVENUESReal estate sales 3,354,753 P P 3,107,141 Interest income on real estate sales 236,182 193,503 Realized gross profit on prior years' sales 794,676 397,259 Rental Income 809,017 596,344 Hotel operations 86,743 55,266 Equity share in net earnings of associates,
interest and other income 444,235 300,833
5,725,606 4,650,346
COSTS AND EXPENSESReal estate sales 2,117,524 1,977,361 Deferred gross profit 1,082,812 482,914 Hotel operations 50,445 38,057 Operating expenses 676,568 432,728 Interest and other charges - net 136,272 158,887 Income tax expense 410,038 450,094
4,473,659 3,540,041
NET INCOME BEFORE PREACQUISITION INCOME OF A SUBSIDIARY 1,251,947
PREACQUISITION INCOME OFA SUBSIDIARY 6,133 -
. NET INCOME 1,245,814 P 1,110,305 P
Attributable to:Parent company's shareholders 1,234,039 P P 1,098,277 Non-controlling interest 11,775 12,028
1,245,814 P 1,110,305 P
Earnings Per Share 0.049 P 0.044 P
(In Thousands)
EXHIBIT 2

MEGAWORLD CORPORATION AND SUBSIDIARIESConsolidated Statements of Comprehensive Income(in thousand)
2011 Unaudited 2010 Unaudited
Jan 1 - Mar 31 Jan 1 - Mar 31
NET INCOME FOR THE PERIOD P 1,245,814 P 1,110,305
Other comprehensive incomeNet unrealized gain (loss) on available-for-sale financial assets 267,127 )( 819,777 Translation Adjustment 25,687 )( 175 Share in other comprehensive income (loss) of associates 38,608 )(
TOTAL COMPREHENSIVE INCOME FOR THE PERIOD P 914,392 P 1,930,257
Total comprehensive income attributable to:Equity holders of the parent 902,617 1,918,229 Non-controlling interest 11,775 12,028
P 914,392 P 1,930,257

MEGAWORLD CORPORATION & SUBSIDIARIESSTATEMENTS OF CHANGES IN EQUITY
2011 Unaudited 2010 Unaudited 31-Mar-11 31-Mar-10
CAPITAL STOCK 25,829,204 P 25,829,204 P
ADDITIONAL PAID-IN CAPITAL 8,432,990 8,432,990
TREASURY SHARES 633,722 )( 1,188,837 )(
NET UNREALIZED GAIN (LOSS) ON
AVAILABLE-FOR-SALE-FINANCIAL ASSETS 3,432,702 936,034
ACCUMULATED TRANSLATION ADJUSTMENT 278,022 )( 121,570 )(
RETAINED EARNINGS 21,830,445 17,142,255
NON-CONTROLLING INTEREST 973,013 735,897
TOTAL EQUITY 59,586,610 P 51,765,973 P
(In Thousands)
EXHIBIT 3

2011 Unaudited 2010 Unaudited31-Mar-11 31-Mar-10
CASH FLOWS FROM OPERATING ACTIVITIESIncome before tax 1,661,984 P 1,560,399 P
Adjustments for:Depreciation and amortization 119,807 104,405 Interest expense 128,379 143,530 Interest & other income 211,996 )( 192,646 )( Equity in net (earnings) losses of associates 140,221 )( 74,329 )(
Operating income before working capital changes 1,557,953 1,541,359 Net Changes in Operating Assets & Liabilities
Decrease (Increase) current & non-current assets 4,587,310 )( 1,687,674 )( Increase (decrease) in current & other current Liabilities 4,150,516 238,480 Increase (decrease) in reserve for property development 559,986 116,548
Cash generated from (used in) operations 1,681,145 208,713 C h id f i t 410 038 )( 191 877 )(
(In Thousands)
MEGAWORLD CORPORATION AND SUBSIDIARIESCONSOLIDATED CASH FLOW STATEMENTS
EXHIBIT 4
Cash paid for income taxes 410,038 )( 191,877 )(
NET CASH FROM (USED IN) OPERATING ACTIVITIES 1,271,107 16,836
CASH FLOWS FROM (USED IN) INVESTING ACTIVITIES 356,233 235,619 )(
CASH FLOWS FROM (USED IN) FINANCING ACTIVITIES 497,909 )( 432,016 )(
NET INCREASE (DECREASE) IN CASH AND CASH EQUIVALENTS 1,129,431 650,799 )(
CASH AND CASH EQUIVALENTS AT BEGINNING OF PERIOD 22,031,585 20,876,005
CASH AND CASH EQUIVALENTSAT END OF THE PERIOD 23,161,016 P 20,225,206 P

MEGAWORLD CORPORATION AND SUBSIDIARIES NOTES TO INTERIM FINANCIAL INFORMATION
FOR THE THREE MONTHS ENDED MARCH 31, 2011 AND 2010 (UNAUDITED)
(Amounts in Philippine Pesos)
1. CORPORATE INFORMATION
Megaworld Corporation (the Company or parent company) holds interests in the following subsidiaries and associates:
Explanatory Percentage of Ownership
Subsidiaries/Associates Notes March 31, 2011 2010
Subsidiaries:
Megaworld Land, Inc. (MLI) 100% 100%
Prestige Hotels and Resorts, Inc. (PHRI) (a) 100% 100%
Mactan Oceanview Properties
and Holdings, Inc. (MOPHI) 100% 100%
Megaworld Cayman Islands, Inc. (MCII) 100% 100%
Richmonde Hotel Group International (RHGI) 100% 100%
Eastwood Cyber One Corporation (ECOC) 100% 100%
Forbes Town Properties and Holdings, Inc. (FTPHI) 100% 100%
Megaworld Newport Property
Holdings, Inc. (MNPHI) 100% 100%
Oceantown Properties, Inc. (OPI) 100% 100%
Piedmont Property Ventures, Inc. (PPVI) (b) 100% 100%
Stonehaven Land, Inc. (SLI) (b) 100% 100%
Streamwood Property Inc. (SPI) (b) 100% 100%
Suntrust Properties Inc (SP) (c) 62.%
Megaworld-Daewoo Corporation (MDC) 60% 60%
Megaworld Central Properties, Inc. (MCPI) 51% 51%
Megaworld Resort Estates, Inc. (MREI) (d) 51% 51%
Megaworld Globus Asia, Inc. (MGAI) 50% 50%
Philippine International Properties, Inc. (PIPI) (e) 50% 50%
Townsquare Development, Inc. (TDI) (f) 31% 31%
Associates:
Empire East Land Holdings, Inc. (EELHI) 48.38% 48.38%
Suntrust Home Developers, Inc. (SHDI) 42.48% 42.48%
Palm Tree Holdings and Development Corporation (PTHDC) 40% 40%
Gilmore Property Marketing Associates, Inc. (GPMAI) (g) 39.83% 31%
Alliance Global Properties Ltd. (AGPL) (h) 39.44% 44.34%
Travellers International Hotel Group, Inc. (TIHGI) (i) 10% 10%
EXHIBIT 5

- 2 -
(a) Wholly owned subsidiary of MLI.
(b) Acquired subsidiaries in 2008 but have not yet started commercial operations as of March 31, 2011. (c) In March 2011, the Company acquired 59% ownership in SP. The Company also has 42.48% ownership in SHDI which owns
SP by 8% resulting to 3% indirect ownership by the Company. In total, the Company owns SP by 62% (d) Subsidiary incorporated in 2007. MREI owns 100% of TDI and GPMAI as of December 31, 2007. In
June 2008, MREI’s ownership in TDI and GPMAI decreased to 60% which resulted in the Company’s indirect interest of 31%
as of March 31, 2011. (e) Subsidiary incorporated in 2002 and acquired by the Company in 2006, not yet started commercial operations as of March 31,
2011.
(f) Subsidiary incorporated in 2006. In September 2007, the Company’s 100% ownership in TDI was acquired by MREI which
resulted in the Company’s indirect interest of 51% as of December 31, 2007. In September 2008, TDI issued additional shares
of stock which resulted to a decrease in MREI’s ownership in TDI to 60%. In this regard, the Company has indirect interest in
TDI of 31% as of March 31, 2011.
(g) In November 2007, MREI acquired 100% ownership in GPMAI which resulted in the Company’s indirect interest of 51% as of
December 31, 2007. In 2008, MREI’s ownership in GPMAI decreased to 60%; it further decreased to 28.85% in 2010. GPMAI
was consolidated starting 2007 up to 2009; in 2010, it was deconsolidated and treated as an associate of the Group. As of
December 31, 2010, the Company has 39.83% indirect interest in GPMAI. (h) In February, 2009, RHGI acquired 44.34% ownership in AGPL, which resulted in the Company’s indirect interest of 44.34% as
of December 31, 2009. In October 2010, AGPL issued additional shares of stock which resulted in the decrease in RHGI’s
ownership in AGPL to 39.44%. AGPL is considered as an associate due to the Company’s significant influence, but not control,
on AGPL.
(i) The associate was incorporated in 2003 and started commercial operations in August 2009. In 2008, the Company acquired 10%
ownership in TIHGI through a share swap agreement. In August 2010, the Company’s investment in TIHGI. Subsequently, in
November 2010, TIHGI redeemed. The 430.0 million preferred shares held by the Company. The conversion of common
shares and the redemption of preferred shares did not change the Company’s ownership in TIHGI. Although the Company’s
percentage ownership is only 10% TIHGI was classified as an associate due to the Company’s significant influence on TIHGI.
Except for MCII, RHGI, and AGPL the subsidiaries and associates were incorporated in the Philippines and operate within the country. MCII and AGPL were incorporated and operate in the Cayman Islands while RHGI was incorporated and operates in the British Virgin Islands.
The Company and its subsidiaries (the Group), except for MREI, PIPI, PPVI, SLI and SPI which
are not yet in commercial operations as of March 31, 2011, are presently engaged in the real estate business, hotel operations and marketing services. The Company, EELHI and SHDI are publicly listed companies in the Philippines.
Alliance Global Group, Inc. (AGI), a publicly listed company in the Philippines, is the Group’s
ultimate parent company. The registered office of the Company, which is also its principal place of business, is located at 28th
Floor, The World Centre Building, Sen. Gil Puyat Avenue, Makati City.
2. SUMMARY OF SIGNIFICANT ACCOUNTING POLICIES
2.1 Basis of Preparation of Consolidated Financial Statements

- 3 -
These interim consolidated financial statements are for the three months ended March 31, 2011 and 2010. They have been prepared in accordance with PAS 34 Interim Financial Reporting. They do not include all of the information required in annual financial statements in accordance with PFRS, and should be read in conjunction with the consolidated financial statements of the Group for the year ended December 31, 2010.
The preparation of interim consolidated financial statements in accordance with PFRS requires management to make judgments, estimates and assumptions that affect the application of policies and reported amounts of assets and liabilities, income and expenses. Although these estimates are based on management’s best knowledge of current events and actions, actual results may ultimately differ from those estimates.
These interim consolidated financial statements are presented in Philippine pesos, the Company’s
functional currency, and all values represent absolute amounts except when otherwise indicated
2.2 Impact of New Standards, Amendments and Interpretations to Existing Standards
These interim consolidated financial statements have been prepared in accordance with the accounting policies adopted in the last annual financial statements for the year ended December 31, 2010 except for the adoption of
PFRS 9 : Financial Instruments Philippine Interpretations
IFRIC 15 : Agreements for the Construction of Real Estate Sales IFRIC 17 : Distribution on Non-cash Assets to Owners Various Standards : 2009 Annual Improvements to PFRS
Below is a discussion of the possible impact of these accounting standards. (i) PFRS 9, Financial Instruments (effective from January 1, 2013). PFRS 9 introduces major
simplifications of the classification and measurement provisions under PAS 9. These include reduction from four measurement categories into two categories, i.e., fair value and amortized cost, and from several impairment methods into one method.
Management is yet to assess the impact that this amendment is likely to have on the consolidated financial statements of the Group. However, it does not expect to implement the amendments until 2013 when all chapters of the PAS 39 replacement have been published at which time the Group expects it can comprehensively assess the impact of the revised standard.
(ii) Philippine Interpretation IFRIC 15, Agreements for Construction of Real Estate, (effective from January 1, 2012). This interpretation provides guidance on how to determine whether an agreement for the construction of real estate is within the scope of PAS 11, Construction Contracts, or PAS 18, Revenue, and accordingly, when revenue from the construction should

- 4 -
be recognized. The main expected change in practice is a shift from recognizing revenue using the percentage-of-completion method (i.e., as a construction progresses, by reference to the stage of completion of the development) to recognizing revenue at a single time (i.e., at completion upon or after delivery). The Group will adopt this interpretation in 2012 and is currently evaluating the impact of such adoption in the consolidated financial statements.
(iii) Philippine Interpretation IFRIC 17, Distribution of Non-cash Assets to Owners (effective from
July 1, 2009). IFRIC 17 clarifies that a dividend payable should be recognized when the dividend is appropriately authorized and is no longer at the discretion of the entity. Also, an entity should measure the dividend payable at the fair value of the net assets to be distributed and the difference between the dividend paid and the carrying amount of the net assets distributed in profit or loss. The Group will apply the standard prospectively starting January 1, 2010.
(iv) 2009 Annual Improvements to PFRS. The FRSC has adopted the Improvements to
International Financial Reporting Standards 2009. Most of these amendments became effective in annual periods beginning on or after July 1, 2009 or January 1, 2010. Among those improvements, the following amendments were identified to be relevant to the Group’s consolidated financial statements:
• PAS 1 (Amendment), Presentation of Financial Statements. The amendment clarifies the
current and non-current classification of a liability that can, at the option of the counterparty, be settled by the issue of the entity’s equity instruments. The Group will apply the amendment in its 2010 consolidated financial statements but does not expect it to have a material impact.
• PAS 7 (Amendment), Statement of Cash Flows. PAS 7 amendment states explicitly that only an expenditure that results in a recognized asset can be classified as a cash flow from investing activities. Based on management’s initial assessment, the amendment will not have any effect on its 2010 consolidated financial statements since only recognized assets are classified by the Group as cash flows from investing activities.
• PAS 17 (Amendment), Leases. The amendment clarifies that when a lease includes
both land and building elements, an entity assesses the classification of each element as finance or an operating lease separately in accordance with the general guidance on lease classification set out in PAS 17. Management has initially determined that the amendment will not affect the consolidated financial statements because the Group currently have no lease agreements that include both land and building.
• PAS 18 (Amendment), Revenue. The amendment provides guidance on determining
whether an entity is acting as a principal or as an agent. Management will apply this amendment prospectively in its 2010 consolidated financial statements.
Minor amendments are made to several other standards; however, these amendments are not
expected to have a material impact on the Group’s consolidated financial statements.

- 5 -
The policies have been consistently applied to all periods presented, unless otherwise stated.
3. SIGNIFICANT ACCOUNTING ESTIMATES AND JUDGMENTS
The Group’s consolidated financial statements prepared in accordance with PFRS require management to make judgments and estimates that affect amounts reported in the financial statements and related notes. Judgments and estimates are continually evaluated and are based on historical experience and other factors, including expectations of future events that are believed to be reasonable under circumstances. Actual results may ultimately vary from these estimates.
3.1 Critical Judgments in Applying Accounting Policies
In the process of applying the Group’s accounting policies, management has made the following
judgments, apart from those involving estimation, which have the most significant effect on the amounts recognized in the consolidated financial statements:
(a) Impairment of Available-for-sale Financial Assets
The Group follows the guidance of PAS 39, Financial Instruments: Recognition and Measurement, in determining when an investment is other-than-temporarily impaired. This determination requires significant judgment. In making this judgment, the Group evaluates, among other factors, the duration and extent to which the fair value of an investment is less than its cost; and the financial health of and near-term business outlook for the investee, including factors such as industry and sector performance, changes in technology and operational and financing cash flows.
(b) Distinction Between Investment Property and Owner-Occupied Properties
The Group determines whether a property qualifies as Investment Property. In making its judgment, the Group considers whether the property generates cash flows largely independently of the other assets held by an entity. Owner-occupied properties generate cash flows that are attributable not only to property but also to other assets used in the production or supply process.
(c) Operating and Finance Leases
The Group has entered into various lease agreements as either a lessor or lessee. Critical judgment was exercised by management to distinguish each lease agreement as either an operating or finance lease by looking at the transfer or retention of significant risk and rewards of ownership of the properties covered by the agreements.
3.2 Key Sources of Estimation Uncertainty The following are the key assumptions concerning the future, and other key sources of estimation uncertainty at the balance sheet date, that have a significant risk of causing a material adjustment to the carrying amounts of assets and liabilities within the next financial year.

- 6 -
(a) Revenue Recognition Using the Percentage-of-Completion Method
The Group uses the percentage-of-completion method in accounting for its realized gross profit on real estate sales. The use of the percentage-of-completion method requires the Group to estimate the portion completed to date as a proportion of the total budgeted cost of the project.
(b) Principal Assumptions for Management’s Estimation of Fair Value
Investment Property is measured using the cost model. The fair value disclosed in the consolidated financial statements is determined by the Group using the discounted cash flows valuation technique since the information on current or recent prices of investment property is not available. The Group uses assumptions that are mainly based on market conditions existing at each balance sheet date.
The principal assumptions underlying management’s estimation of fair value are those related to: the receipt of contractual rentals; expected future market rentals; void periods; maintenance requirements; and appropriate discount rates. These valuations are regularly compared to actual market yield data, and actual transactions by the Group and those reported by the market. The expected future market rentals are determined on the basis of current market rentals for similar properties in the same location and condition.
(c) Useful Lives of Property and Equipment and Investment Property
The Group estimates the useful lives of property and equipment and investment property based on the period over which the assets are expected to be available for use. The estimated useful lives of property and equipment and investment property are reviewed periodically and are updated if expectations differ from previous estimates due to physical wear and tear, technical or commercial obsolescence and legal or other limits on the use of the assets. In addition, estimation of the useful lives of property and equipment and investment property is based on collective assessment of industry practice, internal technical evaluation and experience with similar assets. It is possible, however, that future results of operations could be materially affected by changes in estimates brought about by changes in the factors mentioned above. The amounts and timing of recorded expenses for any period would be affected by changes in these factors and circumstances. A reduction in the estimated useful lives of property and equipment would increase recorded operating expenses and decrease non-current assets.
(d) Allowance for Impairment of Trade and Other Receivables
Allowance is made for specific and groups of accounts, where objective evidence of impairment exists. The Group evaluates these accounts based on available facts and circumstances, including, but not limited to, the length of the Group’s relationship with the customers, the customers’ current credit status based on third party credit reports and known market forces, average age of accounts, collection experience and historical loss experience.
(e) Valuation of Financial Assets Other than Trade and Other Receivables
The Group carries certain financial assets at fair value, which requires the extensive use of accounting estimates and judgment. Significant components of fair value measurement were

- 7 -
determined using verifiable objective evidence such as foreign exchange rates, interest rates and volatility rates. However, the amount of changes in fair value would differ had the Group utilized different valuation methods and assumptions. Any change in fair value of these financial assets and liabilities would affect profit and loss and equity.
(f) Realizable Amount of Deferred Tax Assets
The Group reviews its deferred tax assets at each balance sheet date and reduces the carrying amount to the extent that it is no longer probable that sufficient taxable profit will be available to allow all or part of the deferred tax asset to be utilized.
(g) Impairment of Non-financial Assets
Except for intangible assets with indefinite useful lives, PFRS requires that an impairment review be performed when certain impairment indicators are present. Though management believes that the assumptions used in the estimation of fair values reflected in the consolidated financial statements are appropriate and reasonable, significant changes in these assumptions may materially affect the assessment of recoverable values and any resulting impairment loss could have a material adverse effect on the results of operations.
(h) Retirement and Other Benefits
The determination of the Group’s obligation and cost of pension and other retirement benefits is dependent on the selection of certain assumptions used by actuaries in calculating such amounts. In accordance with PFRS, actual results that differ from the assumptions are accumulated and amortized over future periods and therefore, generally affect the recognized expense and recorded obligation in such future periods.
4. SEGMENT INFORMATION
The Group’s operating businesses are organized and managed separately according to the nature of products and services provided, with each segment representing a strategic business unit that offers different products and serves different markets. The Group is engaged in the development of residential and office developments including urban centers integrating office, residential and commercial components. The Real Estate Sales segment pertains to the development and sale of residential and office developments. The Rental segment includes leasing of office and commercial spaces. The Hotel segment relates to the management of hotel business operations. The Corporate and Others segment includes marketing services, general and corporate income and expense items. Segment accounting policies are the same as the policies applied in the most recent annual consolidated financial statements. The Group generally accounts for intersegment sales and transfers as if the sales or transfers were to third parties at current market prices. The following table present revenue and profit information regarding industry segments for the three months ended March 31, 2011 and March 31, 2010, and certain asset and liability information regarding segments as at March 31, 2011 and December 31, 2010.

- 8 -
March 2011 Real Estate Hotel Corporate
Sales Rental Operations & Others Elimination Consolidated TOTAL REVENUES Sales to external customers 4,385,610,719 809,016,589 86,742,781 85,965,145 - 5,367,335,234 Intersegment sales 10,484,301 36,238,042 (46,722,343) - Total Revenues 4,385,610,719 819,500,890 86,742,781 122,203,187 (46,722,343) 5,367,335,234
RESULTS Segment Result 774,823,011 614,941,231 20,773,778 78,513,095 6,472,213 1,495,523,328
Unallocated Expenses (57,241,504) Income from operations 1,438,281,824 Finance Cost (128,378,628) (128,378,628) Interest Income 214,936,438 214,936,438 Dividend Income 3,111,935 3,111,935 Fair Value Loss - net (6,052,300) (6,052,300) Equity in net earnings of associates 140,221,243 140,221,243 Forex loss (136,326) (136,326) Income before tax 1,661,984,186 Tax expense (410,038,073) Income before non-controlling interest and preacquisition income 1,251,946,113 Preacquisition income of a subsidiary (6,133,073) Income before non-controlling interest 1,245,813,040
Non-controlling interest share in net income (11,774,371)
Net Income attributable to
1,234,038,669 Parent company shareholders
ASSETS AND LIABILITIES Segment Assets 69,883,448,183 6,110,015,460 160,146,870 12,749,569,704 88,903,180,217 Investment in and advances
to associates and other related
parties 13,792,287,090 13,792,287,090 Unallocated Assets 949,259,874 949,259,874
Total Assets 103,644,727,181
Segment Liabilities 37,034,747,946 1,821,668,382 77,861,105 5,123,839,455 44,058,116,888

- 9 -
Real Estate Hotel Corporate
March 2010 Sales Rental Operations & Others Elimination Consolidated TOTAL REVENUES
Sales to external customers 3,697,901,819 596,343,958 55,266,328 303,667,856 -
4,653,179,961 Intersegment sales 755,747 17,347,251 (18,102,998)
Total Revenues 3,697,901,819 597,099,705 55,266,328 321,015,107 (18,102,998)
4,653,179,961
RESULTS
Segment Result 981,325,617 458,483,061 9,323,149 11,432,276 6,472,213
1,467,036,316
Unallocated expenses
(31,066,096)
Income from operations
1,435,970,220
Finance Cost (143,529,904)
(143,529,904)
Interest Income 176,032,818
176,032,818
Dividend Income 3,112,935
3,112,935
Fair Value Gain - net 13,500,000
13,500,000
Equity in net earnings of associates 74,329,492
74,329,492
Forex gain 982,944
982,944 Income before tax 1,560,398,505 Tax expense (450,093,697) Income before minority interest 1,110,304,808 Minority interest- share in net income (12,027,871)
NNet Income attributable to parent
company shareholders 1,098,276,937
ASSETS AND LIABILITIES Segment Assets 56,595,715,952 5,253,303,672 180,725,922 11,661,738,758 73,691,484,304 Investment in and advances
to associates and other related parties 13,072,951,439 13,072,951,439
Unallocated Assets 757,170,366 757,170,366
Total Assets 87,521,606,109
Segment Liabilities 29,255,787,638 1,239,216,195 52,325,077 5,208,304,111 35,755,633,021

- 10 -
5. STOCK RIGHTS
As a result of the stock rights offering, 5,127,556,725 common shares were subscribed and issued on June 1, 2009. Of the total exercise price, 50% was paid as of May 31, 2009 and the remaining 50% was paid as of June 2010. Relative to the issuance of pre-emptive stock rights, 4,102,045,380 stock warrants were issued and these will be exercisable beginning on the second year until five years from issue date.
6. DIVIDENDS
The details of the Company’s cash dividend declarations are as follows:
2010
Declaration date May 18, 2010 Date of record July 06, 2010 Date paid July 30, 2010 Amount declared P479,885,465
7. EARNINGS PER SHARE
The calculation of the basic earnings per share is based on the profits attributable to ordinary
shareholders divided by the weighted average number of shares in issue during the period. Earnings per share amounts were computed as follows:
MAR 31, 2011 MAR 31, 2010
Net income P 1,234,038,669 P 1,098,276,938 Computed dividends on cumulative preferred shares series “A” ( 149,589) ( 149,589)
Income available to parent company’s common shareholders P 1,233,889,080 P 1,098,127,349
Divided by weighted number of outstanding common shares 25,217,783,626 25,100,758,872
Earnings per share P 0.049 P 0.044
8. COMMITMENTS AND CONTINGENCIES
There are commitments, guarantees and contingent liabilities that arise in the normal course of operations of the Group which are not reflected in the accompanying interim consolidated financial statements. The management of the Group is of the opinion, that losses, if any, from these items will not have any material effect on its consolidated financial statements.

- 11 -
In addition, there are no material off-balance sheet transactions, arrangements, obligations and other relationships of the Group with unconsolidated entities or other persons created during the reporting period.
9. SEASONAL FLUCTUATIONS There were no seasonal aspects that had a material effect on the financial condition or results of
operations of the Group 10. RISK MANAGEMENT OBJECTIVES AND POLICIES
The Group has various financial instruments such as cash and cash equivalents, financial assets at FVTPL, available-for-sale securities, banks loans, bonds, trade receivables and payables which arise directly from the Group’s business operation. The financial debts were issued to raise funds for the Group’s capital expenditures. The Group does not actively engage in the trading of financial assets for speculative purposes. 10.1 Foreign Currency Sensitivity
Most of the Group’s transactions are carried out in Philippine peso, its functional currency. Exposures to currency exchange rates arise mainly from the Group’s U.S. dollar-denominated cash and cash equivalents, and bonds which have been used to fund new projects. Foreign currency denominated financial assets and liabilities, translated into Philippine peso at the closing rate are as follows:
Unaudited March 31, 2011 Audited 2010 . U.S. Dollars Pesos U.S. Dollars Pesos Financial assets $ 234,038,729 P 10,164,770,099 $ 245,812,793 P10,790,198,346 Financial liabilities ( 3,849,016) ( 167,170,442) ( 7,098,646) ( 311,602,166) $ 230,189,713 P 9,997,599,657 $ 238,714,147 P 10,478,596,180
The following table illustrates the sensitivity of the consolidated net result for the year and consolidated equity in regards to the Group’s financial assets and financial liabilities and the U.S. dollar – Philippine peso exchange rate. March 31, 2011:
Increase (decrease) Effect on consolidated Effect on in exchange rate profit before tax consolidated equity P 1 P 230,189,714 P 161,132,800 (P 1) ( 230,189,714) ( 161,132,800)

- 12 -
2010: Increase (decrease) Effect on consolidated Effect on in exchange rate profit before tax consolidated equity P 1 P 238,714,147 P 167,099,903 (P 1) ( 238,714,147 ) ( 167,099,903)
Exposures to foreign exchange rates vary during the year depending on the volume of overseas transactions. Nonetheless, the analysis above is considered to be representative of the Group’s currency risk. 10.2 Interest Rate Sensitivity The Group interest risk management policy is to minimize interest rate cash flow risk exposures to changes in interest rates. The Group maintains a debt portfolio unit of both fixed and floating interest rates. These long-term borrowings are usually at fixed rates. All other financial assets and liabilities are subject to variable interest rates.
The following table illustrates the sensitivity of the consolidated net result for the year and consolidated equity to a reasonably possible change in interest rates of +1% and –1% in March 31, 2011 and 2010. The calculations are based on the Group’s financial instruments held at each balance sheet date. All other variables are held constant. (Unaudited) (Audited)
MARCH 31, 2011 December 2010 +1% -1% +1% -1% Consolidated net results for the year (P 4,799,710) P 4,799,710 (P 15,873,037) P 15,873,037 Consolidated equity ( 3,359,797) 3,359,797 ( 11,111,126) 11,111,126
10.3 Credit Risk Generally, the Group’s credit risk is attributable to installment receivables, rental receivables and other financial assets. The Group maintains defined credit policies and continuously monitors defaults of customers and other counterparties, identified either individually or by group, and incorporate this information into its credit risk controls. Where available at a reasonable cost, external credit ratings and/or reports on customers and other counterparties are obtained and used. The Group’s policy is to deal only with creditworthy counterparties. In addition, for a significant proportion of sales, advance payments are received to mitigate credit risk. 10.4 Liquidity Risk The Group manages its liquidity needs by carefully monitoring scheduled debt servicing payments for long-term financial liabilities as well as cash outflows due in a day-to-day business. Liquidity needs are monitored in various time bands, on a day-to-day and week-to-week, as well as on the basis of a rolling 30-day projection. Long-term needs for a 6-month and one-year period are identified monthly. The Group maintains cash to meet its liquidity requirements for up to 60-day periods. Excess cash are invested in time deposits or short-term marketable securities. Funding for long-term liquidity

- 13 -
needs is additionally secured by an adequate amount of committed credit facilities and the ability to sell long-term financial assets.
As at March 31, 2011 and December 31, 2010, the Group’s financial liabilities have contractual maturities which are presented below.
March 31, 2011 (Unaudited) Current Non-current Within 6 to 12 1 to 5 Later 6 Months Months Years 5 Years Interest-bearing loans and borrowings P 655,120,172 P 655,121,424 P 5,760,166,667 Trade and other payables 2,592,321,803 3,570,635,820 - - Bonds payable 3,380,800,084 - 5,000,000,000 - Advances from other related parties - - 1,208,073,804 - P 6,628,242,059 P4,225,757,244 P 12,037,573,804
December 31, 2010 (Audited) Current Non-current Within 6 to 12 1 to 5 Later 6 Months Months Years 5 Years Interest-bearing loans and borrowings P 655,677,449 P 655,677,448 P 6,128,583,476 P 0 Trade and other payables 1,847,488,610 2,190,224,738 - Bonds payable - 3,416,062,159 5,000,000,000 - Advances from other related parties - - 289,868,257 - P 2,503,166,059 P6,261,964,345 P11,418,451,733
The above contractual maturities reflect the gross cash flows, which may differ from the carrying values of the liabilities at the balance sheet dates

EXHIBIT 6 Management’s Discussion and Analysis of Results of Operations and Financial Condition Results of Operations (Based on Financial Statements adopted in accordance with the Philippine Financial Reporting Standards) Review of March 31, 2011 versus March 31, 2010 During the 1st quarter of 2011, the consolidated net income amounted to Php1.25 billion, 12.20% higher than the previous 1st quarter’s net income of Php1.11 billion. Consolidated total revenues composed of real estate sales, rental income, hotel income and other revenues, elevated by 23.12% from Php4.65 billion to Php5.73 billion resulting from strong property sales and increased leasing income.
Development. Among product portfolios, the bulk of generated consolidated revenues came from the sale of condominium units and residential lots, amounting to Php3.35 billion for the 1st quarter of 2011 compared to 3.11 billion for the 1st quarter of 2010, an increase of 7.97%. The Group’s registered sales mostly came from the following projects: Belagio, Forbeswood Park Lane 1 & 2 and Eight Forbes Town in Fort Bonifacio; Eastwood Le Grand in Eastwood City; McKinley Hill Tuscany, Stamford, Morgan Suites, and The Venice Luxury Residences in Taguig City; Manhattan Heights in Quezon City; and Newport City in Pasay; City Place in Binondo, Manila; and One Central, Greenbelt Chancellor and Excelsior in Makati City, El Jardine Residente 2, and Mckinley West. Leasing. Rental income contributed 14.13% to the consolidated revenue and amounted to Php809.02 million compared to Php596.34 million reflected in the same period last year, a 35.66% increase. Contributing to the growth are the escalation and completion of additional leasing properties. Hotel Operations. The Group’s hotel operations posted an amount of Php86.74 million for the 1st quarter of 2011, an increase of 56.95%, from Php55.27 million for the 1st quarter of 2010. In general, the increase in cost and expenses by 26.37% from Php3.54 billion for the first quarter of 2010 to Php4.47 billion for the first quarter of 2011, was due mainly to increase in recognized real estate sales, as well as marketing and selling expenses particularly commission expenses resulting from aggressive marketing activities. Income tax expense decreased by 8.90% from Php450.09 million for the 1st quarter of 2010 to Php410.04 million for the 1st quarter of 2011 due to tax effects of temporary differences. Operating expenses as a percentage of consolidated total revenues were 11.82% for the 1st quarter of 2011 and 9.31% for the 1st quarter of 2010, respectively.

For the 1st quarter of 2011, the management believes that there were no seasonal aspects that had a material effect on the financial condition or financial performance of the Group. Neither were there any trends, events or uncertainties that have had or that are reasonably expected to have a material impact on net sales or revenues or income from continuing operations. The Group is not aware of events that will cause material change in the relationship between costs and revenues. There are no significant elements of income or loss that did not arise from the Group’s continuing operations. FINANCIAL CONDITION The Group maintains a prudent financial policy as it engages to a more competitive and challenging environment. The Group’s statement of financial position reflects stable financial growth. Total resources as of March 31, 2011 reflected an amount of Php103.64 billion compared to Php97.03 billion as of December 31, 2010, listing a 6.82% increase. The Group showed an increase of 5.13% from its own Cash and Cash Equivalents mainly due to efficient collection of receivables. Giving a picture of the ease of the Group to pay-off its currently maturing commitments, Current Assets amounted to Php51.95 billion for the 1st quarter of 2011compared to last year’s Php46.81 billion while the company’s Current obligations reflected an amount of Php20.79 billion for the 1st quarter of 2011 compared to Php17.41 billion as of December 31, 2010. The figures reflects the consistency of being liquid of the Group making sure that right amounts of money and lines of credit are available to the business at all times. Current and Non-current Trade and other receivables increased by 5.11% from Php29.75 billion for the year-end period of 2010 to Php31.27 billion for the 1st quarter of 2011 due to upward sales brought by competitive economic and marketing strategies. Investment in available-for-sale securities decreased by 9.35%from Php6.21 billion as of December 31, 2010 to Php5.63 billion for the 1st quarter of 2011, due to disposal and changes in the market value of the Group’s invested shares. Investment property showed an amount of Php9.72 billion as of December 31, 2010 to Php10.05 billion for the 1st quarter of 2011, a smooth growth of 3.42% due to additional construction development. The Group Interest-bearing loans and borrowings total of Php7.07 billion for the 1st quarter of 2011 as compared to Php7.44 billion last year, a decline of 4.97%. Current and non-current customer’s deposit increase by 40.97% resulting to a recorded amount of Php3.15 billion for the 1st quarter of 2011 as compared to Php2.24 billion as of last year. Reserve for Property Development of Php6.69 billion providing an increase of 9.14% from last year’s amount of Php6.13billion. Summing up the current and non-current other liabilities posted a total amount of Php2.76 billion as of last year as compared to Php3.55 billion for the first quarter of 2011 illustrating a 28.60% growth as a result of an additional deferred rental income of the Group.

Total equity (including non-controlling interest) increased by 1.82% from Php58.52 billion as of December 31, 2010 to Php59.59 billion for the 1st quarter of 2011 due to the Group’s profitability.
The top five (5) key performance indicators of the Group are shown below:
1st quarter of 2011 1st quarter of 2010
Current Ratio *1 2.50:1 3.77:1 Quick Ratio *2 1.11:1 1.71:1 Debt to Equity Ratio *3 0.26:1 0.33:1 Return on Assets *4 1.19% 1.25% Return on Equity *5 2.11% 2.15%
*1 – Current Assets / Current Liabilities *2 – Cash and Cash Equivalents / Current Liabilities *3 – Interest Bearing Loans and Borrowings & Bonds Payable /Equity attributable to Parent Company *4 – Net Income / Total Assets (Computed using figures attributable only to parent company shareholders) *5 – Net Income / Equity (Computed using figures attributable only to parent company shareholders)
With its strong financial position, the Group will continue investing in and pursuing expansion activities as it focuses on identifying new markets, maintaining established markets and tapping business opportunities.
Material Changes for the 1st quarter of 2011 Financial Statements
(Increase/decrease of 5% or more versus December 31, 2010)
Financial Position
5.13% increase Cash and Cash Equivalents Increase due to efficient collection of its receivables 5.11% increase in Trade and other receivables - current and non-current Primarily due to higher sales recognized within the quarter. 229.87% increase in financial assets at fair value through profit and loss. Due to changes in market value and due to additional shares acquired by subsidiary
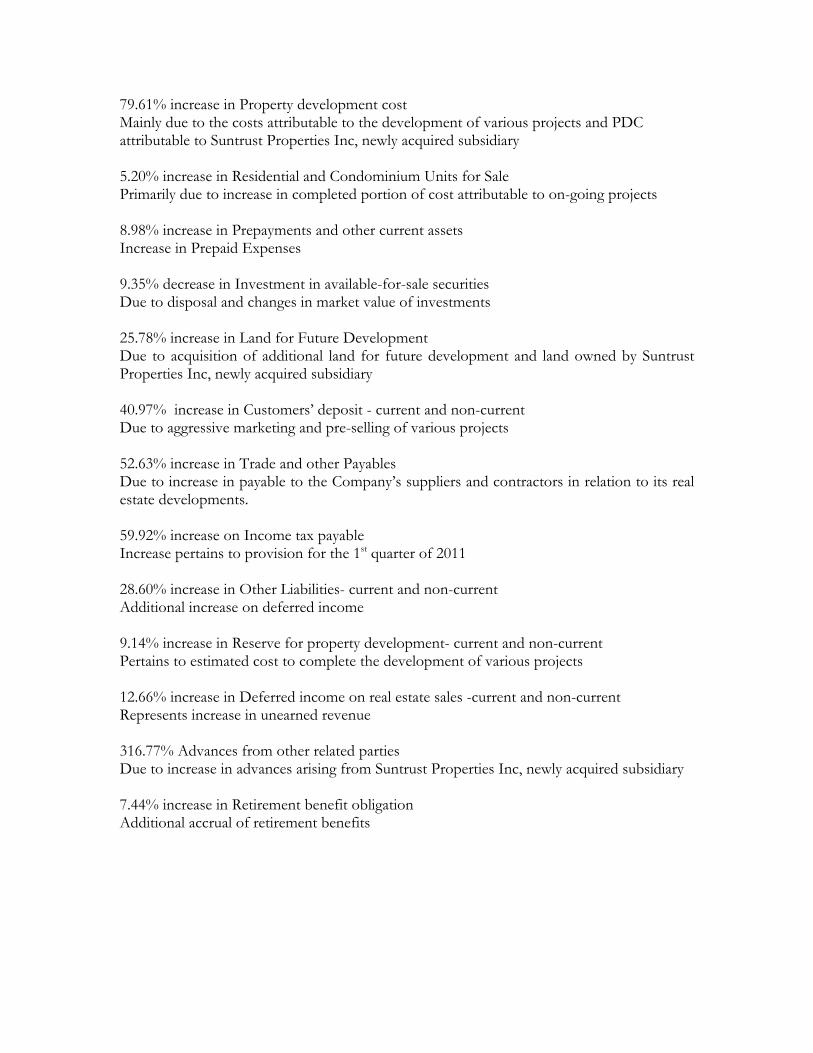
79.61% increase in Property development cost Mainly due to the costs attributable to the development of various projects and PDC attributable to Suntrust Properties Inc, newly acquired subsidiary 5.20% increase in Residential and Condominium Units for Sale Primarily due to increase in completed portion of cost attributable to on-going projects 8.98% increase in Prepayments and other current assets Increase in Prepaid Expenses 9.35% decrease in Investment in available-for-sale securities Due to disposal and changes in market value of investments 25.78% increase in Land for Future Development Due to acquisition of additional land for future development and land owned by Suntrust Properties Inc, newly acquired subsidiary 40.97% increase in Customers’ deposit - current and non-current Due to aggressive marketing and pre-selling of various projects 52.63% increase in Trade and other Payables Due to increase in payable to the Company’s suppliers and contractors in relation to its real estate developments. 59.92% increase on Income tax payable Increase pertains to provision for the 1st quarter of 2011 28.60% increase in Other Liabilities- current and non-current Additional increase on deferred income 9.14% increase in Reserve for property development- current and non-current Pertains to estimated cost to complete the development of various projects 12.66% increase in Deferred income on real estate sales -current and non-current Represents increase in unearned revenue 316.77% Advances from other related parties Due to increase in advances arising from Suntrust Properties Inc, newly acquired subsidiary 7.44% increase in Retirement benefit obligation Additional accrual of retirement benefits

(Increase/decrease of 5% or more versus March 31, 2010)
Income Statements
7.97% increase in Real estate sales Due to increase in sales booking for the quarter 22.06% increase in Interest income on real estate sales Due to realization of interest income from prior years’ sales that have been recognized for the quarter. 100.04% increase in Realized Gross Profit on prior years’ sales Mainly due to revenue recognition in prior year sales 35.66% increase in Rental Income Due to escalation and the completion of additional leasing property 56.95% increase in Hotel Operations Due to increase in the number of hotel rooms and hotel occupancy rates 47.67% increase in Equity share in net earnings of associates, interest and other income–net Mainly due to increase in net earnings of associates and other income 124.22% increase in Deferred Gross Profit Due to increase in sales bookings 56.35%increase in Operating Expenses Due to aggressive marketing activities and increase in other administrative and corporate overhead expenses 14.23% decrease in Interest and other charges – net Due to decrease in finance cost. 8.90% decrease in Income Tax Expenses Due to tax effects of temporary differences There are no other significant changes in the Group’s financial position (5% or more) and condition that will warrant a more detailed discussion. Further, there are no material events and uncertainties known to management that would have impact or change reported financial information and condition on the Group. There are no known trends or demands, commitments, events or uncertainties that will result in or that are reasonably likely to result in increasing or decreasing the Group’s liquidity in any material way. The Group does not anticipate having any cash flow or liquidity problems. The Group is not in default or breach of any note, loan, lease or other indebtedness or financing arrangement requiring it to make payments.

There are no material off-balance sheet transactions, arrangements, obligations (including contingent obligations), and other relationships of the Group with unconsolidated entities or other persons created during the reporting period. The Group has no unusual nature of transactions or events that affects assets, liabilities, equity, net income or cash flows. There were no seasonal aspects that had a material effect on the financial condition or results of operations of the Group. The unaudited interim condensed consolidated financial statements do not include all the information and disclosures required in the financial statements and should be read in conjunction with the Group’s consolidated annual financial statements as of and for the year ended December 31, 2010. The accounting policies and methods of computation adopted in preparation of the Group’s unaudited interim consolidated financial statements are the same with the most recent annual financial statements for the year ended December 31, 2010. There were no material events subsequent to the end of the year that have not been reflected in the Group's Financial Statement for the 1st quarter of 2011. There were no changes in estimates of amount reported in the current financial year or changes in estimates of amounts reported in prior financial years. There was no contingent liability reflected in the most recent annual financial statement, the same in the current year consolidated financial statement for the 1st quarter of 2011 There are commitments, guarantees and contingent liabilities that arise in the normal course of operations of the Group which are not reflected in the accompanying interim consolidated financial statements. The management of the Group is of the opinion that losses, if any, from these items will not have any material effect on its interim consolidated financial statements.

EXHIBIT 7MEGAWORLD CORPORATION & SUBSIDIARIES
Aging of Accounts ReceivablesAs of March 31, 2011( In Thousands )
1. Aging of Accounts Receivable
Past dueTOTAL CURRENT/ 7 Months to 5 Years- accounts & items
NOT YET DUE 1 Month 2-3 Months 4-6 Months 1 Year 1-2 Years 3-5 Years Above in LitigationType of Receivables:
a. Trade Receivables 31,271,184 25,501,025 3,791,631 1,632,669 345,859 - - - - -
b. Other receivable- - - - - - - - - -
NET RECEIVABLES 31,271,184
2. Accounts Receivable Description
Type of Receivables
Trade Receivables
Other receivable Advances to Contractors 1 Yearand Suppliers
Nature/Description Collection Period
Sale of Units 3 to 4 Years