defining south africa’s water source areas -...
TRANSCRIPT

Defining South Africa’s Water Source Areas
TOGETHER INVESTING IN THE FUTURE OF SOUTH ARICA’S MARINE AND FRESHWATER ECOSYSTEMS
ZA
report
2013

page 2 | Defining South Africa’s Water Source Areas-WWF
Published in August 2013 by WWF-World Wide FundFor Nature (Formerly World Wildlife Fund), Cape Town,South Africa. Any reproduction in full or in part must mentionthe title and credit the above-mentioned publisher as thecopyright owner.
© Text 2013 WWF-SA
All rights reserved
WWF is one of the world’s largest and most experiencedindependent conservation organisations, with over5 million supporters and a global network active inmore than 100 countries.
WWF’s mission is to stop the degradation of the planet’snatural environment and to build a future in which humans livein harmony with nature, by: conserving the world’s biologicaldiversity, ensuring that the use of renewable natural resourcesis sustainable, and promoting the reduction of pollution andwasteful consumption.
www.wwf.org.za
ContributorSWWF South AfricaChristine Colvin, Imelda Haines
Council for Scientific & Industrial Research (CSIR)Jeanne Nel, Dave Le Maitre, Janis Smith

Defining South Africa’s Water Source Areas-WWF | page 3
Defining South Africa’s Water Source AreasPrepared with funding from WWF
Prepared by:Jeanne Nel, Christine Colvin, David Le Maitre and Janis Smith, Imelda Haines

page 4 | Defining South Africa’s Water Source Areas-WWF

Defining South Africa’s Water Source Areas-WWF | page 5
tAble of ContentS
1. Introduction ................................................................................................................................. 71.1 Water source areas elsewhere in the world ................................................................................8
2. Review of water source area concepts in South Africa ................................................................ 92.1 Mountain catchment areas .........................................................................................................92.2 High water yield areas ................................................................................................................92.3 Concerns regarding the NFEPA High water yield areas map .................................................. 11
3. Review of hydrological data for identifying South Africa’s water source areas .........................133.1 The agrohydrological modelling system (ACRU) ......................................................................133.2 The Pitman and SPATSM models .............................................................................................133.3 The DWA water resource planning suite ..................................................................................143.3.1 WRSM90 and WRSM2000 ....................................................................................................143.3.2 Water Situation Assessment Model (WSAM ) .......................................................................153.4 DWA system yield models (WRYM and WRPM) .....................................................................15
4. Review of global methods for identifying strategic water source areas .....................................16
5. Methods used to generate National Water Source Areas .......................................................... 18
6. Results .........................................................................................................................................216.1 Percentage mean annual runoff in relation to land area ..........................................................216.2 Land cover in the Water Source Areas ......................................................................................216.3 Protection levels in the Water Source Areas ............................................................................246.4 Coal fields in the Water Source Areas ......................................................................................26
7. References ....................................................................................................................................31

page 6 | Defining South Africa’s Water Source Areas-WWF

Defining South Africa’s Water Source Areas-WWF | page 7
1. introDuCtion
Water source areas are those areas that supply a disproportionate amount of mean annual runoff to a geographical region of interest. The concept is a relative one, and nested hierarchical areas can be identified as one proceeds from a global scale (e.g. Viviroli et al. 2007), through to continental, regional, national, provincial, municipal and local scales. Strategic water source areas are those that supply substantial downstream economies and urban centres. These water source areas are vital to the national economy.
Strategic water source areas can be regarded as natural ‘‘water factories’’, supporting growth and development needs that are often far away. Deterioration of water quality and quantity in these areas can have a disproportionately large negative effect on the functioning of downstream ecosystems and the overall sustainability of growth and development in the regions they support (Viviroli et al. 2007). Appropriate management of these areas, which often occupy only a small fraction of the land surface area, can greatly support downstream sustainability of water quality and quantity.
In South Africa, such management is particularly important for enhancing downstream water quality and quantity. Not only are the country’s surface water resources extremely limited – South Africa is considered to be one of the driest countries (per capita), with 98 per cent of its surface water already developed (Ashton 2007) – but the country also has a growing water quality problem.
Overloading with nutrients and other pollutants from urban, agricultural and industrial waste has resulted in many dams shifting to an algae-dominated, or eutrophic, state. Sixty-five per cent of the country’s dams are now estimated to be eutrophic or borderline eutrophic (Ashton 2007), with most of these algal blooms containing cyanobacteria (blue-green algae) that is toxic to human health. This renders water of high quality unavailable if not treated, which coupled with failing water infrastructure (Ashton 2007), represents a major challenge to water security in the near future. Water managers are inevitably faced with finding new and innovative ways of improving both water quality and quantity to meet the increasing water demands of the country. Managing strategic water source areas is one way to meet this challenge.
page 8 | Defining South Africa’s Water Source Areas-WWF
1.1 Water source areas elsewhere in the world
Water source areas are often known as “water towers”, a term that was first used by Meybeck et al. (2001) to describe mountain areas that supply disproportionate runoff compared to adjacent lowland areas. Viviroli et al. (2007) went on to identify and map water towers at a global level, with the KwaZulu-Natal Drakensberg featuring in their study. Although much of the published work around “water towers” focuses on approaches to identifying the areas, there are some compelling examples around the world where strategic management of these areas is reaping benefit.
Purchase of the Cedar River catchment for its water supply by the city of Seattle, one of the unhealthiest cities in the USA before the 1890s, made the city one of the healthiest in the United States of America within 10 years. The Cedar River example is a powerful illustration of the long-term benefits of investing in ecological infrastructure, where the investment gains in value over time, partly due to increased scarcity (Cosman et al. 2012). The Cedar River catchment has become an important asset to the Seattle Public Utilities, and there is a general consensus that it was the right decision to invest in the catchment to provide the city with a reliable water source, rather than building new filtration plants (Cosman et al. 2012).
The Catskills catchment in New York is another example of investing in ecological infrastructure for water supply. It has recently been estimated that New York has saved $6 billion (plus running costs) by investing in the Catskills watershed instead of building a filtration plant (Cosman et al. 2012). It only cost New York City around $1 billion to purchase and preserve land in the Catskills.
Similar to the USA examples, the Sydney Catchment Authority in Australia has also secured its water through a commitment to managing land and water ecosystems within “Special Areas”. Strict controls on land use, development and access in the areas help protect the ecological processes that ensure good water quality, and provide opportunities for recreational activities (Cottingham et al. 2000).
Kenya has identified five strategic water source areas, which they term their “water towers”, comprising the upper catchments of all the main rivers in Kenya (excluding the Tsavo River). These water towers provide Kenya with water for agriculture, irrigation, industrial development and hydropower. About 60 per cent of Kenya’s electricity output is produced by these hydropower plants (UNEP 2010).
In Asia, the Himalayas provides fresh water to one of billions of people. This strategic water source area, represented by a vast mountain range, is one of the world’s largest sources of fresh water (Bandyopadhyay and Gyawali 1994). It plays a vital role in supplying water to catchments downstream, which stretch across several countries. The Qinghai-Tibetan Plateau of the Himalayas, one of the highest water generating areas in China, is an important water source for many rivers in China, but is under threat from climate change (Chatterjee et al. 2010), which is impacting the Himalayan glacial ecosystem. These glacial ecosystems are declining at a disturbing rate, and this is set to continue under future climate change scenarios.

Defining South Africa’s Water Source Areas-WWF | page 9
2. revieW of WAter SourCe AreAConCeptS in South AfriCA
2.1 Mountain catchment areas
The concept of protecting water source areas in South Africa is not a new one. As early as 1959, the Soil Conservation Board established an interdepartmental committee to investigate the conservation of the “principal mountain catchments” of the country considered to be “the main sources of the country’s water supply”. Even at this stage, concern was raised over “the varying degrees of abuse … to the considerable detriment of the country’s permanent water supplies”.
The work of the interdepartmental committee resulted in the identification of 109 mountain catchments (Government 1961; Figure 1), defined from topographic maps as the main mass of a mountain or range above the general level of the surrounding plains, including any spurs or connected outliers. Each mountain catchment area was hand-mapped, with information including: key rivers draining the area, total area, total runoff, runoff per unit area, area of State Forest Reserve, ecological condition of the land (good, fair poor), and its importance as a water source area (four categories based on estimates of runoff).
2.2 high water yield areas
The development of national climate and hydrological spatial databases and models since the identification of the Mountain Catchment Areas (Government 1961) has enabled a more systematic and quantitative identification of strategic water source areas, based on mean annual runoff. The nationally available data commonly used for mean annual runoff is provided at a quaternary catchment1 resolution by the National Water Resources Assessments 1990 and 2005 – respectively known as the WR90 (Midgley et al. 1994) and WR2005 (Middleton and Bailey 2009). Mean annual runoff data at a quaternary catchment resolution was used in South Africa’s first National Spatial Biodiversity Assessment 2004 (Driver et al. 2005) to identify those quaternary catchments that provided 20 per cent of South Africa’s mean annual runoff.
This approach met with two limitations. First, the areas identified as important ignored many critical source areas, only identifying globally important areas such as the Drakensberg mountain range, detected in a global review of Viviroli et al. (2007). Second, the resolution of a quaternary catchment is relatively coarse, providing only a rudimentary pattern of the most important areas. It does not offer resolution fine enough to inform development planning and on-the-ground action.
1. Quaternary catchments are hydrological units that are hierarchically nested from the primary drainage basin, through to secondary, tertiary and
quaternary level. They are on average about 650 km2 in size (Nel et al. 2011a).

page 10 | Defining South Africa’s Water Source Areas-WWF
The National Freshwater Ecosystem Priority Areas (NFEPA) project built on these lessons and developed a 1 x 1 minute resolution GIS layer of mean annual runoff using published rainfall-runoff curves for South Africa (Pitman 1996). This GIS layer was then used to identify areas of disproportionate runoff in each primary catchment (Nel et al. 2011b), where areas that were three times higher than the mean annual runoff for the primary were identified as “high water yield areas”. This approach effectively addressed the limitations of the National Biodiversity Assessment 2004. However, initial use of the NFEPA “high water yield areas” map by stakeholders, mainly from the water and biodiversity sectors, revealed a number of concerns. The work reported here sought to address these initial problems, which are summarised below together with an outline of how they have been addressed.
Figure 1: Mountain Catchment Areas identified by government (1961).

Defining South Africa’s Water Source Areas-WWF | page 11
2.3 Concerns regarding the nfepA high water yield areas map In a follow-up study from NFEPA, the Project for Ecosystem Services (ProEcoServ; www.proecoserv.org), in collaboration with WWF, assessed the utility and perceptions of this map by key stakeholder user groups, including scientists, staff in provincial and local government departments, and users in non-governmental organizations. The section below documents the concerns raised and how these were addressed.
Reticence about using runoff data generated from rainfall-runoff curves alone, which was • different data to the more commonly used WR90 and WR2005 data for mean annual runoff. To address the first concern, an adjustment factor was applied to the 1 x 1 minute data so that the mean annual runoff matched the WR2005 data at each quaternary outlet. This essentially means that the rainfall-runoff curves were used to disaggregate to WR2005 mean annual runoff to a 1 x 1 minute resolution.
Use of the term “yield” generated confusion with the term used by hydrological engineers • tasked with providing engineered solutions to provide water at specific assurance of supply by using dams, inter-basin transfers or desalinisation. Yield and runoff are terms with very specific meanings to engineers and hydrologists of the Department of Water Affairs (DWA; see Box 1 for definitions). This concern was addressed by changing the name of the high water yield areas to “strategic water source areas”. This decision and name change was also based on input from national and provincial biodiversity and water scientists, and communication specialists.
Some preference for the use of median rather than mean annual runoff• because South Africa has highly variable runoff (both inter- and intra-annually) and median annual runoff would better identify areas where high runoff is more reliable from year to year. Unfortunately, the rainfall-runoff curves do not allow for generating median annual runoff. A decision was therefore made to continue using mean annual runoff, but in future investigate whether it would be useful to communicate the level of year-to-year variation by categorising the strategic water source areas into reliability classes using the coefficient of variation of mean annual runoff.
Varied consensus around whether some areas in the arid parts of the country represent • strategic water source areas. The vigorous debate around which areas were identified as strategic water source areas, and which not, can be attributed to application of the map across a range of spatial scales. At a global and continental scale, only a handful of areas in South Africa, Lesotho and Swaziland would be identified – mainly the KwaZulu-Natal Drakensberg escarpment and the Western Cape mountains as in Viviroli et al. (2007). However, a national scale map may identify the global areas as well as a few additional areas. At an even finer local scale, several areas additional to those identified at the national scale may be included, and the resulting map may look more like the original mountain catchment areas (Government 1961; Figure 1). This suggests that it may be necessary to identify strategic water source areas at different spatial scales, depending on the target audience. This report focuses on producing strategic water source areas at a national scale. The methods we used to identify these areas could be applied within different sub-national planning domains to identify a larger set of areas, which include the national strategic water source areas.

page 12 | Defining South Africa’s Water Source Areas-WWF
box 1: Clarity on the terms “yield” and “runoff”Yield and runoff are terms with very specific meanings to engineers and hydrologists of the Department of Water Affairs.
Yield, as used within the context of the Department of Water Affairs (DWA), is the amount of water that can be supplied in a catchment using a set human-built water supply schemes (such as dams and inter-basin transfers) as well as taking into account a specified reliability of supply, termed the “assurance of supply”. Yield is therefore the planned human extraction of water that can occur given how frequently the scheme will allow the supply to fail (e.g. what is the likelihood that a dam will dry up in a given time period, where a 1:50 year drought is taken as a 98 per cent assurance – only twice every 100 years is the dam predicted to fail). Currently, the only industry with this 98 per cent assurance of supply is Eskom, which DWA considers a strategic national water user). Yield modeled uses a hydrological systems model (usually the Pitman model; see text below for review of the various models) to simulate flows that include data on mean annual runoff, dam storage potential, and abstraction. The DWA water systems yield model connects to the calibrated simulations from the Pitman model (usually based on WR2005 monthly data) and then looks at yield potential of the catchment, and future risk of the supply failing by applying stochastic hydrology into the future. These types of yield models are usually developed to calculate yields for large water supply schemes, and are not usually done for rural, undeveloped catchments. People in rural, undeveloped catchments rely on streams that are run-of-river and it is here where strategic water source areas are especially important for maintaining good water quality and quantity.
Runoff is the amount of natural flow that occurs in the catchment and is usually expressed on a daily, monthly or annual basis, depending on the application. Different forms of runoff statistics may give different results. For example, using mean annual runoff (the average runoff per year over a long-term time period), has an averaging effect for catchments that have extreme inter-annual runoff; while using a median annual runoff gives an estimate of reliability of areas in generating water. Using a 10th percentile runoff gives an idea of low flows (90 per cent of the time you can expect flows that are higher than this); using a 20-30th percentile gives an idea of baseflows; and using a 70-90th percentile gives an idea of storm flow.
For the purposes of strategic water source areas, runoff is a more appropriate term than yield, because it relates directly to improving reliability of flows using ecosystem-based management approaches , which focus on maintaining healthy rivers and wetlands. This approach then complements various water schemes and relates to the concept of a blended approach to ecological and hard engineering to improve catchment yield.

Defining South Africa’s Water Source Areas-WWF | page 13
3. revieW of hyDrologiCAl DAtA for iDentifying South AfriCA’S WAter SourCe AreAS 3.1 the agrohydrological modelling system (ACru)
ACRU was developed by the University of KwaZulu-Natal to simulate flows in catchments based on climatic data inputs, physical catchment characteristics (particularly soils) and land cover (Schulze and George 1987; Jewitt and Schulze 1999). The most recent model is able to simulate yearly, monthly or daily flows.
The ACRU model is able to simulate flows in ungauged basins using default relationships with measurable catchment properties such as soils, vegetation, and management practices developed specifically for South African conditions (Schulze 2000; Warburton et al. 2010). These default relationships were originally based on the assumption that all vegetation in South Africa was grassland, but the model has subsequently been updated to include Acocks Veld Types. Unfortunately, Acocks Veld Types are still outdated by two superceding vegetation maps (Low and Rebelo 1997; and Mucina and Rutherford 2004).
The ACRU model is most commonly used for assessing the impacts of various land use changes (especially commercial forestry) or climate changes on water resources. DWA hydrologists generally do not use this model, for several reported reasons:
It was developed primarily for moister grassland climates in South Africa in KwaZulu-Natal, • and has been less widely applied in the drier parts of South Africa, where its success has not been adequately tested.Hydrologists who undertake ecological reserve determinations report that the ACRU model • tends to overestimates flows.It is more data intensive than many of the other available models in the DWA water • resource planning suite (see Section 3.3), which allow users to calibrate simulations against observed data by changing parameters until the simulations match real-time observations, without necessarily justifying the changes.
3.2 the pitman and SpAtSM models
The Pitman model is the hydrological model that forms the backbone of the DWA water resource planning suite (Section 3.3), and typically operates on a monthly time-step basis. It was developed from concepts of the Stanford Watershed Model (Crawford and Linsley 1966) in the 1970s (Pitman 1973) and has undergone several revisions since then. It is essentially a rainfall-runoff model that operates using explicit soil moisture accounting representing interception, soil moisture and ground water storages, with model functions to represent the inflows and outflows from these. The model is designed to allow for abstractions from distributed farm dams, direct from the river, as well as from major storage dams at the outlet of each sub-catchment. It is thus able to measure the extent to which observed flows represent natural flows.
The SPATSM model (Spatial and Time Series Information Modelling) is a refined Pitman model originally developed to integrate the many hydrological procedures used for environmental flow assessment in South Africa, but it also has wider applicability (Hughes 2004a). It therefore includes data preparation and analysis facilities typically required for South African hydrological modelling environmental flow assessment. For example, using current or future water development, the SPATSM model can determine whether specific ecological reserve requirements (e.g. a certain flow required for overbank flooding each year to sustain riparian vegetation) can be met. SPATSM can use quaternary data, but is also able to apply more site specific data for instream flow requirements.

page 14 | Defining South Africa’s Water Source Areas-WWF
3.3 the DWA water resource planning suite
The Pitman model, and sometimes its refined counterpart SPATSM, form the basis of most of the hydrological engineering assessments and models used by DWA, which focus on simulating natural and observed stream flows, or on assessing systems yield while achieving the ecological reserve requirements.
3.3.1 WrSM90 and WrSM2000
The WRSM90 and WRSM2000 were developed respectively for the WR90 and WR2005 national water resource assessments (Pitman et al. 2008). They both use the Pitman model to generate rainfall-runoff relationships with observed data, which are then regionalised to ungauged catchments. Both models consider changes in land use, including irrigation, afforestation, urbanisation, dams, abstractions, return flows and water transfers in or out of the catchment. In the WR90 and WR2005 assessments, these land use changes were varied over time to mimic the actual historical changes that had taken place over the period of simulation (1920-1989 for WR90; 1920-1999 for WR2005).
Because the models are able to allow for land use changes, they are able to estimate naturalised flow, which is useful for the purposes of this study.
WRSM2000 was developed for the WR2005 and is essentially an updated version of the WRSM90. The upgraded version kept all the original WRSM90 model parameters (did not recalculate existing relationships), while adding several other components. The upgrades included the following (Pitman et al. 2011):
Extending the observed hydrological data to include 10 years of additional data• Modelling of the surface water/groundwater process using approaches by Sami (2005) and • Hughes (2004b) Improved modelling of the impact of afforestation• Improved modelling of irrigation • Improved modelling of wetlands • Modelling of the impact of alien vegetation • Modelling of the impact of mining areas (addition of a mining module)• Inclusion of SPATSM for ecological water requirement assessments.•
Although the WR2005 seems to be the most widely used model, users are cautioned that the data are of patchy quality across the country. Not only is there inconsistent quality, but there are also discrepancies at the interfaces of the different catchments/river systems. For this reason, many ecologists working on ecological reserve determinations have reverted to the WR90, or a combination of both models. Despite these limitations, there are several advantages of using the WR2005 over the WR90:
It is the standard dataset endorsed and used by DWA hydrologists and engineers; 1.
It includes a component explicitly dealing with invasive alien plants, where dense stands 2. are treated as a form of plantation and water is removed from the system accordingly. It is important to note, however, that the scientific predictions for invasive alien plant water use (Verfeld et al. 1994) were halved in this regard, which leads to gross under-predictions of water use by invasive alien plants, as evidenced in many of the DWA internal strategic perspectives. Nevertheless, the user is able to access this water use parameter and change the water use to something more similar to that of Versfeld et al. (1994).

Defining South Africa’s Water Source Areas-WWF | page 15
WR2005 attempted to take account of groundwater in the form of baseflow contribution. 3.
The models were used in the national water resource assessments, generating data and information that are now widely available, including: base map of catchments and rivers, rainfall, evaporation, runoff, land cover and water use, WRSM90 model parameters, geology, soils, sediment yield and vegetation. They are maps of water resources, rather than yield models themselves.
3.3.2 Water Situation Assessment Model (WSAM)
DWA developed WSAM as a macro-scale water resource planning tool for desktop modelling of system yield at 98 per cent assurance of supply under various development scenarios. WSAM is able to take into account data such as water demand (urban, rural, industrial, agricultural), invasive alien plant water use, groundwater supply and requirements, ecological reserve requirements, dam storage, inter-basin transfers, cumulative run-of-river yield. Using annual water resource data at quaternary catchment scale, information is then summarised on the availability, supply and use of water resources at a national, sub-national and catchment level. It also summarises 1995 yield data for each quaternary.
WSAM is intended primarily for reconciling the water resources and water requirements for defined catchment areas (especially water stressed catchments), by calculating the annual water balance at 98 per cent assurance of supply (equivalent to a recurrence interval of failure of 1 in 50 years). It can also assess the impact that various development options have on yield, e.g. meeting the ecological water requirements. According to ecological reserve specialists at CSIR, WSAM operates well at the macro-scale for simulating changes to flow with alteration to land use (i.e. the land use coefficients seem good), but it is not good at estimating impacts from large, deep dams.
3.4 DWA system yield models (WryM and WrpM)
The DWA water resources systems models comprise the Water Resources Yield Model (WRYM) and Water Resources Planning Model (WRPM), and were developed by DWA to assist planners in more detailed water resource planning at a catchment scale, under various development and operating scenarios. The WRYM is used to assess long-term yield capabilities of a catchment for a given operating policy, i.e. the system and the system demands remain constant throughout the simulation period. The WRPM can be used to assess implementation dates of new schemes and for month to month operation of a system.
The WRYM model connects to calibrated simulations from the Pitman model (usually based on WR 2005 monthly data), and then looks at yield potential of the catchment, and future risk by applying stochastic hydrology into the future. The model outputs monthly data for a particular dam, but some do daily. The model has been applied widely in DWA’s internal strategic perspectives to examine catchment yield under different development scenarios.

page 16 | Defining South Africa’s Water Source Areas-WWF
4. revieW of globAl MethoDS for iDentifying WAter SourCe AreASViviroli et al. (2007) is the most recent publication on methods for identifying water source areas (or “water towers” as they term them). They also calculated a ratio of lowland water availability to water supply from mountains as a measure of the water demand in the lowlands that is fulfilled by the water towers. These global measures of water demand are, however, somewhat flawed at the national scale, as they are based purely on population numbers combined with a per capita water requirement of 500 m3/yr. This does not take into account the extensive water transfer schemes between areas, such as those that exist in the Drakensberg escarpment of KwaZulu-Natal and Lesotho. Here, we report solely on their method for identifying water towers.
Viviroli et al. (2007) applied the following methods:Water towers were identified based on a relative measure, defined as an elevated area that 1. delivers a disproportionate runoff to a lowland area. This required explicit GIS rules to be set for:
Distinguishing mountain (elevated) areas from lowland areas• Quantifying runoff of mountain and lowland areas• Setting thresholds of runoff that define the area as a water tower.•
A mountain area was defined using average cell altitude at 0.5 x 0.5 degree resolution 2. and average roughness indicator at 0.5 x 0.5 minute resolution (USGS 1996), where relief roughness was calculated as a function of cell length and minimum and maximum elevation in a cell. Mountain cells were thus defined as all cells above 1000 m above sea level (asl), as well as between 200 and 1000 m asl with a relief roughness of more than 20 per cent.
Long-term mean annual runoff was modelled for each 0.5 x 0.5 degree cell from 663 3. gauging stations from the Global Runoff Data Center database, using a water balance model (Vörösmarty et al. 1998). For each mountain cell, a relative measure of runoff was calculated using the mountain cell runoff divided by the average of the lowland areas in the associated basin (Equation 1).
EQUATION 1:4. Where rmi,j is runoff in each mountain cell i which belongs to analysis basin j (mm/yr) and RLj is the average lowland runoff in analysis basin j (mm/yr). RLj is thus an aggregate value for the whole lowland area, while rmi,j as well as the resulting RWYi,j are specific for each mountain cell.
RWYi,j =rmRL
i,j
j
Defining South Africa’s Water Source Areas-WWF | page 17
Water towers were then defined according to thresholds that were variable depending on 5. whether the lowland area was “arid” or “wet”. The classification of lowland areas into arid and wet was done using the Leeman’s (1992) seven aggregated Holdridge life zones, where steppe, arid and sub-tropical were defined as “dry”; and polar/cold, cool, temperate or humid-tropical were defined as “wet”.
Viviroli et al. (2007) thus identified four types of water towers: essential water towers, occasional water towers (either seasonally or in single years), supportive water towers, and limited water towers. Their methods of calculating runoff as a proportion relative to the adjacent lowland areas, was similar to the approach adopted to develop the NFEPA high water yield areas map. Although mountain and lowland areas were not explicitly distinguished, the NFEPA approach calculated runoff per 1 x 1 minute cell as a proportion of the runoff for the entire associated primary catchment. The NFEPA approach deviated from the Viviroli et al. (2007) approach in the setting of thresholds that defined what constituted a high water yield area. The NFEPA approach applied a single qualifying threshold of three times the runoff of the primary catchment, whereas the Viviroli et al. (2007) approach applied a variable threshold dependent on Leeman’s (1992) aggregated Holdridge life zones (“wet” vs. “dry”).

page 18 | Defining South Africa’s Water Source Areas-WWF
5. MethoDS uSeD to generAte WAter SourCe AreAS
In a nutshell
This map uses the Water Resources of South Africa data (WR2005) for mean annual rainfall at a quaternary catchment scale, which was then disaggregated to a 1 x 1 minute grid resolution using published rainfall-runoff relationships for South Africa.
The map of strategic water source areas was derived using mean annual precipitation data at a 1 x 1 minute resolution for the entire country (Schulze 1997). This was converted into mean annual runoff using a set of generalised rainfall-runoff relationships provided by Pitman (1996) and used in the WR90 project (Midgley et al. 1994):
MAR = (MAP-B+3) + (C / exp((MAP-A)/C) )
Where:MAR = mean annual runoff (mm per year)• MAP = mean annual precipitation (mm)• exp = e to the power of• A = 75 + 45Z• B = 225 + 135Z• C = 150 + 90Z• Z = climate-related zone number, ranging from 1 (driest) to 9 (wettest). For example 9 • is valid only for mean annual precipitation > 550 mm and 1 is valid only for mean annual precipitation > 300 mm.
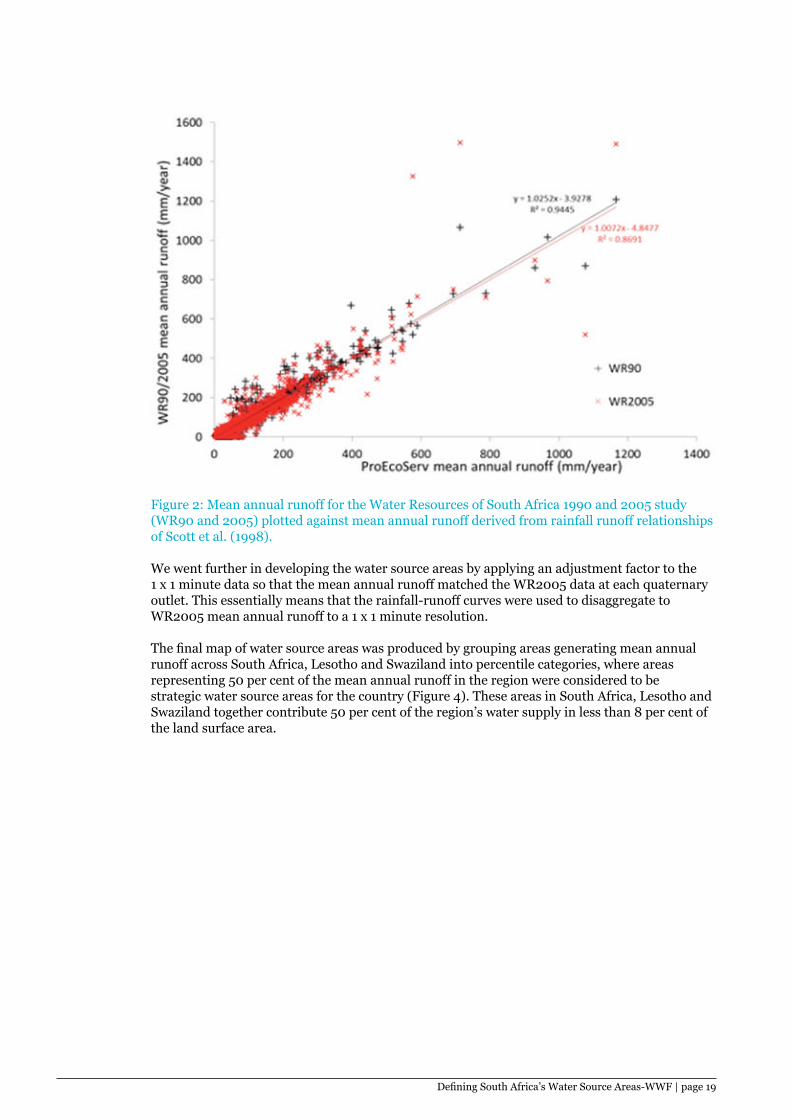
The disaggregated 1 x 1 minute data thus generated were summarised to a quaternary catchment scale so that it could be compared to the quaternary catchment mean annual runoff of both the WR90 and WR2005 national water resource assessments (Midgley et al. 1994; Middleton and Bailey 2009). The results were favourable, with r-squared values of 0.87 and 0.95 for WR90 and WR2005 respectively (Figure 3). These were the data that underpinned the identification of NFEPA’s “high water yield areas”.
Defining South Africa’s Water Source Areas-WWF | page 19
Figure 2: Mean annual runoff for the Water Resources of South Africa 1990 and 2005 study (WR90 and 2005) plotted against mean annual runoff derived from rainfall runoff relationships of Scott et al. (1998).
We went further in developing the water source areas by applying an adjustment factor to the 1 x 1 minute data so that the mean annual runoff matched the WR2005 data at each quaternary outlet. This essentially means that the rainfall-runoff curves were used to disaggregate to WR2005 mean annual runoff to a 1 x 1 minute resolution.
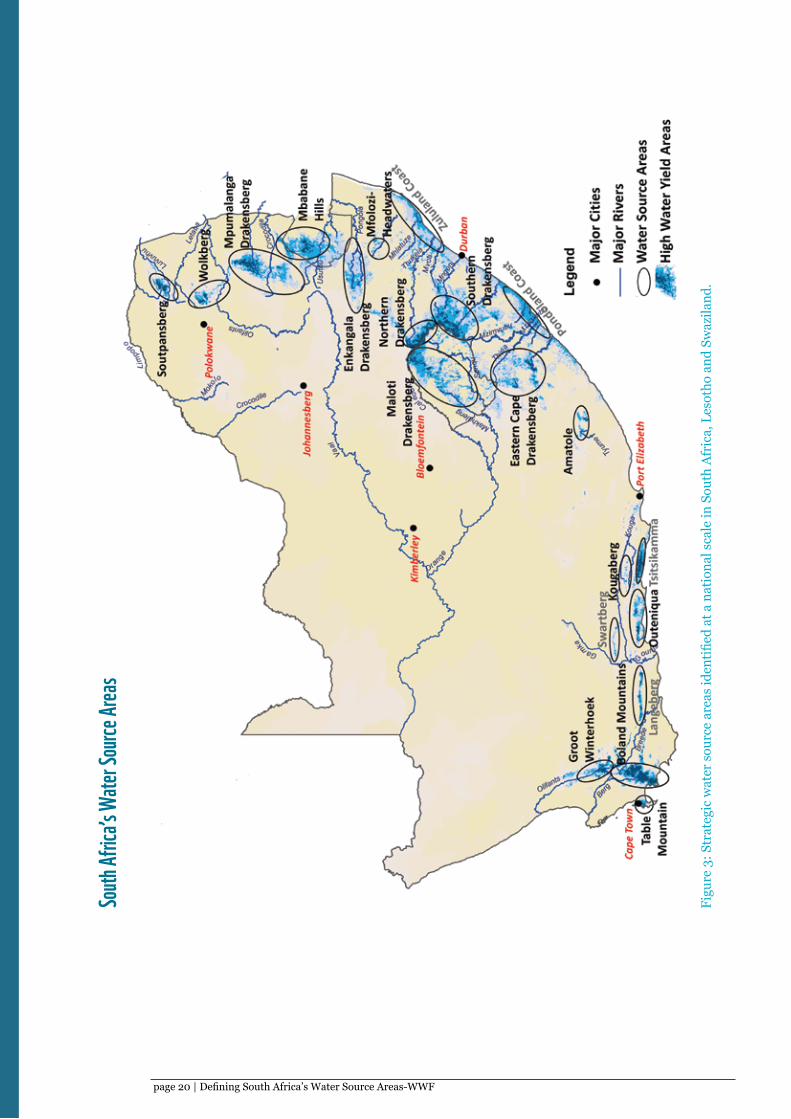
The final map of water source areas was produced by grouping areas generating mean annual runoff across South Africa, Lesotho and Swaziland into percentile categories, where areas representing 50 per cent of the mean annual runoff in the region were considered to be strategic water source areas for the country (Figure 4). These areas in South Africa, Lesotho and Swaziland together contribute 50 per cent of the region’s water supply in less than 8 per cent of the land surface area.
page 20 | Defining South Africa’s Water Source Areas-WWF
Figu
re 3
: Str
ateg
ic w
ater
sou
rce
area
s id
enti
fied
at a
nat
iona
l sca
le in
Sou
th A
fric
a, L
esot
ho a
nd S
waz
iland
.
South
Afric
a’s W
ater S
ource
Areas
Defining South Africa’s Water Source Areas-WWF | page 21
6. reSultS
6.1 percentage mean annual runoff in relation to land area
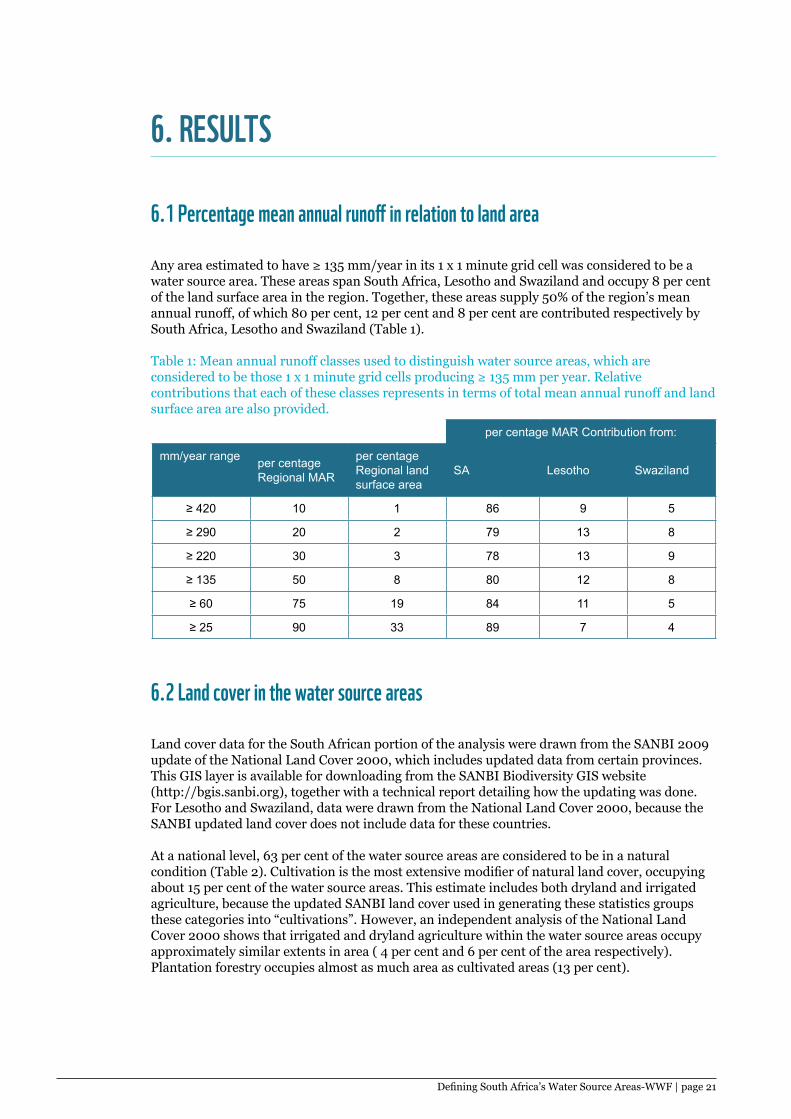
Any area estimated to have ≥ 135 mm/year in its 1 x 1 minute grid cell was considered to be a water source area. These areas span South Africa, Lesotho and Swaziland and occupy 8 per cent of the land surface area in the region. Together, these areas supply 50% of the region’s mean annual runoff, of which 80 per cent, 12 per cent and 8 per cent are contributed respectively by South Africa, Lesotho and Swaziland (Table 1).
Table 1: Mean annual runoff classes used to distinguish water source areas, which are considered to be those 1 x 1 minute grid cells producing ≥ 135 mm per year. Relative contributions that each of these classes represents in terms of total mean annual runoff and land surface area are also provided.
per centage MAR Contribution from:
mm/year range per centage Regional MAR
per centage Regional land surface area
SA Lesotho Swaziland
≥ 420 10 1 86 9 5
≥ 290 20 2 79 13 8
≥ 220 30 3 78 13 9
≥ 135 50 8 80 12 8
≥ 60 75 19 84 11 5
≥ 25 90 33 89 7 4
6.2 land cover in the water source areas
Land cover data for the South African portion of the analysis were drawn from the SANBI 2009 update of the National Land Cover 2000, which includes updated data from certain provinces. This GIS layer is available for downloading from the SANBI Biodiversity GIS website(http://bgis.sanbi.org), together with a technical report detailing how the updating was done. For Lesotho and Swaziland, data were drawn from the National Land Cover 2000, because the SANBI updated land cover does not include data for these countries.
At a national level, 63 per cent of the water source areas are considered to be in a natural condition (Table 2). Cultivation is the most extensive modifier of natural land cover, occupying about 15 per cent of the water source areas. This estimate includes both dryland and irrigated agriculture, because the updated SANBI land cover used in generating these statistics groups these categories into “cultivations”. However, an independent analysis of the National Land Cover 2000 shows that irrigated and dryland agriculture within the water source areas occupy approximately similar extents in area ( 4 per cent and 6 per cent of the area respectively). Plantation forestry occupies almost as much area as cultivated areas (13 per cent).
page 22 | Defining South Africa’s Water Source Areas-WWF
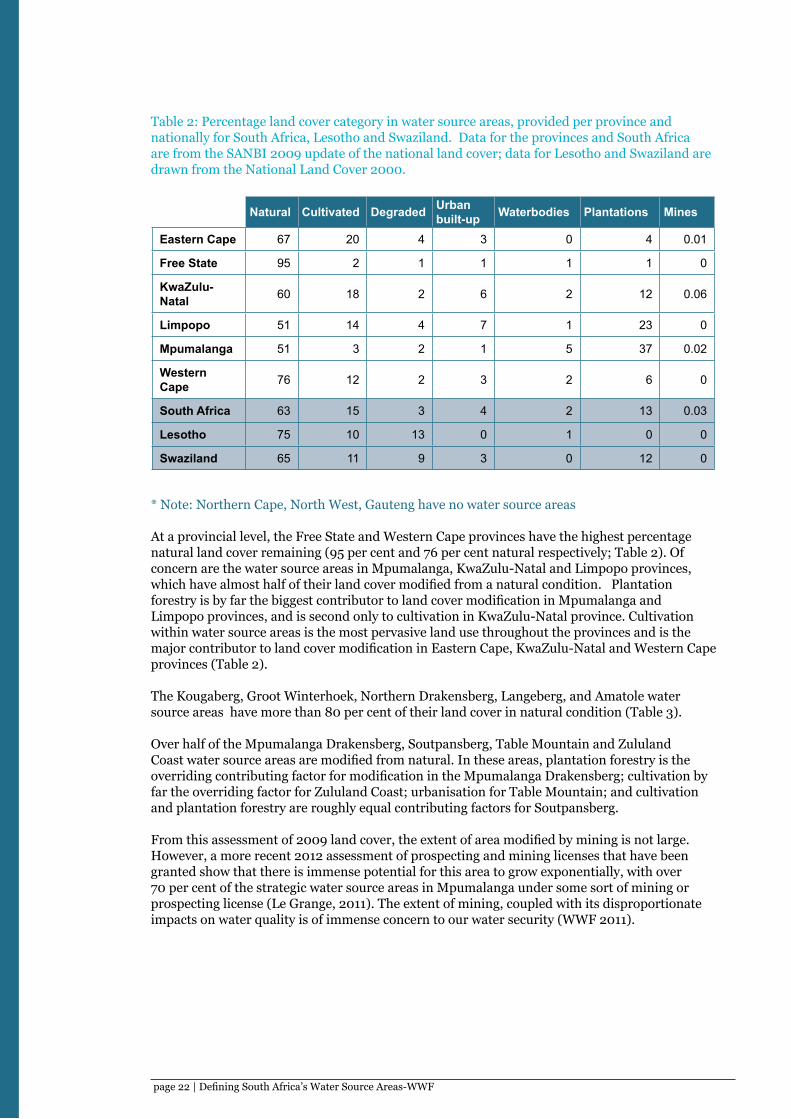
Table 2: Percentage land cover category in water source areas, provided per province and nationally for South Africa, Lesotho and Swaziland. Data for the provinces and South Africa are from the SANBI 2009 update of the national land cover; data for Lesotho and Swaziland are drawn from the National Land Cover 2000.
Natural Cultivated Degraded Urban built-up Waterbodies Plantations Mines
Eastern Cape 67 20 4 3 0 4 0.01
Free State 95 2 1 1 1 1 0
KwaZulu-Natal 60 18 2 6 2 12 0.06
Limpopo 51 14 4 7 1 23 0
Mpumalanga 51 3 2 1 5 37 0.02
Western Cape 76 12 2 3 2 6 0
South Africa 63 15 3 4 2 13 0.03
Lesotho 75 10 13 0 1 0 0
Swaziland 65 11 9 3 0 12 0
* Note: Northern Cape, North West, Gauteng have no water source areas
At a provincial level, the Free State and Western Cape provinces have the highest percentage natural land cover remaining (95 per cent and 76 per cent natural respectively; Table 2). Of concern are the water source areas in Mpumalanga, KwaZulu-Natal and Limpopo provinces, which have almost half of their land cover modified from a natural condition. Plantation forestry is by far the biggest contributor to land cover modification in Mpumalanga and Limpopo provinces, and is second only to cultivation in KwaZulu-Natal province. Cultivation within water source areas is the most pervasive land use throughout the provinces and is the major contributor to land cover modification in Eastern Cape, KwaZulu-Natal and Western Cape provinces (Table 2).
The Kougaberg, Groot Winterhoek, Northern Drakensberg, Langeberg, and Amatole water source areas have more than 80 per cent of their land cover in natural condition (Table 3).
Over half of the Mpumalanga Drakensberg, Soutpansberg, Table Mountain and Zululand Coast water source areas are modified from natural. In these areas, plantation forestry is the overriding contributing factor for modification in the Mpumalanga Drakensberg; cultivation by far the overriding factor for Zululand Coast; urbanisation for Table Mountain; and cultivation and plantation forestry are roughly equal contributing factors for Soutpansberg.
From this assessment of 2009 land cover, the extent of area modified by mining is not large. However, a more recent 2012 assessment of prospecting and mining licenses that have been granted show that there is immense potential for this area to grow exponentially, with over 70 per cent of the strategic water source areas in Mpumalanga under some sort of mining or prospecting license (Le Grange, 2011). The extent of mining, coupled with its disproportionate impacts on water quality is of immense concern to our water security (WWF 2011).

Defining South Africa’s Water Source Areas-WWF | page 23
Table 3: Percentage land cover category in each water source areas – provided for the South African portion only. Data are from the SANBI 2009 update of the national land cover and do not include data for the Lesotho and Swaziland portions.
SWSA Sub-Cluster Natural Cultivated Degraded Urban
built-up Waterbodies Plantations Mines
Groot Winterhoek 89 8 2 0 1 0 0
Table Mountain 38 5 0 50 2 4 0
Boland Mountains 70 16 5 2 3 4 0
Langeberg 82 10 0 1 1 5 0
Swartberg 97 2 0 0 0 0 0Outeniqua 64 11 0 3 3 18 0Kougaberg 100 0 0 0 0 0 0Tsitsikamma 59 21 1 1 1 17 0Amatole 82 6 1 2 1 9 0Eastern Cape Drakensberg 73 10 8 4 0 6 0
Southern Drakensberg 65 13 2 4 1 16 0
Maloti Drakensberg 68 21 5 4 2 0 0
Northern Drakensberg 86 8 2 1 2 2 0
Pondoland Coast 59 28 1 9 1 2 0
Zululand Coast 36 38 3 8 4 11 0Mfolozi Headwaters 68 4 4 3 1 20 0
Enkangala Drakensberg 68 9 3 1 3 16 0
Mbabane Hills 49 4 2 2 6 37 0Mpumalanga Drakensberg 48 2 1 1 4 44 0
Wolkberg 54 10 2 3 3 27 0Soutpansberg 41 19 5 12 1 23 0

page 24 | Defining South Africa’s Water Source Areas-WWF
6.3 protection levels in the national strategic water source areasThe most recent protected areas GIS layer, used in the National Biodiversity Assessment 2011, was applied in this analysis. This GIS layer can be downloaded, together with its metadata, from the SANBI Biodiversity GIS website (http://bgis.sanbi.org). The analysis focused on formal protected areas, which are recognised in the National Environmental Management: Protected Areas Act (Act 57 of 2003). The Protected Areas Act provides for several categories of protected areas, including special nature reserves, national parks, nature reserves and protected environments. Under this definition, areas of land not formally protected by law but informally protected by the current owners and users are not considered protected even if managed for biodiversity conservation. This is because there is no long-term security associated with conservation areas, and they are not considered a strong form of protection.
Formal protected areas that were used in this assessment are divided into “formal A” and “formal B” protected areas, which define the level of protection, with formal B protected areas having less stringent forms of protection than formal A (Table 4). Mountain Catchment Areas are defined as formal B protected areas.
Table 4: Formal A and B protected areas and their descriptions.
Formal A protected Areas Forest Act Protected Area Specially protected forest areas, forest nature reserves and forest wilderness areas
declared in terms of the National Forests Act, 1998 (Act No. 84 of 1998)Island Reserve A sub- set of provisional nature reserves, which are islands administrated by
provinces in terms of provisional legislations Marine protected Area An area declared as a marine protected area in terms of section 43 of the Marine
Living Resource Act, 1998 (Act No. 18 of 1998)National Park An area declared in terms of the national park Act, 1978 (Act No.57 of 1976), or in
terms of Section 20 of the protected Areas Amendment Act, 2004 (Act No. 31, 2004), including private areas declared under this legislation.
Other national protected area A nature reserve other than a national park or special nature reserve , managed by a national organ of state or which falls under the jurisdiction of the Minister for any other reason
Provisional Nature reserve An area declared in terms of section 23 of Protected Areas Act, 2003 (No.57 of 2003), or declared in terms of provisional legislation for conservation purposes, and which managers by a provincial organ of state, including private areas declared under this legislation
Special nature reserve An area which was a special nature reserve in terms of the Environment Conservation Act, 1989 (Act No. 73 of 1989), or an area declared in terms of section 18 of Protected Areas Act, 2003 (No. 57 of 2003)
World heritage Site A world heritage site declared in terms of the World Heritage Convention Act, 1999 (Act No.49 of 1999)
MPA Marine Protected Area, usually associated with an adjacent terrestrial area and managed by the same agency.
Formal B protected AreasMountain Catchment Area An area declared in terms of the Mountain Catchment Area Act, 1970 (Act No. 63 of
1970)Local nature Reserve A nature reserve which is managed by a municipality, potentially of undefined legal
statusNational Botanical Garden A reserve managed by the South African Botanical Institute
Only 16 per cent of the national strategic water source areas in South Africa enjoy legal protection (Table 5). A small handful of the original mountain catchment areas identified in 1961 were subsequently formally protected in the Western Cape Province and that are now under the administration of the provincial conservation authority, CapeNature. This is evidenced by the analysis shown in Table 5, which shows much higher levels of protection for the Western Cape (57 per cent protection) compared to the next best protected province, Limpopo, which has 12 per cent of its national strategic water source areas protected.

Defining South Africa’s Water Source Areas-WWF | page 25
Only the Kougaberg, Table Mountain, Groot Winterhoek, Langeberg, Boland and Swartberg national strategic water source areas – all falling within the Cape Fold Mountains of the Western Cape – have over half of their area protected (Table 6). The Enkangala Drakensberg, Mfolozi Headwaters, Maloti Drakensberg and Pondoland Coast are less than 5 per cent protected, while Soutpansberg and Eastern Cape Drakensberg are glaring gaps that have zero formal protection.
A key recommendation stemming from both the National Protected Area Expansion Strategy 2008 (Government 2010) and the recently-completed National Freshwater Ecosystem Priority Areas project (NFEPA; Nel et al. 2011) is to protect the country’s strategic water source areas through focused integrated catchment management that provides a range of instruments to enable cooperation and the involvement of private landowners.
Table 5: Protection levels of national strategic water source areas per province and nationally (per centage of area).
Protected - Formal A Protected - Formal B Not protected
Eastern Cape 6 0.17 94
Free State 4 0.00 96KwaZulu-Natal 10 0.17 90Limpopo 12 0.00 88Mpumalanga 9 0.14 90Western Cape 31 26 43South Africa 12 4 84
*Note: Northern Cape, North West, Gauteng have no national strategic water source areas
Table 6: Protection levels of each national strategic water source area (per centage of area). These statistics exclude Lesotho and Swaziland.
SWSA Sub-Cluster Protected - Formal A Protected - Formal B Not protectedGroot Winterhoek 21 50 28Table Mountain 39 0 61Boland Mountains 35 23 42Langeberg 30 30 39Swartberg 59 17 24Outeniqua 29 1 70Kougaberg 77 0 23Tsitsikamma 41 1 59Amatole 16 0 84Eastern Cape Drakensberg 0 0 100Southern Drakensberg 14 0 86Maloti Drakensberg 1 0 99Northern Drakensberg 8 0 92Pondoland Coast 2 0 98Zululand Coast 6 0 94Mfolozi Headwaters 1 0 99Enkangala Drakensberg 1 0 99Mbabane Hills 3 0 97Mpumalanga Drakensberg 9 0 91Wolkberg 22 0 78Soutpansberg 0 0 100

page 26 | Defining South Africa’s Water Source Areas-WWF
6.4 Coal fields in the water source areasSouth Africa is a coal-rich country with significant reserves. Power production has been dependent on coal, and the government plans for the majority of our electricity to be generated from coal-fired power for the foreseeable future, even with an increase in the contribution from renewables. Currently coal accounts for 92 per cent of South Africa’s electricity generation. South Africa has 19 coal fields within the Karoo super group strata. South Africa’s coal resources rank fifth in the world, with total recoverable reserves estimated to be 55 333 Mt53 or 50 years of coal supply remaining. The Waterberg, Highveld, Witbank, Free State and Ermelo field have the greatest proportion of remaining reserves. It is important to note that the spatial extent of coal fields is not the only indicator of the potential of the coal field, and that the real potential should integrate spatial extent with the knowledge of remaining and recoverable coal within each coal field (Table 7).
At a national level, only 0.5 per cent of the strategic water source areas in the country overlap with coal fields (Figure 5, Table 8), and in many of these areas only a fraction of the coal within the coal field is remaining or recoverable (Table 7).
Although there is relatively little spatial overlap at a national level, with the Mfolozi Headwaters and Pongola Drakensberg having over 30 per cent spatial overlap. These areas are highly vulnerable to coal mining. WWF recommends engaging with the Department of Mineral Resources on how best to approach mining potential in these areas while maintaining the valuable water supply that they provide. It is particularly important in the Mfolozi Headwaters and Pongola Drakensberg to articulate the value of water, both in terms of national economic development and the many regional livelihoods it supports in these areas.
Table 7: The extent of coal fields, their economically recoverable potential, the run-of-mine production and thus the remaining coal reserves (after WWF 2011).
Coal Field In S
tudy
Perc
enta
ge o
f C
oal F
ield
in E
GP
Rec
over
able
Mt
Rec
over
able
of
Nat
Rec
over
able
R
eser
ves
(200
0)
% re
cove
rabl
e (M
t) in
EG
P N
atio
nal
Rec
over
able
R
eser
ves
(200
0)
RO
M p
rodu
ctio
n (1
982-
2000
) Mt
RO
M p
rodu
ctio
n %
of N
atio
nal R
OM
pr
oduc
tion
Rem
aini
ng M
t
Rem
aini
ng %
Rem
aini
ng o
f N
atio
nal R
emai
ning
R
eser
ves
(200
0)Ermelo 10028 3231 32% 4698 8% 3% 101 2% 4597 98% 9%
Highveld 7712 2243 29% 10979 20% 6% 972 22% 10007 91% 20%
Utrecht 2249 1551 69% 649 1% 1% 64 1% 585 90% 1%
Klip River 4894 308 6% 655 1% 0% 85 2% 570 87% 1%
Waterberg 2416 15487 28% 384 9% 15103 98% 30%
Witbank 7627 12460 23% 2320 53% 10140 81% 20%
Free State 10577 4919 9% 0 0% 4919 100% 10%
Vereeniging - Sasolburg 5658 2233 4% 335 8% 1898 85% 4%
Springbok Flats 8769 1700 3% 0 0% 1700 100% 3%
South Rand 780 730 1% 22 1% 708 97% 1%
Soutpansberg 267 0% 6 0% 261 98% 1%
Vryheid 204 0% 82 2% 122 60% 0%
Kankwane 3037 147 0% 1 0% 146 99% 0%
Tuli (Limpopo) 1242 107 0% 0 0% 107 100% 0%
Somkele & Nongoma 2170 98 0% 15 0% 83 85% 0%
TOTAL 55333 9 % 4389 50944 92%

Defining South Africa’s Water Source Areas-WWF | page 27
Table 8: Area (m2) of overlap of each strategic water source area with coal fields in South Africa.
Strategic water source area UTRECHT VEREENIGING
- SASOLBURG VRYHEID WATERBERG WITBANK Total Area of SWSA
Area coalfield
within SWSA
per centage Area
coalfield within SWSA
Amatole 0 0 0 0 0 997625942 0 0.00
Boland Mountains 0 0 0 0 0 4089883739 0 0.00
Eastern Cape Drakensberg 0 0 0 0 0 9414025405 56425120 0.60
Groot Winterhoek 0 0 0 0 0 3472512235 0 0.00
Kougaberg 0 0 0 0 0 302756819 0 0.00
Langeberg 0 0 0 0 0 924763374 0 0.00
Maloti Drakensberg 0 0 0 0 0 9041983723 0 0.00
Mbabane Hills 0 0 0 0 0 10208174208 0 0.00
Mfolozi Headwaters 0 0 2E+08 0 0 859874270 268884093 31.27
Mpumalanga Drakensberg 0 0 0 0 0 6672007776 2809929 0.04
Northern Drakensberg 0 0 0 0 0 7571860647 577288636 7.62
Outeniqua 0 0 0 0 0 2118366491 0 0.00
Phongola Drakensberg 1E+09 0 4E+07 0 0 5499839910 2030828321 36.93
Pondoland Coast 0 0 0 0 0 9416311491 2148790 0.02
Southern Drakensberg 0 0 0 0 0 14850661913 0 0.00
Soutpansberg 0 0 0 0 0 1538968172 0 0.00
Swartberg 0 0 0 0 0 386704791 0 0.00
Table Mountain 0 0 0 0 0 349709656 0 0.00
Tsitsikamma 0 0 0 0 0 1747079750 0 0.00
Wolkberg 0 0 0 0 0 1717486359 0 0.00
Zululand Coast 0 0 0 0 0 7425129619 38839292 0.52

page 28 | Defining South Africa’s Water Source Areas-WWF
Figu
re 5
: Ove
rlap
of n
atio
nal w
ater
sour
ce a
reas
wit
h th
e co
al fi
elds
in S
outh
Afr
ica
the o
ccurre
nce of
coal r
eserve
s and
water
sourc
e area
s in So
uth Af
rica
Defining South Africa’s Water Source Areas-WWF | page 29
7. referenCeS
Bandyopadhyay, J. and Gyawali, D. 1994. Himalayan water resources: ecological and political aspects of management. Mountain Research and Development, 1-24
Chatterjee, A., Blom, E., Gujja, B., Jacimovic, R., Beevers, L., O’Keeffe, J., Beland, M. and Biggs, T. 2010. WWF initiatives to study the impact of climate change on Himalayan high-altitude wetlands (HAWs). Mountain Research and Development, 30(1):42-52
Cottingham, P., Georges, A., Briscoe, D., Butcher, R., Cullen, P., Deere, D., Harris, J., Hughes, J., Knowles, M., Lake, S., Lanertz, K., Paul, T., Reed, J., Williams, S. and Yates, D. 2000. Sydney Catchment Authority Managing Biodiversity in the Sydney Water Supply Catchments
Cosman, D., Schmidt, R., Harrison-Cox, J. and Batker, D. 2012. How water utilities can spearhead natural capital accounting. The Solutions Journal, 2(6):28-31
Crawford, N.H. and Linsley R.K. 1966 Digital simulation in hydrology: Standford Watershed Model IV. Technical report no 39. Department of Civil Engineering, Stanford University, California, USA. July 1966.
Hughes, DA (Ed) (2004a) SPATSIM, an integrating framework for ecological Reserve determination and implementation. Water Research Commission Report No 1160/1/04
Hughes DA (2004b) Incorporating groundwater recharge and discharge functions into an existing rainfall-runoff model. Hydrol. Sci. J
La Grange, R. 2011. The rate and projected impact of development, with emphasis on mining, on biodiversity in the Mpumalanga Province, South Africa. Honours Dissertation, Department of Plant Science, University of Pretoria
Leemans, R. (1992), Global Holdridge life zone classifications, in Global Ecosystems Database Version 2.0, NOAA Nat. Geophys. Data Cent., Boulder, Colo
Messerli, B., Viviroli, D. and Weingartner, R. 2004. Mountains of the world: vulnerable water towers for the 21st Century. Ambio, 29-34
Nel, J.L., Driver, A., Strydom, W.F., Maherry, A., Petersen, C., Hill, L., Roux, D.J., Nienaber, S., van Deventer, H., Swartz, E. And Smith-Adao, L.B. 2011. Atlas of Freshwater Ecosystem Priority Areas in South Africa: Maps to support sustainable development of water resources. WRC Report No. TT 500/11
Middleton B.J. and Bailey A.K. 2009. Water Resources of South Africa, 2005 study. Water Research Commission Report Number TT 380/08, Water Research Commission, Pretoria, South Africa

page 30 | Defining South Africa’s Water Source Areas-WWF
Pitman WV. 1996. Personal communication. Steward Scott Incorporated, Johannesburg
Pitman, WV, Kakebeeke, JP and Bailey, AK, 2006. Water Resources Simulation Model for Windows:Users Guide. Compiled for the Water Research Commission, Pretoria, South Africa.
Pitman WV, Kakebeeke JP and Bailey AK (2008) WRSM2000 (enhanced) Water Resources Simulation Model for Windows, User’s Guide. WRC, Pretoria
Pitman, W.V. 2011. Overview of water resource assessment in South Africa: current state and future challenges. Water SA vol.37 no.5 Pretoria
Rai, S. C. and Gurung, A. 2005. Raising awareness of the impacts of climate change: Initial steps in shaping policy in Nepal. Mountain Research and Development, 25(4):316-320
Sagoff, M. 2002. On the value of natural ecosystems: the Catskills parable. Politics and the Life Sciences, 19-25
Sami K (2005) Technical Documentation for Surface-Groundwater Interaction for Use in System Models. DWA draft report (unnumbered). DWA, Pretoria, South Africa
Schulze R.E. 1997. South African atlas of agrohydrology and -climatology. Report TT82/ 96. Pretoria: Water Research Commission.
UNEP. 2010. “Africa Water Atlas”. Division of Early Warning and Assessment (DEWA).United Nations Environment Programme (UNEP). Nairobi, Kenya.
USGS 1996. United States Geological Survey (USGS), GTOPO 30 – Global 30 Arc Second Elevation Data Set. Data available online at http://edcdaac.usgs.gov/gtopo30/gtopo30.asp
Viviroli, D. and Weingartner, R. 2004: The hydrological significance of mountains: from regional to global scale. Hydrology and Earth System Sciences Discussions, 8(6):1017-1030
Viviroli, D., Dürr, H. H., Messerli, B., Meybeck, M. and Weingartner, R. 2007. Mountains of the world, water towers for humanity: Typology, mapping, and global significance. Water Resources Research, 43(7):W07447


Defining South Africa’s Water Source Areas
8%
6,000
44 years
of South Africa’s land area generates half of the country’s river flow.
Approximate number of closed and abandoned mines in South Africa.
3Key major threats to South Africa’s water source areas - alien vegetation, mining and forestry.
The period after mine closure when acid mine decant started into the Blesbokspruit in Gauteng.
Defining South AfriCA’S WAter SourCe AreAS
6%of South Africa’s provinces are home to strategic water source areas, with Gauteng, Northern Cape and the North-West province being exceptions.