defining fisheries habitats and regional ... - unclos.com · pacific ocean california channel...
TRANSCRIPT
Defining Fisheries Habitats and Regional Seafloor Geomorphology for Development Applications Via Acoustic Mapping
ABSTRACT
Recent developments in high-resolution acoustic sonar systems have provided an integrated systems approach to mapping seafloor features that aid in the understanding of construction and development activities on the seafloor. These applications include defining fisheries habitats, identifying regional sediment slump potential, and mapping mobile sediments. The process begins with high frequency sidescan sonar imagery data collected and processed using TRITON ISIS software and mapped to support mosaic generation of the seafloor morphology. The mosaic is generated using DELPH MAP software after all sonar data are collected with integrated DGPS surface navigation and USBL underwater tracking of the towfish position. The mosaic functions as the base map for determining areas of interest and highest importance. The designated areas are then mapped with a high frequency multibeam echosounder to ensure the highest possible resolution and smallest individual beam-pattern footprint. Multiple swaths are collected across the feature to provide 100% coverage and a minimum of 10% overlap. Using ROVs to deploy the multibeam, this methodology can be utilized to 2500m water depths. The multibeam data are collected using WinFrog Multibeam software. The data are then cleaned, processed and displayed in CARIS-HIPS software and output in CAD format. The two data sets can be overlaid in various formats for analysis and GIS support. For fisheries habitat assessment, this final product aids in defining the area of interest and becomes the baseline for future analysis and studies. For other applications, the mapped regions yield an understanding of where future sediment slumps will likely occur and where the seafloor is actively mobile at the present time.
I. INTRODUCTION
Thales GeoSolutions (Pacific), Inc. (TGPI) conducted a seafloor survey to support an extensive evaluation of a region along the central California coast for analysis of hard-bottom communities and fisheries habitat characterization. Dr. Gary Greene of Moss Landing Marine Laboratory defined the parameters of the study with the goal of definitively characterizing multiple habitat zones within the area.
The survey data provided the scientists with a means to designate subtle zones such as:
• High-relief hard bottom
• 0.5-1.0 meter relief hard bottom with thin layers of sediment cover
• Partially buried, no-relief hard bottom and areas of semi-consolidated sediments, gravel beds, and rock debris
The study was designed around an extensive sidescan sonar mapping program and high-resolution multibeam survey, and included the following components:
• Survey parameters: 7km x 14km area with 0.2 meter resolution, at a water depth of 2-160 meters
• Combination of 500-kHz and 100-kHz sidescan sonar systems, digital recording, and DELPH Map-based mosaics
• RESON-8101 system, WinFrog Multibeam software, HDMS, CARIS-HIPS
• Four vessels, ranging in size from 8 to 55 meters
• Target verification with ROV, seabed sampling, and diving
II. APPLICATION AND RESULTS
The process required that digital multibeam bathymetric data be collected in swaths to provide 100% seafloor coverage and then processed with CARIS-HIPS software to apply sun illumination results in shaded relief images. This image was compared with sidescan sonar data to produce optimal interpretation and seafloor characterization. A bathymetry contour map, with 1-meter isobaths generated from the high frequency multibeam echosounder, was used to quantify relief.
Detailed high-resolution sidescan sonar mosaics were necessary to visualize the seafloor for assessment of habitat potential. A 100-kHz GeoAcoustics image was processed using TRITON ISIS software. DELPH-MAP software was used to generate the mosaic. The resultant image showed both high-relief (good fisheries habitats) and detailed rock texture for geological analyses. Strong sonar backscatter may result from steep slopes or coarse-grained (cobbles and pebbles) sediment. Detailed bathymetric contour maps and multibeam shaded relief images were able to resolve a key feature as a steep rock face. Geological evaluation showed that this face is a fault scarp and an excellent interface that commonly attracts rockfish.
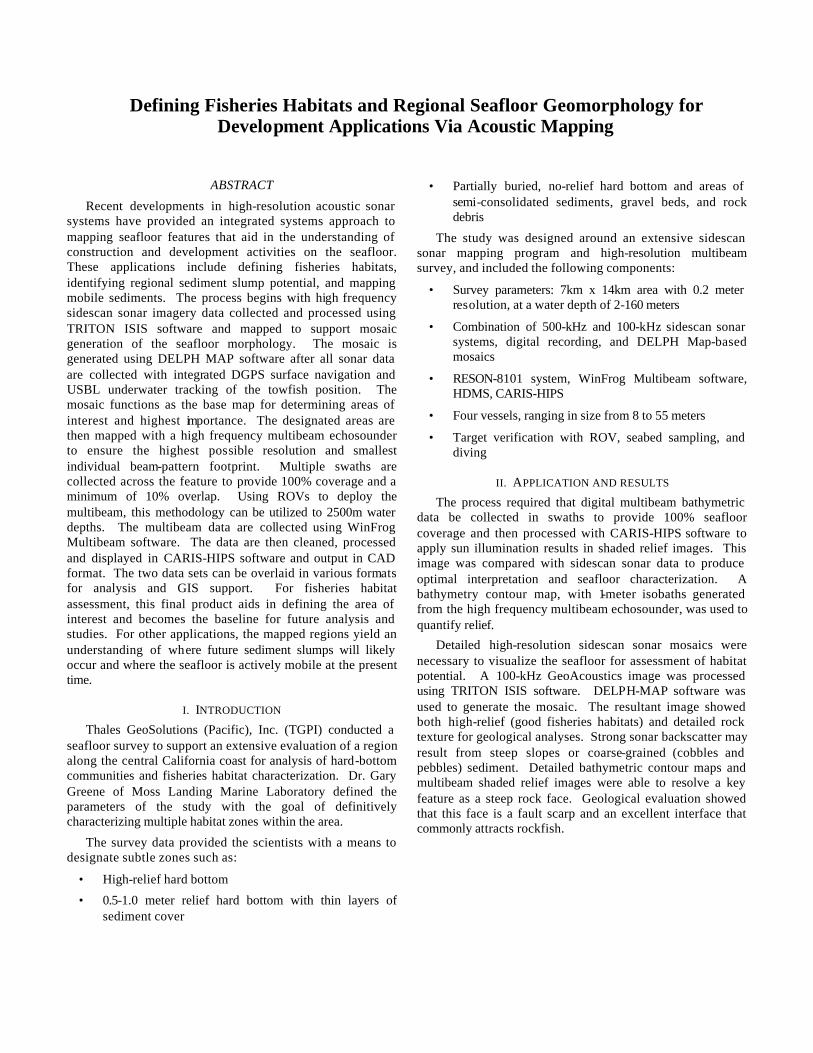
PACIFIC OCEAN
CALIFORNIA
Channel Islands
Fig. 1. Study area – Estero/Morro Bays, California USA
Fig. 2. Detailed bathymetric contour maps and multibeam shaded relief images show that this feature is a steep rock face. This face is a fault scarp and an excellent interface that commonly attracts rockfish. A bathymetry
contour map, with 1 meter isobaths generated from a high frequency multibeam echosounder, was used to quantify relief.
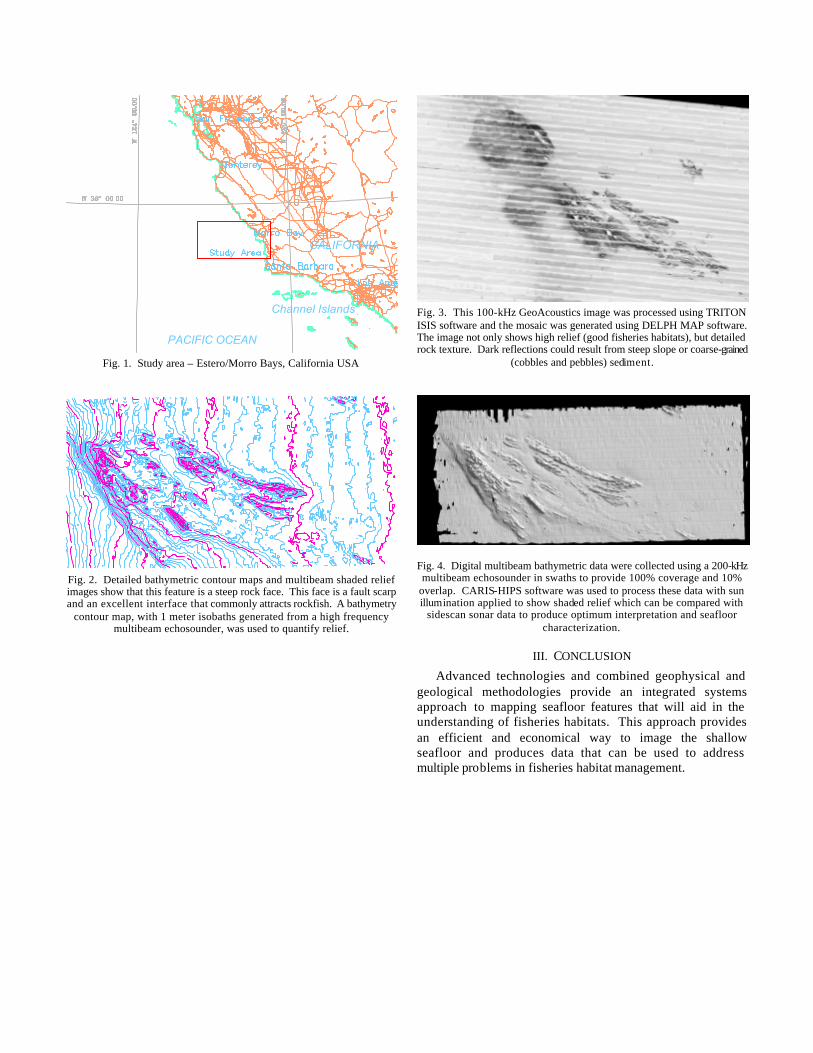
Fig. 3. This 100-kHz GeoAcoustics image was processed using TRITON ISIS software and the mosaic was generated using DELPH MAP software. The image not only shows high relief (good fisheries habitats), but detailed rock texture. Dark reflections could result from steep slope or coarse-grained
(cobbles and pebbles) sediment.
Fig. 4. Digital multibeam bathymetric data were collected using a 200-kHz multibeam echosounder in swaths to provide 100% coverage and 10%
overlap. CARIS-HIPS software was used to process these data with sun illumination applied to show shaded relief which can be compared with
sidescan sonar data to produce optimum interpretation and seafloor characterization.
III. CONCLUSION
Advanced technologies and combined geophysical and geological methodologies provide an integrated systems approach to mapping seafloor features that will aid in the understanding of fisheries habitats. This approach provides an efficient and economical way to image the shallow seafloor and produces data that can be used to address multiple problems in fisheries habitat management.