deepavali message from the minister of international trade and … weekly...
TRANSCRIPT
“DRIVING Transformation, POWERING Growth”
Deepavali, or the ‘Festival of Lights’ is celebrated by Hindus around the world as well as Malaysian Hindus to signify the triumph of dharma and good over evil, of hope over despair, of truth over falsehood and of light over darkness. As Malaysia is widely known as the confluence of many different ethnic groups and cultures, Deepavali is also shared with people from different faith and backgrounds, just like other celebrations in Malaysia. For Malaysians, festivals such as Deepavali provides an opportune time to showcase our values of unity in diversity and the practice of tolerance and acceptance in line with the spirit of 1Malaysia.
In recent months, we have seen countries enduring and grappling with economic uncertainty, innocent people fleeing their own countries for better life elsewhere and thousands more being displaced due to natural disasters. In this regard, along with other Malaysians, I am thankful and grateful that our country continues to be resilient in facing each and every economic challenge that comes our way.
Despite uncertainties in the global economy, Malaysia’s economic fundamentals remain strong. Malaysia’s economic performance registered 5.3% growth in the first half of 2015 and the economy is expected to remain on a steady growth path to expand by 4.5% to 5.5% in 2015. It is estimated that the economy will grow by 4.0% to 5.0% in 2016. Domestic demand will remain the key driver of growth, albeit at a more moderate pace. Malaysia’s economic fundamentals remain strong. Thus it is important that we snap out of any perception of doom and gloom which, if unchecked, causes us to undervalue what we have been gifted with, and overlook precious opportunities.
And these opportunities are plentiful as evident from the recently announced Budget 2016 by our Prime Minister which focuses on addressing the people’s concerns such as rising cost of living, enhanced competitiveness of SMEs and nurturing the well-being of the rakyat. Private consumption is set to remain healthy while creating more demand. Measures to support the economy include an increase in minimum wage, more affordable housing, various tax reliefs for the middle class, big investment projects such as the Malaysian Vision Valley and Rubber City and greater provision for SME funding. MITI will continue to engage with the business community and interest groups to ensure effective implementation of the budget that has been given.
I am excited with all this work that we have ahead of us. MITI and its agencies will continue to work hard in realising our national transformation agenda. We hope to see more positive results to this end, and more importantly MITI hopes Malaysians of all ethnic backgrounds and religion will be able to reap the benefits of the strong economic growth. We must continue to focus on strengthening economic resilience, ensuring inclusiveness and moving forward with our liberalisation and capacity building agenda.
On that note, let me once again wish all Hindus in Malaysia a very Happy Deepavali and let us continue to enjoy the peace, harmony and prosperity that we have built together.
Dato’ Sri Mustapa Mohamed
Deepavali Message from the Minister of International Trade and Industry
‘Deepavali Vaalthukal’
MITI Weekly Bulletin / www.miti.gov.my
“DRIVING Transformation, POWERING Growth”
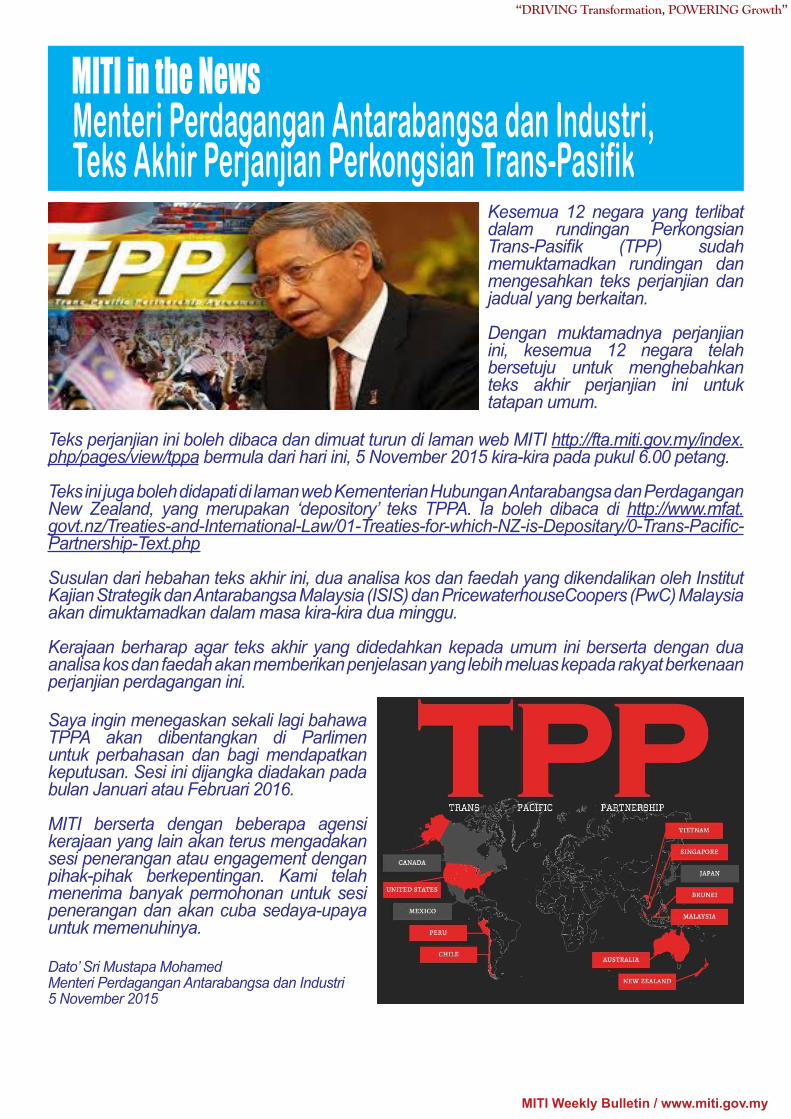
Menteri Perdagangan Antarabangsa dan Industri, Teks Akhir Perjanjian Perkongsian Trans-Pasifik
MITI in the News
Dato’ Sri Mustapa MohamedMenteri Perdagangan Antarabangsa dan Industri5 November 2015
Kesemua 12 negara yang terlibat dalam rundingan Perkongsian Trans-Pasifik (TPP) sudah memuktamadkan rundingan dan mengesahkan teks perjanjian dan jadual yang berkaitan.
Dengan muktamadnya perjanjian ini, kesemua 12 negara telah bersetuju untuk menghebahkan teks akhir perjanjian ini untuk tatapan umum.
Teks perjanjian ini boleh dibaca dan dimuat turun di laman web MITI http://fta.miti.gov.my/index.php/pages/view/tppa bermula dari hari ini, 5 November 2015 kira-kira pada pukul 6.00 petang.
Teks ini juga boleh didapati di laman web Kementerian Hubungan Antarabangsa dan Perdagangan New Zealand, yang merupakan ‘depository’ teks TPPA. Ia boleh dibaca di http://www.mfat.govt.nz/Treaties-and-International-Law/01-Treaties-for-which-NZ-is-Depositary/0-Trans-Pacific-Partnership-Text.php
Susulan dari hebahan teks akhir ini, dua analisa kos dan faedah yang dikendalikan oleh Institut Kajian Strategik dan Antarabangsa Malaysia (ISIS) dan PricewaterhouseCoopers (PwC) Malaysia akan dimuktamadkan dalam masa kira-kira dua minggu.
Kerajaan berharap agar teks akhir yang didedahkan kepada umum ini berserta dengan dua analisa kos dan faedah akan memberikan penjelasan yang lebih meluas kepada rakyat berkenaan perjanjian perdagangan ini.
Saya ingin menegaskan sekali lagi bahawa TPPA akan dibentangkan di Parlimen untuk perbahasan dan bagi mendapatkan keputusan. Sesi ini dijangka diadakan pada bulan Januari atau Februari 2016.
MITI berserta dengan beberapa agensi kerajaan yang lain akan terus mengadakan sesi penerangan atau engagement dengan pihak-pihak berkepentingan. Kami telah menerima banyak permohonan untuk sesi penerangan dan akan cuba sedaya-upaya untuk memenuhinya.
MITI Weekly Bulletin / www.miti.gov.my
“DRIVING Transformation, POWERING Growth”
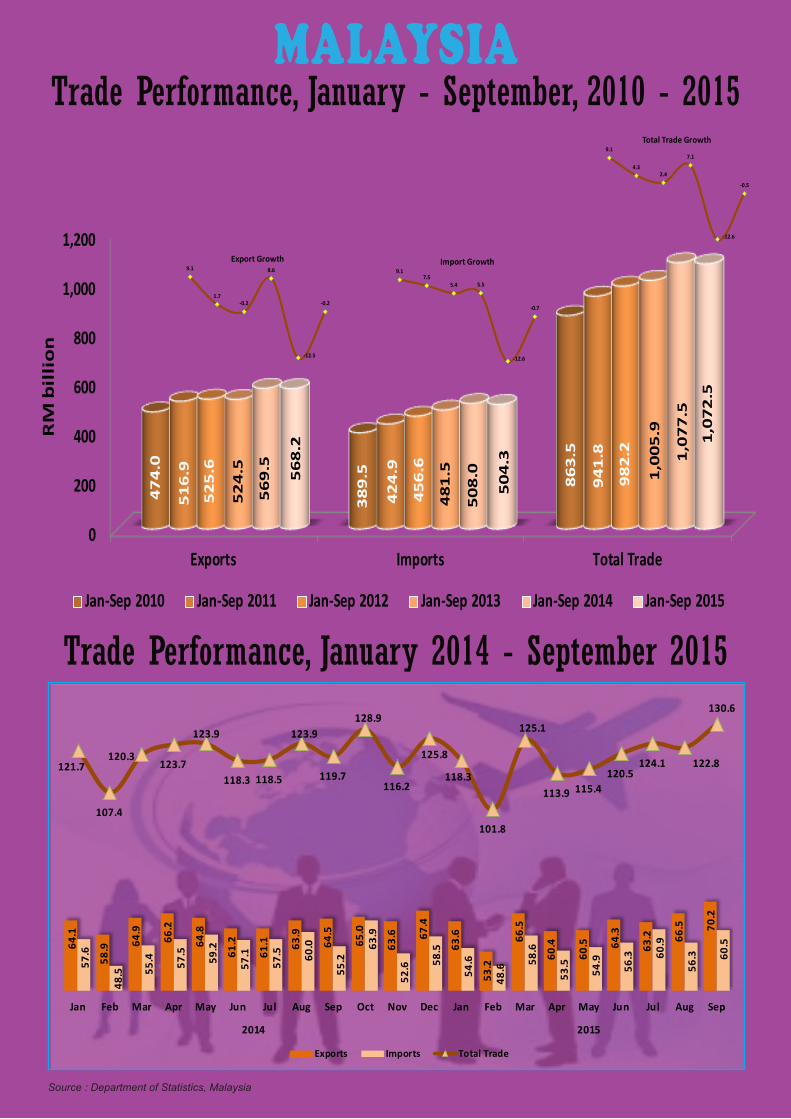
Trade Performance, January - September, 2010 - 2015
Source : Department of Statistics, Malaysia
MALAYSIA
0
200
400
600
800
1,000
1,200
Exports Imports Total Trade
47
4.0
38
9.5 86
3.5
51
6.9
42
4.9
94
1.8
52
5.6
45
6.6
98
2.2
52
4.5
48
1.5 1,0
05
.9
56
9.5
50
8.0
1,0
77
.5
56
8.2
50
4.3
1,0
72
.5
RM
bil
lio
n
Jan-Sep 2010 Jan-Sep 2011 Jan-Sep 2012 Jan-Sep 2013 Jan-Sep 2014 Jan-Sep 2015
9.1
1.7-0.2
8.6
-12.5
-0.2
Export Growth9.1
7.55.4 5.5
-12.6
-0.7
Import Growth
9.1
4.32.4
7.1
-12.6
-0.5
Total Trade Growth
Trade Performance, January 2014 - September 2015
64.1
58.9
64.9
66.2
64.8
61.2
61.1
63.9
64.5
65.0
63.6
67.4
63.6
53.2
66.5
60.4
60.5
64.3
63.2
66.5
70.2
57.6
48.5
55.4
57.5
59.2
57.1
57.5
60.0
55.2
63.9
52.6
58.5
54.6
48.6
58.6
53.5
54.9
56.3
60.9
56.3
60.5
121.7
107.4
120.3 123.7
123.9
118.3 118.5
123.9
119.7
128.9
116.2
125.8
118.3
101.8
125.1
113.9 115.4 120.5
124.1 122.8
130.6
Jan Feb Mar Apr May Jun Jul Aug Sep Oct Nov Dec Jan Feb Mar Apr May Jun Jul Aug Sep
2014 2015
Exports Imports Total Trade
MITI Weekly Bulletin / www.miti.gov.my
“DRIVING Transformation, POWERING Growth”
Jan - Sep 2014
Jan - Sep 2015
050
100150200250300350400450
500
ManufacturedGoods Mining Goods
AgriculturalGoods Others
435.5
77.8
52.2
3.9
454.9
60.2
49.7
3.4
RM billion
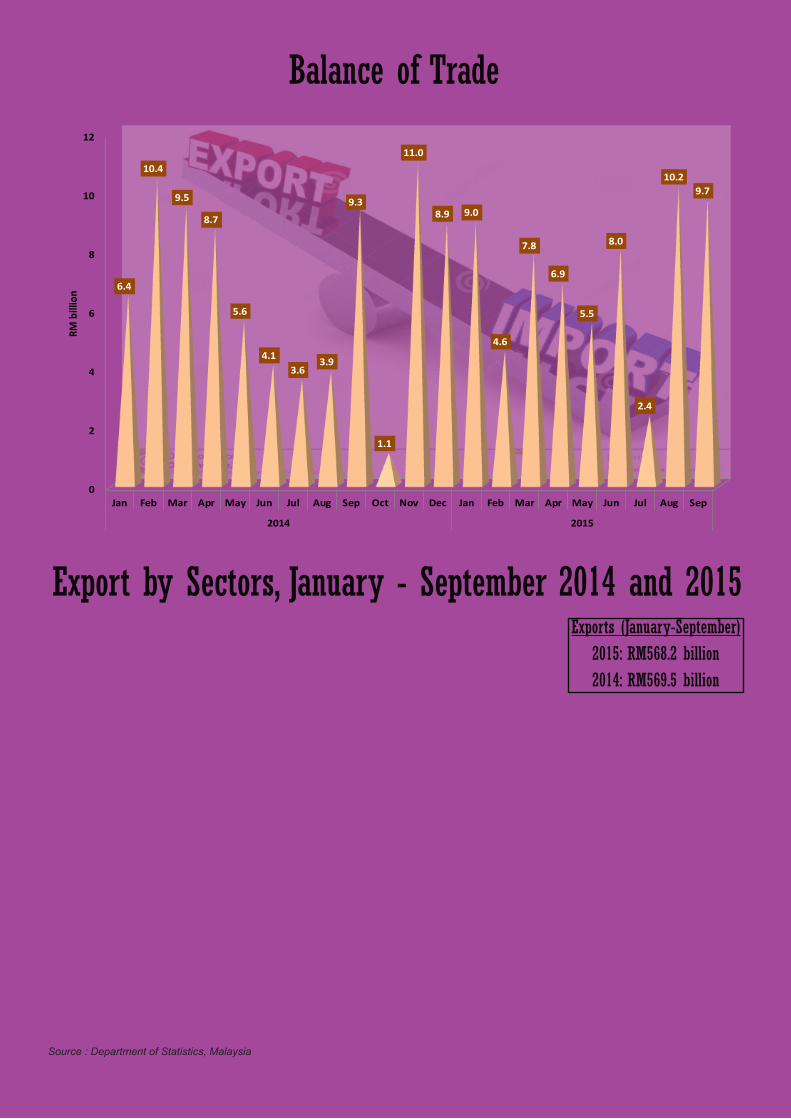
Source : Department of Statistics, Malaysia
Export by Sectors, January - September 2014 and 2015
Balance of Trade
0
2
4
6
8
10
12
Jan Feb Mar Apr May Jun Jul Aug Sep Oct Nov Dec Jan Feb Mar Apr May Jun Jul Aug Sep
2014 2015
6.4
10.4
9.5
8.7
5.6
4.13.6
3.9
9.3
1.1
11.0
8.9 9.0
4.6
7.8
6.9
5.5
8.0
2.4
10.29.7
RM b
illio
n
Exports (January-September)2015: RM568.2 billion2014: RM569.5 billion
MITI Weekly Bulletin / www.miti.gov.my
“DRIVING Transformation, POWERING Growth”
0 50 100 150 200 250
E&E
Chemicals & Chemical Products
Petroleum Products
LNG
Palm Oil & Palm-Based products
Machinery, appliances & parts
Manufactures of Metal
Crude Petroleum
Optical & Scientific Equipment
Rubber Products
203.8
40.6
39.6
34.7
33.7
26.2
23.6
18.8
18.6
14.7
188.5
38.0
53.3
47.2
36.4
22.5
19.3
25.0
17.9
13.3
Axis Title
Jan - Sep 2015
Jan - Sep 2014
Source : Department of Statistics, Malaysia
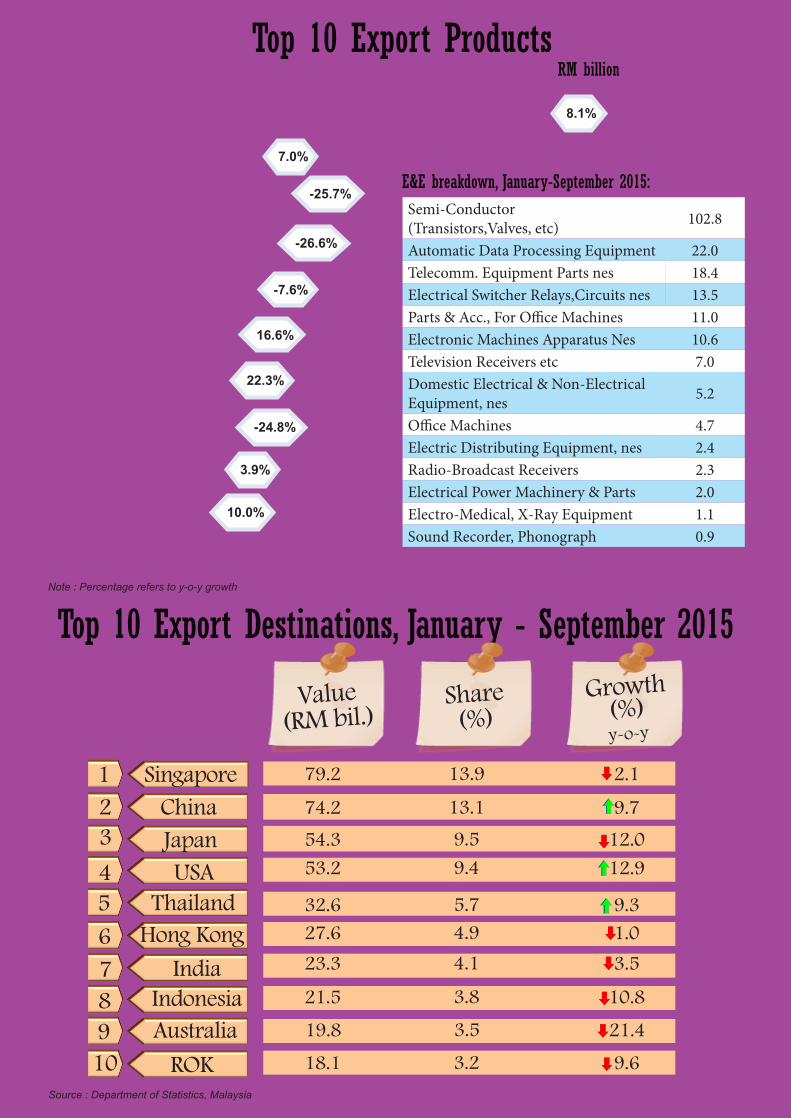
Top 10 Export Destinations, January - September 2015
Value (RM bil.)
Share(%)
Growth(%) y-o-y
123
SingaporeChinaJapan
5 Thailand4 USA
678
Hong KongIndia
Indonesia
10 ROK9 Australia
79.2 13.9 2.1
74.2 13.1 9.7
54.3 9.5 12.0
27.6 4.9 1.0
23.3 4.1 3.5
21.5 3.8 10.8
19.8 3.5 21.4
18.1 3.2 9.6
53.2 9.4 12.9
32.6 5.7 9.3
RM billionTop 10 Export Products
8.1%
7.0%
-25.7%
-26.6%
-7.6%
16.6%
22.3%
-24.8%
3.9%
10.0%
Note : Percentage refers to y-o-y growth
Semi-Conductor (Transistors,Valves, etc) 102.8
Automatic Data Processing Equipment 22.0Telecomm. Equipment Parts nes 18.4Electrical Switcher Relays,Circuits nes 13.5Parts & Acc., For Office Machines 11.0Electronic Machines Apparatus Nes 10.6Television Receivers etc 7.0Domestic Electrical & Non-Electrical Equipment, nes 5.2
Office Machines 4.7Electric Distributing Equipment, nes 2.4Radio-Broadcast Receivers 2.3Electrical Power Machinery & Parts 2.0Electro-Medical, X-Ray Equipment 1.1Sound Recorder, Phonograph 0.9
E&E breakdown, January-September 2015:
MITI Weekly Bulletin / www.miti.gov.my
“DRIVING Transformation, POWERING Growth”
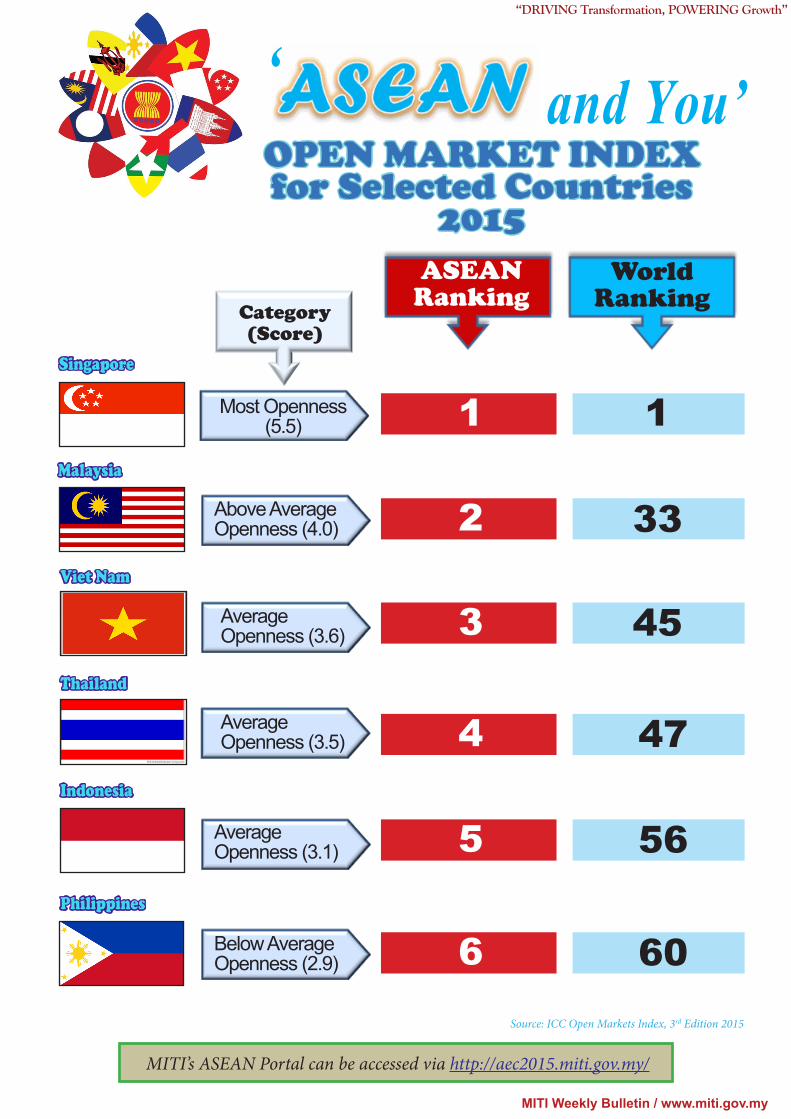
MITI’s ASEAN Portal can be accessed via http://aec2015.miti.gov.my/
and You’
Singapore
‘OPEN MARKET INDEXfor Selected Countries
2015
Source: ICC Open Markets Index, 3rd Edition 2015
ASEANRanking
WorldRanking
1 1Malaysia
Viet Nam
Thailand
Indonesia
Philippines
2 33
3 45
4 47
5 56
6 60
Most Openness (5.5)
Above Average Openness (4.0)
Average Openness (3.6)
Average Openness (3.5)
Average Openness (3.1)
Below Average Openness (2.9)
Category(Score)
MITI Weekly Bulletin / www.miti.gov.my
“DRIVING Transformation, POWERING Growth”
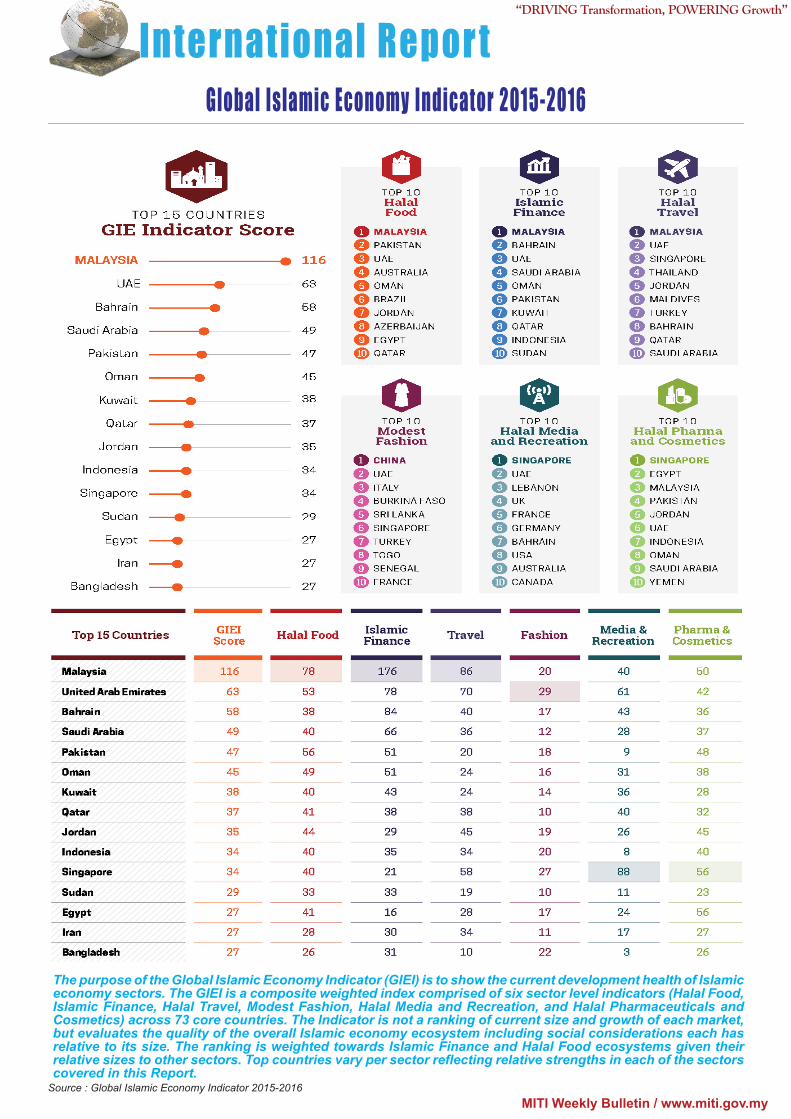
International Repor t
Source : Global Islamic Economy Indicator 2015-2016
Global Islamic Economy Indicator 2015-2016
The purpose of the Global Islamic Economy Indicator (GIEI) is to show the current development health of Islamic economy sectors. The GIEI is a composite weighted index comprised of six sector level indicators (Halal Food, Islamic Finance, Halal Travel, Modest Fashion, Halal Media and Recreation, and Halal Pharmaceuticals and Cosmetics) across 73 core countries. The Indicator is not a ranking of current size and growth of each market, but evaluates the quality of the overall Islamic economy ecosystem including social considerations each has relative to its size. The ranking is weighted towards Islamic Finance and Halal Food ecosystems given their relative sizes to other sectors. Top countries vary per sector reflecting relative strengths in each of the sectors covered in this Report.
MITI Weekly Bulletin / www.miti.gov.my
“DRIVING Transformation, POWERING Growth”
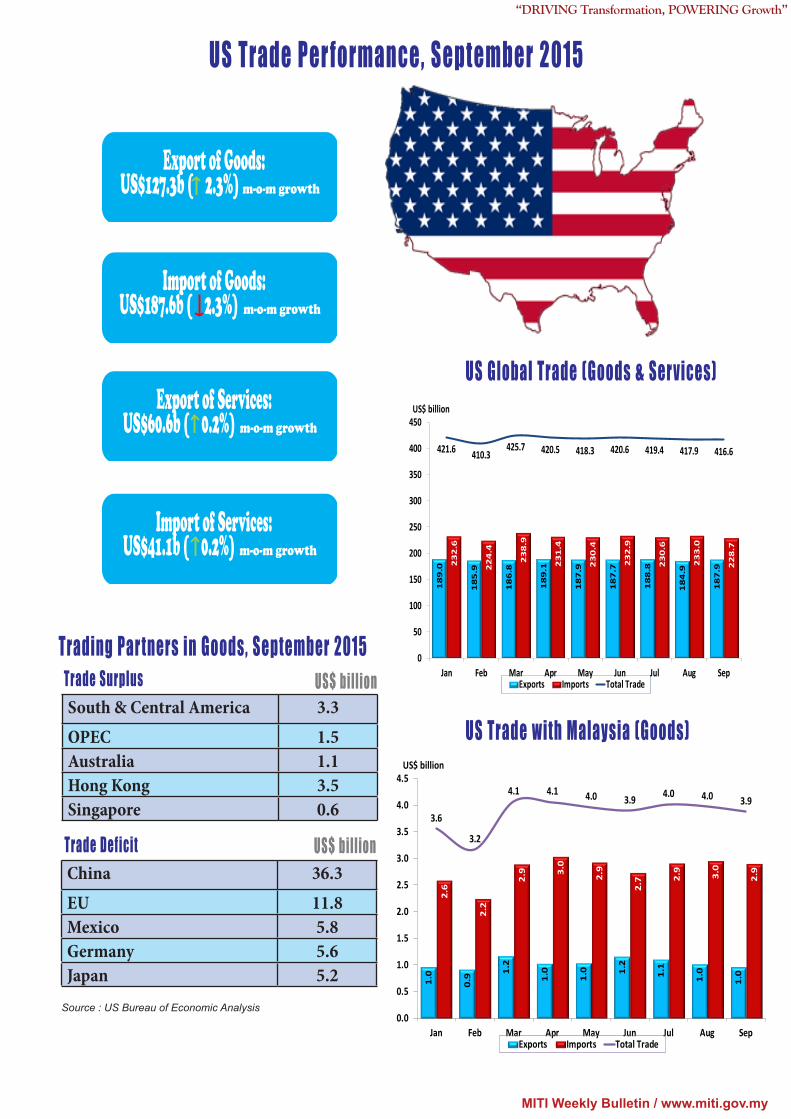
US Trade Per formance, September 2015
Import of Goods: US$187.6b ( 2.3%) m-o-m growth
Export of Goods: US$127.3b ( 2.3%) m-o-m growth
Export of Services: US$60.6b ( 0.2%) m-o-m growth
Import of Services: US$41.1b ( 0.2%) m-o-m growth
Trading Par tners in Goods, September 2015
South & Central America 3.3OPEC 1.5Australia 1.1Hong Kong 3.5Singapore 0.6
Trade Surplus US$ billion
China 36.3EU 11.8Mexico 5.8Germany 5.6Japan 5.2
Trade Deficit US$ billion
Source : US Bureau of Economic Analysis
US Global Trade (Goods & Ser vices)
18
9.0
18
5.9
18
6.8
18
9.1
18
7.9
18
7.7
18
8.8
18
4.9
18
7.9
23
2.6
22
4.4
23
8.9
23
1.4
23
0.4
23
2.9
23
0.6
23
3.0
22
8.7
421.6 410.3425.7 420.5 418.3 420.6 419.4 417.9 416.6
0
50
100
150
200
250
300
350
400
450
Jan Feb Mar Apr May Jun Jul Aug Sep
US$ billion
Exports Imports Total Trade
US Trade with Malaysia (Goods)
1.0
0.9 1.
2
1.0
1.0 1.
2
1.1
1.0
1.0
2.6
2.2
2.9 3.
0
2.9
2.7 2.
9
3.0
2.9
3.6
3.2
4.1 4.1 4.0 3.9 4.0 4.0 3.9
0.0
0.5
1.0
1.5
2.0
2.5
3.0
3.5
4.0
4.5
Jan Feb Mar Apr May Jun Jul Aug Sep
US$ billion
Exports Imports Total Trade
MITI Weekly Bulletin / www.miti.gov.my
“DRIVING Transformation, POWERING Growth”
34,20025,200
38,40023,600
18,00091,832
23,20023,904
40,29035,400
24,000
0 20,000 40,000 60,000 80,000 100,000
HungaryRomania
EstoniaChile
MalaysiaUnited States
UkraineLithuania
BritainSingapore
Japan
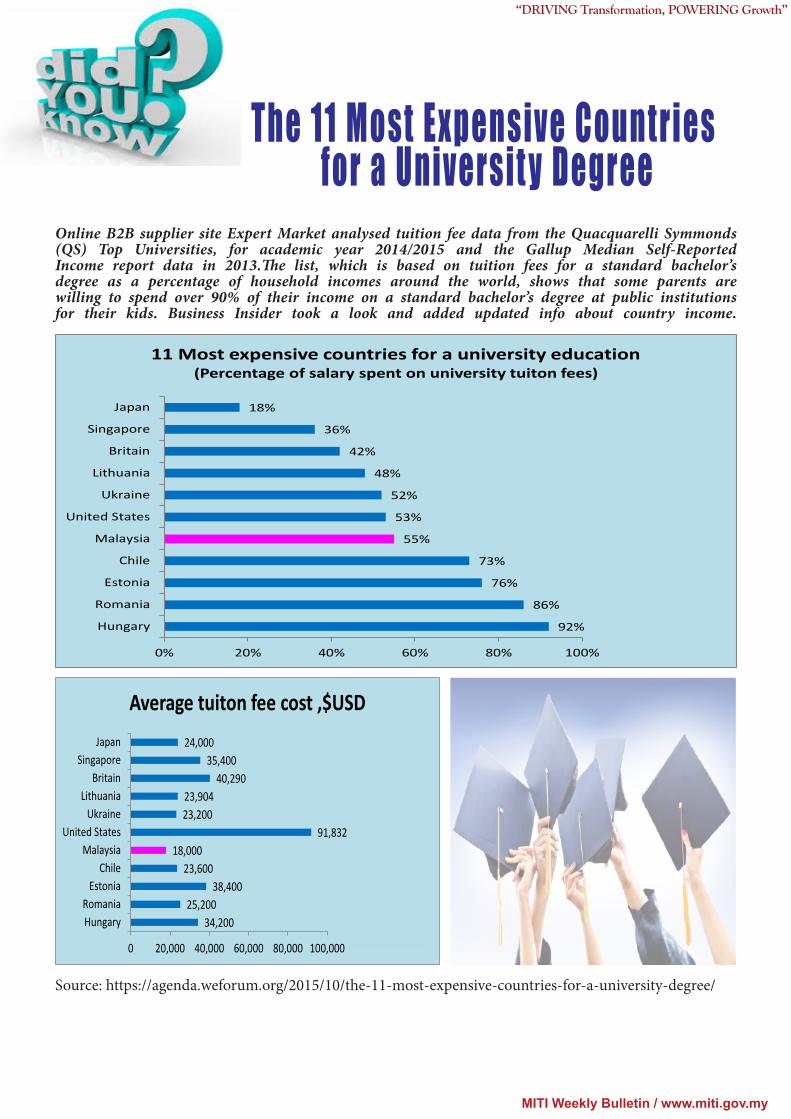
Average tuiton fee cost ,$USD
Hungary
Romania
Estonia
Chile
Malaysia
United States
Ukraine
Lithuania
Britain
Source: https://agenda.weforum.org/2015/10/the-11-most-expensive-countries-for-a-university-degree/
The 11 Most Expensive Countries for a Universit y Degree
92%
86%
76%
73%
55%
53%
52%
48%
42%
36%
18%
0% 20% 40% 60% 80% 100%
Hungary
Romania
Estonia
Chile
Malaysia
United States
Ukraine
Lithuania
Britain
Singapore
Japan
11 Most expensive countries for a university education(Percentage of salary spent on university tuiton fees)
Hungary
Romania
Estonia
Chile
Malaysia
United States
Ukraine
Lithuania
Britain
Singapore
Japan
Online B2B supplier site Expert Market analysed tuition fee data from the Quacquarelli Symmonds (QS) Top Universities, for academic year 2014/2015 and the Gallup Median Self-Reported Income report data in 2013.The list, which is based on tuition fees for a standard bachelor’s degree as a percentage of household incomes around the world, shows that some parents are willing to spend over 90% of their income on a standard bachelor’s degree at public institutions for their kids. Business Insider took a look and added updated info about country income.
MITI Weekly Bulletin / www.miti.gov.my
“DRIVING Transformation, POWERING Growth”
Source: Ministry of International Trade and Industry, Malaysia
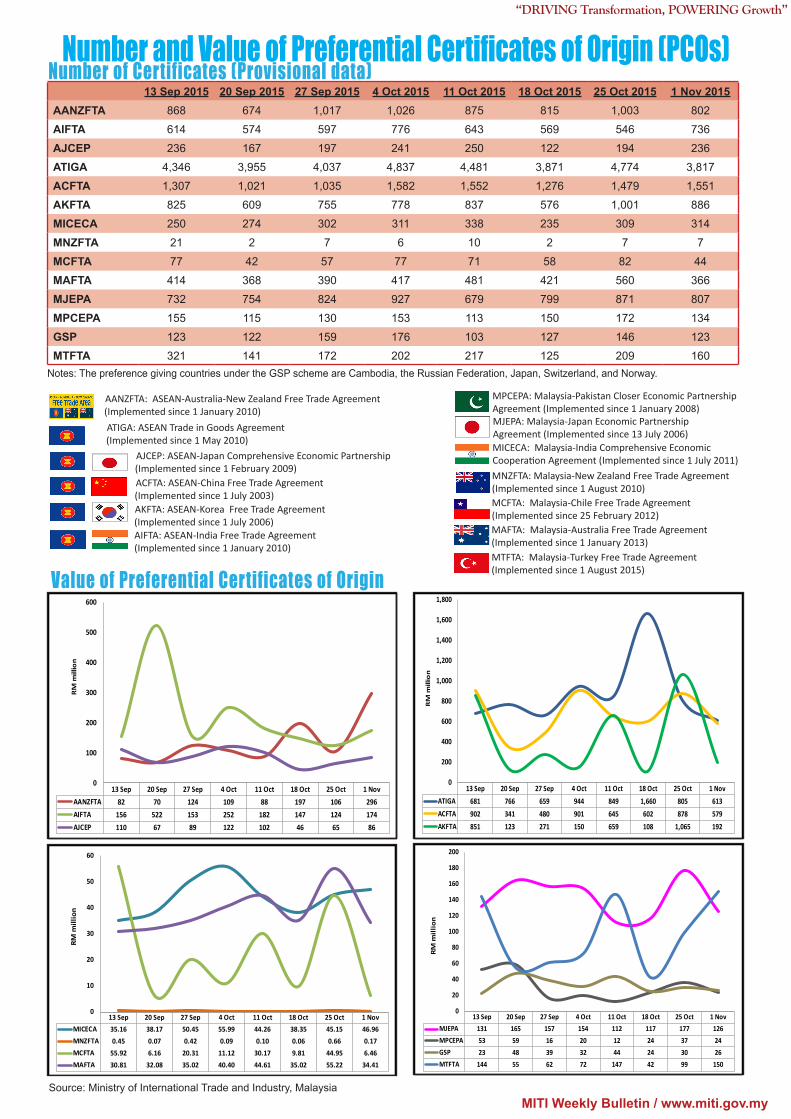
AJCEP: ASEAN-Japan Comprehensive Economic Partnership (Implemented since 1 February 2009) ACFTA: ASEAN-China Free Trade Agreement (Implemented since 1 July 2003) AKFTA: ASEAN-Korea Free Trade Agreement (Implemented since 1 July 2006)
AANZFTA: ASEAN-Australia-New Zealand Free Trade Agreement(Implemented since 1 January 2010)
AIFTA: ASEAN-India Free Trade Agreement (Implemented since 1 January 2010)
ATIGA: ASEAN Trade in Goods Agreement (Implemented since 1 May 2010)
MICECA: Malaysia-India Comprehensive Economic Cooperation Agreement (Implemented since 1 July 2011)MNZFTA: Malaysia-New Zealand Free Trade Agreement (Implemented since 1 August 2010)MCFTA: Malaysia-Chile Free Trade Agreement (Implemented since 25 February 2012)
MTFTA: Malaysia-Turkey Free Trade Agreement (Implemented since 1 August 2015)
MAFTA: Malaysia-Australia Free Trade Agreement (Implemented since 1 January 2013)
MPCEPA: Malaysia-Pakistan Closer Economic Partnership Agreement (Implemented since 1 January 2008)MJEPA: Malaysia-Japan Economic Partnership Agreement (Implemented since 13 July 2006)
13 Sep 20 Sep 27 Sep 4 Oct 11 Oct 18 Oct 25 Oct 1 NovAANZFTA 82 70 124 109 88 197 106 296AIFTA 156 522 153 252 182 147 124 174AJCEP 110 67 89 122 102 46 65 86
0
100
200
300
400
500
600
RM
mill
ion
13 Sep 20 Sep 27 Sep 4 Oct 11 Oct 18 Oct 25 Oct 1 NovATIGA 681 766 659 944 849 1,660 805 613ACFTA 902 341 480 901 645 602 878 579AKFTA 851 123 271 150 659 108 1,065 192
0
200
400
600
800
1,000
1,200
1,400
1,600
1,800
RM
mill
ion
13 Sep 20 Sep 27 Sep 4 Oct 11 Oct 18 Oct 25 Oct 1 NovMICECA 35.16 38.17 50.45 55.99 44.26 38.35 45.15 46.96MNZFTA 0.45 0.07 0.42 0.09 0.10 0.06 0.66 0.17MCFTA 55.92 6.16 20.31 11.12 30.17 9.81 44.95 6.46MAFTA 30.81 32.08 35.02 40.40 44.61 35.02 55.22 34.41
0
10
20
30
40
50
60
RM m
illio
n
13 Sep 2015 20 Sep 2015 27 Sep 2015 4 Oct 2015 11 Oct 2015 18 Oct 2015 25 Oct 2015 1 Nov 2015AANZFTA 868 674 1,017 1,026 875 815 1,003 802
AIFTA 614 574 597 776 643 569 546 736
AJCEP 236 167 197 241 250 122 194 236
ATIGA 4,346 3,955 4,037 4,837 4,481 3,871 4,774 3,817
ACFTA 1,307 1,021 1,035 1,582 1,552 1,276 1,479 1,551
AKFTA 825 609 755 778 837 576 1,001 886
MICECA 250 274 302 311 338 235 309 314
MNZFTA 21 2 7 6 10 2 7 7
MCFTA 77 42 57 77 71 58 82 44
MAFTA 414 368 390 417 481 421 560 366
MJEPA 732 754 824 927 679 799 871 807
MPCEPA 155 115 130 153 113 150 172 134
GSP 123 122 159 176 103 127 146 123
MTFTA 321 141 172 202 217 125 209 160
13 Sep 20 Sep 27 Sep 4 Oct 11 Oct 18 Oct 25 Oct 1 NovMJEPA 131 165 157 154 112 117 177 126MPCEPA 53 59 16 20 12 24 37 24GSP 23 48 39 32 44 24 30 26MTFTA 144 55 62 72 147 42 99 150
0
20
40
60
80
100
120
140
160
180
200
RM m
illio
n
Value of Preferential Certificates of Origin
Number and Value of Preferential Certificates of Origin (PCOs)Number of Certificates (Provisional data)
Notes: The preference giving countries under the GSP scheme are Cambodia, the Russian Federation, Japan, Switzerland, and Norway.
MITI Weekly Bulletin / www.miti.gov.my
“DRIVING Transformation, POWERING Growth”
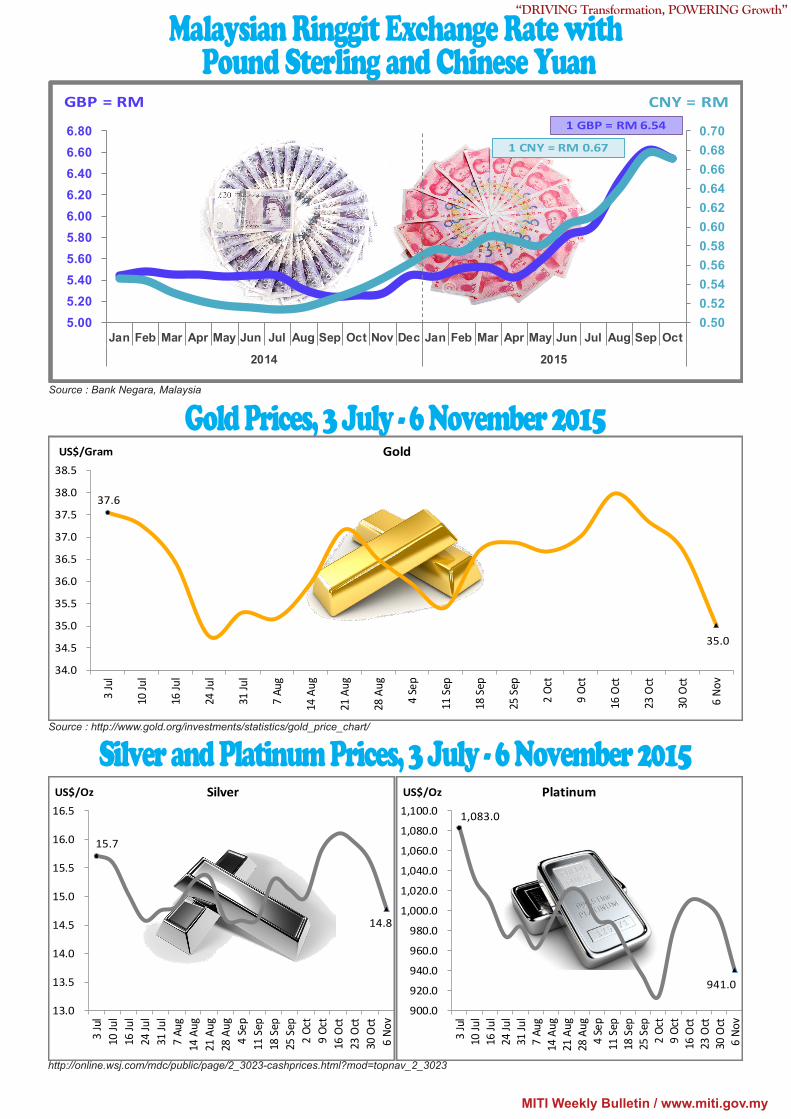
Malaysian Ringgit Exchange Rate with Pound Sterling and Chinese Yuan
Source : Bank Negara, Malaysia
0.500.520.540.560.580.600.620.640.660.680.70
5.005.205.405.605.806.006.206.406.606.80
Jan Feb Mar Apr May Jun Jul Aug Sep Oct Nov Dec Jan Feb Mar Apr May Jun Jul Aug Sep Oct
2014 2015
GBP = RM CNY = RM
1 CNY = RM 0.67
1 GBP = RM 6.54
15.7
14.8
13.0
13.5
14.0
14.5
15.0
15.5
16.0
16.5
3 Ju
l10
Jul
16 Ju
l24
Jul
31 Ju
l7
Aug
14 A
ug21
Aug
28 A
ug4
Sep
11 S
ep18
Sep
25 S
ep2
Oct
9 Oc
t16
Oct
23 O
ct30
Oct
6 No
v
US$/Oz Silver
1,083.0
941.0
900.0
920.0
940.0
960.0
980.0
1,000.0
1,020.0
1,040.0
1,060.0
1,080.0
1,100.0
3 Ju
l10
Jul
16 Ju
l24
Jul
31 Ju
l7
Aug
14 A
ug21
Aug
28 A
ug4
Sep
11 S
ep18
Sep
25 S
ep2
Oct
9 Oc
t16
Oct
23 O
ct30
Oct
6 No
v
US$/Oz Platinum
Source : http://www.gold.org/investments/statistics/gold_price_chart/
http://online.wsj.com/mdc/public/page/2_3023-cashprices.html?mod=topnav_2_3023
Gold Prices, 3 July - 6 November 2015
Silver and Platinum Prices, 3 July - 6 November 2015
37.6
35.0
34.0
34.5
35.0
35.5
36.0
36.5
37.0
37.5
38.0
38.5
3 Ju
l
10 Ju
l
16 Ju
l
24 Ju
l
31 Ju
l
7 Au
g
14 A
ug
21 A
ug
28 A
ug
4 Se
p
11 S
ep
18 S
ep
25 S
ep
2 Oc
t
9 Oc
t
16 O
ct
23 O
ct
30 O
ct
6 No
v
US$/Gram Gold
MITI Weekly Bulletin / www.miti.gov.my
“DRIVING Transformation, POWERING Growth”
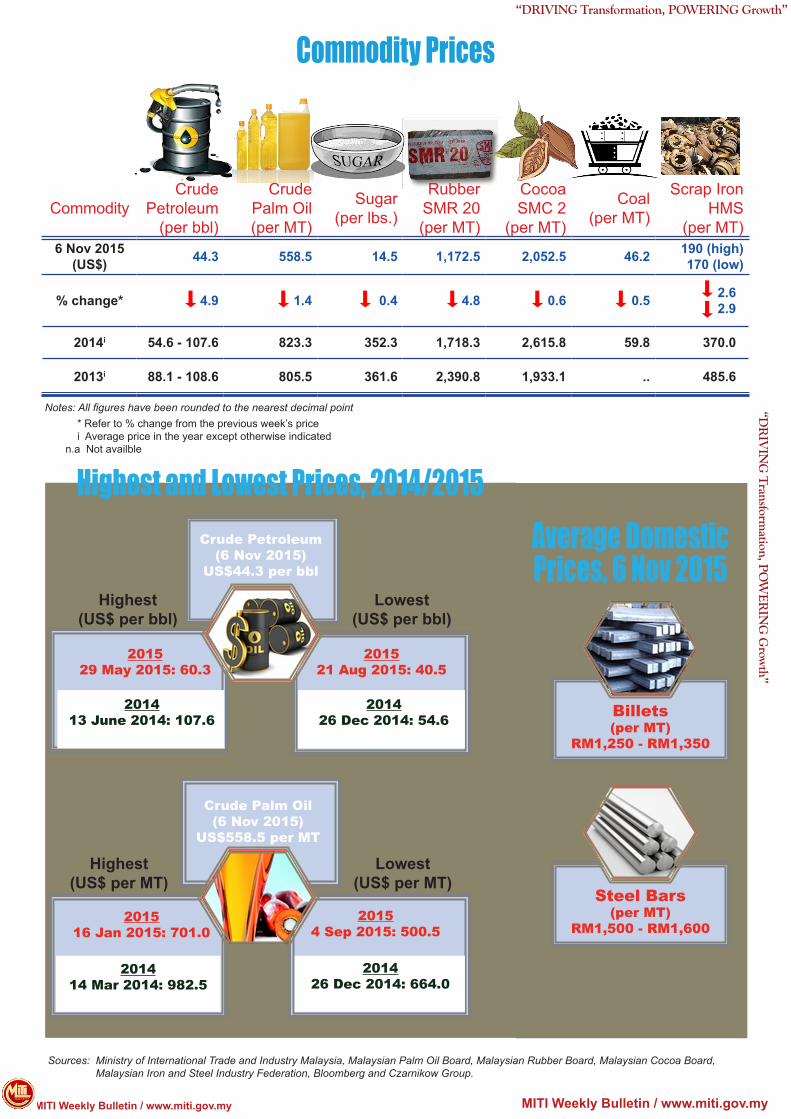
CommodityCrude
Petroleum (per bbl)
Crude Palm Oil (per MT)
Sugar (per lbs.)
Rubber SMR 20(per MT)
Cocoa SMC 2
(per MT)
Coal(per MT)
Scrap Iron HMS
(per MT)6 Nov 2015
(US$) 44.3 558.5 14.5 1,172.5 2,052.5 46.2 190 (high)170 (low)
% change* 4.9 1.4 0.4 4.8 0.6 0.5 2.62.9
2014i 54.6 - 107.6 823.3 352.3 1,718.3 2,615.8 59.8 370.0
2013i 88.1 - 108.6 805.5 361.6 2,390.8 1,933.1 .. 485.6
“DR
IVIN
G T
ransformation, P
OW
ERIN
G G
rowth”
MITI Weekly Bulletin / www.miti.gov.my
Commodity Prices
Notes: All figures have been rounded to the nearest decimal point * Refer to % change from the previous week’s price i Average price in the year except otherwise indicated n.a Not availble
Sources: Ministry of International Trade and Industry Malaysia, Malaysian Palm Oil Board, Malaysian Rubber Board, Malaysian Cocoa Board, Malaysian Iron and Steel Industry Federation, Bloomberg and Czarnikow Group.
Highest and Lowest Prices, 2014/2015
Lowest (US$ per bbl)
Highest(US$ per bbl)
Crude Petroleum (6 Nov 2015)
US$44.3 per bbl
201413 June 2014: 107.6
201426 Dec 2014: 54.6
201529 May 2015: 60.3
201521 Aug 2015: 40.5
Lowest (US$ per MT)
Highest(US$ per MT)
Crude Palm Oil (6 Nov 2015)
US$558.5 per MT
201414 Mar 2014: 982.5
201426 Dec 2014: 664.0
201516 Jan 2015: 701.0
20154 Sep 2015: 500.5
Steel Bars(per MT)
RM1,500 - RM1,600
Average Domestic Prices, 6 Nov 2015
Billets(per MT)
RM1,250 - RM1,350
MITI Weekly Bulletin / www.miti.gov.my
“DRIVING Transformation, POWERING Growth”
Sources: Ministry of International Trade and Industry Malaysia, Malaysian Palm Oil Board, Malaysian Rubber Board, Malaysian Cocoa Board, Malaysian Pepper Board, Malaysian Iron and Steel Industry Federation, Bloomberg and Czarnikow Group, World Bank.
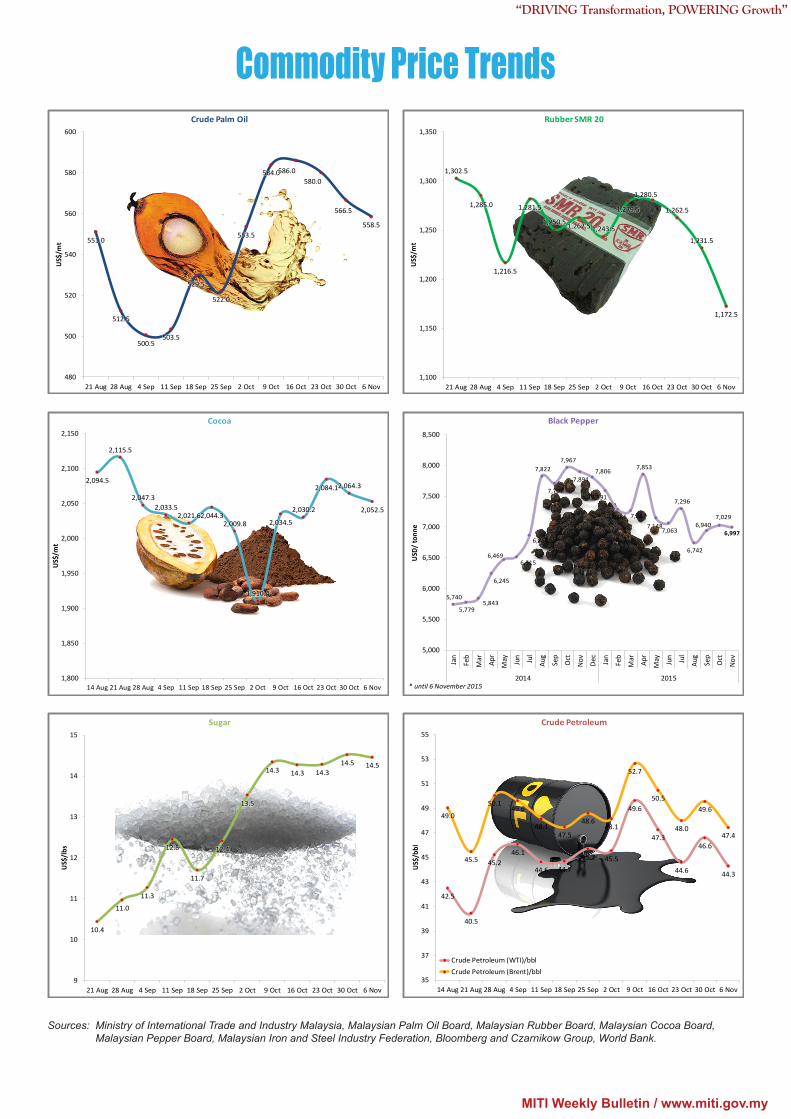
Commodity Price Trends
551.0
512.5
500.5503.5
529.5
522.0
553.5
584.0586.0580.0
566.5
558.5
480
500
520
540
560
580
600
21 Aug 28 Aug 4 Sep 11 Sep 18 Sep 25 Sep 2 Oct 9 Oct 16 Oct 23 Oct 30 Oct 6 Nov
US$
/mt
Crude Palm Oil
2,094.5
2,115.5
2,047.32,033.5
2,021.62,044.32,009.8
1,910.4
2,034.5
2,030.2
2,084.12,064.3
2,052.5
1,800
1,850
1,900
1,950
2,000
2,050
2,100
2,150
14 Aug 21 Aug 28 Aug 4 Sep 11 Sep 18 Sep 25 Sep 2 Oct 9 Oct 16 Oct 23 Oct 30 Oct 6 Nov
US$
/mt
Cocoa
10.4
11.0
11.3
12.5
11.7
12.4
13.5
14.3 14.3 14.314.5 14.5
9
10
11
12
13
14
15
21 Aug 28 Aug 4 Sep 11 Sep 18 Sep 25 Sep 2 Oct 9 Oct 16 Oct 23 Oct 30 Oct 6 Nov
US$
/lbs
Sugar
1,302.5
1,285.0
1,216.5
1,281.5
1,250.5 1,262.5 1,243.5
1,279.5
1,280.5
1,262.5
1,231.5
1,172.5
1,100
1,150
1,200
1,250
1,300
1,350
21 Aug 28 Aug 4 Sep 11 Sep 18 Sep 25 Sep 2 Oct 9 Oct 16 Oct 23 Oct 30 Oct 6 Nov
US$
/mt
Rubber SMR 20
5,740
5,779 5,843
6,245
6,469 6,515
6,864
7,822
7,707
7,967
7,894 7,806
7,591
7,286 7,267
7,853
7,148 7,063
7,296
6,742
6,940 7,029
6,997
5,000
5,500
6,000
6,500
7,000
7,500
8,000
8,500
Jan
Feb
Mar Apr
May Jun Jul
Aug
Sep
Oct
Nov
Dec
Jan
Feb
Mar Apr
May Jun Jul
Aug
Sep
Oct
Nov
2014 2015
USD
/ to
nne
Black Pepper
* until 6 November 2015
42.5
40.5
45.246.1
44.6 44.7
45.7 45.5
49.6
47.3
44.6
46.6
44.3
49.0
45.5
50.149.6
48.147.5
48.648.1
52.7
50.5
48.0
49.6
47.4
35
37
39
41
43
45
47
49
51
53
55
14 Aug 21 Aug 28 Aug 4 Sep 11 Sep 18 Sep 25 Sep 2 Oct 9 Oct 16 Oct 23 Oct 30 Oct 6 Nov
US$
/bbl
Crude Petroleum
Crude Petroleum (WTI)/bbl Crude Petroleum (Brent)/bbl
MITI Weekly Bulletin / www.miti.gov.my
“DRIVING Transformation, POWERING Growth”
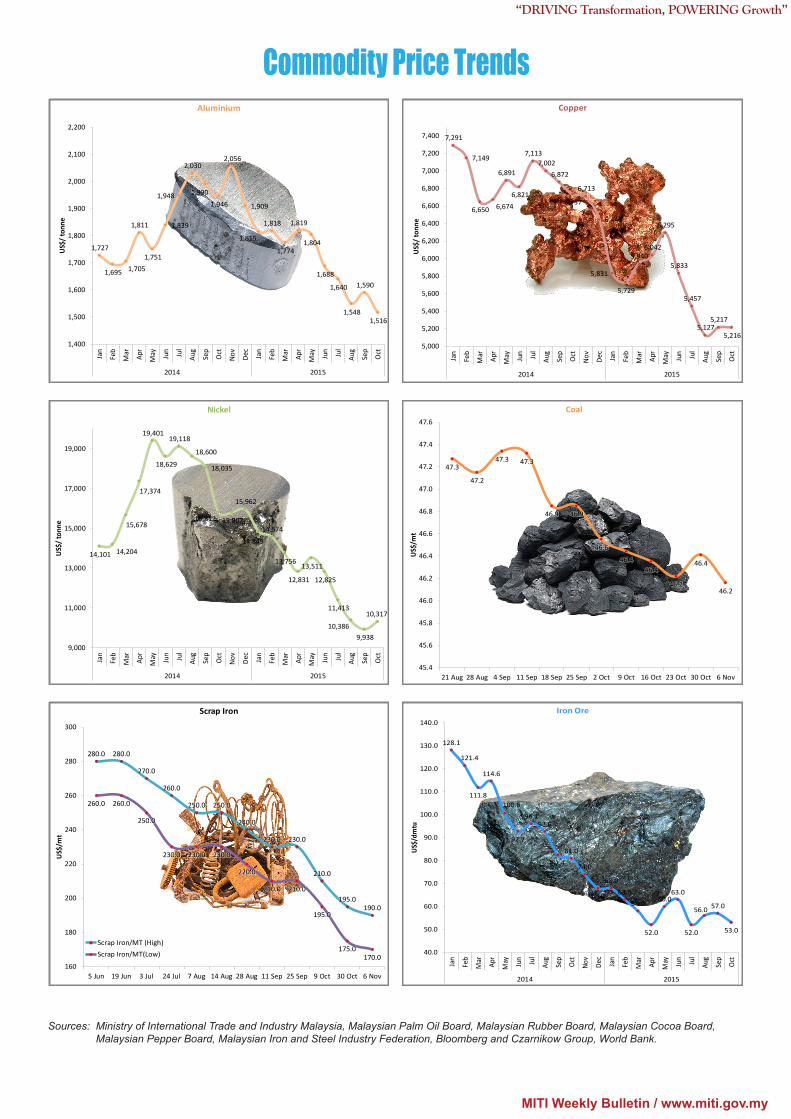
Sources: Ministry of International Trade and Industry Malaysia, Malaysian Palm Oil Board, Malaysian Rubber Board, Malaysian Cocoa Board, Malaysian Pepper Board, Malaysian Iron and Steel Industry Federation, Bloomberg and Czarnikow Group, World Bank.
Commodity Price Trends
1,727
1,695 1,705
1,811
1,751
1,839
1,948
2,030
1,990
1,946
2,056
1,909
1,815
1,818
1,774
1,819
1,804
1,688
1,640
1,548
1,590
1,516
1,400
1,500
1,600
1,700
1,800
1,900
2,000
2,100
2,200
Jan
Feb
Mar Apr
May Jun Jul
Aug
Sep
Oct
Nov
Dec
Jan
Feb
Mar Apr
May Jun Jul
Aug
Sep
Oct
2014 2015
US$
/ to
nne
Aluminium
14,101 14,204
15,678
17,374
19,401
18,629
19,118
18,600
18,035
15,812 15,807
15,962
14,849
14,574
13,756
12,831
13,511
12,825
11,413
10,386 9,938
10,317
9,000
11,000
13,000
15,000
17,000
19,000
Jan
Feb
Mar Apr
May Jun Jul
Aug
Sep
Oct
Nov
Dec
Jan
Feb
Mar Apr
May Jun Jul
Aug
Sep
Oct
2014 2015
US$
/ to
nne
Nickel
280.0 280.0
270.0
260.0
250.0 250.0
240.0
230.0 230.0
210.0
195.0190.0
260.0 260.0
250.0
230.0 230.0 230.0
220.0
210.0 210.0
195.0
175.0170.0
160
180
200
220
240
260
280
300
5 Jun 19 Jun 3 Jul 24 Jul 7 Aug 14 Aug 28 Aug 11 Sep 25 Sep 9 Oct 30 Oct 6 Nov
US$
/mt
Scrap Iron
Scrap Iron/MT (High) Scrap Iron/MT(Low)
7,291
7,149
6,650 6,674
6,891
6,821
7,113 7,002
6,872
6,737
6,713
6,446
5,831
5,729
5,940 6,042
6,295
5,833
5,457
5,127 5,217
5,216 5,000
5,200
5,400
5,600
5,800
6,000
6,200
6,400
6,600
6,800
7,000
7,200
7,400
Jan
Feb
Mar Apr
May Jun Jul
Aug
Sep
Oct
Nov
Dec
Jan
Feb
Mar Apr
May Jun Jul
Aug
Sep
Oct
2014 2015
US$
/ to
nne
Copper
47.3
47.2
47.3 47.3
46.9 46.9
46.6
46.446.4
46.2
46.4
46.2
45.4
45.6
45.8
46.0
46.2
46.4
46.6
46.8
47.0
47.2
47.4
47.6
21 Aug 28 Aug 4 Sep 11 Sep 18 Sep 25 Sep 2 Oct 9 Oct 16 Oct 23 Oct 30 Oct 6 Nov
US$
/mt
Coal
128.1
121.4
111.8
114.6
100.6
92.7
96.192.6
82.4
81.0
74.0
68.0
68.0
63.0
58.0
52.0
60.063.0
52.0
56.0 57.0
53.0
40.0
50.0
60.0
70.0
80.0
90.0
100.0
110.0
120.0
130.0
140.0
Jan
Feb
Mar Apr
May Jun Jul
Aug
Sep
Oct
Nov
Dec
Jan
Feb
Mar Apr
May Jun Jul
Aug
Sep
Oct
2014 2015
US$/
dmtu
Iron Ore
MITI Weekly Bulletin / www.miti.gov.my
“DRIVING Transformation, POWERING Growth”
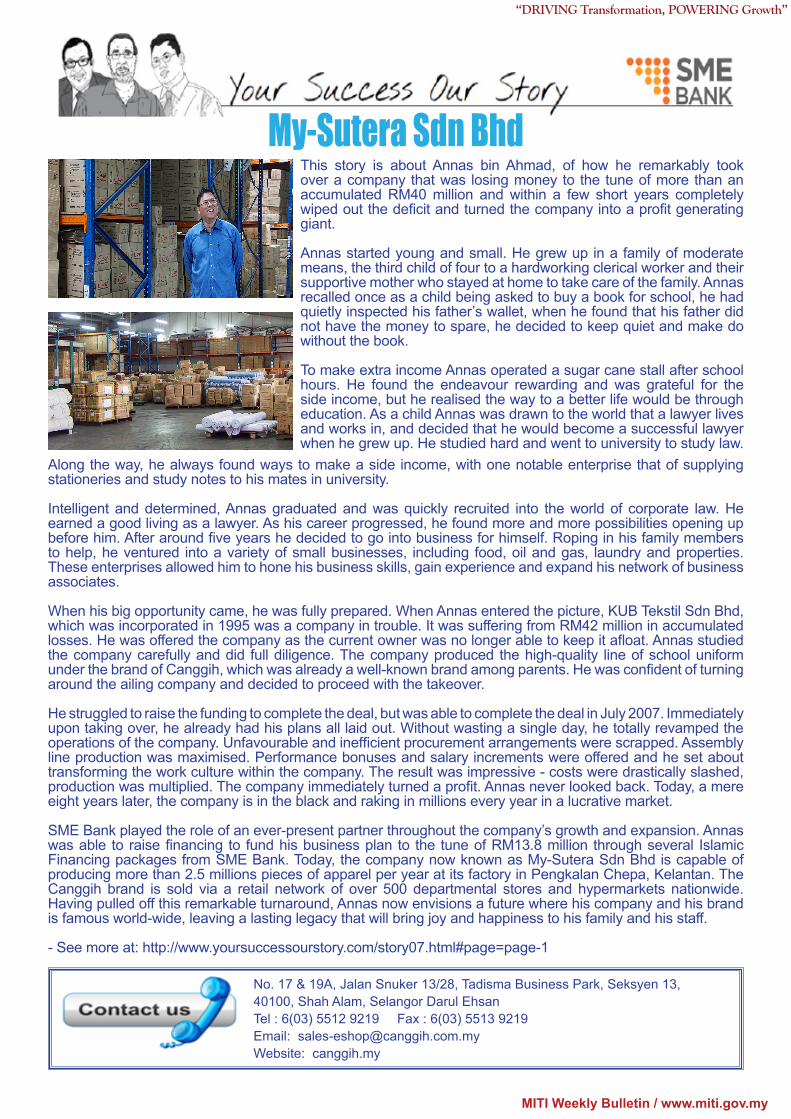
This story is about Annas bin Ahmad, of how he remarkably took over a company that was losing money to the tune of more than an accumulated RM40 million and within a few short years completely wiped out the deficit and turned the company into a profit generating giant.
Annas started young and small. He grew up in a family of moderate means, the third child of four to a hardworking clerical worker and their supportive mother who stayed at home to take care of the family. Annas recalled once as a child being asked to buy a book for school, he had quietly inspected his father’s wallet, when he found that his father did not have the money to spare, he decided to keep quiet and make do without the book.
To make extra income Annas operated a sugar cane stall after school hours. He found the endeavour rewarding and was grateful for the side income, but he realised the way to a better life would be through education. As a child Annas was drawn to the world that a lawyer lives and works in, and decided that he would become a successful lawyer when he grew up. He studied hard and went to university to study law.
No. 17 & 19A, Jalan Snuker 13/28, Tadisma Business Park, Seksyen 13,40100, Shah Alam, Selangor Darul EhsanTel : 6(03) 5512 9219 Fax : 6(03) 5513 9219Email: [email protected]: canggih.my
My-Sutera Sdn Bhd
Along the way, he always found ways to make a side income, with one notable enterprise that of supplying stationeries and study notes to his mates in university.
Intelligent and determined, Annas graduated and was quickly recruited into the world of corporate law. He earned a good living as a lawyer. As his career progressed, he found more and more possibilities opening up before him. After around five years he decided to go into business for himself. Roping in his family members to help, he ventured into a variety of small businesses, including food, oil and gas, laundry and properties. These enterprises allowed him to hone his business skills, gain experience and expand his network of business associates.
When his big opportunity came, he was fully prepared. When Annas entered the picture, KUB Tekstil Sdn Bhd, which was incorporated in 1995 was a company in trouble. It was suffering from RM42 million in accumulated losses. He was offered the company as the current owner was no longer able to keep it afloat. Annas studied the company carefully and did full diligence. The company produced the high-quality line of school uniform under the brand of Canggih, which was already a well-known brand among parents. He was confident of turning around the ailing company and decided to proceed with the takeover.
He struggled to raise the funding to complete the deal, but was able to complete the deal in July 2007. Immediately upon taking over, he already had his plans all laid out. Without wasting a single day, he totally revamped the operations of the company. Unfavourable and inefficient procurement arrangements were scrapped. Assembly line production was maximised. Performance bonuses and salary increments were offered and he set about transforming the work culture within the company. The result was impressive - costs were drastically slashed, production was multiplied. The company immediately turned a profit. Annas never looked back. Today, a mere eight years later, the company is in the black and raking in millions every year in a lucrative market.
SME Bank played the role of an ever-present partner throughout the company’s growth and expansion. Annas was able to raise financing to fund his business plan to the tune of RM13.8 million through several Islamic Financing packages from SME Bank. Today, the company now known as My-Sutera Sdn Bhd is capable of producing more than 2.5 millions pieces of apparel per year at its factory in Pengkalan Chepa, Kelantan. The Canggih brand is sold via a retail network of over 500 departmental stores and hypermarkets nationwide. Having pulled off this remarkable turnaround, Annas now envisions a future where his company and his brand is famous world-wide, leaving a lasting legacy that will bring joy and happiness to his family and his staff.
- See more at: http://www.yoursuccessourstory.com/story07.html#page=page-1
MITI Weekly Bulletin / www.miti.gov.my
“DRIVING Transformation, POWERING Growth”
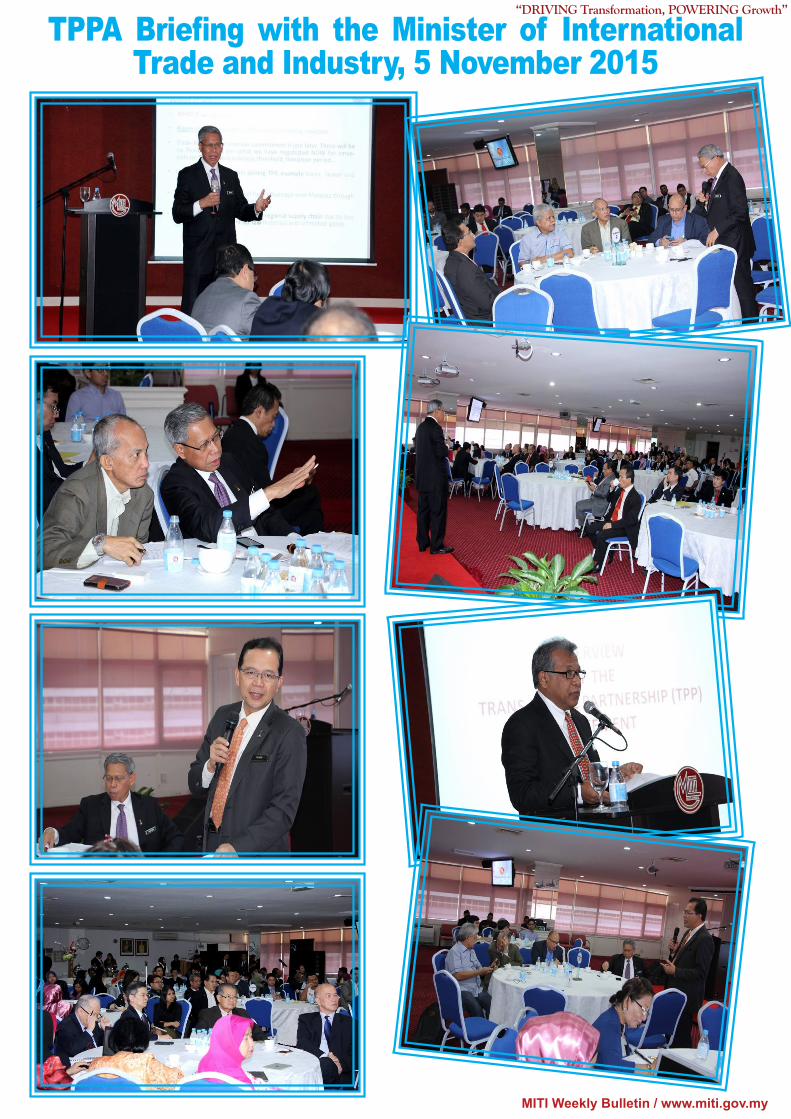
TPPA Briefing with the Minister of International Trade and Industry, 5 November 2015
MITI Weekly Bulletin / www.miti.gov.my
“DRIVING Transformation, POWERING Growth”
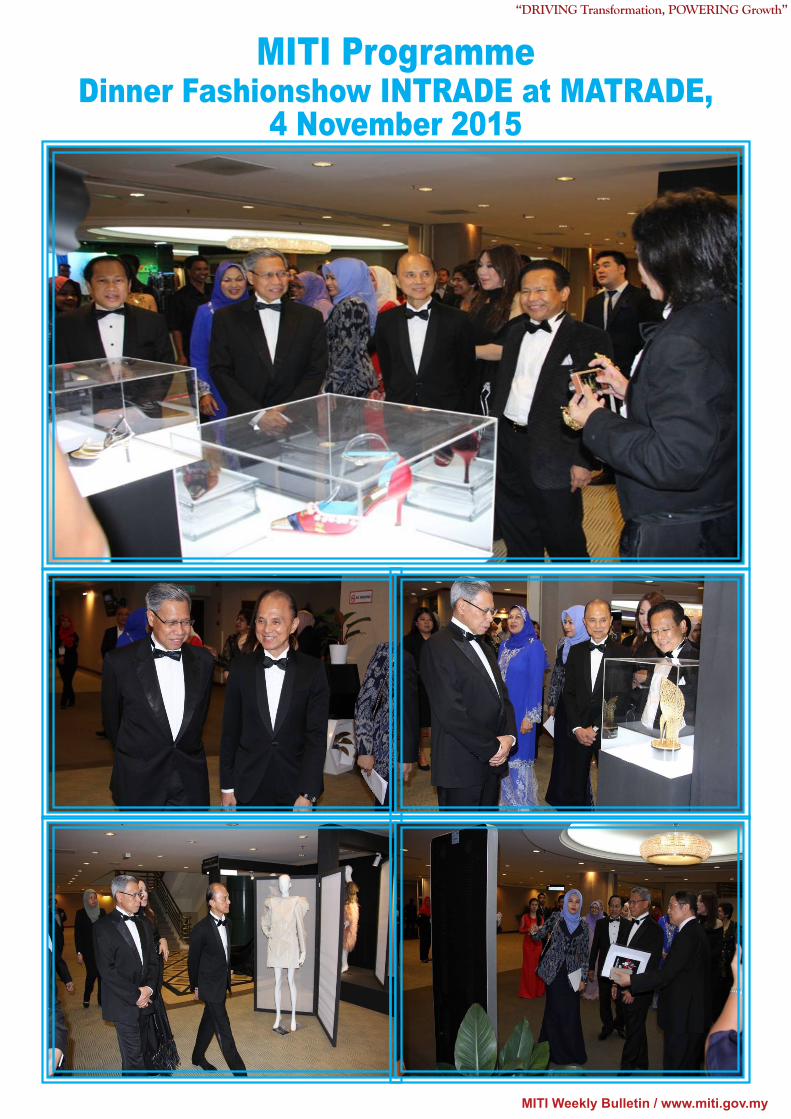
MITI ProgrammeDinner Fashionshow INTRADE at MATRADE,
4 November 2015
MITI Weekly Bulletin / www.miti.gov.my
“DRIVING Transformation, POWERING Growth”
Comments & SuggestionsDear Readers,Kindly click the link below for any comments in this issue. MWB reserves the right to edit and to republish letters as reprints. http://www.miti.gov.my/cms_matrix/form.jsp?formId=c1148fbf-c0a81573-3a2f3a2f-1380042c
@ YOUR SERVICE
Name : Megawati Md. NoorDesignation :AssistantAdministrativeOfficerJobDescription :AssistinMITIofficialfunction
Name :HashimahAbuKasimDesignation :AssistantAdministrativeOfficerJobDescription :ManagelogisticsandmaintenanceofMITIbuilding
Division : LogisticsandMaintenanceUnitContactNo :603-6200 0241Email :[email protected]
Division : LogisticsandMaintenanceUnitContactNo :603-6200 0232Email :[email protected]