declining global warming effects on the phenology of ... · 1 declining global warming effects on...
TRANSCRIPT
1
Declining global warming effects on the phenology of spring 1
leaf unfolding 2
Yongshuo H Fu1,2
, Hongfang Zhao1, Shilong Piao
1,3,4, Marc Peaucelle
5, Shushi Peng
1,5, Guiyun 3
Zhou6, Philippe Ciais
5, Mengtian Huang
1, Annette Menzel
7,8, Josep Peñuelas
9,10, Yang Song
11, 4
Yann Vitasse12,13,14
, Zhenzhong Zeng1, Ivan A Janssens
2 5
6 1 Sino-French Institute for Earth System Science, College of Urban and Environmental Sciences, Peking 7
University, Beijing 100871, China 8 2 Centre of Excellence PLECO (Plant and Vegetation Ecology), Department of Biology, University of 9
Antwerp, Universiteitsplein 1, B-2610 Wilrijk, Belgium 10 3 Key Laboratory of Alpine Ecology and Biodiversity, Institute of Tibetan Plateau Research, Chinese Academy 11
of Sciences, Beijing 100085, China 12 4 Center for Excellence in Tibetan Earth Science, Chinese Academy of Sciences, Beijing 100085, China 13
5 Laboratoire des Sciences du Climat et de l'Environnement, CEA CNRS UVSQ, Gif-sur-Yvette, France 14
6 School of Resources and Environment, University of Electronic Science and Technology of China, Chengdu, 15
China 16 7 Ecoclimatology, Technische Universität München, Freising, Germany 17
8 Technische Universität München, Institute for Advanced Study, Lichtenbergstraße 2a, 85748 Garching, 18
Germany 19 9 CREAF, Cerdanyola del Vallès, Barcelona 08193, Catalonia, Spain 20
10 CSIC, Global Ecology Unit CREAF -CSIC-UAB, Cerdanyola del Vallès, Barcelona 11 08193, Catalonia, 21
Spain 22 11
Department of Atmospheric Sciences, University of Illinois, Urbana, IL 61801, USA 23 12
University of Neuchatel, Institute of Geography, Neuchatel, Switzerland 24 13
WSL Swiss Federal Institute for Forest, Snow and Landscape Research, Neuchatel, Switzerland 25 14
WSL Institute for Snow and Avalanche Research SLF, Group Mountain Ecosystems, Davos, Switzerland 26
Revised manuscript for Nature 27
August 12, 2015 28
29
2
Earlier spring leaf unfolding is a frequently observed response of northern trees to climate 1
warming1,2,3,4
. Many deciduous tree species require chilling for dormancy release, and 2
warming-related reductions in chilling may counteract the advance of leaf unfolding in 3
response to warming5,6
. Empirical evidence for this, however, is limited to saplings or twigs 4
in climate-controlled chambers7,8
. Using long-term in situ observations of leaf unfolding for 5
seven dominant European tree species at 1,245 sites, we show here that the apparent 6
response of leaf unfolding to climate warming (ST, expressed in days advance per °C) has 7
significantly decreased from 1980 to 2013 in all monitored tree species. Averaged across all 8
species and sites, ST decreased by 40% from 4.0 ± 1.8 days °C-1
during 1980-1994 to 2.3 ± 9
1.6 days °C-1
during 1999-2013. The declining ST was also simulated by chilling-based 10
phenology models, albeit with a weaker decline (24%-30%) than observed in situ. The 11
reduction in ST is likely to be partly attributable to reduced chilling. Nonetheless, other 12
mechanisms may also play a role, such as ‘photoperiod limitation’ mechanisms that may 13
become ultimately limiting when leaf unfolding dates occur too early in the season. Our 14
results provide empirical evidence for a declining ST, but also suggest that the predicted 15
strong winter warming in the future may further reduce ST and therefore result in a 16
slowdown in the advance of tree spring phenology. 17
18
The phenology of spring leaf unfolding influences regional and hemispheric-scale carbon 19
balances2, the long-term distribution of tree species
9, and plant-animal interactions
10. Changes in 20
the phenology of spring leaf unfolding can also exert biophysical feedbacks on climate by 21
modifying the surface albedo and energy budget11,12
. Recent studies have reported significant 22
advances in spring phenology as a result of warming in most northern hemisphere regions1,3,4
. 23
Climate warming is projected to further increase13
, but the future evolution of the phenology of 24
spring leaf unfolding remains uncertain — in view of the imperfect understanding of how the 25
underlying mechanisms respond to environmental stimuli12,14
. In addition, the relative 26
contributions of each environmental stimulus, which together define the apparent temperature 27
sensitivity of the phenology of spring leaf unfolding (advances in days per degree Celsius 28
warming, ST), may also change over time6,8,15
. An improved characterization of the variation in 29
3
phenological responses to spring temperature is thus valuable, provided that it addresses temporal 1
and spatial scales relevant for regional projections. 2
Numerous studies have reported advanced spring leaf unfolding which matches warming trends 3
over recent decades1,3,4
. However, there is still debate regarding the linearity of leaf unfolding 4
response to the climate warming6,7
. Recent experimental studies of warming using saplings have 5
shown that ST weakens as warming increases7. Experimental manipulation of temperature for 6
saplings or twigs, however, might elicit phenological responses that do not accurately reflect the 7
response of mature trees16,17
. We therefore investigated the temporal changes in ST in adult trees 8
monitored in situ and exposed to real-world changes in temperature and other climate variables. 9
These long-term data series were obtained across Central Europe from the Pan European 10
Phenology Project (http://www.pep725.eu/). Data were collected from 1,245 sites for seven 11
dominant tree species (see methods and the distribution of the sites in Extended Data Fig. 1). The 12
aims of our analysis are to determine the temporal changes in ST at the species level during 1980-13
2013, a period during which Europe has substantially warmed13
, and to relate these changes in ST 14
to differences in other physiological and environmental factors. 15
16
For each species at each observation site, we first determined the preseason length as the period 17
before leaf unfolding for which the partial correlation coefficient between leaf unfolding and air 18
temperature was highest (see methods). We used a gridded climate dataset, including daily 19
maximum and minimum air temperature, precipitation and absorbed downward solar radiation, 20
with a spatial resolution of 0.25º (approximately 25 km)18
. The optimal length of the preseason 21
ranged between 15 days and four months across the seven species (Extended Data Fig. 2), in 22
agreement with earlier results1,14
. We then calculated the average temperature during the 23
preseason for each year at each site and calculated ST using ordinary least squares linear 24
regression for the entire period and for two 15-year periods, namely 1980-1994 and 1999-2013, 25
that had slight difference in preseason lengths (Extended Data Fig. 3a). The leaf unfolding dates 26
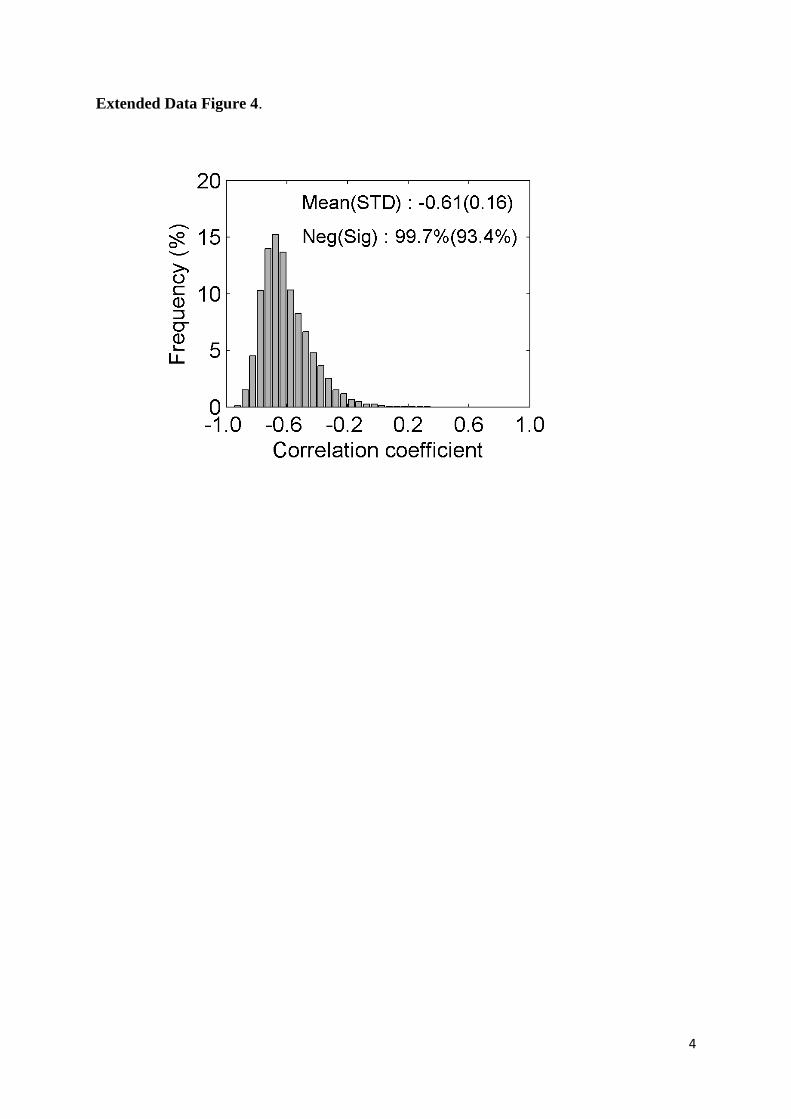
were negatively correlated with the preseason temperature, with a mean linear correlation 27
coefficient of -0.61±0.16, determined using the preseason defined from the time period 1980-28
2013. Almost all individual tree-level correlations were negative (99.7%) and the vast majority of 29
these correlations was statistically significant at P<0.05 (93.4%) (Extended Data Fig. 4). In line 30

4
with previous studies1,4
, the timing of leaf unfolding substantially advanced in all species for 1
1980-2013, with an average advancing rate of 3.4 ± 1.2 days °C-1
across all species-sites 2
(hereafter, a positive value indicates advancement) (Fig. 1a). But the surprising result is that ST 3
significantly decreased by 40.0% from 4.0 ± 1.8 days °C-1
during 1980-1994 to 2.3 ± 1.6 days °C-
4
1 during 1999-2013 (t=-37.3, df=5473, P<0.001) (Fig. 1b). All species show similar significant 5
decreases in ST (Fig. 1a), although the extent of reduction was species-specific. For example, 6
Aesculus hippocastanum (see caption to Fig. 1 for English common names) had the largest 7
decrease in ST (-2.0 days °C-1
), while ST decreased only slightly (but still significantly) in Fagus 8
sylvatica (-0.9 days °C-1
) (Fig. 1a). Similar results were also obtained using a fixed preseason 9
length determined either in the time period 1980-1994 or in 1999-2013 (Extended Data Fig. 3b 10
and 3c). The declining ST could, however, also have been an artifact resulting from the 11
‗encroachment‘ of leaf unfolding dates into the preseason period that was used to calculate the 12
temperature sensitivity. We therefore calculated the number of ‗encroachment days‘ and found it 13
is very small compared to the pre-season length even in the warmest period (Extended Data Fig. 14
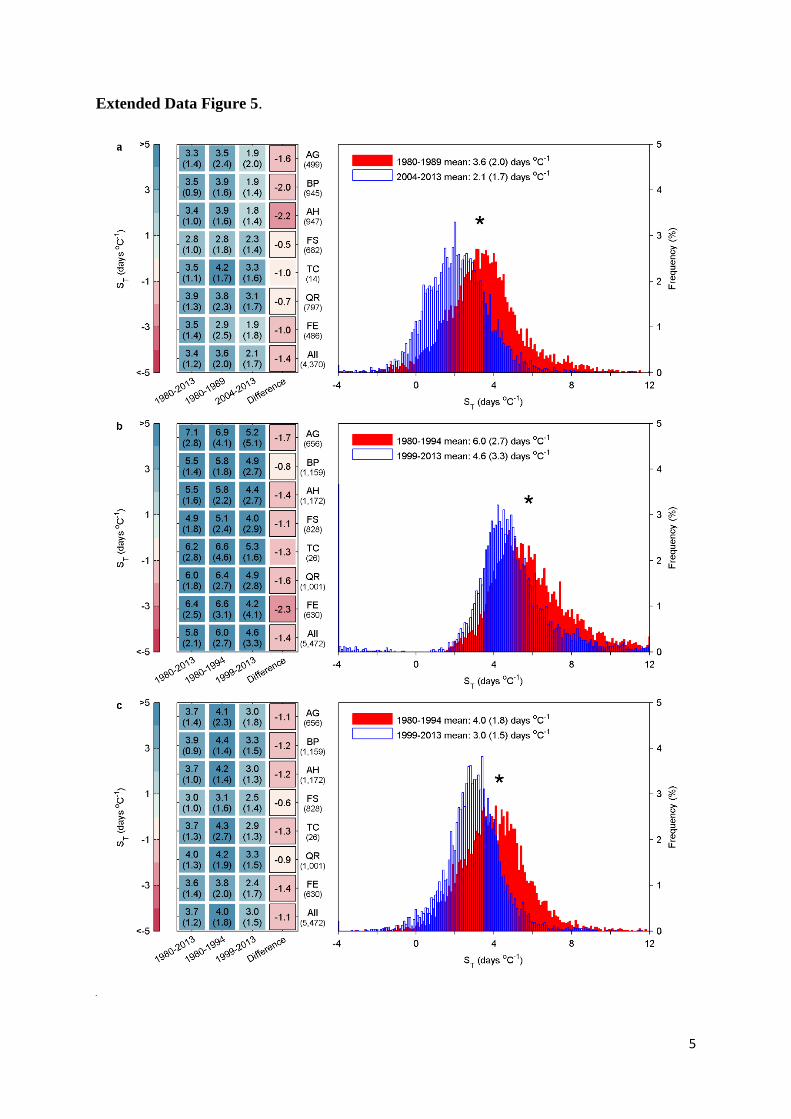
3d and 3e). Because the time scale of the analysis could affect the estimates of ST 19
, we also 15
calculated ST using 10-year intervals (instead of 15 years) and found consistent results, i.e., ST 16
significantly decreased between the 1980s and the last decade for all species except Tilia cordata 17
(Extended Data Fig. 5a). We further calculated ST with a 15-year moving window from 1980 to 18
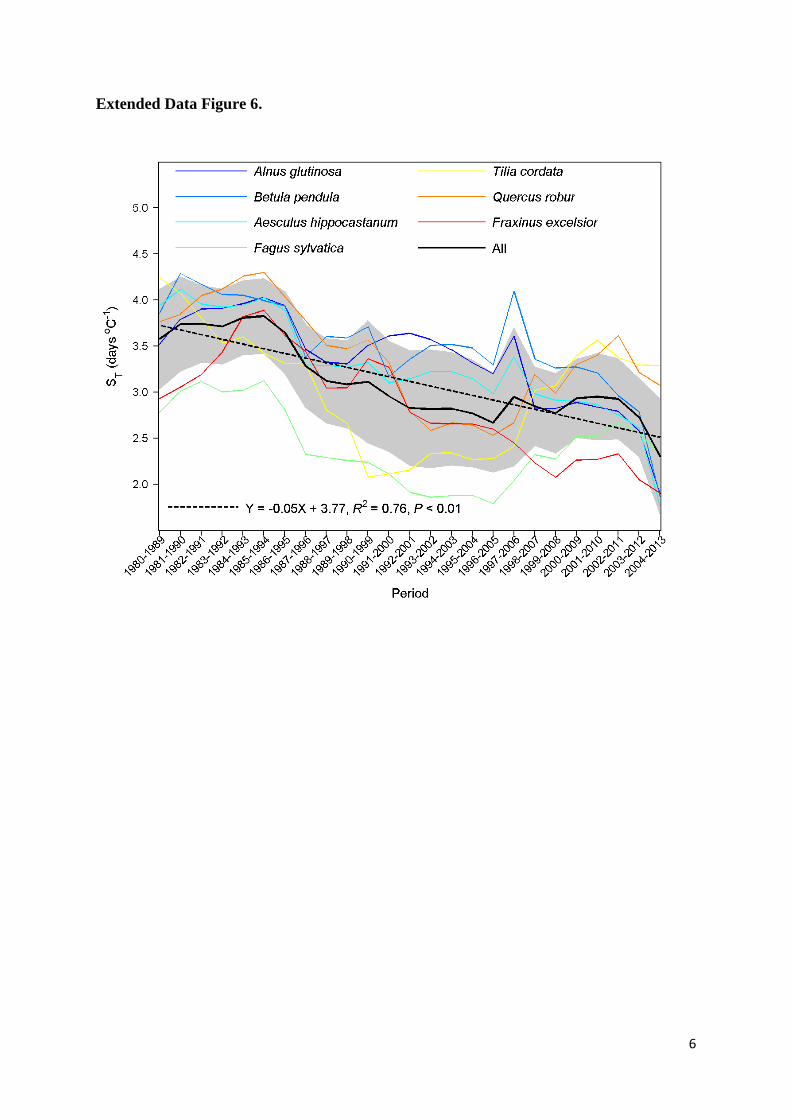
2013 and found a significant decrease (P<0.01) for each of the seven species (Fig. 1c). ST 19
decreased by an average of 0.7 days °C-1
per decade across all species. Similar results were also 20
reached when a 10-year interval was used (Extended Data Fig. 6). These results suggest a 21
significant change in the response of leaf unfolding to the ongoing climate warming in all studied 22
tree species in Central Europe. 23
24
Since there is no single accepted theory to account for the decreased ST over the period 1980-25
2013, we propose three mutually non-exclusive hypotheses: (1) adaptation to increased variance 26
in spring temperature, (2) photoperiodic limitations (due to earlier leaf unfolding) overriding 27
temperature controls, and (3) reduced duration and/or sum of cold temperatures during dormancy, 28
a ‗lost chilling‘ mechanism. 29
30

5
The first hypothesis relates to possible effects of an increased variance in temperature. A recent 1
study reported substantial spatial differences in ST, with smaller absolute values at sites with a 2
higher variance of local spring temperature20
. Trees may indeed develop conservative strategies 3
(or higher phenological plasticity) of spring leaf unfolding in places where temperature fluctuates 4
more, in order for instance to avoid spring frost damage21
. The observed declining ST could 5
therefore partly result from an increase in the variance in spring temperature. However, the 6
variance in spring temperature only significantly increased at sites of two species and decreased 7
for all the other species except Fraxinus excelsior (Fig. 2a). This suggests that increased variance 8
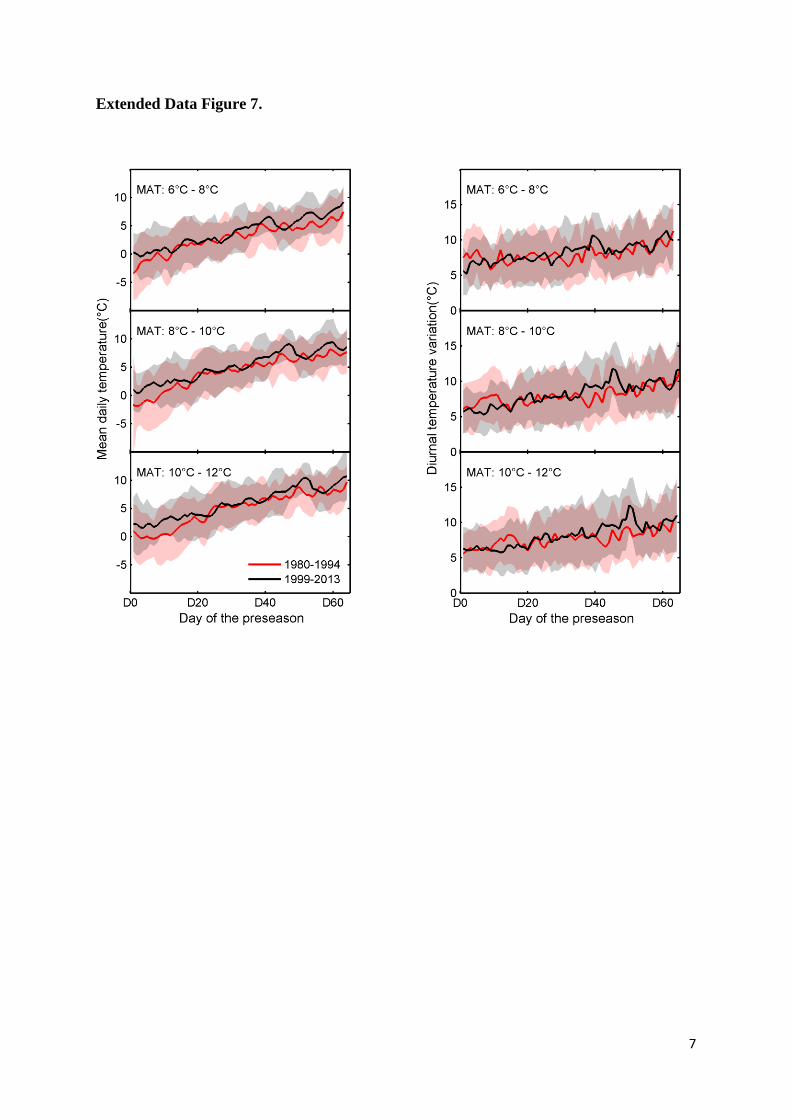
in spring temperature cannot account for the decreased ST. We further studied the fluctuations in 9
daily mean temperature and diurnal temperature amplitude (Tmax - Tmin) over the preseason for 10
the two periods 1980-1994 and 1999-2013, and for three groups of sites with comparable mean 11
annual temperature (MAT). The fluctuations in daily temperature and diurnal temperature 12
amplitude during the preseason were similar during the two time periods between which ST 13
declined (Extended Data Fig. 7), suggesting that altered temperature variability is not an obvious 14
cause for the declining apparent temperature sensitivity of leaf unfolding. 15
16
Precocious leaf unfolding in warm springs may increase the risk of late frost events for trees21
. To 17
overcome this risk during warm springs, many species have evolved a protective mechanism 18
related to photoperiod22
, which hinders the warming response when days are still short and the 19
risk for subsequent frost events is thus high. Our second, alternative, hypothesis to account for 20
the observed decrease in ST in recent decades is therefore a change in the relationship between 21
chilling accumulation and heat requirement, due to the shortening days as warming advances leaf 22
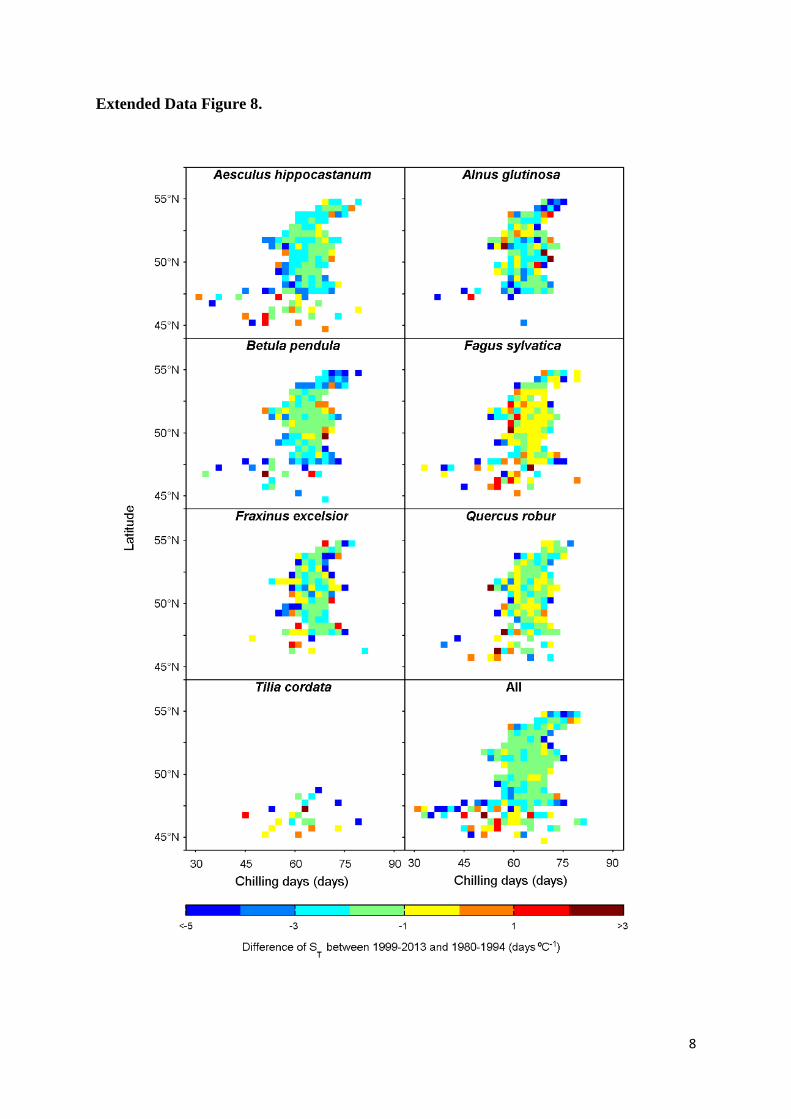
unfolding. However, we did not observe changes in ST with latitude, neither across all species, 23
nor for individual species (Extended Data Fig. 8), as one may expect if photoperiod was a strong 24
co-limitation of leaf unfolding. Nonetheless, we have no evidence to exclude photoperiod as a 25
controlling mechanism for the decline of ST since different populations may have different 26
genetic adaptations to photoperiod23
. In addition, the lack of relation between ST and latitude may 27
have been because the response of spring phenology to photoperiod can be associated with many 28
confounding factors, such as tree age17
, successional niche23
(although there is some 29
contradictory evidence8), xylem anatomy
24, or chilling conditions
8. We can therefore not 30
6
conclude that photoperiod did not influence ST, but how it might directly or indirectly affect 1
spring phenology still remains unclear and is currently under debate6,15,22
. 2
3
The third hypothesis to explain for the decreased ST is based on the control of spring phenology 4
by cold temperatures during the dormancy period. In general, temperate and boreal trees require a 5
certain amount of heat (heat requirement) after they come out of the rest period to initiate leaf 6
unfolding in spring25
. Logically, this heat requirement is met sooner during warmer springs, 7
which explains the advance of leaf unfolding in response to global warming. The heat 8
requirement, however, is negatively correlated with chilling7,8,25
, i.e. the accumulation of cold 9
temperatures during the dormancy period. Since the dormancy period warmed during the study 10
period, the accumulated chilling is progressively reduced, thereby increasing heat requirement 11
and slowing down the advance of leaf unfolding. The net effect of lost chilling can thus be a 12
reduced ST. This effect may be further exacerbated by the non-linearity of the negative 13
correlation between the heat requirement and the chilling accumulation7,25
. 14
15
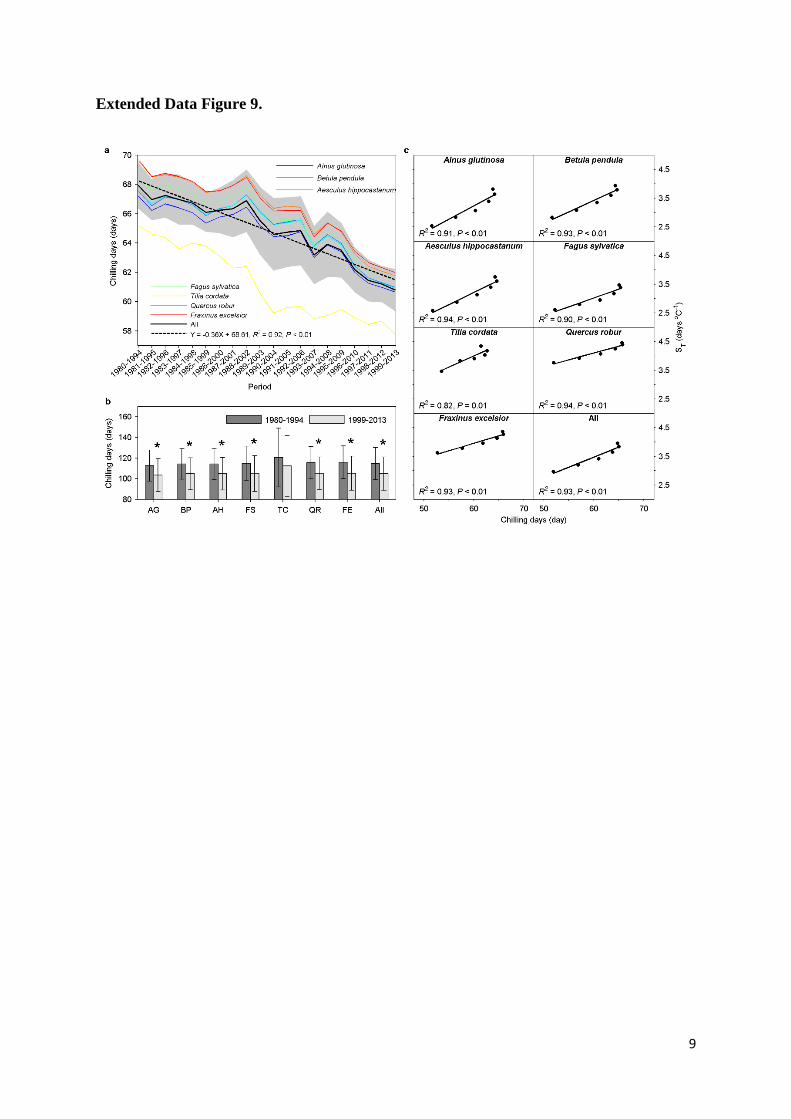
To test this hypothesis, we calculated the accumulated chilling that was defined as the sum of 16
days when daily air temperature was within the range between 0 and 5 °C from 1st November in 17
the year prior to leaf unfolding (see methods), and found a significant decrease (P<0.001) in 18
chilling accumulation for all species (Fig. 2b). Chilling accumulation was 10% lower for 1999-19
2013 than for 1980-1994. Chilling accumulation was also significantly decreased with a 15-year 20
moving window (Extended Data Fig. 9a) and when defined by different temperature thresholds 21
(Extended Data Fig. 9b). To further test the importance of the ‗lost chilling‘ hypothesis, we 22
applied three chilling-based phenology models to the data (See Supplementary information). All 23
three models captured the declining ST after their calibration at each site and their integration 24
with observed climate forcing, irrespective of species (Fig. 3). The modelled relative reductions 25
in ST between the two periods 1980-1994 and 1999-2013 were, however, smaller than the 26
observed decline, i.e. simulated ST was reduced by 28.8 %, 24.4% and 30.4% for the Sequential, 27
Parallel and Unified chilling-based models, respectively, whereas the observed ST was reduced 28
by 40.0%. This may suggest that either other protective or adaptive mechanisms, such as 29
photoperiod or adaptation mechanisms, are affecting the decline in ST, or that the three models do 30
7
not completely accurately represent all chilling mechanisms. There are also uncertainties related 1
to the 0.25° gridded climate product that may not represent local air temperature at each site 2
(snow effects, shading, slope, elevation). Furthermore, using the Unified model, we applied 3
idealized stepwise increases of winter temperature over the period 1980-2013 by +1°C to +5°C, 4
and consistently obtained a decrease in ST induced by the loss of chilling in these idealized tests 5
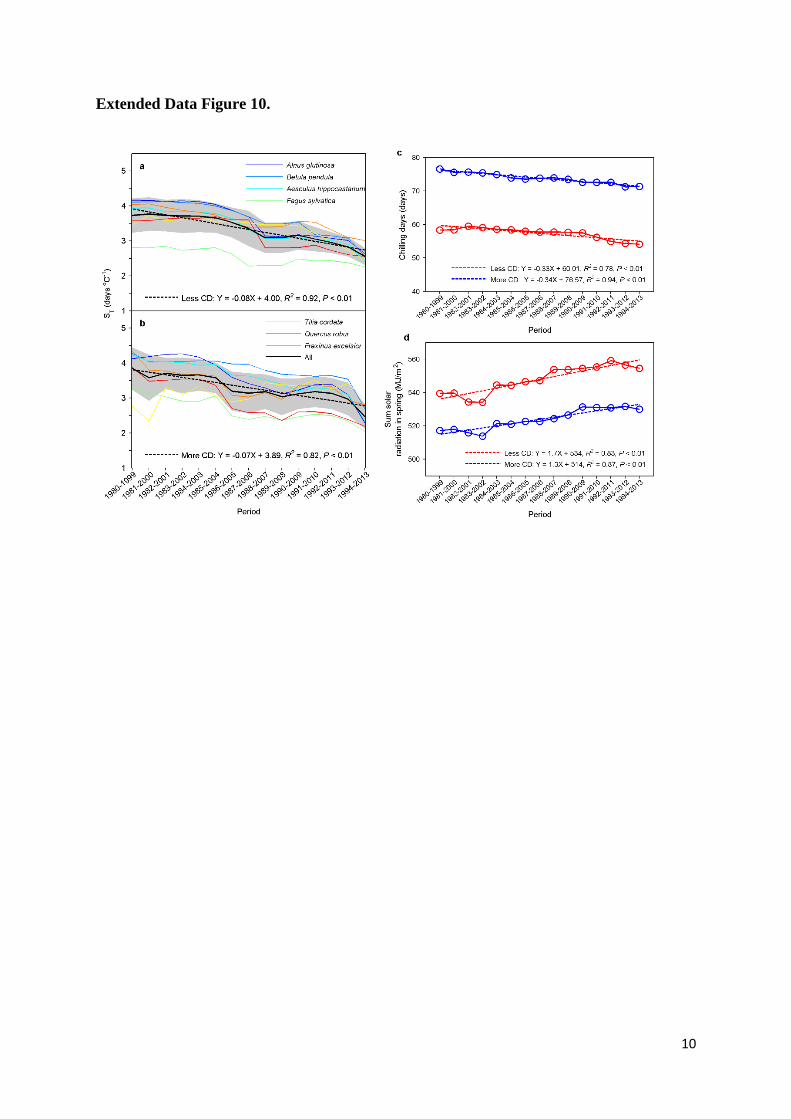
(Extended Data Fig. 9c). However, we did not find marked differences in ST between years with 6
more chilling days and years with less chilling days (Extended Data Fig. 10a-c), which can 7
probably be explained by the different climate conditions between years with more and less 8
chilling days. For example, the relatively high spring radiation sum in years with less chilling 9
days might buffer the effects of less chilling days (Extended Data Fig. 10d), and eventually 10
resulted in a similar ST, but this remains speculation. Clearly, further studies are needed to 11
support these inferences and their role in the control over phenology. Overall, these results 12
support the third hypothesis that the decline in chilling accumulation is, at least partly, driving the 13
decline in ST, although the possible constraint of photoperiod/radiation could not be excluded. 14
15
Changes in spring phenology associated with climate warming have direct impacts on regional 16
and global carbon cycling12
. Studies have reported that an extension of the growing season can 17
increase the photosynthetic production of forests by 0.5-1% per day26,27,28
. We found that the 18
apparent sensitivity of spring phenology to warming for seven temperate tree species in Central 19
Europe has declined significantly as winter and spring temperatures increased over the past three 20
decades. These findings indicate that the early spring phenologically-driven increases in carbon 21
uptake may slow down for temperate forests under future conditions of climate warming. On the 22
other hand, the declining apparent temperature sensitivity of spring phenology may be beneficial 23
for the trees. Extreme climatic events have dramatically increased in recent decades, especially 24
warm winters and springs29
, and the decreased apparent temperature sensitivity would thus 25
reduce the risk of late spring frost damage by avoiding premature leaf unfolding. 26
27
Methods 28
Data sets. In situ phenological observations were obtained from the Pan European Phenology 29
network (http://www.pep725.eu/), which provides an open European phenological database 30
8
comprising multiple plant phenological records. We selected the records of leaf unfolding dates 1
for seven tree species at 1,245 sites for 1980-2013 from sites in an area stretching from north 2
Germany to the Adriatic Sea (see Extended Data Fig. 1). The leaf unfolding dates were defined 3
according to the BBCH code (Biologische Bundesanstalt, Bundessortenamt und Chemische 4
Industrie). Dates were excluded from the analysis when the trees flushed later than the end of 5
June. The daily mean air temperature of each site was derived from a gridded climate data set of 6
daily maximum and minimum temperature at 0.25º spatial resolution (approximately 25 km)18
. 7
We also applied another climate forcing dataset (CRU-NCEP v5, with spatial resolution of 0.5º 8
and temporal resolution of 6h, http://dods.extra.cea.fr/data/p529viov/cruncep/), and returned very 9
similar results (Extended Data Fig. 5c). 10
11
Analysis. The relevant period for leaf unfolding is several months prior to the phenological 12
event1, and periods differ among species and locations. To remove covariate effects of 13
precipitation and radiation on leaf unfolding, we applied a partial correlation analysis to 14
determine the optimal length of the preseason for each species at each site30
. The optimal 15
preseason for each species at each station was defined as the period (with 15-day steps) before 16
the mean leaf unfolding date for which the partial correlation coefficient between leaf unfolding 17
and air temperature was highest during 1980-2013. Using a similar method, we also defined 18
preseason for two 15-year periods (e.g., 1980-1994, 1999-2013) to further assess the robustness 19
of the inferred decline of apparent temperature sensitivity of leaf unfolding over the last three 20
decades (Extended Data Fig. 3a-c). 21
22
Linear regression analyses (using both ordinary least squares and reduced major axis regressions) 23
of the dates of leaf unfolding against mean air temperature over the preseason were performed for 24
each species at each site during the three study periods: 1980-2013 (minimum 15-year records 25
required per site), 1980-1994, and 1999-2013 (minimum 7-year records required per site, 26
satisfied simultaneously for the two latter study periods). Similar results, i.e. significant decreases 27
in ST, were observed using reduced major axis regression method (Extended Data Fig. 5b), we 28
therefore only present the results using ordinary least squares method. The regression coefficient 29
was defined as the apparent temperature sensitivity of leaf unfolding (ST) that reflects the change 30

9
in leaf unfolding date per unit increase in mean temperature during the preseason. This is not the 1
‗actual‗ physiological sensitivity to temperature, given that other climate-related variables, such 2
as chilling, photoperiod, solar radiation and precipitation, also co-determine the leaf unfolding 3
process and determine the emerging ST value diagnosed from the preseason temperature8,12,22
. 4
The mean ST across all sites was calculated for each and all species for these three periods. The 5
frequency distributions of ST across all species and sites for 1980-1994 and 1999-2013 were 6
determined. The differences in mean ST during 1999-2013 and 1980-1994 were tested using 7
independent t-tests for each and across species. 8
9
To investigate the effect of the chilling requirement and variance in spring temperature on ST, we 10
calculated species-specific variances in spring temperature and chilling requirements at each site. 11
The spring temperature variance was calculated as the standard deviation of mean temperature 12
during the preseason. The chilling requirement is normally defined as the length of the period 13
(days or hours) during which temperature remains within a specific range. Most previous studies 14
have reported that temperatures slightly above freezing are most effective in satisfying the 15
chilling requirement31
and have suggested that the temperature range between 0 and 5 °C is the 16
most effective across species. To calculate the chilling requirement, we therefore summed the 17
days when daily temperature was within this range: 18
0
( ) 1 0 5LFt
req t
t
CD t if T 19
where CDreq is the chilling requirement, tLF is the day of leaf unfolding, Tt is the daily mean 20
temperature on day t, and t0 is the start date for chilling accumulation. t0 was fixed at 1 November 21
in the year prior to leaf unfolding. We also tested another commonly used temperature threshold, 22
5°C24
, and included all temperatures below this threshold. 23
0
( ) 1 5LFt
req t
t
CD t if T 24
The differences in mean during 1999-2013 and 1980-1994 were tested using independent t-tests 25
for each and across species. Ordinary least squares linear regression was applied to determine the 26
temporal change in the chilling requirement for 1980-2013 and to determine the correlation 27
between chilling accumulation and ST. 28
10
1
Reference 2
1 Menzel, A. et al. European phenological response to climate change matches the warming 3
pattern. Global Change Biol. 12, 1969-1976 (2006). 4
2 Myneni, R. C., Keeling, C. D., Tucker, C. J., Asrar, G. & Nemani, R. R. Increased plant 5
growth in the northern high latitudes from 1981 to 1991. Nature 386, 698-702 (1997). 6
3 Peñuelas, J. & Filella, I. Responses to a warming world. Science 294, 793-795 (2001). 7
4 Fu, Y. S. H. et al. Recent spring phenology shifts in western Central Europe based on 8
multiscale observations. Global Ecol. Biogeogr. 23, 1255-1263 (2014). 9
5 Yu, H. Y., Luedeling, E. & Xu, J. C. Winter and spring warming result in delayed spring 10
phenology on the Tibetan Plateau. Proc. Natl. Acad. Sci. U.S.A 107, 22151-22156 (2010). 11
6 Chuine, I., Morin, X. & Bugmann, H. Warming, photoperiods, and tree phenology. 12
Science 329, 277-278 (2010). 13
7 Fu, Y. S. H., Campioli, M., Deckmyn, G. & Janssens, I. A. Sensitivity of leaf unfolding to 14
experimental warming in three temperate tree species. Agric. For. Meteorol. 181, 125-132 15
(2013). 16
8 Laube, J. et al. Chilling outweighs photoperiod in preventing precocious spring 17
development. Global Change Biol. 20, 170-182 (2014). 18
9 Chuine, I. Why does phenology drive species distribution? Philos. Trans. R. Soc. London, 19
Ser. B 365, 3149-3160 (2010). 20
10 Zohner, C. M. & Renner, S. S. Common garden comparison of the leaf-out phenology of 21
woody species from different native climates, combined with herbarium records, forecasts 22
long-term change. Ecol. Lett. 17, 1016-1025 (2014). 23
11 Peñuelas, J., Rutishauser, T. & Filella, I. Phenology feedbacks on climate change. Science 24
324, 887-888 (2009). 25
12 Richardson, A. D. et al. Climate change, phenology, and phenological control of 26
vegetation feedbacks to the climate system. Agric. For. Meteorol. 169, 156-173 (2013). 27
13 IPCC. Climate Change 2014: Impacts, Adaptation, and Vulnerability. Part A: Global and 28
Sectoral Aspects. Contribution of Working Group II to the Fifth Assessment Report of the 29
Intergovernmental Panel on Climate Change [Field, C.B., V.R. Barros, D.J. Dokken, K.J. 30
11
Mach, M.D. Mastrandrea, T.E. Bilir, M. Chatterjee, K.L. Ebi, Y.O. Estrada, R.C. Genova, 1
B. Girma, E.S. Kissel, A.N. Levy, S. MacCracken, P.R. Mastrandrea, and L.L. White 2
(eds.)]. (Cambridge University Press, 2014). 3
14 Piao, S. et al. Leaf onset in the northern hemisphere triggered by daytime temperature. 4
Nat. Commun. 6, 6911 (2015). 5
15 Way, D. A. & Montgomery, R. A. Photoperiod constraints on tree phenology, 6
performance and migration in a warming world. Plant Cell Environ. 38, 1725-1736 7
(2014). 8
16 Wolkovich, E. M. et al. Warming experiments underpredict plant phenological responses 9
to climate change. Nature 485, 494-497 (2012). 10
17 Vitasse, Y. Ontogenic changes rather than difference in temperature cause understory 11
trees to leaf out earlier. New Phytol. 198, 149-155 (2013). 12
18 Beer, C. et al. Harmonized European long-term climate data for assessing the effect of 13
changing temporal variability on land-atmosphere CO2 fluxes. J. Clim. 27, 4815–4834 14
(2014). 15
19 Badeck, F. W. et al. Responses of spring phenology to climate change. New Phytol. 162, 16
295-309 (2004). 17
20 Wang, T. et al. The influence of local spring temperature variance on temperature 18
sensitivity of spring phenology. Global Change Biol. 20, 1473-1480 (2014). 19
21 Vitasse, Y., Lenz, A. & Körner, C. The interaction between freezing tolerance and 20
phenology in temperate deciduous trees. Front. Plant Sci. 5, 541 (2014). 21
22 Körner, C. & Basler, D. Phenology under global warming. Science 327, 1461-1462 22
(2010). 23
23 Basler, D. & Körner, C. Photoperiod sensitivity of bud burst in 14 temperate forest tree 24
species. Agric. For. Meteorol. 165, 73-81 (2012). 25
24 Hunter, A. F. & Lechowicz, M. J. Predicting the timing of budburst in temperate trees. J. 26
Appl. Ecol. 29, 597-604 (1992). 27
25 Harrington, C. A., Gould, P. J. & St Clair, J. B. Modeling the effects of winter 28
environment on dormancy release of Douglas-fir. Forest Ecol. Manag. 259, 798-808 29
(2010). 30

12
26 Kimball, J. S. et al. Satellite radar remote sensing of seasonal growing seasons for boreal 1
and sub-alpine evergreen forests. Remote Sens. Environ 90, 243-258 (2004). 2
27 Piao, S. et al. Growing season extension and its impact on terrestrial carbon cycle in the 3
Northern Hemisphere over the past 2 decades. Glob. Biogeochem. Cycles 21, GB3018 4
(2007). 5
28 White, M. A., Running, S. W. & Thornton, P. E. The impact of growing-season length 6
variability on carbon assimilation and evapotranspiration over 88 years in the eastern US 7
deciduous forest. Int. J. Biometeorol 42, 139-145 (1999). 8
29 Rahmstorf, S. & Coumou, D. Increase of extreme events in a warming world. Proc. Natl. 9
Acad. Sci. U.S.A 108, 17905-17909 (2011). 10
30 Fu, Y. S. H. et al. Variation in leaf flushing date influences autumnal senescence and next 11
year's flushing date in two temperate tree species. Proc. Natl. Acad. Sci. U.S.A 111, 7355-12
7360 (2014). 13
31 Coville, F. V. The influence of cold in stimulating the growth of plants. Proc. Natl. Acad. 14
Sci. U.S.A 6, 434-435 (1920). 15
16
Supplementary Information is linked to the online version of the paper at 17
www.nature.com/nature. 18
19
Acknowledgments 20
This study was supported by the National Natural Science Foundation of China (41125004 21
and 31321061), and National Youth Top-notch Talent Support Program in China. Yongshuo H. 22
Fu is supported by an FWO Pegasus Marie Curie Fellowship. Ivan A. Janssens, Philippe Ciais 23
and Josep Peñuelas acknowledge support from the European Research Council through Synergy 24
grant ERC-2013-SyG-610028 ―IMBALANCE-P‖ and Annette Menzel acknowledges support 25
through the (FP7/2007-2013)/ERC grant 282250 ―E3-Extreme Event Ecology‖. Ivan A. Janssens 26
acknowledges support from the University of Antwerp Centre of Excellence ―GCE‖. We thank 27
the three anonymous reviewers for their constructive comments on an earlier version of this 28
13
manuscript. The authors gratefully acknowledge all members of the PEP725 project for providing 1
the phenological data. 2
3
Author contributions 4
S.L.P., Y.H.F. and I.A.J. designed the research; H.F.Z., Y.H.F., M. P., S.S.P. and G.Y.Z 5
performed the analysis; Y.H.F., S.L.P. and I.A.J. drafted the paper; and all authors contributed to 6
the interpretation of the results and to the text. 7
Author Information 8
Reprints and permission information are available at www.nature.com/reprints. The authors 9
have no competing financial interests. Correspondence and requests for materials should be 10
addressed to S.L.P. ([email protected]). 11
12
Figure Legends 13
Figure 1. Changes of apparent temperature sensitivity of leaf unfolding (ST, advances in 14
days per degree Celsius warming) over time. (a) Species-specific ST and its standard deviation 15
(in brackets) across all sites in three periods and its difference between 1999-2013 and 1980-16
1994. The ST was determined using the preseason fixed at the time period 1980-2013 and using 17
ordinary least squares linear regression. The colour scale indicates magnitude of ST. AG, alder 18
(Alnus glutinosa); BP, silver birch (Betula pendula); AH, horse chestnut (Aesculus 19
hippocastanum); FS, beech (Fagus sylvatica); TC, lime (Tilia cordata); QR, oak (Quercus 20
robur); FE, ash (Fraxinus excelsior). The number of sites for each species are in brackets under 21
the species name. (b) The distribution of ST across all species and sites in two different periods 22
and the mean ST and standard deviations (in brackets). The asterisk indicates a significant 23
difference of ST between the two periods at P<0.05. (c) Temporal change of ST for each and all 24
species across all sites with a 15-year moving window from 1980 to 2013. The black line 25
indicates the average across all species, and the grey area indicates one standard deviation either 26
side of the mean. The dotted line indicates the linear regression. 27
14
1
Figure 2. Changes of chilling and spring temperature variation (Tstd) between 1980-1994 2
and 1999-2013. Species-specific Tstd (a) and chilling accumulation (b) across all sites over two 3
periods, 1980-1994 and 1999-2013. The Tstd was calculated as the standard deviation of mean 4
spring temperature during the preseason over these two periods. The preseason was defined as the 5
period before leaf unfolding for which the correlation coefficient between leaf unfolding and 6
temperature was highest. The chilling accumulation was calculated as chilling days when daily 7
temperature was between 0 and 5 °C from 1 November to the average date of leaf unfolding. The 8
asterisks indicate significant differences at P<0.05. 9
10
Figure 3. Changes of modeled apparent temperature sensitivity of leaf unfolding (ST, 11
advances in days per degree Celsius warming). As in Fig. 1a, panels a-c show the modelled 12
species-specific ST, including the standard deviations (in brackets), across all sites during three 13
periods and its difference between 1999-2013 and 1980-1994. (a) Sequential model, (b) Parallel 14
model and (c) Unified model. As in Fig. 1c, panels d-f show the modelled temporal change of ST 15
for each and all species across all sites with a 15-year moving window from 1980 to 2013. (d) 16
Sequential model, (e) Parallel model and (f) Unified model. The model performance is provided 17
in (g). The ST was determined using the preseason fixed at the time period 1980-2013 and using 18
ordinary least squares linear regression. The colour scale indicates magnitude of ST. RMSE, root 19
mean square error; AG, alder (Alnus glutinosa); BP, silver birch (Betula pendula); AH, horse 20
chestnut (Aesculus hippocastanum); FS, beech (Fagus sylvatica); TC, lime (Tilia cordata); QR, 21
oak (Quercus robur); FE, ash (Fraxinus excelsior). The number of sites for each species are in 22
brackets under the species name. 23
24
Extended Data Figure Legends: 25
Extended Data Figure 1. The distribution of the sites. The data were obtained from the Pan 26
European Phenology network (http://www.pep725.eu/). 27
15
Extended Data Figure 2. The distribution of preseason length for each and all species. The 1
optimal preseason was defined as the period before leaf unfolding for which the correlation 2
coefficient between leaf unfolding and temperature was highest. The numbers in the brackets are 3
the mean dates of leaf unfolding across all sites. 4
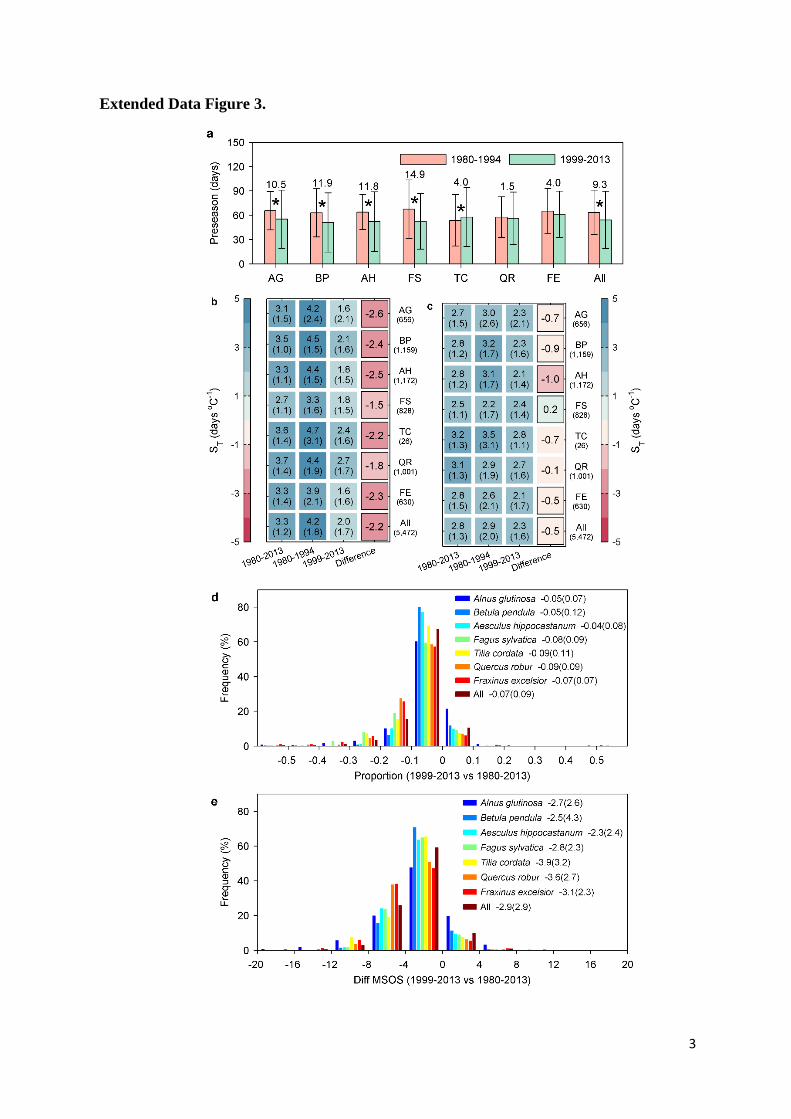
Extended Data Figure 3. Changes of apparent temperature sensitivity of leaf unfolding (ST, 5
advances in days per degree Celsius warming) between 1980-1994 and 1999-2013. Same as 6
Fig. 1, but the ST was calculated based on the preseason that was determined either in the time 7
period 1980-1994 (b) or in 1999-2013 (c). The differences in preseason lengths are provided for 8
each and all species (a), and the figures above bars are the mean absolute preseason difference 9
between two periods. For b and c, species-specific ST and its standard deviation (in brackets) 10
across all sites in three periods and its difference between 1999-2013 and 1980-1994. The colour 11
scale indicates magnitude of ST. AG, Alnus glutinosa; BP, Betula pendula; AH, Aesculus 12
hippocastanum; FS, Fagus sylvatica; TC, Tilia cordata; QR, Quercus robur; FE, Fraxinus 13
excelsior. The number of sites for each species are in brackets under the species name. (d) The 14
distribution of the proportion and corresponding days (e) of the encroachment of phenology dates 15
into the preseason temperature that the preseason was determined on the period 1980-2013. The 16
proportion was defined as the difference of the mean leaf unfolding dates (diff MSOS) between 17
the period 1999-2013 and 1980-2013 (which is the end date of the preseason temperature that 18
was used to calculate the ST) divided by the preseason length in days. The mean values and its 19
standard deviation (in brackets) are provided for each and all species. 20
Extended Data Figure 4. The distribution of partial correlation coefficients between 21
preseason temperature and leaf unfolding dates over the time period 1980- 2013. The mean 22
(and standard deviation: STD) of the correlation coefficients across all species and sites are 23
provided. The percentages of negative correlations and statistically significant negative 24
correlations (Neg(Sig)) are also provided. 25
Extended Data Figure 5. Changes of apparent temperature sensitivity of leaf unfolding (ST, 26
advances in days per degree Celsius warming) determined by different methods. The ST 27
were analyzed in two 10-year periods (a), were calculated using the reduced major axis (RMA) 28

16
regression (b), or were calculated based on another climate forcing dataset (CRU-NCEP v5, c). 1
Species-specific ST and its standard deviation (in brackets) across all sites in three periods and the 2
difference two study periods are provided. The colour scale indicates magnitude of ST. AG, alder 3
(Alnus glutinosa); BP, silver birch (Betula pendula); AH, horse chestnut (Aesculus 4
hippocastanum); FS, beech (Fagus sylvatica); TC, lime (Tilia cordata); QR, oak (Quercus 5
robur); FE, ash (Fraxinus excelsior). The number under the species name is the number of sites. 6
The histograms show the distribution of ST across all species and sites in two different periods 7
and the mean ST and standard deviations (in brackets). The asterisk indicates a significant 8
difference of ST between the two periods at P<0.05. 9
Extended Data Figure 6. Changes of apparent temperature sensitivity of leaf unfolding (ST, 10
advances in days per degree Celsius warming) over time. Same as Fig. 1c, but temporal 11
change of ST with 10-year moving windows from 1980 to 2013. The ST was calculated using 12
simple linear regression. The black line indicates the average across all species, and the grey area 13
indicates one standard deviation either side of the mean. The dotted line indicates the linear 14
regression. 15
Extended Data Figure 7. The differences in climatology over the preseason. The fluctuations 16
in mean daily temperature (left panels) and diurnal variation temperature (Tmax – Tmin, right 17
panels) over the preseason across all sites during the time period 1980-1994 and 1999-2013 in 18
three MAT groups, i.e. (top panels) 6- 8°C, (middle panels) 8-10°C and (bottom panels)10-12°C. 19
The preseason was determined over the period 1980-2013. 20
Extended Data Figure 8. Spatial difference in apparent temperature sensitivity of leaf 21
unfolding (ST, advances in days per degree Celsius warming) reduction. The difference of ST 22
for each species and across all species studied between two time periods, 1999-2014 and 1980-23
1994, at different latitudes (bin: 0.5°) and chilling conditions (bin: two chilling days). The colour 24
scales indicate the differences of ST between the two periods. 25
Extended Data Figure 9. Changes in chilling accumulation and modeled correlation 26
between chilling and apparent temperature sensitivity of leaf unfolding (ST, advances in 27

17
days per degree Celsius warming). (a) Chilling accumulation for each and all species with 15-1
year moving windows from 1980 to 2013. The chilling accumulation was calculated as chilling 2
days when daily temperature was between 0 and 5 °C from 1 November to the average date of 3
leaf unfolding. The black line indicates the average across all species, and the grey area indicates 4
one standard deviation either side of the mean. The dotted line indicates the linear regression. (b) 5
Same as Fig. 2b, but chilling accumulation was calculated as chilling days when daily 6
temperature was below 5°C from 1 November to the average date of leaf unfolding. The asterisks 7
indicate significant differences at P<0.05. (c) The modelled (Unified model) ST under different 8
artificial winter warming conditions. The temperature in winter, defined as the period from the 1 9
November to 31 January, was warmed by +1℃ to +5℃ over the period 1980-2013. The points 10
with most chilling days indicate the real winter temperatures, and each of the other points 11
indicate one winter warming treatment. The lines indicate simple linear regressions. 12
Extended Data Figure 10. Changes in apparent temperature sensitivity of leaf unfolding 13
(ST, advances in days per degree Celsius warming) between years with more or less chilling. 14
ST for years with (a) less chilling and (b) more chilling with a 20-year moving window for 1980-15
2013. For each 20-year series, we divided the 20 years into two groups based on the mean 16
chilling accumulation (Chilling was accumulated when daily temperature within the temperature 17
range between 0°C and 5°C from 1st November to the day of leaf unfolding). The 10 years with 18
chilling higher than the overall mean were defined as more chilling, and the other 10 years were 19
defined as less chilling. The black lines indicate the average across all species, and the grey area 20
indicates one standard deviation either side of the mean. The dotted lines are the linear 21
regressions. (c) Chilling accumulation for years with less chilling (red line) and more chilling 22
(blue line) with a 20-year moving window for 1980-2013. (d) The mean radiation sum over the 23
preseason for years with less chilling (red line) and more chilling (blue line) with a 20-year 24
moving window for 1980-2013. The preseason was determined over the period 1980-2013. 25

1
Supplementary information 1
2
To test the hypothesis that the observed decline in ST is in fact a response to the declining 3
chilling, we applied three commonly used chilling-based phenology models, i.e. the 4
Sequential, Parallel and Unified models, to simulate the leaf unfolding dates. We then 5
calculated the ST using the same method as for the observations. We chose a simulated 6
annealing method to fit the models based on the observation over the period 1980-2013. The 7
details of these three models are described below. In the models, the effects of the forcing and 8
chilling temperatures are accounted for by calculating (daily) rates of forcing (Rf) and chilling 9
(Rc), which are functions of the daily air temperature (T). These functions differ between 10
models. Rf and Rc determine the rates of change of the states of forcing (Sf) and chilling (Sc), 11
respectively: 12
D
tt
ff
f
TRDS1
)()( (1) 13
D
tt
cc
c
TRDS1
)()( (2) 14
where t1f and t1c are the initial days of the forcing and chilling periods, respectively, and D is 15
the day of the year. Leaf unfolding is triggered when Sf reaches a forcing threshold F*, 16
whereas in the Sequential and the Parallel models, the start of quiescence (the forcing period) 17
is triggered when Sc reaches the chilling threshold C*. 18
*)( FDSif f then leaf unfolding induction is completed (3) 19
*)( CDSif c
then dormancy is completed (4) 20
21
Sequential model (SM)32,33
22
SM starts to accumulate warmth units when a sufficient amount of chilling has occurred (Eq. 23
4). In SM, we fixed t1c on 1 November. As in the previous applications of SM, we defined Rc 24
as a triangular function of T32,33
: 25

2
min
min
minopt min
maxmax
opt max
max
( )0
T-T( )
T -T( )
T-T( )
T -T
0 ( )
opt
c
opt
T D Tif
if T T D T
R DT T D Tif
if T D T
(5) 1
where Tmin, Tmax and Topt are the minimum, maximum and optimum temperature for the 2
chilling period. Rf is calculated with a similar sigmoid function as: 3
*
*( )
0
( )
1
c
f
b T cc
if S C
R D a
if S Ce
(6) 4
Parallel model (PM) 32,33,34
5
PM assumes that forcing temperature can affect leaf unfolding even during the chilling. As 6
for SM, we fixed t1c and t1f on 1 November. Rc is calculated as in SM, whereas Rf is calculated 7
with the following equation, a modification of Eq. 6 of SM: 8
0
( )0
0
( )
1
f
b T c
D tif
R D ak
D tife
and *
*
*
1
1
mm c c
c
KifK S S C
k Cif S C
(7) 9
where Km is a model parameter. PM has one more parameter (Km) than SM. 10
11
Unified model(UM)35
12
UM combines features of the other models and merges the equations for Rc and Rf into one 13
sigmoid equation: 14
2( ) ( )
if a and b and c1
if a 0 and b and c 1
C a b c
a T c b T cf b c
R C C C
R F Fe
(D)
(D) (8) 15
where Ca, Cb and Cc are chilling-rate parameters and Fb and Fc are forcing-rate parameters. In 16
UM, t1c is set to be 1 September. The forcing units start to accumulate when a sufficient 17
amount of chilling has occurred (C*), and F* is calculated with an exponential function of Rc 18
from t1c to t2c: 19
2
1
-
*( ) *
tc
c
tc
k R
F D e
(9) 20

3
where k, w and t2c are model parameters. 1
Parameter estimation 2
All three models were fitted using observed leaf unfolding dates for each site and species for 3
the period 1980-2013, for a total of 5,472 (sites*species) parameter estimates. Parameters 4
were adjusted by minimizing the root mean square error (RMSE; Eq. 10) between observed 5
and modelled leaf unfolding dates: 6
√∑
(10)
where Xobs,i is the observed value, Xmod,i is the modelled value of the observation i and n is the 7
number of observations. Following the study of Chuine et al36
, we calibrated the models 8
using a simulated annealling method. The simulated annealling refers to thermodynamic 9
principles where the objective function, here the RMSE, is considered as an energy function 10
of a cooling and crystallizing molten metal. An artificial temperature is introduced and 11
gradually lowered until it reaches a global minimum. At each iteration, the algorithm 12
explores the range of possible states of the system by changing parameter values according to 13
a generalized Metropolis algorithm acceptance probability. Simulated annealling methods are 14
less affected by local minima than gradient methods37
, but the number of local minima of the 15
RMSE function of phenological models is high. We thus performed thousands of global 16
searches with few iterations and random initial parameters followed by a global search with 17
more iterations and starting at the best result yet obtained for each optimization35
. The range 18
of variation for each parameter was prescribed according to previously published results of 19
model optimization35,36,38
. 20
21
References: 22
32 Hänninen, H., Modelling bud dormancy release in trees from cool and temperate 23
regions. Acta For. Fenn 213, 1- 47 (1990). 24
33 Kramer, K., Selecting a model to predict the onset of growth of Fagus-Sylvatica. J. 25
Appl. Ecol. 31, 172-181 (1994). 26

4
34 Landsberg, J.J., Apple fruit bud development and growth - analysis and an empirical 1
model. Ann. Bot. 38, 1013-1023 (1974). 2
35 Chuine, I., A unified model for budburst of trees. J. Theor. Biol. 207, 337–47 (2000). 3
36 Chuine, I., Cour, P. and Rousseau. D. D., Fitting models predicting dates of flowering 4
of temperate-zone trees using simulated annealing. Plant Cell Environ 21, 455–66 5
(1998). 6
37 Tsallis, C., & Stariolo, D.A., Generalized simulated annealing. Physica A 406, 395-7
406 (1996). 8
38 Linkosalo, T, Lappalainen, H.K. and Hari, P., A Comparison of phenological models 9
of leaf bud burst and flowering of boreal trees using independent observations. Tree 10
Physiol. 28, 1873–82 (2008). 11

1
Extended Data Figure 1.

2
Extended Data Figure 2.
3
Extended Data Figure 3.
4
Extended Data Figure 4.
5
Extended Data Figure 5.
aaaa
6
Extended Data Figure 6.
7
Extended Data Figure 7.
8
Extended Data Figure 8.
9
Extended Data Figure 9.
10
Extended Data Figure 10.