decentralized renewable hybrid mini-grids for...
TRANSCRIPT
energies
Article
Decentralized Renewable Hybrid Mini-Grids forSustainable Electrification of the Off-Grid CoastalAreas of Bangladesh
Majbaul Alam 1 and Subhes Bhattacharyya 2,*1 School of Engineering and Sustianable Development, De Montfort University, Leicester LE1 9BH, UK;
[email protected] Institute of Energy and Sustainable Development, De Montfort University, Leicester LE1 9BH, UK* Correspondence: [email protected]; Tel.: +44-116-257-7975
Academic Editor: Josep M. GuerreroReceived: 23 November 2015; Accepted: 21 March 2016; Published: 6 April 2016
Abstract: Lack of access to energy is considered as a serious bottleneck for the socio-economicdevelopment of Bangladesh. Despite earning recognition for promoting solar home systems, most ofthe rural areas and remote islands of the country still remain non-electrified due to very high unit costand low quality of electricity from solar home systems (SHS) coupled with only few hours of restrictedusages in the evening. Considering the resource potential and demand characteristics at the local level,the present study investigates the hybrid renewable mini-grid approach as a possible solution foruniversal electricity access in the country. Using Hybrid Optimisation of Multiple Energy Resources(HOMER) simulation model, the study, covering the whole coastal region of Bangladesh, shows thatit is possible to offer a much better quality electricity for 12 h to 18 h a day for as low as USD 0.29–USD0.31/kWh. Hybrid models suggested in this study can be replicated along the coastal belt and remoteislands to obtain maximum diffusion of this technology and hence universal electrification.
Keywords: hybrid mini-grids; coastal Bangladesh; hybrid optimisation of multiple energy resources(HOMER); off-grid electrification
1. Introduction
The energy poor, at the bottom of the economic pyramid (BOP), are unlikely to get the benefits ofglobalization without having access to the products and services that represent modern day qualitystandards. Per capita electricity consumption in Bangladesh (259 kWh) is one of the lowest in theworld [1]. Currently, the actual generation capacity is 7200 MW, although the installed generationcapacity is 9000 MW [2]. According to the National Energy Policy of Bangladesh, the projected demandof electricity in 2020 is 17,580 MW [3]. A national grid covers mostly the urban areas with largeindustrial and domestic loads leaving the rural areas with either very poor or no supply. Moreover, asthe country is crisscrossed by numerous rivers and the population distribution in rural areas is uneven,the grid electrification in many parts of Bangladesh is both difficult and expensive. Only about 40% ofrural households have access to grid electricity [4] and the supply is very unreliable.
The coastal areas of Bangladesh (Figure 1) including nineteen administrative districts featuringapproximately 270 km coastline are some of the most deprived parts of the country with adisproportionately low level of supply of electricity. Many remote coastal villages and all islands off thecoast of Bay of Bengal do not have any grid electricity supply. To improve the rural electrification rateBangladesh government has been trying to implement renewable energy resources and technologies.The objective of its “final renewable energy policy 2008” [5] is to harness the potential of renewableenergy resources and dissemination of technologies especially in the rural areas by encouraging and
Energies 2016, 9, 268; doi:10.3390/en9040268 www.mdpi.com/journal/energies
Energies 2016, 9, 268 2 of 16
facilitating both public and private sector investment, hence to promote clean energy with a set targetof achieving ten percent of total energy demand from the renewable sources by 2020. Through thispolicy, government is committed to formulate the way out to attract huge investment in renewableenergy projects to substitute non-renewable energy supplies and scale up contributions of existingrenewable energy based electricity productions.
Energies 2016, 9, 268 2 of 16
the potential of renewable energy resources and dissemination of technologies especially in the rural
areas by encouraging and facilitating both public and private sector investment, hence to promote
clean energy with a set target of achieving ten percent of total energy demand from the renewable
sources by 2020. Through this policy, government is committed to formulate the way out to attract
huge investment in renewable energy projects to substitute non-renewable energy supplies and
scale up contributions of existing renewable energy based electricity productions.
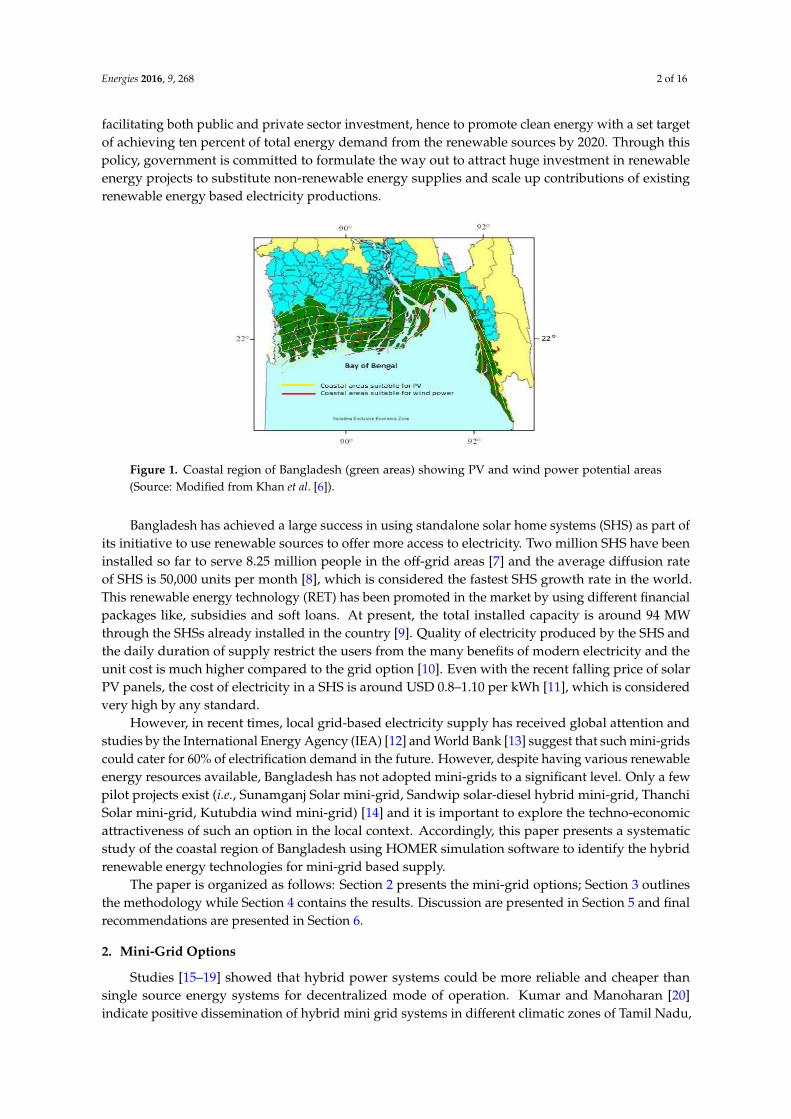
Figure 1. Coastal region of Bangladesh (green areas) showing PV and wind power potential areas
(Source: Modified from Khan et al. [6]).
Bangladesh has achieved a large success in using standalone solar home systems (SHS) as part
of its initiative to use renewable sources to offer more access to electricity. Two million SHS have
been installed so far to serve 8.25 million people in the off-grid areas [7] and the average diffusion
rate of SHS is 50,000 units per month [8], which is considered the fastest SHS growth rate in the
world. This renewable energy technology (RET) has been promoted in the market by using different
financial packages like, subsidies and soft loans. At present, the total installed capacity is around 94
MW through the SHSs already installed in the country [9]. Quality of electricity produced by the
SHS and the daily duration of supply restrict the users from the many benefits of modern electricity
and the unit cost is much higher compared to the grid option [10]. Even with the recent falling price
of solar PV panels, the cost of electricity in a SHS is around USD 0.8–1.10 per kWh [11], which is
considered very high by any standard.
However, in recent times, local grid-based electricity supply has received global attention and
studies by the International Energy Agency (IEA) [12] and World Bank [13] suggest that such
mini-grids could cater for 60% of electrification demand in the future. However, despite having
various renewable energy resources available, Bangladesh has not adopted mini-grids to a
significant level. Only a few pilot projects exist (i.e., Sunamganj Solar mini-grid, Sandwip solar-diesel
hybrid mini-grid, Thanchi Solar mini-grid, Kutubdia wind mini-grid) [14] and it is important to
explore the techno-economic attractiveness of such an option in the local context. Accordingly, this
paper presents a systematic study of the coastal region of Bangladesh using HOMER simulation
software to identify the hybrid renewable energy technologies for mini-grid based supply.
The paper is organized as follows: Section 2 presents the mini-grid options; Section 3 outlines
the methodology while Section 4 contains the results. Discussion are presented in Section 5 and final
recommendations are presented in Section 6.
2. Mini-Grid Options
Studies [15–19] showed that hybrid power systems could be more reliable and cheaper than
single source energy systems for decentralized mode of operation. Kumar and Manoharan [20]
indicate positive dissemination of hybrid mini grid systems in different climatic zones of Tamil
Nadu, India where existing power supply through the main grid is unstable. Study conducted for
Figure 1. Coastal region of Bangladesh (green areas) showing PV and wind power potential areas(Source: Modified from Khan et al. [6]).
Bangladesh has achieved a large success in using standalone solar home systems (SHS) as part ofits initiative to use renewable sources to offer more access to electricity. Two million SHS have beeninstalled so far to serve 8.25 million people in the off-grid areas [7] and the average diffusion rateof SHS is 50,000 units per month [8], which is considered the fastest SHS growth rate in the world.This renewable energy technology (RET) has been promoted in the market by using different financialpackages like, subsidies and soft loans. At present, the total installed capacity is around 94 MWthrough the SHSs already installed in the country [9]. Quality of electricity produced by the SHS andthe daily duration of supply restrict the users from the many benefits of modern electricity and theunit cost is much higher compared to the grid option [10]. Even with the recent falling price of solarPV panels, the cost of electricity in a SHS is around USD 0.8–1.10 per kWh [11], which is consideredvery high by any standard.
However, in recent times, local grid-based electricity supply has received global attention andstudies by the International Energy Agency (IEA) [12] and World Bank [13] suggest that such mini-gridscould cater for 60% of electrification demand in the future. However, despite having various renewableenergy resources available, Bangladesh has not adopted mini-grids to a significant level. Only a fewpilot projects exist (i.e., Sunamganj Solar mini-grid, Sandwip solar-diesel hybrid mini-grid, ThanchiSolar mini-grid, Kutubdia wind mini-grid) [14] and it is important to explore the techno-economicattractiveness of such an option in the local context. Accordingly, this paper presents a systematicstudy of the coastal region of Bangladesh using HOMER simulation software to identify the hybridrenewable energy technologies for mini-grid based supply.
The paper is organized as follows: Section 2 presents the mini-grid options; Section 3 outlinesthe methodology while Section 4 contains the results. Discussion are presented in Section 5 and finalrecommendations are presented in Section 6.
2. Mini-Grid Options
Studies [15–19] showed that hybrid power systems could be more reliable and cheaper thansingle source energy systems for decentralized mode of operation. Kumar and Manoharan [20]indicate positive dissemination of hybrid mini grid systems in different climatic zones of Tamil Nadu,
Energies 2016, 9, 268 3 of 16
India where existing power supply through the main grid is unstable. Study conducted for the ruraland semi-urban northern part of Nigeria suggests that decentralized hybrid systems are a betterand cheaper option in long run compared to diesel generators [21]. The foreseeable limitations andpossibilities associated with the hybrid mini-grids have been highlighted in different literatures [22–31].Only a few works [32–37] exist in this field in Bangladesh and the limitations and possibilities of hybridmini grids are still to be explored.
Given that local resources, enabling policy environment and village-level information are essentialto any analysis of mini-grid based electrification, these are considered below for the coastal areasof Bangladesh.
2.1. Renewable Resources
The global horizontal irradiance (GHI), based on the measured data, theoretical model deriveddata and satellite image derived data, shows that the average solar global radiation in Bangladesh isaround 4.255 kWh/m2/day [38]. Based on solar energy resources over the country it can be said thatmost of the solar energy extracting systems can be used for power generation. To use wind energyfor power generation in Bangladesh, the areas are limited mostly to the coastal regions, i.e., Cox’sBazar, Teknaf, coastal belt of Chittagong, Saint Martin Island, Kutubdia, Moheskhali, lower parts ofBarisal, Bhola, Bagherhat, Noakhali and other islands like Hatia and Swandip (Figure 1). There is onlya little potential of wind energy resources at a very high altitude in the north of the country. The southand southwesterly wind blows over Bangladesh from March to September with a monthly speed upto 6 m/s [39]. The coastline and the islands along the coastline offer suitable conditions for windpower generation.
2.2. Policy Support
The draft renewable energy policy (2002) of Bangladesh [40] and the current policy [5] have clearlydeveloped an Investment and Fiscal Incentive guideline, where Sustainable Energy DevelopmentAuthority (SEDA) formulates fiscal incentives and considers subsidies for the investments in therenewable energy projects and assists investors in locating the project(s) and acquiring land for thispurpose. Moreover, the Remote Area Power Supply System (RAPSS) policy offers connection feesubsidy for increased customer penetration (with connected load less than 300 watt) for a maximumperiod of seven years and additional subsidized loan to achieve competitive tariff to the investors in thedistributed renewable mini-grids. Infrastructure Development Company Limited (IDCOL) facilitatesthe techno-economic matters for the investors in the remote area renewable energy projects. IDCOL hascreated a subsidy fund to be invested in decentralized hybrid mini-grids and up to maximum of 60%capital subsidies can be offered in this field.
2.3. Mini-Grid Implementation
Average number of households in rural Bangladesh is around 200 per village [41], which is suitablefor micro/mini grid operations [42]. Bangladesh can take inspiration from the example of India wheredensely populated remote areas are served by decentralized renewable energy systems providingelectricity to households via micro-grids which have been considered one of the most economicallyfeasible options [43]. With the support from the existing renewable energy policy, people of the off-gridareas of the coastal belt can be provided with reliable electricity using the renewable mini-grid options.However, the major challenges in the implementation of decentralized renewable hybrid mini-grids incoastal rural areas and islands include restricted consumption pattern (time and load) by the end users,uncertainty of seasonal demand, expensive storage, different operation-management arrangements forindividual micro-grids, lack of expert manpower, security of the distribution network and restrictingloss and theft.
Energies 2016, 9, 268 4 of 16
3. Methodology
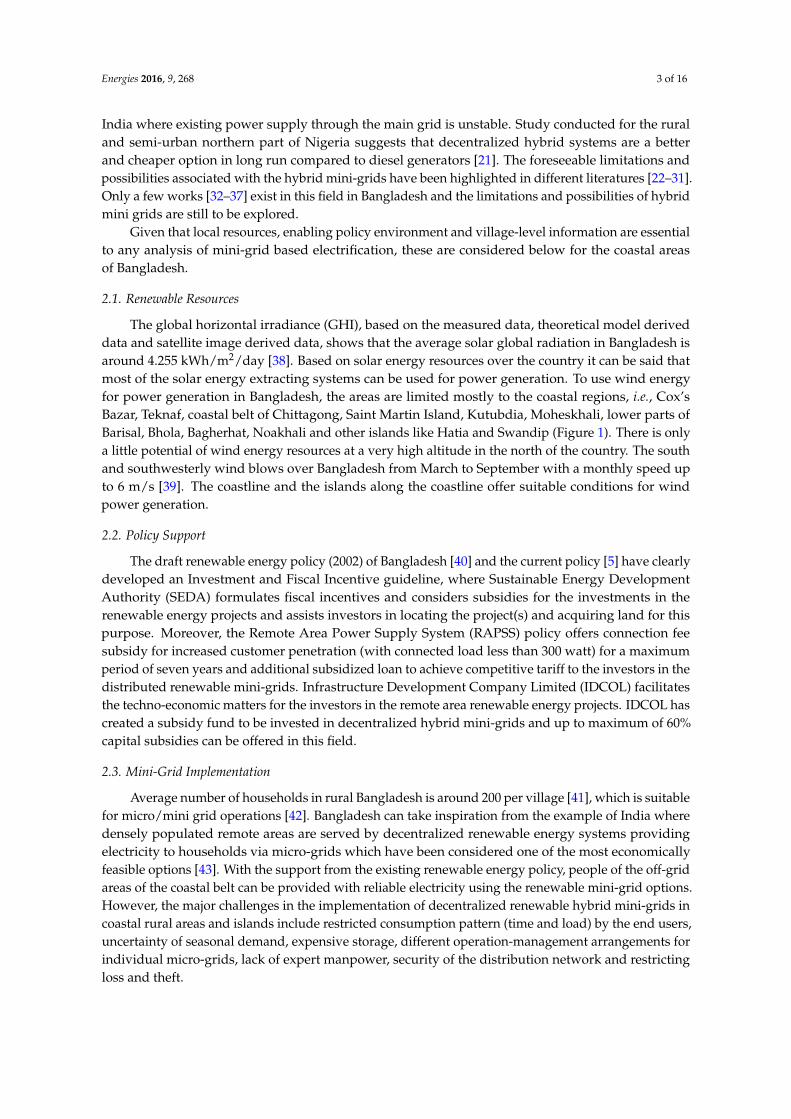
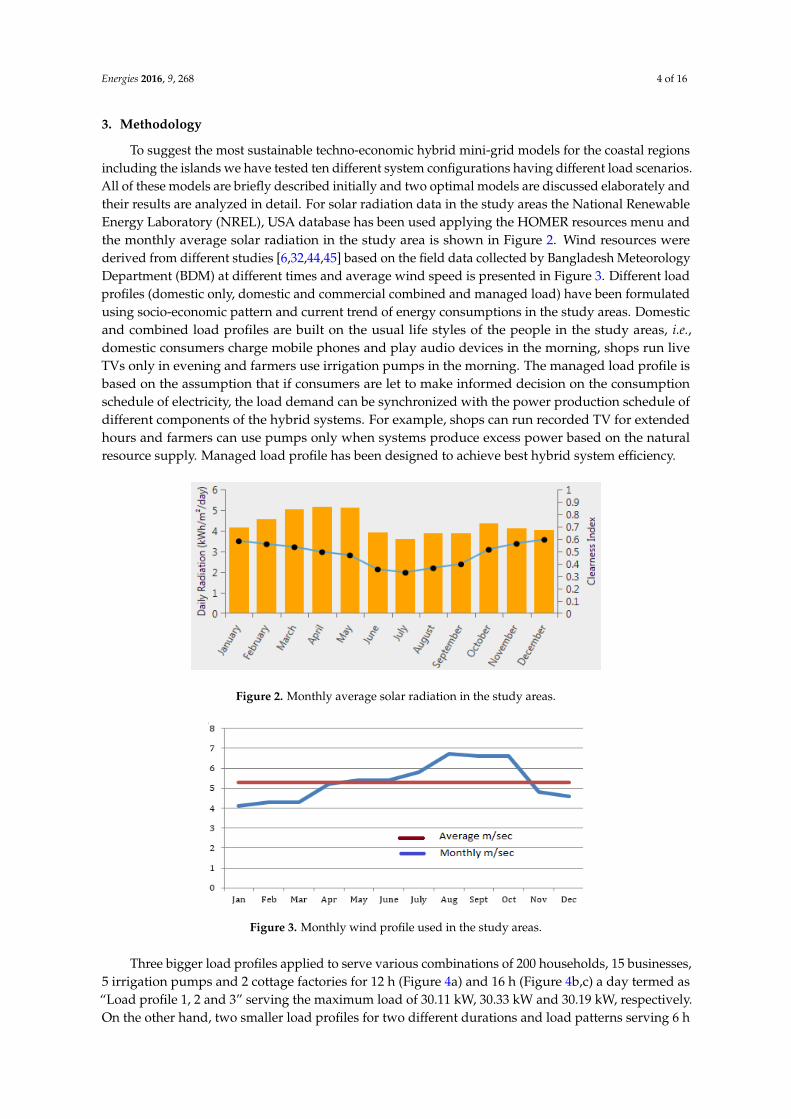
To suggest the most sustainable techno-economic hybrid mini-grid models for the coastal regionsincluding the islands we have tested ten different system configurations having different load scenarios.All of these models are briefly described initially and two optimal models are discussed elaborately andtheir results are analyzed in detail. For solar radiation data in the study areas the National RenewableEnergy Laboratory (NREL), USA database has been used applying the HOMER resources menu andthe monthly average solar radiation in the study area is shown in Figure 2. Wind resources werederived from different studies [6,32,44,45] based on the field data collected by Bangladesh MeteorologyDepartment (BDM) at different times and average wind speed is presented in Figure 3. Different loadprofiles (domestic only, domestic and commercial combined and managed load) have been formulatedusing socio-economic pattern and current trend of energy consumptions in the study areas. Domesticand combined load profiles are built on the usual life styles of the people in the study areas, i.e.,domestic consumers charge mobile phones and play audio devices in the morning, shops run liveTVs only in evening and farmers use irrigation pumps in the morning. The managed load profile isbased on the assumption that if consumers are let to make informed decision on the consumptionschedule of electricity, the load demand can be synchronized with the power production schedule ofdifferent components of the hybrid systems. For example, shops can run recorded TV for extendedhours and farmers can use pumps only when systems produce excess power based on the naturalresource supply. Managed load profile has been designed to achieve best hybrid system efficiency.
Energies 2016, 9, 268 4 of 16
3. Methodology
To suggest the most sustainable techno-economic hybrid mini-grid models for the coastal
regions including the islands we have tested ten different system configurations having different
load scenarios. All of these models are briefly described initially and two optimal models are
discussed elaborately and their results are analyzed in detail. For solar radiation data in the study
areas the National Renewable Energy Laboratory (NREL), USA database has been used applying
the HOMER resources menu and the monthly average solar radiation in the study area is shown in
Figure 2. Wind resources were derived from different studies [6,32,44,45] based on the field data
collected by Bangladesh Meteorology Department (BDM) at different times and average wind
speed is presented in Figure 3. Different load profiles (domestic only, domestic and commercial
combined and managed load) have been formulated using socio-economic pattern and current
trend of energy consumptions in the study areas. Domestic and combined load profiles are built on
the usual life styles of the people in the study areas, i.e., domestic consumers charge mobile phones
and play audio devices in the morning, shops run live TVs only in evening and farmers use
irrigation pumps in the morning. The managed load profile is based on the assumption that if
consumers are let to make informed decision on the consumption schedule of electricity, the load
demand can be synchronized with the power production schedule of different components of the
hybrid systems. For example, shops can run recorded TV for extended hours and farmers can use
pumps only when systems produce excess power based on the natural resource supply. Managed
load profile has been designed to achieve best hybrid system efficiency.
Figure 2. Monthly average solar radiation in the study areas.
Figure 3. Monthly wind profile used in the study areas.
Three bigger load profiles applied to serve various combinations of 200 households, 15
businesses, 5 irrigation pumps and 2 cottage factories for 12 h (Figure 4a) and 16 h (Figure 4b,c) a day
termed as “Load profile 1, 2 and 3” serving the maximum load of 30.11 kW, 30.33 kW and 30.19 kW,
respectively. On the other hand, two smaller load profiles for two different durations and load
patterns serving 6 h domestic load only (Figure 4d) and 15 h combined domestic and commercial
Figure 2. Monthly average solar radiation in the study areas.
Energies 2016, 9, 268 4 of 16
3. Methodology
To suggest the most sustainable techno-economic hybrid mini-grid models for the coastal
regions including the islands we have tested ten different system configurations having different
load scenarios. All of these models are briefly described initially and two optimal models are
discussed elaborately and their results are analyzed in detail. For solar radiation data in the study
areas the National Renewable Energy Laboratory (NREL), USA database has been used applying
the HOMER resources menu and the monthly average solar radiation in the study area is shown in
Figure 2. Wind resources were derived from different studies [6,32,44,45] based on the field data
collected by Bangladesh Meteorology Department (BDM) at different times and average wind
speed is presented in Figure 3. Different load profiles (domestic only, domestic and commercial
combined and managed load) have been formulated using socio-economic pattern and current
trend of energy consumptions in the study areas. Domestic and combined load profiles are built on
the usual life styles of the people in the study areas, i.e., domestic consumers charge mobile phones
and play audio devices in the morning, shops run live TVs only in evening and farmers use
irrigation pumps in the morning. The managed load profile is based on the assumption that if
consumers are let to make informed decision on the consumption schedule of electricity, the load
demand can be synchronized with the power production schedule of different components of the
hybrid systems. For example, shops can run recorded TV for extended hours and farmers can use
pumps only when systems produce excess power based on the natural resource supply. Managed
load profile has been designed to achieve best hybrid system efficiency.
Figure 2. Monthly average solar radiation in the study areas.
Figure 3. Monthly wind profile used in the study areas.
Three bigger load profiles applied to serve various combinations of 200 households, 15
businesses, 5 irrigation pumps and 2 cottage factories for 12 h (Figure 4a) and 16 h (Figure 4b,c) a day
termed as “Load profile 1, 2 and 3” serving the maximum load of 30.11 kW, 30.33 kW and 30.19 kW,
respectively. On the other hand, two smaller load profiles for two different durations and load
patterns serving 6 h domestic load only (Figure 4d) and 15 h combined domestic and commercial
Figure 3. Monthly wind profile used in the study areas.
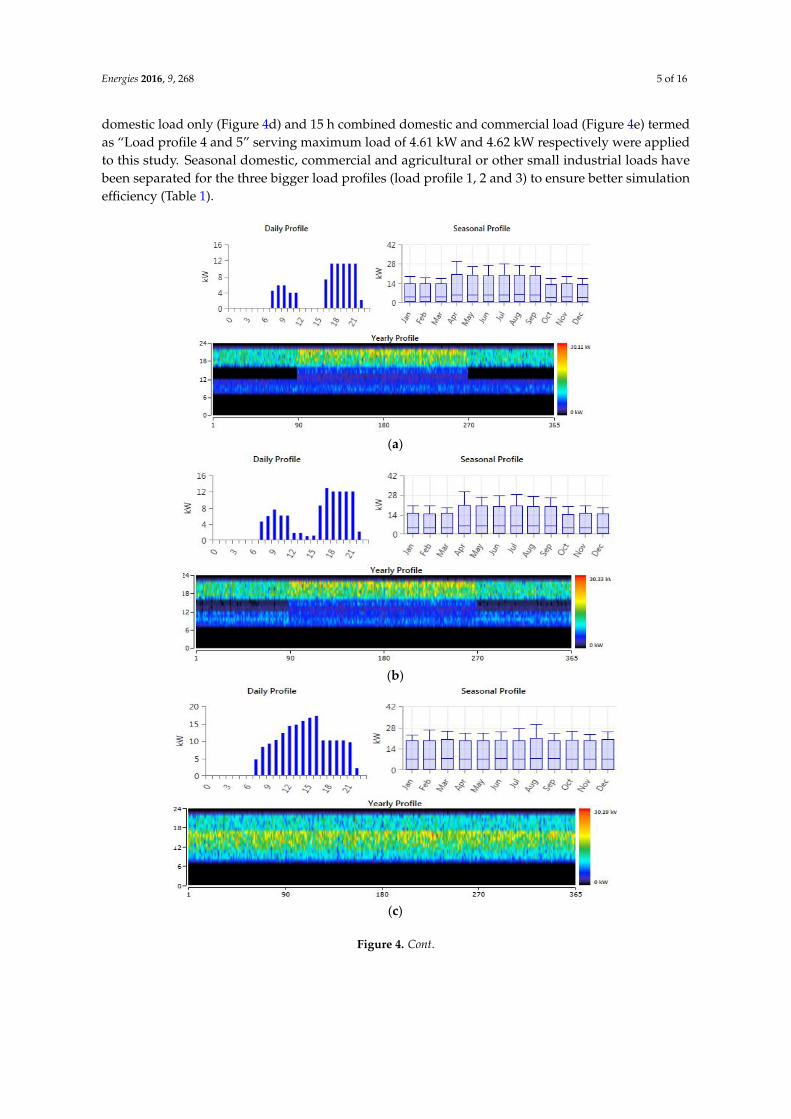
Three bigger load profiles applied to serve various combinations of 200 households, 15 businesses,5 irrigation pumps and 2 cottage factories for 12 h (Figure 4a) and 16 h (Figure 4b,c) a day termed as“Load profile 1, 2 and 3” serving the maximum load of 30.11 kW, 30.33 kW and 30.19 kW, respectively.On the other hand, two smaller load profiles for two different durations and load patterns serving 6 h
Energies 2016, 9, 268 5 of 16
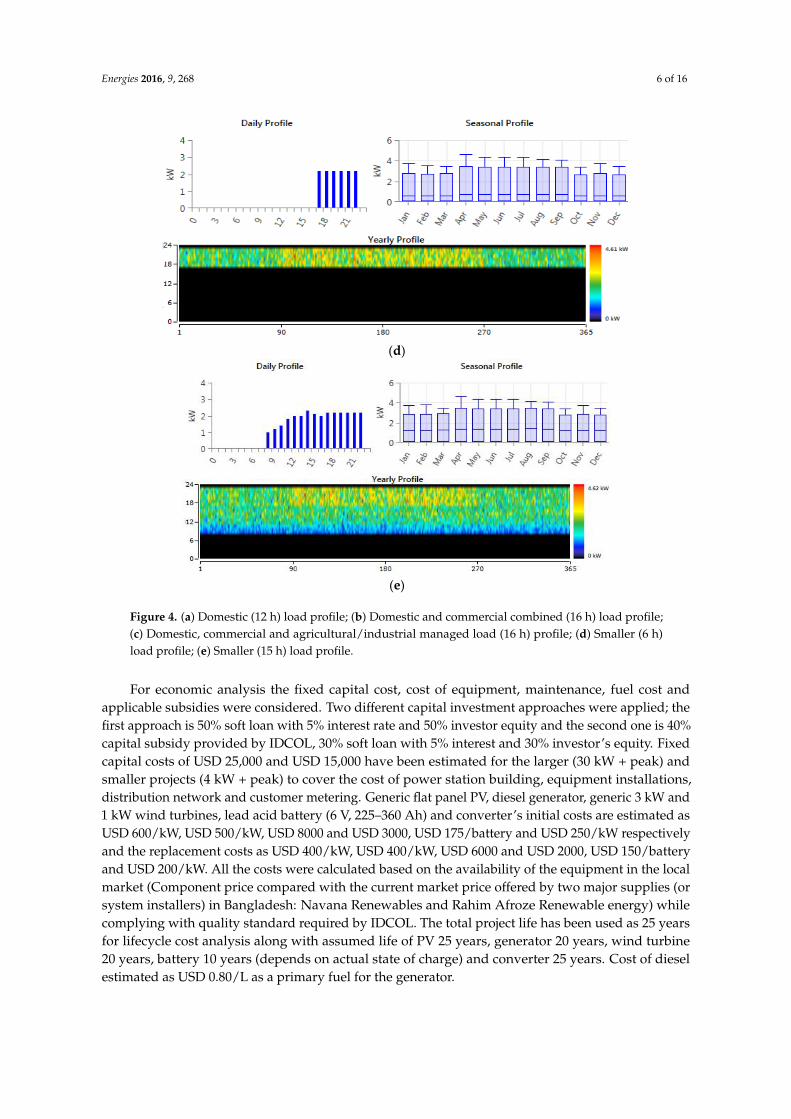
domestic load only (Figure 4d) and 15 h combined domestic and commercial load (Figure 4e) termedas “Load profile 4 and 5” serving maximum load of 4.61 kW and 4.62 kW respectively were appliedto this study. Seasonal domestic, commercial and agricultural or other small industrial loads havebeen separated for the three bigger load profiles (load profile 1, 2 and 3) to ensure better simulationefficiency (Table 1).
Energies 2016, 9, 268 5 of 16
load (Figure 4e) termed as “Load profile 4 and 5” serving maximum load of 4.61 kW and 4.62 kW
respectively were applied to this study. Seasonal domestic, commercial and agricultural or other
small industrial loads have been separated for the three bigger load profiles (load profile 1, 2 and 3)
to ensure better simulation efficiency (Table 1).
(a)
(b)
(c)
Figure 4. Cont. Figure 4. Cont.
Energies 2016, 9, 268 6 of 16Energies 2016, 9, 268 6 of 16
(d)
(e)
Figure 4. (a) Domestic (12 h) load profile; (b) Domestic and commercial combined (16 h) load profile;
(c) Domestic, commercial and agricultural/industrial managed load (16 h) profile; (d) Smaller (6 h)
load profile; (e) Smaller (15 h) load profile.
For economic analysis the fixed capital cost, cost of equipment, maintenance, fuel cost and
applicable subsidies were considered. Two different capital investment approaches were applied;
the first approach is 50% soft loan with 5% interest rate and 50% investor equity and the second one
is 40% capital subsidy provided by IDCOL, 30% soft loan with 5% interest and 30% investor’s equity.
Fixed capital costs of USD 25,000 and USD 15,000 have been estimated for the larger (30 kW + peak)
and smaller projects (4 kW + peak) to cover the cost of power station building, equipment
installations, distribution network and customer metering. Generic flat panel PV, diesel generator,
generic 3 kW and 1 kW wind turbines, lead acid battery (6 V, 225–360 Ah) and converter’s initial
costs are estimated as USD 600/kW, USD 500/kW, USD 8000 and USD 3000, USD 175/battery and
USD 250/kW respectively and the replacement costs as USD 400/kW, USD 400/kW, USD 6000 and
USD 2000, USD 150/battery and USD 200/kW. All the costs were calculated based on the availability
of the equipment in the local market (Component price compared with the current market price
offered by two major supplies (or system installers) in Bangladesh: Navana Renewables and Rahim
Afroze Renewable energy) while complying with quality standard required by IDCOL. The total
project life has been used as 25 years for lifecycle cost analysis along with assumed life of PV 25
years, generator 20 years, wind turbine 20 years, battery 10 years (depends on actual state of charge)
and converter 25 years. Cost of diesel estimated as USD 0.80/L as a primary fuel for the generator.
Figure 4. (a) Domestic (12 h) load profile; (b) Domestic and commercial combined (16 h) load profile;(c) Domestic, commercial and agricultural/industrial managed load (16 h) profile; (d) Smaller (6 h)load profile; (e) Smaller (15 h) load profile.
For economic analysis the fixed capital cost, cost of equipment, maintenance, fuel cost andapplicable subsidies were considered. Two different capital investment approaches were applied; thefirst approach is 50% soft loan with 5% interest rate and 50% investor equity and the second one is 40%capital subsidy provided by IDCOL, 30% soft loan with 5% interest and 30% investor’s equity. Fixedcapital costs of USD 25,000 and USD 15,000 have been estimated for the larger (30 kW + peak) andsmaller projects (4 kW + peak) to cover the cost of power station building, equipment installations,distribution network and customer metering. Generic flat panel PV, diesel generator, generic 3 kW and1 kW wind turbines, lead acid battery (6 V, 225–360 Ah) and converter’s initial costs are estimated asUSD 600/kW, USD 500/kW, USD 8000 and USD 3000, USD 175/battery and USD 250/kW respectivelyand the replacement costs as USD 400/kW, USD 400/kW, USD 6000 and USD 2000, USD 150/batteryand USD 200/kW. All the costs were calculated based on the availability of the equipment in the localmarket (Component price compared with the current market price offered by two major supplies (orsystem installers) in Bangladesh: Navana Renewables and Rahim Afroze Renewable energy) whilecomplying with quality standard required by IDCOL. The total project life has been used as 25 yearsfor lifecycle cost analysis along with assumed life of PV 25 years, generator 20 years, wind turbine20 years, battery 10 years (depends on actual state of charge) and converter 25 years. Cost of dieselestimated as USD 0.80/L as a primary fuel for the generator.

Energies 2016, 9, 268 7 of 16
Table 1. Hourly load profile (April–September and October–March).
Hourly Load(kW) 07–08 a.m. 08–09 a.m. 09–10 a.m. 10–11 a.m. 11–12 p.m. 12–01 p.m. 01–02 p.m. 02–03 p.m. 03–04 p.m. 04–05 p.m. 05–06 p.m. 06–07 p.m. 07–08 p.m. 08–09 p.m. 09–10 p.m. 10–11 p.m.
BULB0.5 0.5 - - - - - - - - - - - - - - - - - - 4.0 +
0.34.0 +0.32
4.0 +0.3
4.0 +0.32
4.0 +0.3
4.0 +0.32
4.0 +0.3
4.0 +0.32
4.0 +0.3
4.0 +0.32 0.3 0.3
April–September
October–March
RADIO3.5 0.35 4.0 +
0.204.0 +0.20
4.0 +0.20
4.0 +0.20
4.0 +0.20
4.0 +0.40
4.0 +0.20
4.0 +0.40 0.20 0.20 0.20 0.20 0.20 0.20 0.20 0.20 2.4 +
0.362.4 +0.36
2.4 +0.36
2.4 +0.36
2.4 +0.36
2.4 +0.36
2.4 +0.36
2.4 +0.36
2.4 +0.36
2.4 +0.36
2.4 +0.36
2.4 +0.36
- -April–September
October–March
MOBILE0.5 0.5 1.7 1.70 +
1.101.7 +0.22
1.70 +1.10 0.22 0.12 0.22 0.12 0.12 0.12 0.12 0.12 0.10 0.12 0.10 - - - - - - - - - - 0.08 - 0.08 - -
April–September
October–March
FAN- - - - - - - - - 0.24 - 3.20 +
0.24- 3.20 +
0.24- 5.60 - 5.60 - 0.24 - 2.40 +
0.24- 3.20 +
0.24- 3.20 +
0.24- 5.6 - 5.6 - -
April–September
October–March
TV- - - - - - - - - - - - - - - - 0.12 - 4.8 +
0.244.8 +0.12
4.8 +0.24
4.8 +0.24
4.8 +0.24
4.8 +0.24
4.8 +0.24
4.8 +0.24
4.8 +0.24
4.8 +0.24
4.8 +0.24
4.8 +0.24 1.8 -
April–September
October–March
PUMP- - - - 1.50 - 1.50 - 1.50 - 1.50 - 1.50 - 0.75 - 0.75 - 0.75 - 0.75 - - - - - - - - - - -
April–September
October–March
Domestic Load, CommercialL̃oad, Agricultural Load (kW)
Energies 2016, 9, 268 8 of 16
The “Hybrid Optimization Model for Electric Renewables” (HOMER) [46] micro-grid designingsoftware (pro version) has been used in this study to design the hybrid systems configuration consistingdifferent components, i.e., solar PV, wind turbine, diesel generator and storage devices. This softwarehas successfully been used around the world by many researchers [37,47–50]. HOMER performs threeprincipal tasks (simulation, optimization and sensitivity analysis) while suggesting the suitable systemdesigns. HOMER suggests the best optimized model design for the given specific load, resources,economic inputs, system control features, constraints and sensitivity variables. However, it alsosuggests the lifecycle cost of the system as the total net present cost (NPC). This single value includesall costs and revenues that occur within the project lifetime, having future cash flows discounted tothe present. Although the levelized cost of energy (LCOE) is often a convenient metric with which tocompare the costs of different systems, HOMER uses the total NPC instead as its primary economicfigure of merit. In its optimization process, HOMER ranks the system configurations according to NPCrather than levelized cost of energy.
HOMER uses the following equation to calculate the total net present cost:
CNPC “Cann,tot
CRF`
i, Rproj˘ (1)
where, Cann,tot is the total annualized cost, i the annual real interest rate (the discount rate), Rproj theproject lifetime, and CRF (i,N) is the capital recovery factor, given by the equation:
CRFpi, Nq “i p1` iqN
p1` iqN ´ 1(2)
where, i is the annual real interest rate and N is the number of years. HOMER uses the followingequation to calculate the levelized cost of energy (COE):
COE “Cann,tot
Eprim ` Edef ` Egrid,sales(3)
where, Cann,tot is the total annualized cost, Eprim and Edef are the total amounts of primary anddeferrable load, respectively, that the system serves per year, and Egrid;sales is the amount of energysold to the grid per year (for this study Egrid;sales value is zero as systems considered here are not gridconnected or ready to grid connect). The levelized cost of energy is therefore the average cost perkWh of useful electrical energy produced by the system but not the amount of energy utilized by theend users.
4. Results
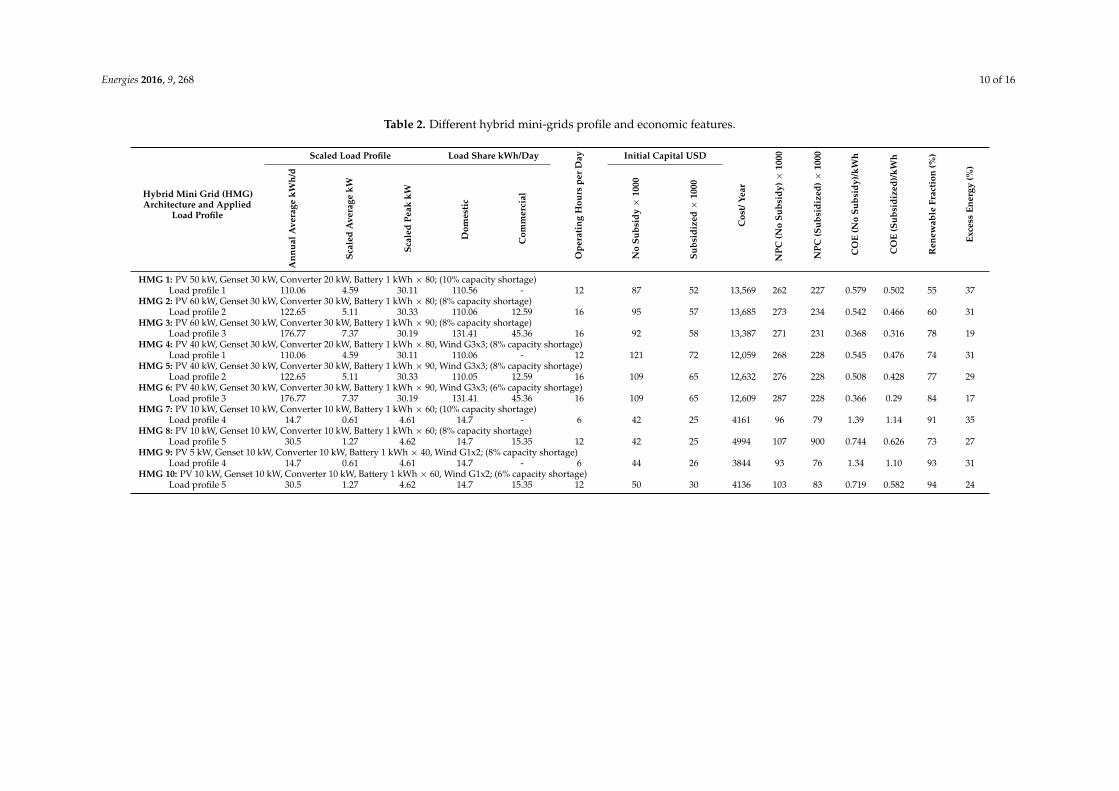
Homer analyzed around 9216 simulations for each of the ten different load profiles and fordifferent hybrid system configurations having various sensitivity variables and economic constrains(i.e., capacity shortage, battery life, fuel usages, interest rate, capital subsidy, excess energy) andpresents around 65 feasible models. The optimal Hybrid Mini-Grid (HMG) system configurationsfor designed load profile 1, 2, 3, 4 and 5 suggested by HOMER are presented in detail in Table 2.For load profile 1, where only domestic load (110.06 kWh/day) is applied, the proposed HMG 1 and 4present the highest unit cost of electricity between USD 0.579–USD 0.476 for no capital subsidy and40% capital subsidy, respectively. While the commercial load of 12.593 kWh/day added to the regulardomestic load representing “load profile 2” for the current study the HMG 2 and 5 present the costof electricity as USD 0.542–USD 0.508 and USD 0.466–USD 0.428 for no subsidy and 40% subsidizedcapital investment. However, applying the managed load profile with extended commercial andsmall industrial load of 45.358 kWh/day the lowest unit COE of USD 0.368–USD 0.366 and USD0.316–USD 0.29 achieved through HMG 3 and 6 using no subsidy and 40% subsidy, respectively. By
Energies 2016, 9, 268 9 of 16
using managed load profile HMG 6 and 3 produce only 17% and 19% of excess electricity through outthe year in compare to 37% and 35% in HMG 1 and 7, respectively.
The HMG 7, 8, 9 and 10 with relatively much smaller load (load profiles 4 and 5) present theCOE very high in comparison to the bigger load profiles studied. Different system configurations(HMG 7 and 8) operating only 6 h in the evening serving 14.7 kWh/day represent COE as high as USD1.39–USD 1.34 for no capital subsidy. However, the same HMGs serving the same load profile with40% capital subsidy supply electricity for USD 1.14–USD 1.10. HMG 8 and 10 with different systemconfigurations applying relatively higher combined load of 30.5 kWh/day over 15 h a day deliverelectricity at a lower price of USD 0.582–USD 0.626/kWh.
Capital subsidy used in this study (40%), showed significant reduction in COE between USD0.13–USD 0.25/kWh in cases of HMGs with very small loads (HMG7–10, Table 2). On the other hand,same amount of subsidy applied on systems with relatively bigger loads (HMG 1–6; Table 2) reducesthe COE ranging from USD 0.05–USD 0.08/kWh.
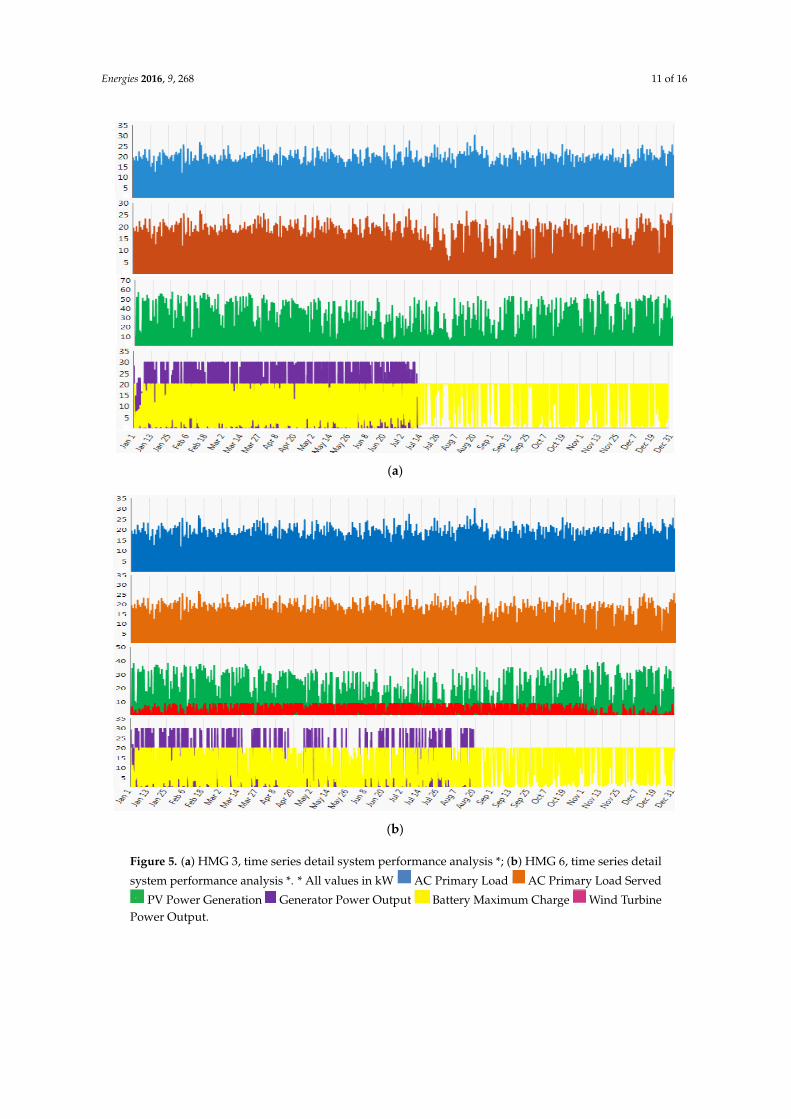
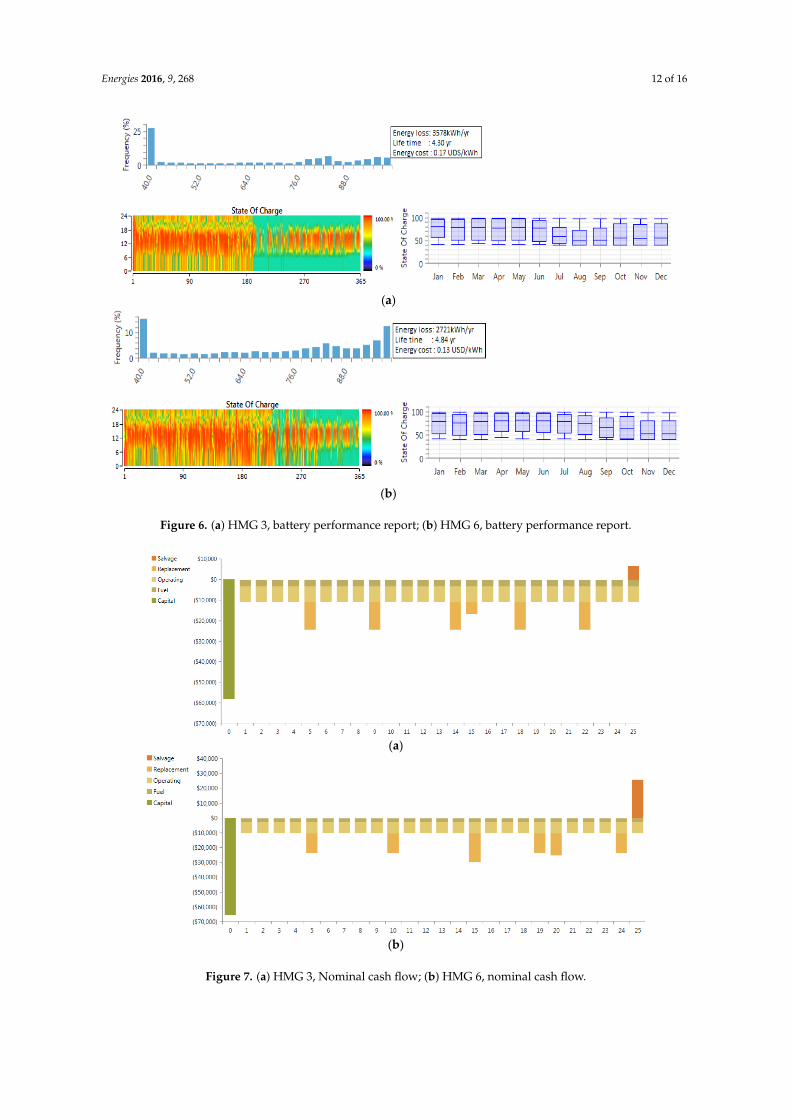
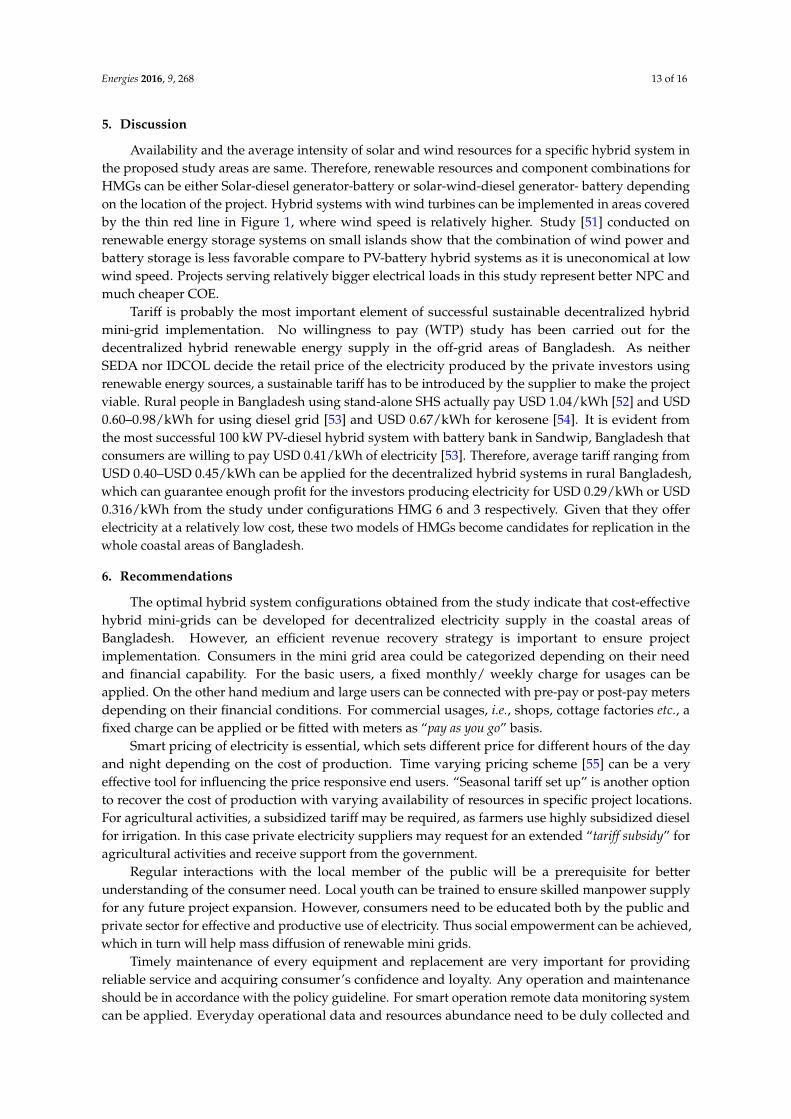
The optimal hybrid systems identified in this study based on the net present cost and COE areHMG 3 and HMG 6 both serving the managed load profile. A detailed time series analysis of thesetwo hybrid systems (Figure 5a,b) indicates clear harmony between primary AC load demand andload served. Capacity shortage is smaller in HMG 6 (6%) than in HMG 3 (8%) as the gap between theload demand and combined power served by different components is very marginal. HMG 6 showssteady performance by all of its components, especially power produced by the wind turbine duringthe months of August to November, thereby reducing the dependency on generator. Moreover, thesynchronized maximum charge state increases the battery life and hence reduces the cost of electricity(Figure 6a,b). The maximum battery life of 4.30 years and 4.84 years achieved in HMG 3 and HMG 6accordingly. On the other hand equal converter lifetime (8.5 years) was observed for both the hybridsystems. Analyzing the nominal cash flow between two optimal hybrid systems, HMG 3 and HMG 6(Figure 7a,b) it is clear that HMG 6 offers the best cash flow throughout the project life.
Energies 2016, 9, 268 10 of 16
Table 2. Different hybrid mini-grids profile and economic features.
Hybrid Mini Grid (HMG)Architecture and Applied
Load Profile
Scaled Load Profile Load Share kWh/Day
Ope
rati
ngH
ours
per
Day Initial Capital USD
Cos
t/Ye
ar
NPC
(No
Subs
idy)
ˆ10
00
NPC
(Sub
sidi
zed)
ˆ10
00
CO
E(N
oSu
bsid
y)/k
Wh
CO
E(S
ubsi
dize
d)/k
Wh
Ren
ewab
leFr
acti
on(%
)
Exce
ssEn
ergy
(%)
Ann
ualA
vera
gekW
h/d
Scal
edA
vera
gekW
Scal
edPe
akkW
Dom
esti
c
Com
mer
cial
No
Subs
idy
ˆ10
00
Subs
idiz
edˆ
1000
HMG 1: PV 50 kW, Genset 30 kW, Converter 20 kW, Battery 1 kWh ˆ 80; (10% capacity shortage)Load profile 1 110.06 4.59 30.11 110.56 - 12 87 52 13,569 262 227 0.579 0.502 55 37
HMG 2: PV 60 kW, Genset 30 kW, Converter 30 kW, Battery 1 kWh ˆ 80; (8% capacity shortage)Load profile 2 122.65 5.11 30.33 110.06 12.59 16 95 57 13,685 273 234 0.542 0.466 60 31
HMG 3: PV 60 kW, Genset 30 kW, Converter 30 kW, Battery 1 kWh ˆ 90; (8% capacity shortage)Load profile 3 176.77 7.37 30.19 131.41 45.36 16 92 58 13,387 271 231 0.368 0.316 78 19
HMG 4: PV 40 kW, Genset 30 kW, Converter 20 kW, Battery 1 kWh ˆ 80, Wind G3x3; (8% capacity shortage)Load profile 1 110.06 4.59 30.11 110.06 - 12 121 72 12,059 268 228 0.545 0.476 74 31
HMG 5: PV 40 kW, Genset 30 kW, Converter 30 kW, Battery 1 kWh ˆ 90, Wind G3x3; (8% capacity shortage)Load profile 2 122.65 5.11 30.33 110.05 12.59 16 109 65 12,632 276 228 0.508 0.428 77 29
HMG 6: PV 40 kW, Genset 30 kW, Converter 30 kW, Battery 1 kWh ˆ 90, Wind G3x3; (6% capacity shortage)Load profile 3 176.77 7.37 30.19 131.41 45.36 16 109 65 12,609 287 228 0.366 0.29 84 17
HMG 7: PV 10 kW, Genset 10 kW, Converter 10 kW, Battery 1 kWh ˆ 60; (10% capacity shortage)Load profile 4 14.7 0.61 4.61 14.7 - 6 42 25 4161 96 79 1.39 1.14 91 35
HMG 8: PV 10 kW, Genset 10 kW, Converter 10 kW, Battery 1 kWh ˆ 60; (8% capacity shortage)Load profile 5 30.5 1.27 4.62 14.7 15.35 12 42 25 4994 107 900 0.744 0.626 73 27
HMG 9: PV 5 kW, Genset 10 kW, Converter 10 kW, Battery 1 kWh ˆ 40, Wind G1x2; (8% capacity shortage)Load profile 4 14.7 0.61 4.61 14.7 - 6 44 26 3844 93 76 1.34 1.10 93 31
HMG 10: PV 10 kW, Genset 10 kW, Converter 10 kW, Battery 1 kWh ˆ 60, Wind G1x2; (6% capacity shortage)Load profile 5 30.5 1.27 4.62 14.7 15.35 12 50 30 4136 103 83 0.719 0.582 94 24
Energies 2016, 9, 268 11 of 16Energies 2016, 9, 268 11 of 16
(a)
(b)
Figure 5. (a) HMG 3, time series detail system performance analysis *; (b) HMG 6, time series detail
system performance analysis *. * All values in kW AC Primary Load AC Primary Load
Served PV Power Generation Generator Power Output Battery Maximum Charge
Wind Turbine Power Output
Figure 5. (a) HMG 3, time series detail system performance analysis *; (b) HMG 6, time series detail
system performance analysis *. * All values in kW
Energies 2016, 9, 268 11 of 16
(a)
(b)
Figure 5. (a) HMG 3, time series detail system performance analysis *; (b) HMG 6, time series detail
system performance analysis *. * All values in kW AC Primary Load AC Primary Load
Served PV Power Generation Generator Power Output Battery Maximum Charge
Wind Turbine Power Output
AC Primary Load
Energies 2016, 9, 268 11 of 16
(a)
(b)
Figure 5. (a) HMG 3, time series detail system performance analysis *; (b) HMG 6, time series detail
system performance analysis *. * All values in kW AC Primary Load AC Primary Load
Served PV Power Generation Generator Power Output Battery Maximum Charge
Wind Turbine Power Output
AC Primary Load Served
Energies 2016, 9, 268 11 of 16
(a)
(b)
Figure 5. (a) HMG 3, time series detail system performance analysis *; (b) HMG 6, time series detail
system performance analysis *. * All values in kW AC Primary Load AC Primary Load
Served PV Power Generation Generator Power Output Battery Maximum Charge
Wind Turbine Power Output
PV Power Generation
Energies 2016, 9, 268 11 of 16
(a)
(b)
Figure 5. (a) HMG 3, time series detail system performance analysis *; (b) HMG 6, time series detail
system performance analysis *. * All values in kW AC Primary Load AC Primary Load
Served PV Power Generation Generator Power Output Battery Maximum Charge
Wind Turbine Power Output
Generator Power Output
Energies 2016, 9, 268 11 of 16
(a)
(b)
Figure 5. (a) HMG 3, time series detail system performance analysis *; (b) HMG 6, time series detail
system performance analysis *. * All values in kW AC Primary Load AC Primary Load
Served PV Power Generation Generator Power Output Battery Maximum Charge
Wind Turbine Power Output
Battery Maximum Charge
Energies 2016, 9, 268 11 of 16
(a)
(b)
Figure 5. (a) HMG 3, time series detail system performance analysis *; (b) HMG 6, time series detail
system performance analysis *. * All values in kW AC Primary Load AC Primary Load
Served PV Power Generation Generator Power Output Battery Maximum Charge
Wind Turbine Power Output
Wind TurbinePower Output.
Energies 2016, 9, 268 12 of 16Energies 2016, 9, 268 12 of 16
(a)
(b)
Figure 6. (a) HMG 3, battery performance report; (b) HMG 6, battery performance report.
(a)
(b)
Figure 7. (a) HMG 3, Nominal cash flow; (b) HMG 6, nominal cash flow.
Figure 6. (a) HMG 3, battery performance report; (b) HMG 6, battery performance report.
Energies 2016, 9, 268 12 of 16
(a)
(b)
Figure 6. (a) HMG 3, battery performance report; (b) HMG 6, battery performance report.
(a)
(b)
Figure 7. (a) HMG 3, Nominal cash flow; (b) HMG 6, nominal cash flow.
Figure 7. (a) HMG 3, Nominal cash flow; (b) HMG 6, nominal cash flow.
Energies 2016, 9, 268 13 of 16
5. Discussion
Availability and the average intensity of solar and wind resources for a specific hybrid system inthe proposed study areas are same. Therefore, renewable resources and component combinations forHMGs can be either Solar-diesel generator-battery or solar-wind-diesel generator- battery dependingon the location of the project. Hybrid systems with wind turbines can be implemented in areas coveredby the thin red line in Figure 1, where wind speed is relatively higher. Study [51] conducted onrenewable energy storage systems on small islands show that the combination of wind power andbattery storage is less favorable compare to PV-battery hybrid systems as it is uneconomical at lowwind speed. Projects serving relatively bigger electrical loads in this study represent better NPC andmuch cheaper COE.
Tariff is probably the most important element of successful sustainable decentralized hybridmini-grid implementation. No willingness to pay (WTP) study has been carried out for thedecentralized hybrid renewable energy supply in the off-grid areas of Bangladesh. As neitherSEDA nor IDCOL decide the retail price of the electricity produced by the private investors usingrenewable energy sources, a sustainable tariff has to be introduced by the supplier to make the projectviable. Rural people in Bangladesh using stand-alone SHS actually pay USD 1.04/kWh [52] and USD0.60–0.98/kWh for using diesel grid [53] and USD 0.67/kWh for kerosene [54]. It is evident fromthe most successful 100 kW PV-diesel hybrid system with battery bank in Sandwip, Bangladesh thatconsumers are willing to pay USD 0.41/kWh of electricity [53]. Therefore, average tariff ranging fromUSD 0.40–USD 0.45/kWh can be applied for the decentralized hybrid systems in rural Bangladesh,which can guarantee enough profit for the investors producing electricity for USD 0.29/kWh or USD0.316/kWh from the study under configurations HMG 6 and 3 respectively. Given that they offerelectricity at a relatively low cost, these two models of HMGs become candidates for replication in thewhole coastal areas of Bangladesh.
6. Recommendations
The optimal hybrid system configurations obtained from the study indicate that cost-effectivehybrid mini-grids can be developed for decentralized electricity supply in the coastal areas ofBangladesh. However, an efficient revenue recovery strategy is important to ensure projectimplementation. Consumers in the mini grid area could be categorized depending on their needand financial capability. For the basic users, a fixed monthly/ weekly charge for usages can beapplied. On the other hand medium and large users can be connected with pre-pay or post-pay metersdepending on their financial conditions. For commercial usages, i.e., shops, cottage factories etc., afixed charge can be applied or be fitted with meters as “pay as you go” basis.
Smart pricing of electricity is essential, which sets different price for different hours of the dayand night depending on the cost of production. Time varying pricing scheme [55] can be a veryeffective tool for influencing the price responsive end users. “Seasonal tariff set up” is another optionto recover the cost of production with varying availability of resources in specific project locations.For agricultural activities, a subsidized tariff may be required, as farmers use highly subsidized dieselfor irrigation. In this case private electricity suppliers may request for an extended “tariff subsidy” foragricultural activities and receive support from the government.
Regular interactions with the local member of the public will be a prerequisite for betterunderstanding of the consumer need. Local youth can be trained to ensure skilled manpower supplyfor any future project expansion. However, consumers need to be educated both by the public andprivate sector for effective and productive use of electricity. Thus social empowerment can be achieved,which in turn will help mass diffusion of renewable mini grids.
Timely maintenance of every equipment and replacement are very important for providingreliable service and acquiring consumer’s confidence and loyalty. Any operation and maintenanceshould be in accordance with the policy guideline. For smart operation remote data monitoring systemcan be applied. Everyday operational data and resources abundance need to be duly collected and
Energies 2016, 9, 268 14 of 16
preserved, as this would help both the private investor itself and the policy makers to step forward inmass penetration in this market.
Acknowledgments: The first author acknowledges the fee waiver offered to him by De Montfort University forhis doctoral studies. The second author acknowledges financial support from the Research Councils UK underEPSRC (EP/G063826/2) for his research efforts.
Author Contributions: The work reported here is carried out as part of the doctoral studies being undertaken byMajbaul Alam under the supervision of Subhes Bhattacharyya. Alam has undertaken the research work, analyzedthe data and drafted the paper. Subhes Bhattacharyya provided general supervision, guidance and review.
Conflicts of Interest: The authors declare no conflict of interest.
References
1. Electricity Power Consumption Data 2014. The World Bank. Available online: http://data.worldbank.org/indicator/EG.USE.ELEC.KH.PC (accessed on 27 March 2015).
2. Bangladesh Power Development Board (BPDB). Maximum Generation Report 2015. Availableonline: http://www.bpdb.gov.bd/bpdb/index.php?option=com_content&view=article&id=126&Itemid=17(accessed on 16 October 2015).
3. Bangladesh Power Development Board (BPDB). Annual Report 2011–2012, BPDB, Dhaka. Available online:http://www.bpdb.gov.bd/download/annual_report/ANNUAL_REPORT__2011-2012.PDF (accessed onMay 2014).
4. World Bank. Lighting Up Rural Communities in Bangladesh. January 2015. Available online:http://www.worldbank.org/en/news/feature/2014/01/15/lighting-up-rural-communities-in-bangladesh(accessed on 12 June 2015).
5. Renewable Energy Policy of Bangladesh, Power Division, Ministry of Power Energy and MineralResources, Government of the Peoples Republic of Bangladesh. 18 December 2008. Available online:http://www.iea.org/media/pams/bangladesh/Bangladesh_RenewableEnergyPolicy_2008.pdf (accessedon 23 February 2015).
6. Khan, M.J.; Iqbal, M.T.; Mahboob, S. A wind map of Bangladesh. Ren Energy 2004, 29, 643–660. [CrossRef]7. Infrastructure Development Company Limited (IDCOL). Celebration of Installation 2 Million Solar Home
Systems and Launching of 1 Million Improved Cook Stoves Project, 15 May 2013. Available online:http://www.idcol.org/home/events/2013 (accessed on 12 January 2015).
8. The World Bank, Benefits of Solar Home Systems: An Analysis from Bangladesh, Documents andReports. 2013. Available online: http://www-wds.worldbank.org/external/default/WDSContentServer/WDSP/IB/2013/12/12/000158349_20131212101526/Rendered/PDF/WPS6724.pdf (accessed on 18April 2015).
9. Hamid, M.R. Photovoltaic Based Solar Home Systems: Current State of Dissemination in Rural Areas ofBangladesh and Future Prospect. Int. J. Adv. Res. Electron. Instrum. Eng. 2013, 2, 745–749.
10. Hussain, S.; Davies, M.C.; Sushenjit, B.; Limnin, W. Quantifying Carbon and Distributional Benefits of SolarHome System Programs in Bangladesh, The World Bank Environment Department, Policy Research WorkingPaper 5545. 2011. Available online: http://elibrary.worldbank.org/doi/pdf/10.1596/1813-9450-5545(accessed on 14 January 2015).
11. Khan, M.R.; Khan, M.F. Energy cost calculations for a Solar PV Home System. In Proceedings of the1st International Conference on the Developments in Renewable Energy Technology, Dhaka, Bangladesh,17–19 December 2009.
12. International Energy Agency (IEA). World Energy Outlook. 2011. Available online:http://www.worldenergyoutlook.org/media/weowebsite/energydevelopment/weo2011_energy_for_all.pdf(accessed on 3 February 2015).
13. The World Bank. Technical and Economic Assessment of Off-Grid, Mini-Grid and Grid ElectrificationTechnologies, Technical Paper 121/07. 2007. Available online: http://siteresources.worldbank.org/INTENERGY/Resources/MiniGridElectrificationTechnicalReport61207.pdf (accessed on 14 January 2015).
14. Bangladesh Power Development Board (BPDB). Development of Renewable Technologies by BPDB.Available online: http://www.bpdb.gov.bd/bpdb/index.php?option=com_content&view=article&id=26&Itemid=24 (accessed on 21 March 2015).
Energies 2016, 9, 268 15 of 16
15. Adaramola, M.S. Feasibility study of off-grid hybrid energy systems for applications in Ondo state, Nigeria.J. Eng. Appl. Sci. 2012, 7, 72–78.
16. Adaramola, M.S.; Oyewola, O.M.; Paul, S.S. Technical and economic assessment of hybrid energy systems inSouth-West Nigeria. Energy Explor. Exploit. 2012, 30, 533–552. [CrossRef]
17. Ajao, K.R.; Oladosu, O.A.; Popoola, O.T. Using HOMER power optimization software for cost benefitanalysis of hybrid-solar power generation relative to utility cost in Nigeria. Int. J. Res. Rev. Appl. Sci. 2011, 7,96–102.
18. Nema, P.; Nema, R.K.; Rangnekar, S. A current and future state of art development of hybrid energy systemusing wind and PV-solar: A review. Renew. Sustain. Energy Rev. 2009, 13, 2096–2103. [CrossRef]
19. Bertheau, P.; Cader, C.; Huyskens, H.; Blechinger, P. The Influence of Diesel Fuel Subsidies and Taxes on thePotential for Solar-Powered Hybrid Systems in Africa. Resources 2015, 4, 673–691. [CrossRef]
20. Kumar, U.S.; Manoharan, P.S. Economic analysis of hybrid power systems (PV/diesel) in different climaticzones of Tamil Nadu. Energy Conserv. Manag. 2014, 80, 469–476. [CrossRef]
21. Adaramola, M.S.; Paul, S.S.; Oyewola, O.M. Assessment of decentralized hybrid PV solar-diesel powersystem for application in northern part of Nigeria. Energy Sustian. Dev. 2014, 19, 72–78. [CrossRef]
22. Alliance for Rural Electrification. Off-Grid Solutions for Rural Electrification and Policiesto Support Them. Available online: http://www.ruralelec.org/fileadmin/DATA/Documents/06_Publications/ARE_Best_Practises_2013_FINAL.pdf (accessed on 21 August 2015).
23. Belfkira, R.; Barakat, G.; Nicolas, T.; Nichita, C. Design study and optimization of a grid independentwind/PV/Diesel system. In Proceedings of the 13th European Conference on Power Electronics andApplications, Barcelona, Spain, 8–10 September 2009.
24. Kumar, A.; Mohanty, P.; Palit, D.; Chaurey, A. Approach for standardization of off-grid electrification projects.Ren. Sustain. Energy Rev. 2009, 13, 1946–1956. [CrossRef]
25. Chen, J.; Che, Y.; Zhao, L. Design and research of off-grid wind-solar hybrid power generation systems. InProceedings of the 4th International Conference on Power Electronics Systems and Applications (PESA),Hong Kong, China, 8–10 June 2011.
26. Dalwadi, P.; Shrinet, V.; Mehta, C.R.; Shah, P. Optimization of solar-wind hybrid system for distributedgeneration. In Proceedings of the Nirma University International Conference on Engineering (NUiCONE),Ahmedabad, India, 8–10 December 2011.
27. Viral, R.K.; Bahar, T.; Bansal, M. Mini grid development for rural electrification in remote India. Int. J. Emerg.Technol. Adv. Eng. 2013, 3, 356–361.
28. Ulsrud, K.; Winther, T.; Palit, D.; Rohracher, H.; Sandgren, J. The solar transitions research on solar mini-gridsin India: Learning from local cases of innovative socio-technical systems. Energy Sustain. Dev. 2011, 15,292–302. [CrossRef]
29. Sadiqi, M.; Pahwa, A.; Miller, R.D. Basic design and cost optimization of a hybrid power system for ruralcommunities in Afghanistan. In Proceedings of the North American Power Symposium (NAPS), UrbanaChampaign, IL, USA, 9–11 September 2012.
30. Bekele, G.; Tadesse, G. Feasibility study of small Hydro/PV/Wind hybrid system for off-grid ruralelectrification in Ethiopia. Appl. Eng. 2012, 97, 5–15. [CrossRef]
31. The Energy and Resources Institute (TERI). Analysis of Rural Electrification Strategy withSpecial Focus on the Franchise System in the States of Andhra Pradesh, Karnataka andOrissa, New Delhi. 2010. Available online: http://www.teriin.org/index.php?option=com_completed&task=details&pcode=2009ER03&Itemid=146 (accessed on 16 May 2015).
32. Nandi, S.K.; Ghosh, H.R. A wind-PV-battery hybrid power system at Sitakunda in Bangladesh. Energy Policy2009, 37, 3659–3664. [CrossRef]
33. Nandi, S.K.; Ghosh, H.R. Techno-economical analysis of off-grid hybrid systems at Kutubdia Island,Bangladesh. Energy Policy 2010, 38, 976–980. [CrossRef]
34. Mondal, A.H.; Denich, M. Hybrid systems for decentralized power generation in Bangladesh.Energy Sustain. Dev. 2010, 14, 48–55. [CrossRef]
35. Hasan, K.; Fatima, K.; Mahmood, M.S. Feasibility of hybrid power generation over wind and solar standalonesystem. In Proceedings of the 5th International Power Engineering and Optimization Conference (PEOCO),Shah Alam, Malaysia, 6–7 June 2011.
Energies 2016, 9, 268 16 of 16
36. Khan, A.H.; Khan, M.F.; Mostafa, R. Solar PV as an effective alternative to oil based lamp in the ruralBangladesh. In Proceedings of the 2nd International Conference on the Developments in Renewable EnergyTechnology (ICDRET), Dhaka, Bangladesh, 5–7 January 2012.
37. Battacharyya, S.C. Mini-grid based electrification in Bangladesh: Technical configuration and business caseanalysis. Ren. Energy 2015, 75, 745–716. [CrossRef]
38. Bhuiyan, M.A.S. Estimation of solar radiation: An empirical model for Bangladesh. IIUM Eng. J. 2013, 14,103–117.
39. Ahmed, S. Investigation and Analysis of Wind Pumping System for Irrigation in Bangladesh. Master’sThesis, Bangladesh University of Engineering and Technology (BUET), Dhaka, Bangladesh, February 2002.
40. Renewable Energy Policy of Bangladesh (Draft) 2002. Ministry of Energy and MineralResources, October 2002. Available online: http://www.sdnbd.org/sdi/issues/energy/nationalpolicy/Draft%20Renewable%20Energy%20Policy%20of%20Bangladesh%20-%20Oct%202002.pdf (accessed on1 May 2015).
41. Bangladesh Bureau of Statistics (BBS). Area Population Household and HousingCharacteristics, Chapter III. 2012; pp. 85–144. Available online: http://www.bbs.gov.bd/WebTestApplication/userfiles/Image/PocketBook10/Chapter3.pdf (accessed on 27 June 2015).
42. Palit, D.; Chaurey, A. Off-grid rural electrification experiences from South Asia: Status and best practices.Energy Sustain. Dev. 2011, 15, 266–276. [CrossRef]
43. Chaurey, A.; Kandpal, T.C. A techno-economic comparison of rural electrification based on solar homesystems and PV microgrids. Energy Policy 2010, 38, 3118–3129. [CrossRef]
44. Akter, N. Alternative energy situation in Bangladesh: A country review. In Regional Training OrientationCourse on Alternative Energy Technologies; Approtech Asia, Philippine Social Development Centre: Manila,Philippines, 1997.
45. Khadem, S.K.; Hussain, M. A pre-feasibility study of wind resources in Kutubdia Island, Bangladesh.Renew. Energy 2006, 31, 2329–2341. [CrossRef]
46. Hybrid Optimization of Multiple Energy Resources (HOMER). HOMER Energy LLC, Boulder, Colorado,USA. Available online: http://homerenergy.com (accessed on 30 January 2015).
47. Rohit, S.; Bhattacharyya, S.C. Off-grid electricity generation with renewable energy technologies in India:An application of HOMER. Renew. Energy 2014, 62, 388–398.
48. Chukwuma, L.A.; Patrik, K.; Fedrik, W.; Björn, K.; Charles, M. Electricity for development: Mini-grid solutionfor rural electrification in Africa. Energy Convers. Manag. 2015, 110, 268–277.
49. Debabrata, C.; Morgan, B.; Peter, L. More power, less cost: Transitioning up the solar energy ladder fromHome Systems to Mini-grids. Electr. J. 2015, 28, 41–50.
50. Kassahun, Y.K. Viabilitty study of grid-connected solar PV system in Ethiopia. Sustain. Energy Technol. Assess.2015, 10, 63–70.
51. Blechinger, P.; Seguin, R.; Cader, C.; Bertheau, P.; Breyer, C. Assessment of the Global Potential for RenewableEnergy Storage Systems on Small Islands. Energy Procedia 2014, 46, 325–331. [CrossRef]
52. Akhi, R.A.; Islam, M. Prospects of solar home systems in Bangladesh and a case study for tariff calculation.Int. J. Innov. Appl. Stud. 2014, 7, 273–282.
53. Khan, H.J.; Huque, A.J. Reliable power supply with solar mini grid in Sandwip Island of Bangladesh.In Proceedings of the 2nd International Conference on Developments in Renewable Energy Technology(ICDRET), Dhaka, Bangladesh, 5–7 January 2012.
54. Mandal, M.A.H. Economic viability of solar home systems: Case study of Bangladesh. Renew. Energy 2010,35, 1125–1128. [CrossRef]
55. Kimera, R.; Okou, R.; Sebitosi, A.B.; Awodele, K.O. A concept of dynamic pricing for rural hybrid electricpower mini-grid systems for sub-Saharan Africa. In Proceedings of the Power and Energy Society GeneralMeeting, San Diego, CA, USA, 22–26 July 2012.
© 2016 by the authors; licensee MDPI, Basel, Switzerland. This article is an open accessarticle distributed under the terms and conditions of the Creative Commons by Attribution(CC-BY) license (http://creativecommons.org/licenses/by/4.0/).