dean storholtbollinger bands bollinger bands are my number 1 indicator tweezers are my number 1.1...
TRANSCRIPT
Dean Storholt
I am not a registered broker-dealer or investment adviser. I will mention that I consider certain securities or positions to be good candidates for the types of strategies we are discussing or illustrating. Because I consider the securities or positions appropriate to the discussion or for illustration purposes does not mean that I am telling you to trade the strategies or securities. Keep in mind that we are not providing you with recommendations or personalized advice about your trading activities. The information we are providing is not tailored to any particular individual. Any mention of a particular security is not a recommendation to buy, sell, or hold that or any other security or a suggestion that it is suitable for any specific person. Keep in mind that all trading involves a risk of loss, and this will always be the situation, regardless of whether we are discussing strategies that are intended to limit risk.
I am not subject to trading restrictions. Myself and other instructors could have a position in a security or initiate a position in a security at any time.
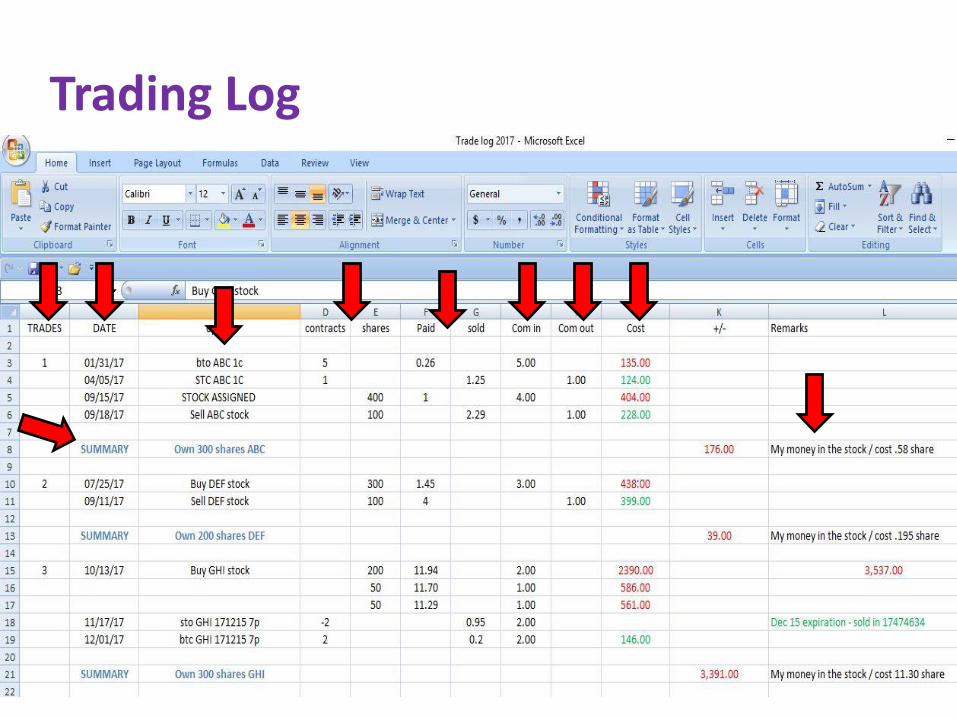
Trading Log
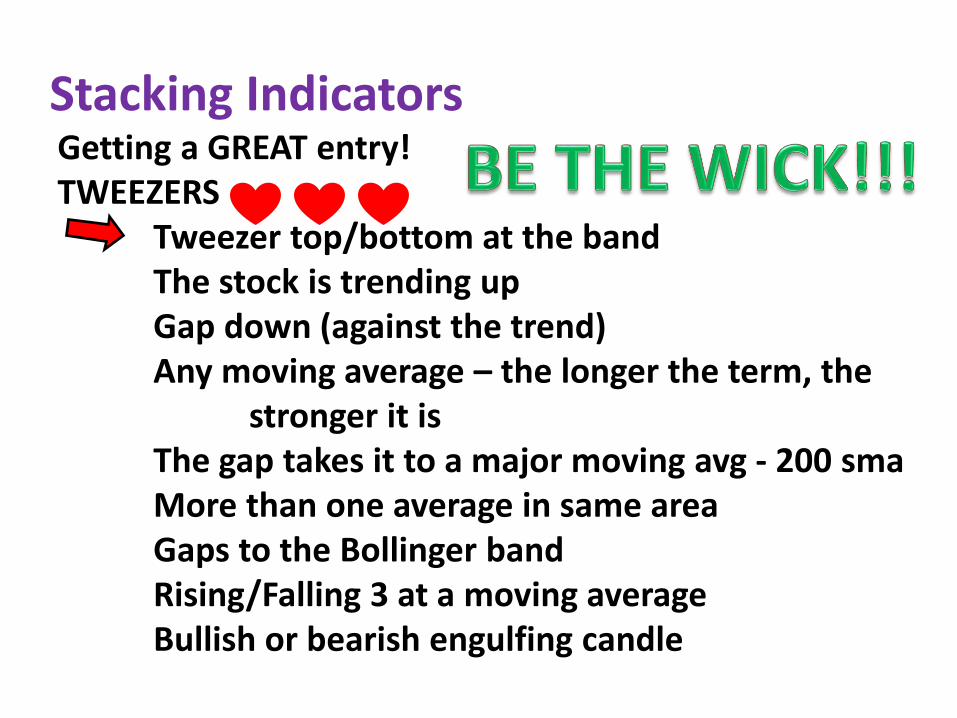
Stacking IndicatorsGetting a GREAT entry!TWEEZERS
Tweezer top/bottom at the bandThe stock is trending upGap down (against the trend)Any moving average – the longer the term, the
stronger it isThe gap takes it to a major moving avg - 200 smaMore than one average in same areaGaps to the Bollinger bandRising/Falling 3 at a moving averageBullish or bearish engulfing candle
Stacking IndicatorsDay count / candle countOld levels of horizontal support/resistance
Can include round numbers Retirement pattern at a moving average
Repetitive retirement can = TWEEZERBreak above the first 5 minute candlePivot PointsBollinger Band Squeeze/BreakoutVolume – lower volume indicates its only retracing
Blow off move?Fibonacci’sKeltners
Stacking IndicatorsDouble tops/bottomsHead and shoulders/necklineOld levels of horizontal support/resistance
Can include round numbers RectanglesStochasticsMACDRSIADXDMI +, DMI-Richard
Stacking Indicators
Start by stacking indicators on the daily chartLike to have at least 4
Then move to the five minute chart and continue stacking
Can even continue stacking on the one minute chart
Stacking Indicators
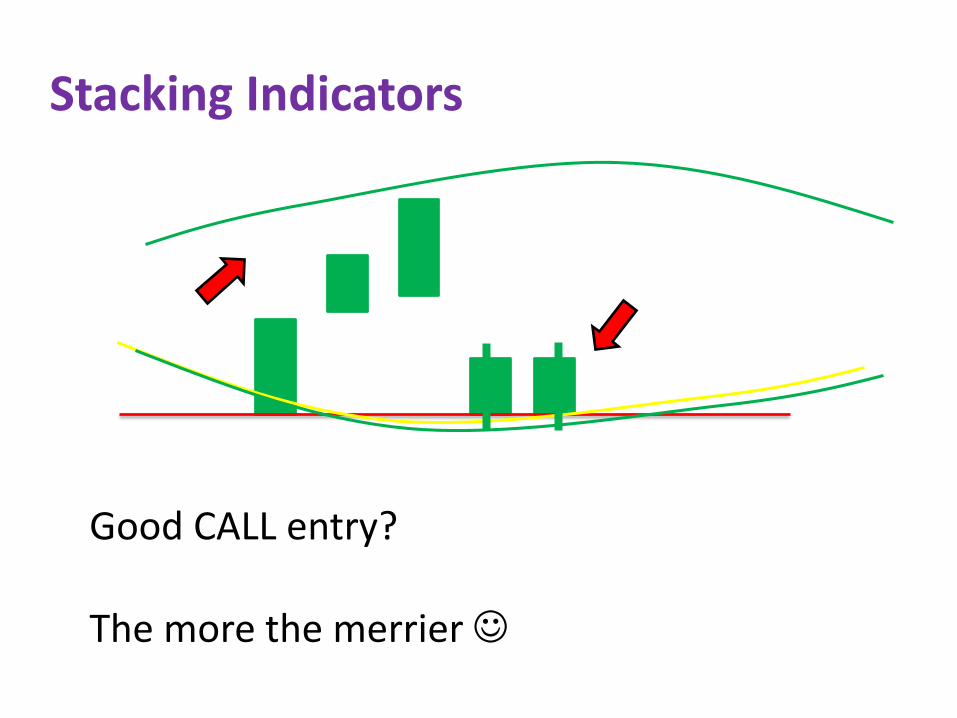
Good CALL entry?
The more the merrier ☺
What about a 30-50 delta?!?Lower delta’s are not meant to be permanent
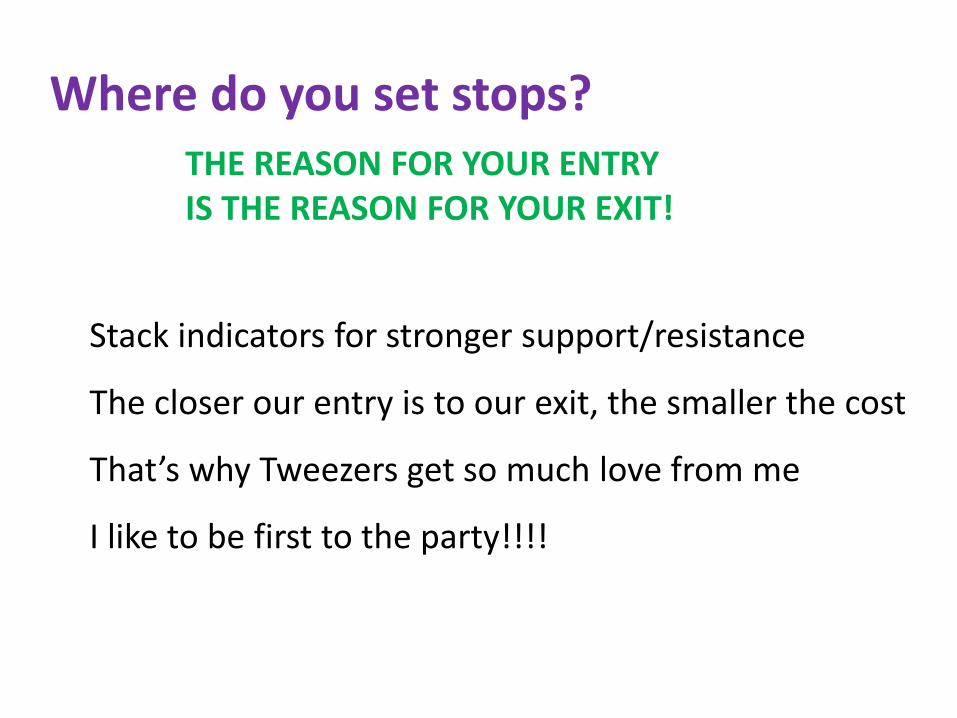
Where do you set stops?THE REASON FOR YOUR ENTRY IS THE REASON FOR YOUR EXIT!
Stack indicators for stronger support/resistance
The closer our entry is to our exit, the smaller the cost
That’s why Tweezers get so much love from me
I like to be first to the party!!!!
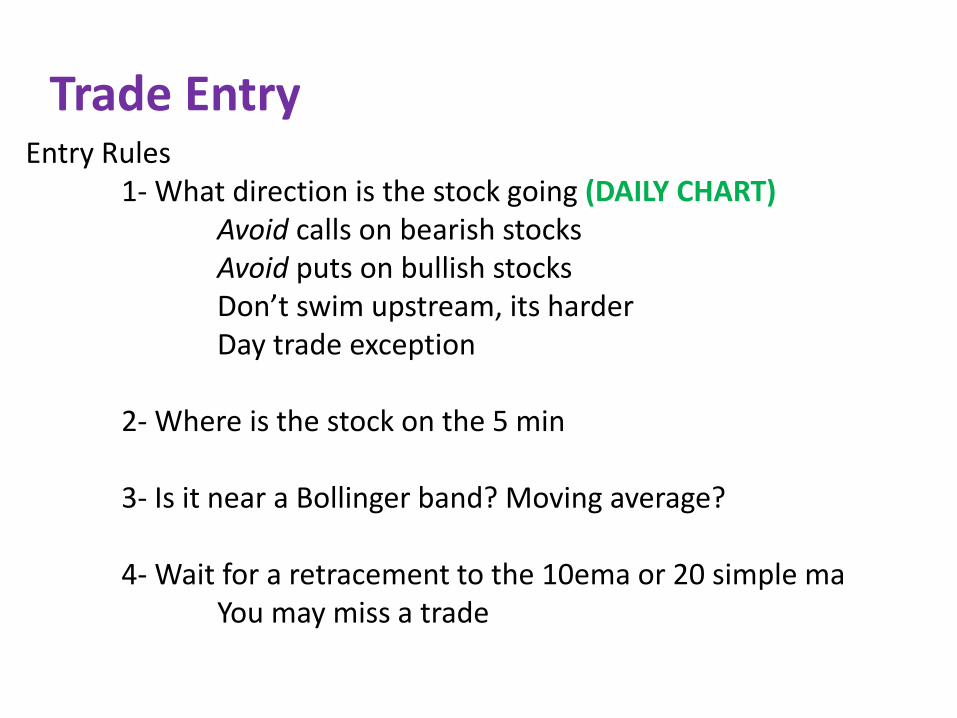
Trade EntryEntry Rules
1- What direction is the stock going (DAILY CHART)Avoid calls on bearish stocksAvoid puts on bullish stocksDon’t swim upstream, its harderDay trade exception
2- Where is the stock on the 5 min
3- Is it near a Bollinger band? Moving average?
4- Wait for a retracement to the 10ema or 20 simple maYou may miss a trade
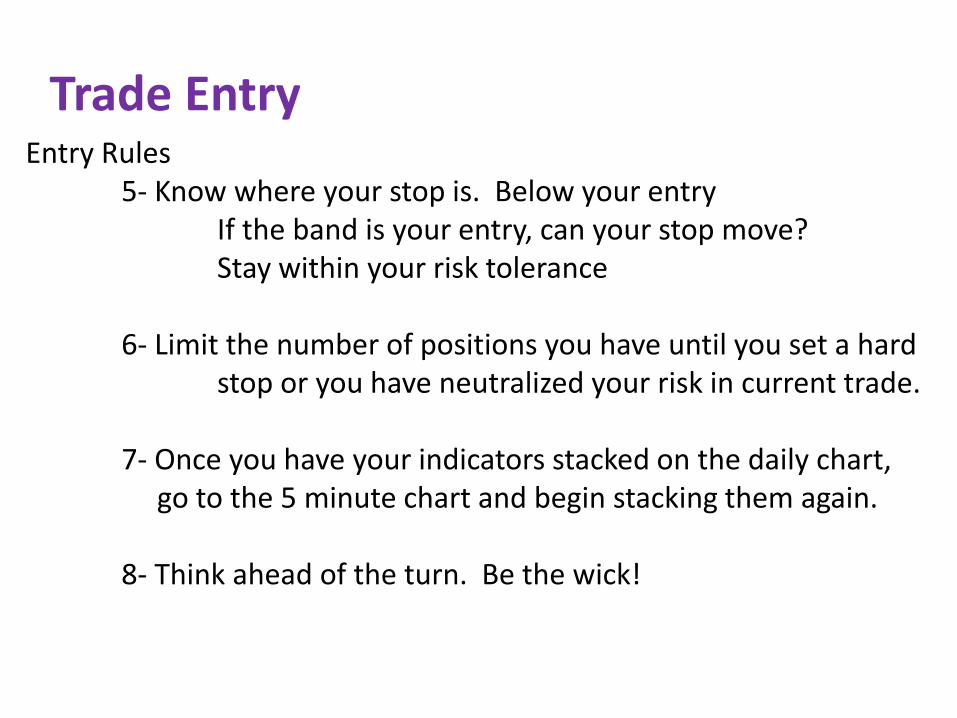
Trade EntryEntry Rules
5- Know where your stop is. Below your entryIf the band is your entry, can your stop move?Stay within your risk tolerance
6- Limit the number of positions you have until you set a hard stop or you have neutralized your risk in current trade.
7- Once you have your indicators stacked on the daily chart, go to the 5 minute chart and begin stacking them again.
8- Think ahead of the turn. Be the wick!

Bollinger BandsBOLLINGER BANDS are my NUMBER 1 indicatorTWEEZERS are my NUMBER 1.1 indicatorTWEEZERS at Bollinger bands are SWEEEET!
If you don’t have Bands on a chart,We cannot be friends!!
Bollinger Bands3 RULES OF BOLLINGER BAND TRADING!
1- Avoid calls at the top band
2- Avoid puts at the bottom band
3- Follow Rule #1 and Rule #2
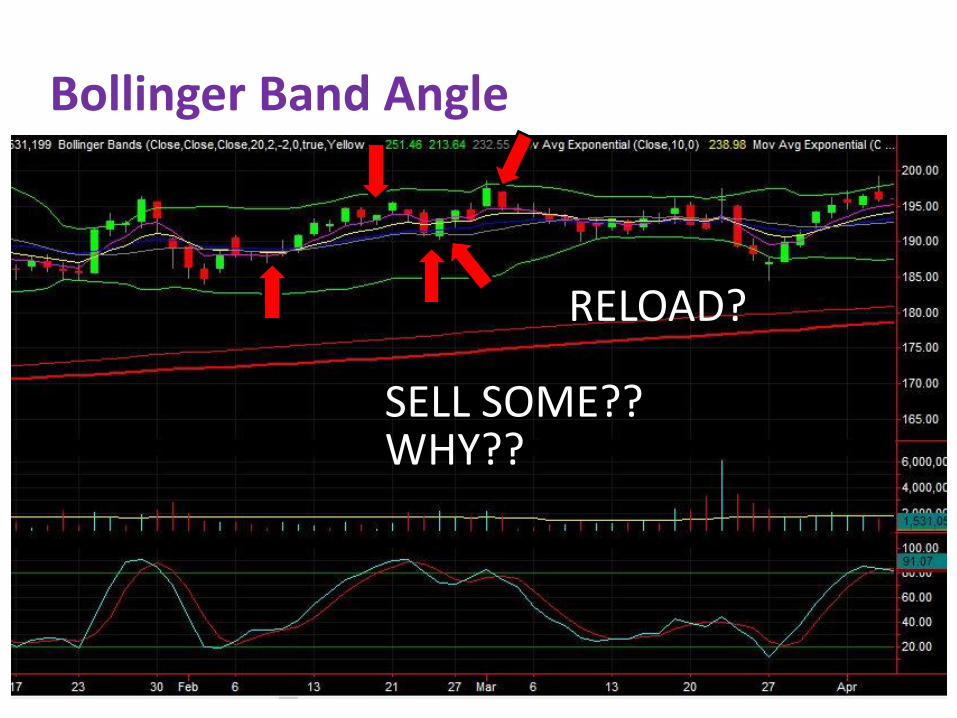
Bollinger Band AngleLook at the angle of the BANDS!
Are the bands Horizontal?
Horizontal bands are stronger
The opposite is true for Moving Averages
Is the stock going band to band?
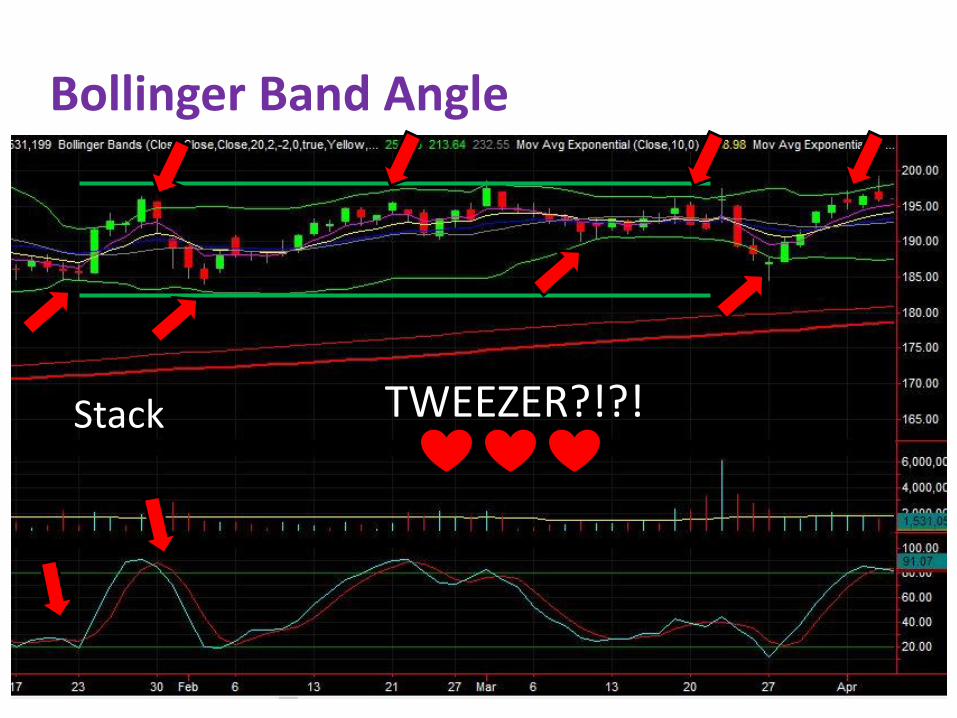
Bollinger Band Angle
TWEEZER?!?!Stack
Bollinger Band Angle
SELL SOME??WHY??
RELOAD?
Bollinger Band AngleThere is a special relationship between the bands and the 20 sma
Horizontal bands usually mean horizontal moving avg
Angled Bollinger bands are weaker
Bollinger Band AngleLook at the angle of the BANDS!
Are the bands angled or sloped?
The steeper the slope, the slippery they are

Bollinger Band AngledLook at the angle of the BANDS!
Are the bands angled or sloped?
The steeper the slope, the slippery they are
This is where they form the “money channel”Can be used to time premium selling or add ons
Moving Averages become more relevant – why?
Steeply angled bands NEED A REASON TO TURN
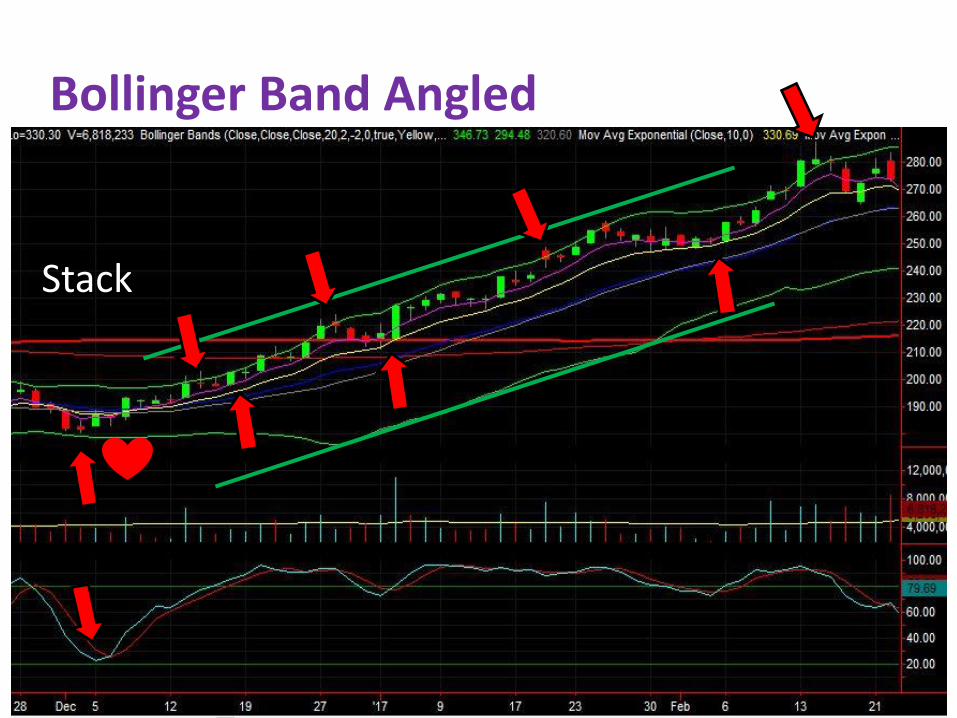
Bollinger Band Angled
Stack
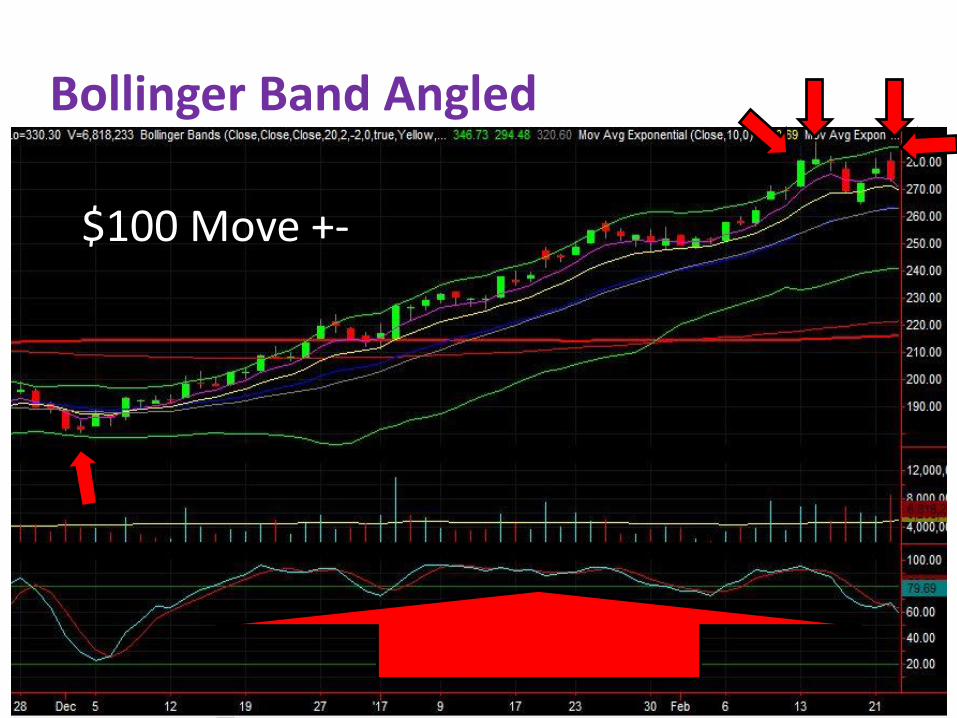
Bollinger Band Angled
$100 Move +-
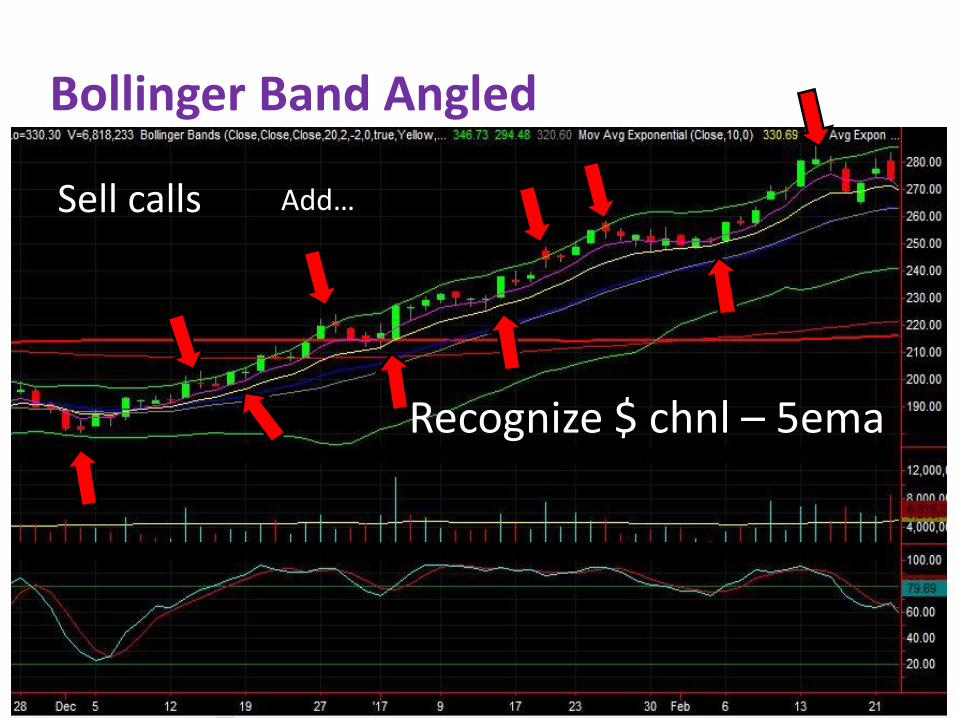
Bollinger Band Angled
Recognize $ chnl – 5ema
Sell calls Add…
Bollinger Band SqueezeBands get very close together
Bands usually horizontal
Can signal AWESOME breakouts / breakdowns
Often give us the “avoid calls” exception!
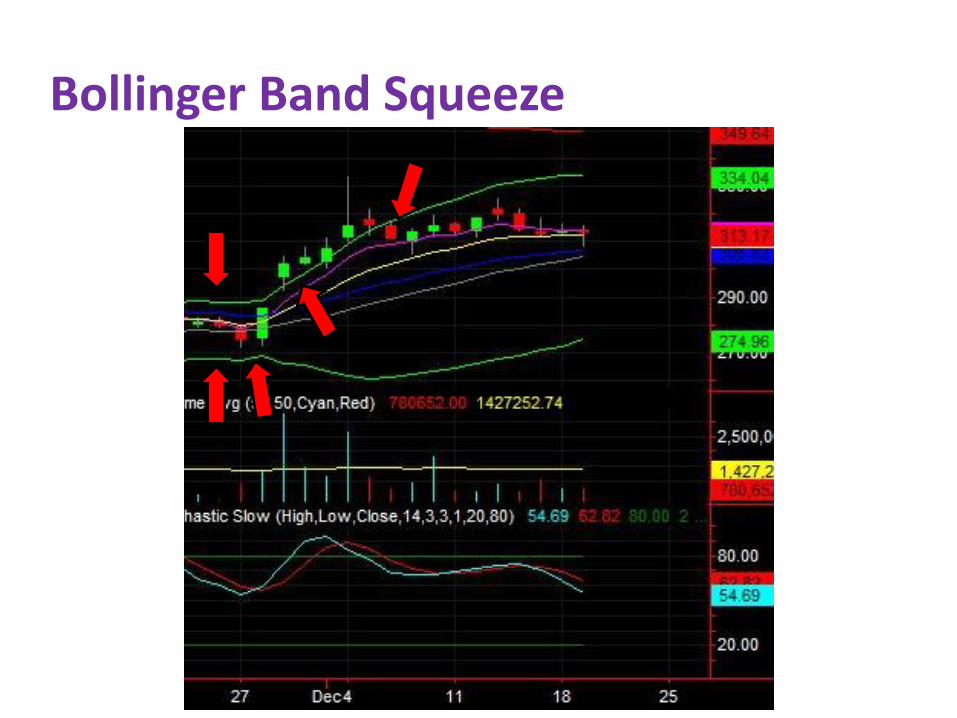
Bollinger Band Squeeze
Bollinger Band ExceptionsOutside band gives us the “avoid calls” exception!
If stock outside the top band, go ahead and buy calls
If stock outside bottom band, go ahead and buy puts
REMEMBER – The reason for the entry is the reason for the exit!!!
Therefore when it gets inside the band, tighten stop or exit
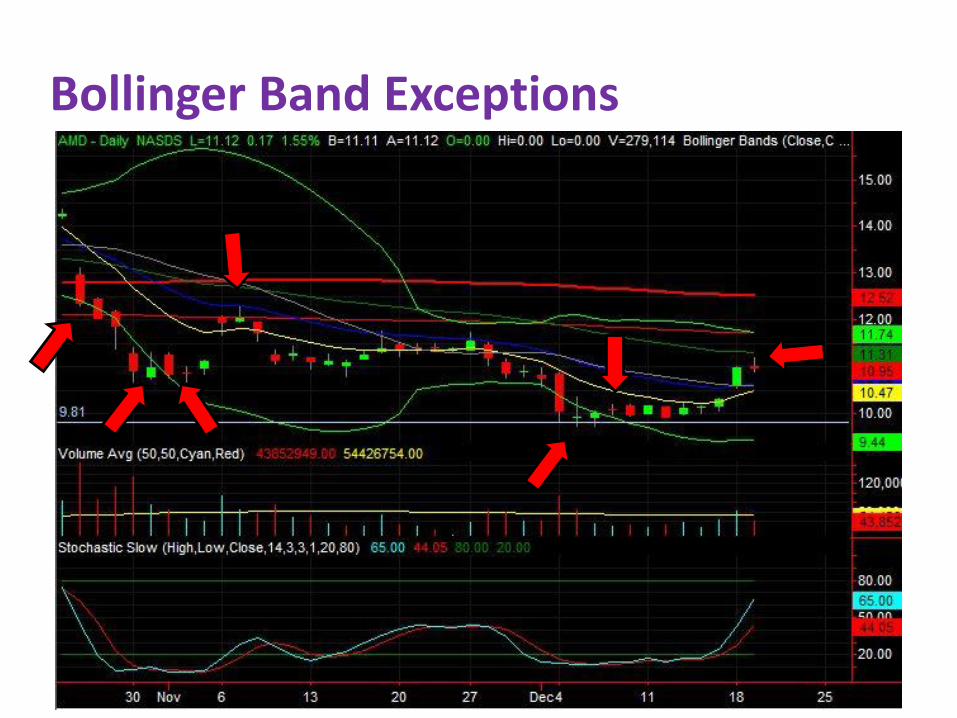
Bollinger Band Exceptions
Outside Bollinger Bands
How long outside band?
Inside band can give us a nice entry
Steeply angled bands may only retrace to MA
Bollinger Band Exceptions
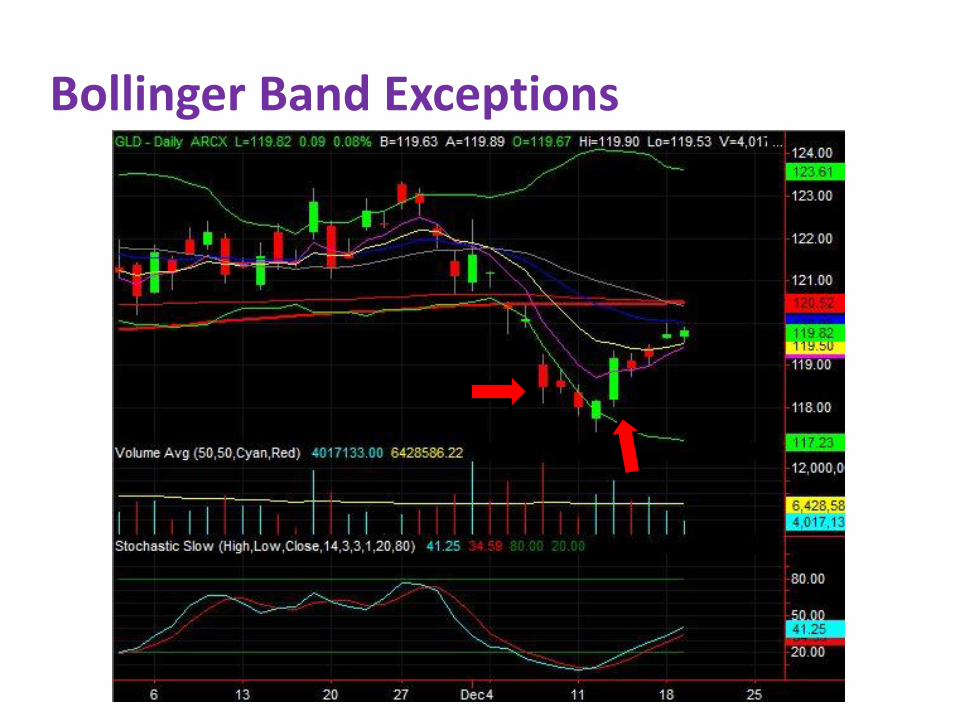
Bollinger Band Exceptions
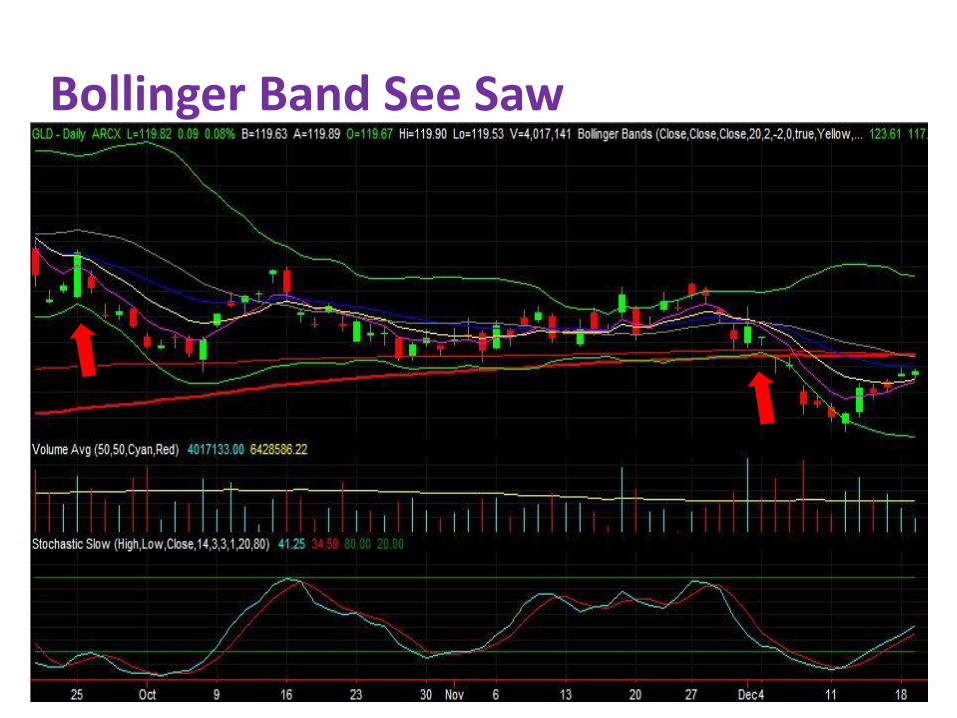
Bollinger Band See Saw

Class will be Feb 12/13First day - classroom and chart analysisChart setup/tradesSecond day will be trade execution/monitoring and more classroomThe See Saw/ The Hook
Cover – band tops/bottoms, setups, option selection, chart setup, pattern recognition
My 10 trading rules
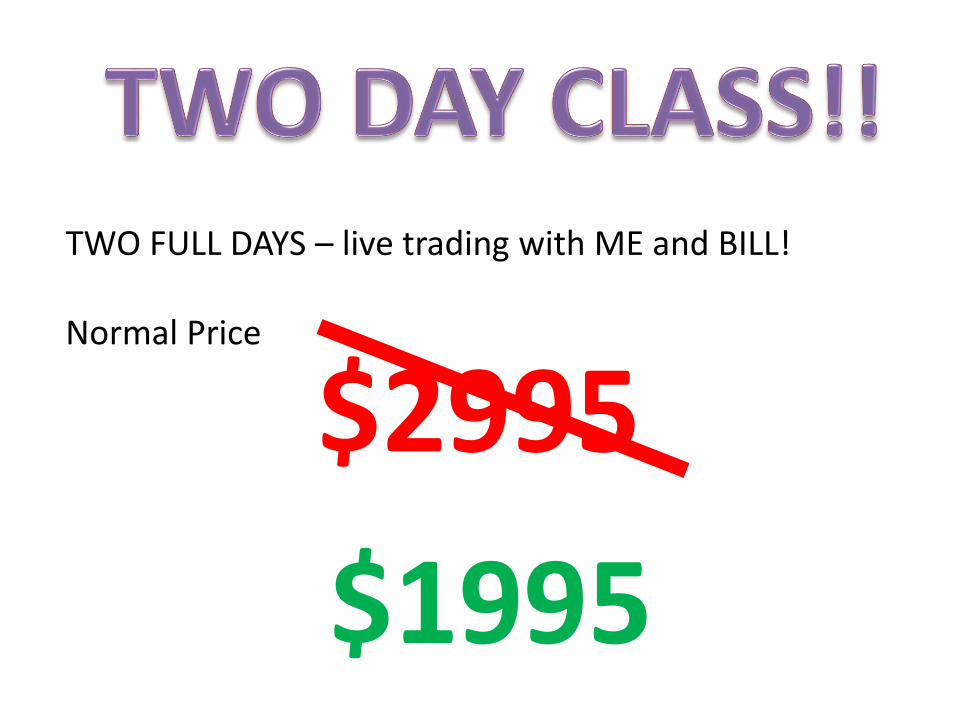
TWO FULL DAYS – live trading with ME and BILL!
Normal Price
$2995
$1995