ddr corp. investor presentation
DESCRIPTION
DDR is an owner and manager of 378 value-oriented shopping centers representing 116 million square feet in 41 states and Puerto Rico. The Company’s portfolio is comprised primarily of large-format power centers located in top markets across the United States, and is actively managed to create long-term shareholder value. DDR is a self-administered and self-managed REIT operating as a fully integrated real estate company, and is publicly traded on the New York Stock Exchange under the ticker symbol DDR.TRANSCRIPT

INVESTORUPDATE
SAFE HARBOR
DDR considers portions of the information in this presentation to be forward-looking statements within the meaning of Section 27A of the Securities Act of 1933 and Section 21E of the Securities Exchange Act of 1934, both as amended, with respect to the Company’s expectation for future periods. Although the Company believes that the expectations reflected in such forward-looking statements are based upon reasonable assumptions, it can give no assurance that its expectations will be achieved. For this purpose, any statements contained herein that are not historical fact may be deemed to be forward-looking statements. There are a number of important factors that could cause our results to differ materially from those indicated by such forward-looking statements, including, among other factors, local conditions such as supply of space or a reduction in demand for real estate in the area; competition from other available space; dependence on rental income from real property; the loss of, significant downsizing of or bankruptcy of a major tenant; constructing properties or expansions that produce a desired yield on investment; our ability to buy or sell assets on commercially reasonable terms; our ability to complete acquisitions or dispositions of assets under contract; our ability to secure equity or debt financing oncommercially acceptable terms or at all; our ability to enter into definitive agreements with regard to our financing and joint venture arrangements or our failure to satisfy conditions to the completion of these arrangements; and the success of our capital recycling strategy. For additional factors that could cause the results of the Company to differ materially from those indicated in the forward-looking statements, please refer to the Company’s Form 10-K for the year ended December 31, 2015. The Company undertakes no obligation to publicly revise these forward-looking statements to reflect events or circumstances that arise after the date hereof.
2July 2016

NEED TO KNOW
10 ICSC TAKEAWAYS: NOT ALL RETAIL IS CREATED EQUALDEMAND REMAINS VERY STRONG FOR POWER CENTERS
1. Aggressive growth plans from value-priced apparel, fast casual restaurants, grocery, entertainment, fitness, home, and salon/beauty retailers that are taking market share and offering an “experience”; TJX, Ross, Ulta, Petco, Petsmart, F21 Red, and Planet Fitness had some of the most aggressive expansion plans
2. Value-priced apparel retailers were increasingly sought after as co-tenants as their everyday traffic becomes comparable to grocers
3. Focus on experience was evident as theater upgrades, Top Golf, concert venues, trampoline parks, upscale bowling, and increased owner/pet experience were representative of the shift to “experiences” over “things”
4. New prototypes were abundant as the continued lack of new supply is forcing retailers to become more nimble with their footprint; examples included smaller formats from Kohl’s, Burlington, and Office Depot
5. New markets were a key topic for existing retailers, including Sprouts into FL and NC, Five Below into Los Angeles, and Ross further across the Midwest
6. Sports Authority boxes garnered strong interest; disappointment over lack of office sector consolidation
4
$14.89 Signed ABR on new anchors in 2015, generating 32.1% spreads
$24.65 Signed ABR on new small shop leases, generating 14.6% spreads
31.4% Total net absorption in the last five years
10 ICSC TAKEAWAYS: NOT ALL RETAIL IS CREATED EQUALWEAKNESS IN MALLS = MARKET SHARE SHIFT TO OPEN AIR RETAIL, NOT JUST E-COMMERCE
7. TJX, Ross, Burlington, and Nordstrom Rack picked up significant market share from malls in 1Q alone; TJX’s MarMaxx and HomeGoods are estimated to have picked up ~$350 million of 1Q sales year-over-year, which is more than half of the ~$680 million department stores lost in the same quarter (1)
8. Off-mall locations were sought by traditional mall retailers; examples included Lane Bryant, Torrid, Justice, Bath Body Works, Kay Jewelers, and Kirkland’s
9. A significant brick and mortar presence is imperative to retailers who acknowledge the need for brick and mortar locations as the vast majority of sales touch the store and they fully integrate omni-channel
10. Amazon was present at the convention and retailers like Sprouts have engaged Amazon to form a partnership for same day delivery
5
THERE WAS LESS “OMNI-CHANNEL DRIVING STORE CLOSURE” CONVERSATION THAN IN THE LAST FEW YEARS
(1) “TJX Cos.: First Take: Impressive beat provides answer to dept. store debacle”, Goldman Sachs, 5/17/16
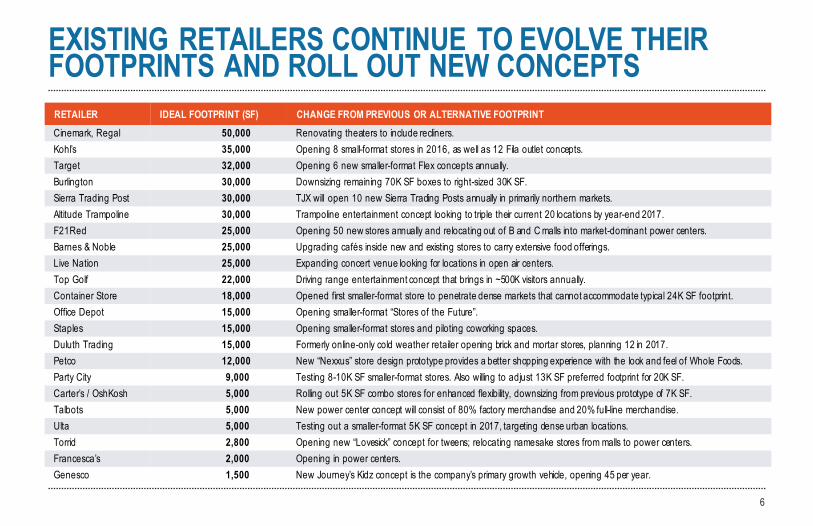
EXISTING RETAILERS CONTINUE TO EVOLVE THEIR FOOTPRINTS AND ROLL OUT NEW CONCEPTS
6
RETAILER IDEAL FOOTPRINT (SF) CHANGE FROM PREVIOUS OR ALTERNATIVE FOOTPRINTCinemark, Regal 50,000 Renovating theaters to include recliners.Kohl’s 35,000 Opening 8 small-format stores in 2016, as well as 12 Fila outlet concepts.Target 32,000 Opening 6 new smaller-format Flex concepts annually.Burlington 30,000 Downsizing remaining 70K SF boxes to right-sized 30K SF.Sierra Trading Post 30,000 TJX will open 10 new Sierra Trading Posts annually in primarily northern markets.Altitude Trampoline 30,000 Trampoline entertainment concept looking to triple their current 20 locations by year-end 2017.F21Red 25,000 Opening 50 new stores annually and relocating out of B and C malls into market-dominant power centers.Barnes & Noble 25,000 Upgrading cafés inside new and existing stores to carry extensive food offerings. Live Nation 25,000 Expanding concert venue looking for locations in open air centers.Top Golf 22,000 Driving range entertainment concept that brings in ~500K visitors annually.Container Store 18,000 Opened first smaller-format store to penetrate dense markets that cannot accommodate typical 24K SF footprint.Office Depot 15,000 Opening smaller-format “Stores of the Future”.Staples 15,000 Opening smaller-format stores and piloting coworking spaces.Duluth Trading 15,000 Formerly online-only cold weather retailer opening brick and mortar stores, planning 12 in 2017.Petco 12,000 New “Nexxus” store design prototype provides a better shopping experience with the look and feel of Whole Foods.Party City 9,000 Testing 8-10K SF smaller-format stores. Also willing to adjust 13K SF preferred footprint for 20K SF.Carter’s / OshKosh 5,000 Rolling out 5K SF combo stores for enhanced flexibility, downsizing from previous prototype of 7K SF.Talbots 5,000 New power center concept will consist of 80% factory merchandise and 20% full-line merchandise.Ulta 5,000 Testing out a smaller-format 5K SF concept in 2017, targeting dense urban locations.Torrid 2,800 Opening new “Lovesick” concept for tweens; relocating namesake stores from malls to power centers.Francesca’s 2,000 Opening in power centers.Genesco 1,500 New Journey’s Kidz concept is the company’s primary growth vehicle, opening 45 per year.
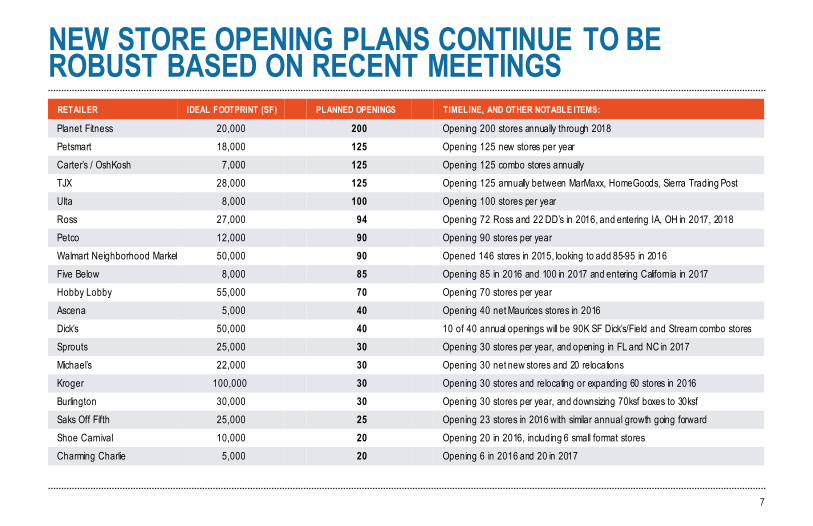
NEW STORE OPENING PLANS CONTINUE TO BE ROBUST BASED ON RECENT MEETINGS
7
RETAILER IDEAL FOOTPRINT (SF) PLANNED OPENINGS TIMELINE, AND OTHER NOTABLE ITEMS:
Planet Fitness 20,000 200 Opening 200 stores annually through 2018Petsmart 18,000 125 Opening 125 new stores per yearCarter’s / OshKosh 7,000 125 Opening 125 combo stores annuallyTJX 28,000 125 Opening 125 annually between MarMaxx, HomeGoods, Sierra Trading PostUlta 8,000 100 Opening 100 stores per yearRoss 27,000 94 Opening 72 Ross and 22 DD’s in 2016, and entering IA, OH in 2017, 2018Petco 12,000 90 Opening 90 stores per yearWalmart Neighborhood Market 50,000 90 Opened 146 stores in 2015, looking to add 85-95 in 2016Five Below 8,000 85 Opening 85 in 2016 and 100 in 2017 and entering California in 2017Hobby Lobby 55,000 70 Opening 70 stores per yearAscena 5,000 40 Opening 40 net Maurices stores in 2016Dick’s 50,000 40 10 of 40 annual openings will be 90K SF Dick’s/Field and Stream combo storesSprouts 25,000 30 Opening 30 stores per year, and opening in FL and NC in 2017Michael’s 22,000 30 Opening 30 net new stores and 20 relocationsKroger 100,000 30 Opening 30 stores and relocating or expanding 60 stores in 2016Burlington 30,000 30 Opening 30 stores per year, and downsizing 70ksf boxes to 30ksfSaks Off Fifth 25,000 25 Opening 23 stores in 2016 with similar annual growth going forwardShoe Carnival 10,000 20 Opening 20 in 2016, including 6 small format storesCharming Charlie 5,000 20 Opening 6 in 2016 and 20 in 2017
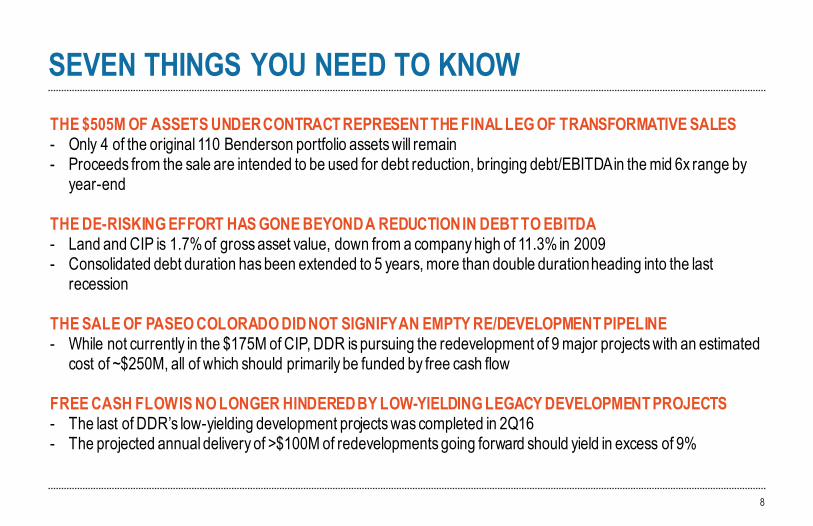
SEVEN THINGS YOU NEED TO KNOWTHE $505M OF ASSETS UNDER CONTRACT REPRESENT THE FINAL LEG OF TRANSFORMATIVE SALES- Only 4 of the original 110 Benderson portfolio assets will remain- Proceeds from the sale are intended to be used for debt reduction, bringing debt/EBITDA in the mid 6x range by
year-end
THE DE-RISKING EFFORT HAS GONE BEYOND A REDUCTION IN DEBT TO EBITDA- Land and CIP is 1.7% of gross asset value, down from a company high of 11.3% in 2009- Consolidated debt duration has been extended to 5 years, more than double duration heading into the last
recession
THE SALE OF PASEO COLORADO DID NOT SIGNIFY AN EMPTY RE/DEVELOPMENT PIPELINE- While not currently in the $175M of CIP, DDR is pursuing the redevelopment of 9 major projects with an estimated
cost of ~$250M, all of which should primarily be funded by free cash flow
FREE CASH FLOW IS NO LONGER HINDERED BY LOW-YIELDING LEGACY DEVELOPMENT PROJECTS- The last of DDR’s low-yielding development projects was completed in 2Q16- The projected annual delivery of >$100M of redevelopments going forward should yield in excess of 9%
8
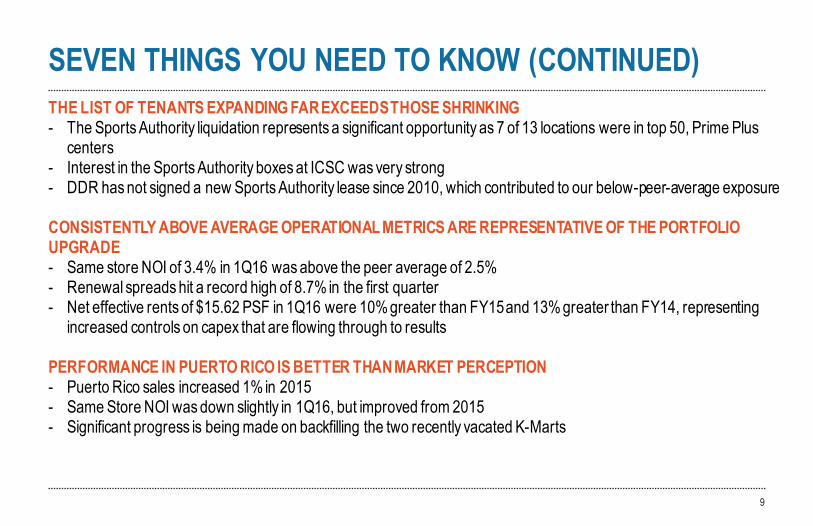
THE LIST OF TENANTS EXPANDING FAR EXCEEDS THOSE SHRINKING- The Sports Authority liquidation represents a significant opportunity as 7 of 13 locations were in top 50, Prime Plus
centers- Interest in the Sports Authority boxes at ICSC was very strong - DDR has not signed a new Sports Authority lease since 2010, which contributed to our below-peer-average exposure
CONSISTENTLY ABOVE AVERAGE OPERATIONAL METRICS ARE REPRESENTATIVE OF THE PORTFOLIO UPGRADE- Same store NOI of 3.4% in 1Q16 was above the peer average of 2.5%- Renewal spreads hit a record high of 8.7% in the first quarter- Net effective rents of $15.62 PSF in 1Q16 were 10% greater than FY15 and 13% greater than FY14, representing
increased controls on capex that are flowing through to results
PERFORMANCE IN PUERTO RICO IS BETTER THAN MARKET PERCEPTION- Puerto Rico sales increased 1% in 2015- Same Store NOI was down slightly in 1Q16, but improved from 2015- Significant progress is being made on backfilling the two recently vacated K-Marts
9
$14.89 Signed ABR on new anchors in 2015, generating 32.1% spreads
$24.65 Signed ABR on new small shop leases, generating 14.6% spreads
31.4% Total net absorption in the last five years
SEVEN THINGS YOU NEED TO KNOW (CONTINUED)
1Q16DDR 3.4%BRX 2.8%KRG 3.4%KIM 0.2%REG 3.2%RPAI 3.1%WRI 2.5%UE 2.4%FRT 2.5%Avg ex DDR 2.5%
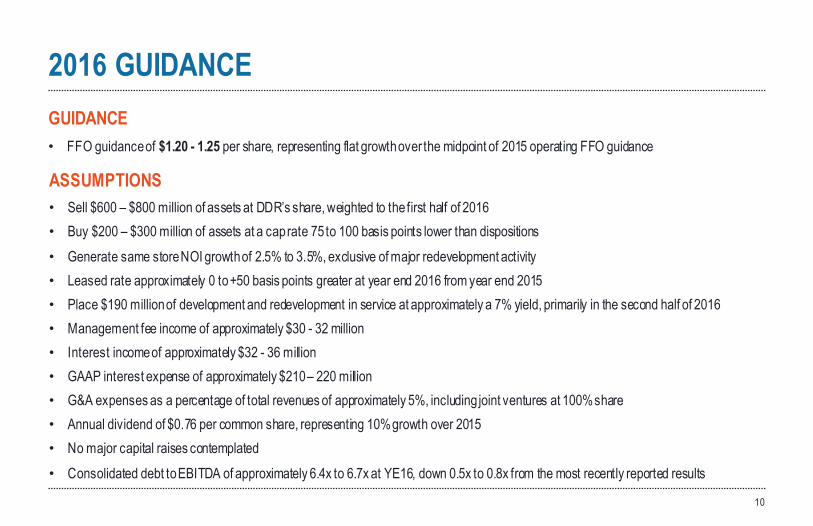
2016 GUIDANCEGUIDANCE• FFO guidance of $1.20 - 1.25 per share, representing flat growth over the midpoint of 2015 operating FFO guidance
ASSUMPTIONS• Sell $600 – $800 million of assets at DDR’s share, weighted to the first half of 2016• Buy $200 – $300 million of assets at a cap rate 75 to 100 basis points lower than dispositions• Generate same store NOI growth of 2.5% to 3.5%, exclusive of major redevelopment activity• Leased rate approximately 0 to +50 basis points greater at year end 2016 from year end 2015• Place $190 million of development and redevelopment in service at approximately a 7% yield, primarily in the second half of 2016• Management fee income of approximately $30 - 32 million• Interest income of approximately $32 - 36 million• GAAP interest expense of approximately $210 – 220 million• G&A expenses as a percentage of total revenues of approximately 5%, including joint ventures at 100% share• Annual dividend of $0.76 per common share, representing 10% growth over 2015• No major capital raises contemplated• Consolidated debt to EBITDA of approximately 6.4x to 6.7x at YE16, down 0.5x to 0.8x from the most recently reported results
10
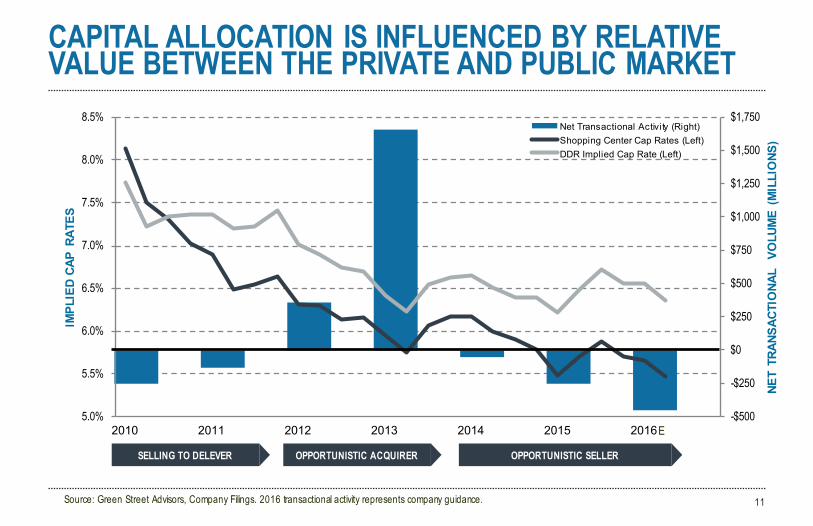
CAPITAL ALLOCATION IS INFLUENCED BY RELATIVE VALUE BETWEEN THE PRIVATE AND PUBLIC MARKET
11
OPPORTUNISTIC ACQUIRER OPPORTUNISTIC SELLERSELLING TO DELEVER
Source: Green Street Advisors, Company Filings. 2016 transactional activity represents company guidance.
-$500
-$250
$0
$250
$500
$750
$1,000
$1,250
$1,500
$1,750
5.0%
5.5%
6.0%
6.5%
7.0%
7.5%
8.0%
8.5%
2010 2011 2012 2013 2014 2015 2016
NET
TRAN
SACT
IONA
L VO
LUM
E (M
ILLI
ONS
)
IMPL
IED
CAP
RATE
S
Net Transactional Activity (Right)Shopping Center Cap Rates (Left)DDR Implied Cap Rate (Left)
E
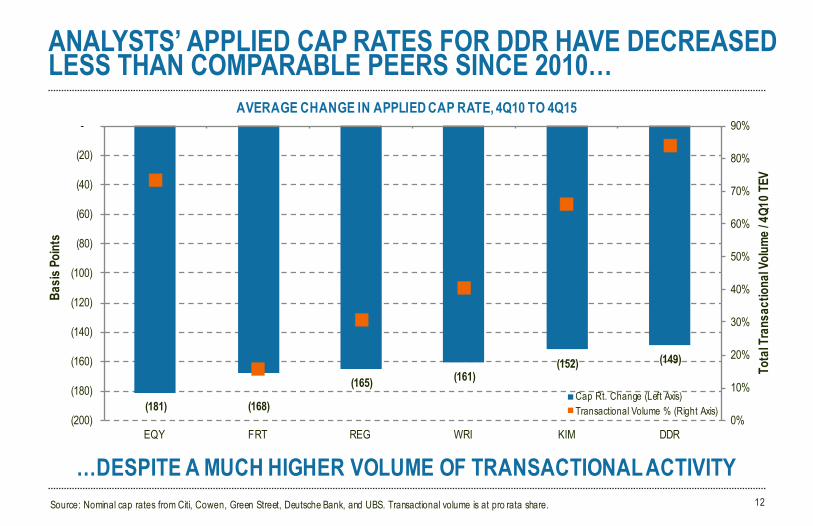
ANALYSTS’ APPLIED CAP RATES FOR DDR HAVE DECREASED LESS THAN COMPARABLE PEERS SINCE 2010…
12
(181) (168)
(165) (161)(152) (149)
0%
10%
20%
30%
40%
50%
60%
70%
80%
90%
(200)
(180)
(160)
(140)
(120)
(100)
(80)
(60)
(40)
(20)
-
EQY FRT REG WRI KIM DDR
Tota
l Tra
nsac
tiona
l Volu
me / 4
Q10 T
EV
Basis
Point
s
Cap Rt. Change (Left Axis)Transactional Volume % (Right Axis)
Source: Nominal cap rates from Citi, Cowen, Green Street, Deutsche Bank, and UBS. Transactional volume is at pro rata share.
AVERAGE CHANGE IN APPLIED CAP RATE, 4Q10 TO 4Q15
…DESPITE A MUCH HIGHER VOLUME OF TRANSACTIONAL ACTIVITY
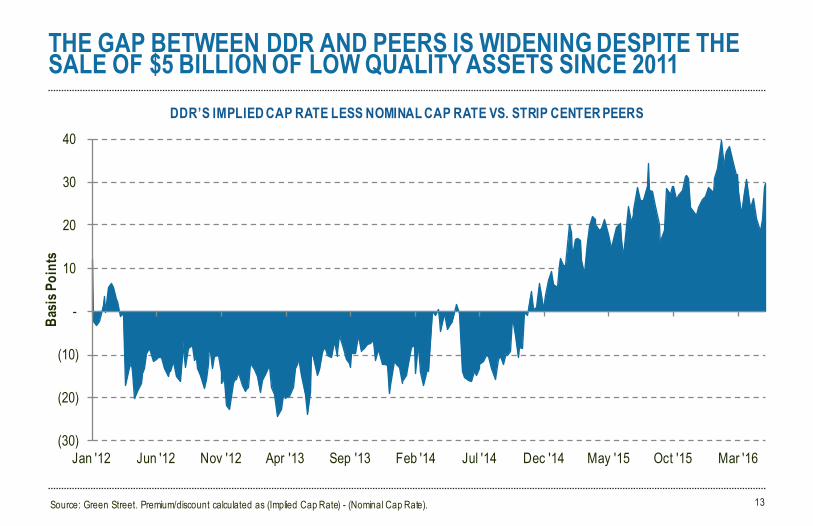
THE GAP BETWEEN DDR AND PEERS IS WIDENING DESPITE THE SALE OF $5 BILLION OF LOW QUALITY ASSETS SINCE 2011
13
DDR’S IMPLIED CAP RATE LESS NOMINAL CAP RATE VS. STRIP CENTER PEERS
Source: Green Street. Premium/discount calculated as (Implied Cap Rate) - (Nominal Cap Rate).
(30)
(20)
(10)
-
10
20
30
40
Jan '12 Jun '12 Nov '12 Apr '13 Sep '13 Feb '14 Jul '14 Dec '14 May '15 Oct '15 Mar '16
Basi
s Poi
nts
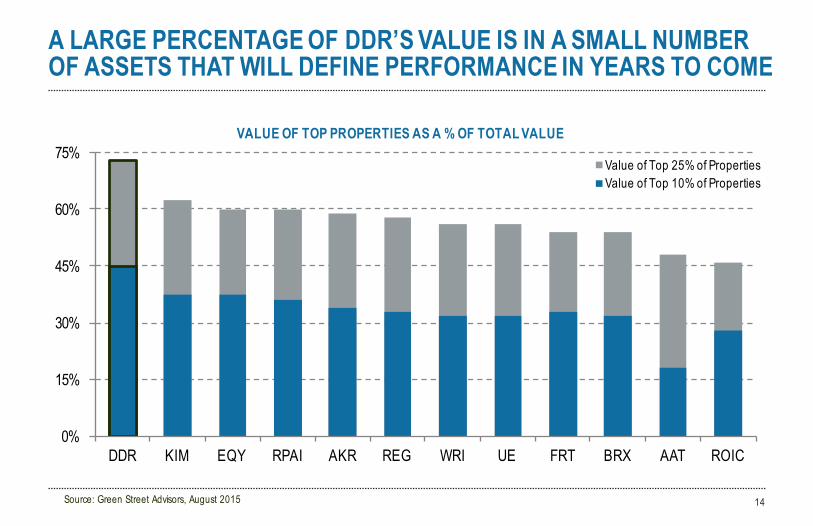
A LARGE PERCENTAGE OF DDR’S VALUE IS IN A SMALL NUMBER OF ASSETS THAT WILL DEFINE PERFORMANCE IN YEARS TO COME
14Source: Green Street Advisors, August 2015
0%
15%
30%
45%
60%
75%
DDR KIM EQY RPAI AKR REG WRI UE FRT BRX AAT ROIC
VALUE OF TOP PROPERTIES AS A % OF TOTAL VALUE
Value of Top 25% of PropertiesValue of Top 10% of Properties
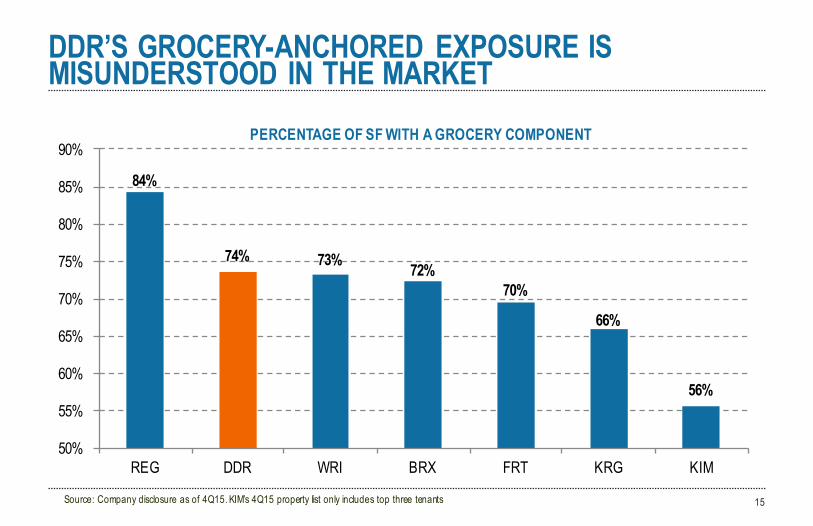
DDR’S GROCERY-ANCHORED EXPOSURE IS MISUNDERSTOOD IN THE MARKET
15
84%
74% 73% 72%70%
66%
56%
50%
55%
60%
65%
70%
75%
80%
85%
90%
REG DDR WRI BRX FRT KRG KIM
PERCENTAGE OF SF WITH A GROCERY COMPONENT
Source: Company disclosure as of 4Q15. KIM’s 4Q15 property list only includes top three tenants
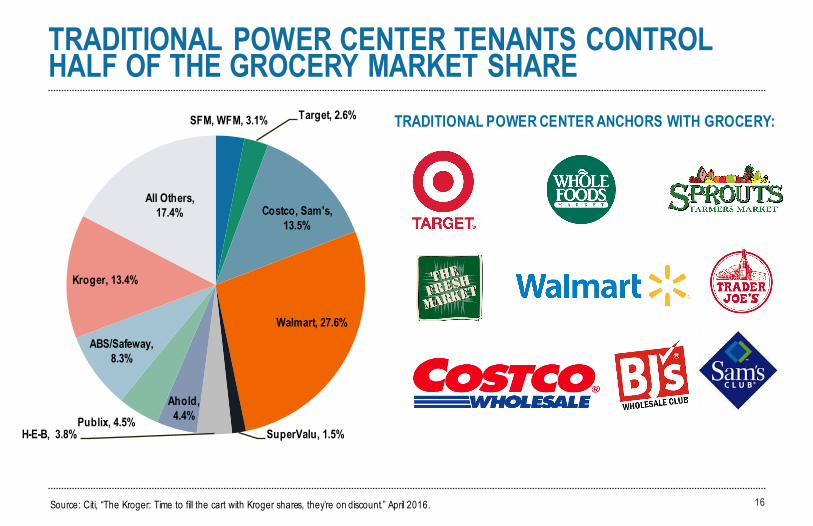
TRADITIONAL POWER CENTER TENANTS CONTROL HALF OF THE GROCERY MARKET SHARE
16
SFM, WFM, 3.1% Target, 2.6%
Costco, Sam's, 13.5%
Walmart, 27.6%
SuperValu, 1.5%H-E-B, 3.8%
Ahold, 4.4%Publix, 4.5%
ABS/Safeway, 8.3%
Kroger, 13.4%
All Others, 17.4%
Source: Citi, “The Kroger: Time to fill the cart with Kroger shares, they’re on discount.” April 2016.
TRADITIONAL POWER CENTER ANCHORS WITH GROCERY:
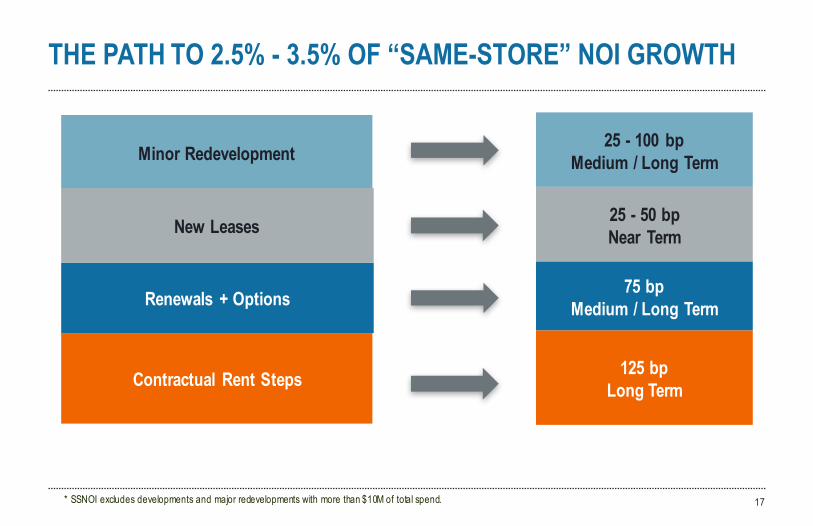
THE PATH TO 2.5% - 3.5% OF “SAME-STORE” NOI GROWTH
17
Contractual Rent Steps
Minor Redevelopment
Renewals + Options
25 - 100 bpMedium / Long Term
75 bpMedium / Long Term
125 bpLong Term
* SSNOI excludes developments and major redevelopments with more than $10M of total spend.
New Leases 25 - 50 bpNear Term
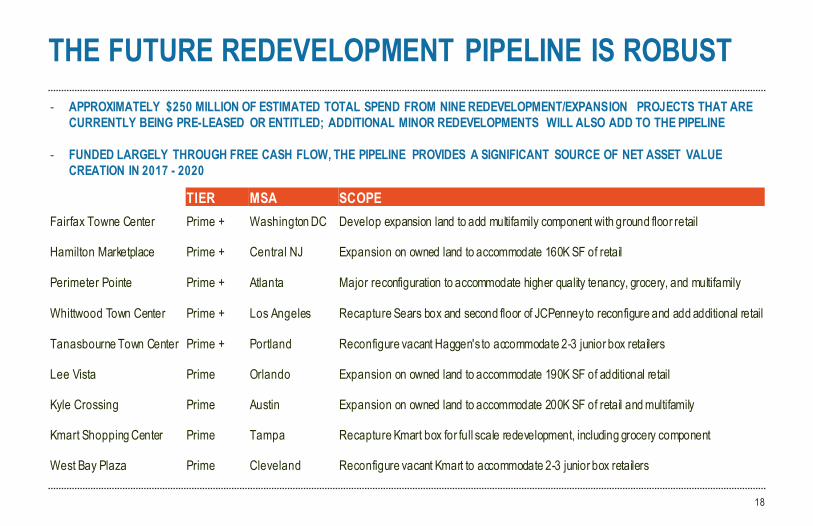
THE FUTURE REDEVELOPMENT PIPELINE IS ROBUST
18
- APPROXIMATELY $250 MILLION OF ESTIMATED TOTAL SPEND FROM NINE REDEVELOPMENT/EXPANSION PROJECTS THAT ARE CURRENTLY BEING PRE-LEASED OR ENTITLED; ADDITIONAL MINOR REDEVELOPMENTS WILL ALSO ADD TO THE PIPELINE
- FUNDED LARGELY THROUGH FREE CASH FLOW, THE PIPELINE PROVIDES A SIGNIFICANT SOURCE OF NET ASSET VALUE CREATION IN 2017 - 2020
TIER MSA SCOPEFairfax Towne Center Prime + Washington DC Develop expansion land to add multifamily component with ground floor retail
Hamilton Marketplace Prime + Central NJ Expansion on owned land to accommodate 160K SF of retail
Perimeter Pointe Prime + Atlanta Major reconfiguration to accommodate higher quality tenancy, grocery, and multifamily
Whittwood Town Center Prime + Los Angeles Recapture Sears box and second floor of JCPenneyto reconfigure and add additional retail
Tanasbourne Town Center Prime + Portland Reconfigure vacant Haggen's to accommodate 2-3 junior box retailers
Lee Vista Prime Orlando Expansion on owned land to accommodate 190K SF of additional retail
Kyle Crossing Prime Austin Expansion on owned land to accommodate 200K SF of retail and multifamily
Kmart Shopping Center Prime Tampa Recapture Kmart box for full scale redevelopment, including grocery component
West Bay Plaza Prime Cleveland Reconfigure vacant Kmart to accommodate 2-3 junior box retailers

COMPANY OVERVIEW
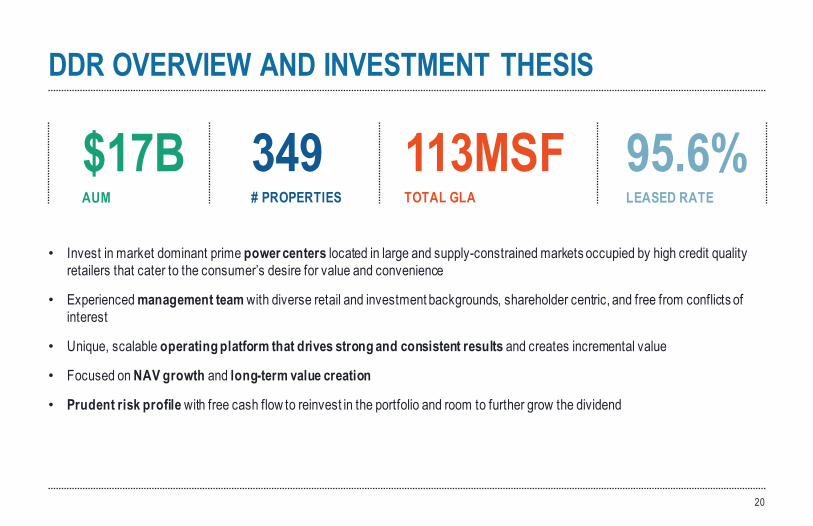
DDR OVERVIEW AND INVESTMENT THESIS
$17B 349 113MSF 95.6%AUM # PROPERTIES TOTAL GLA LEASED RATE
• Invest in market dominant prime power centers located in large and supply-constrained markets occupied by high credit quality retailers that cater to the consumer’s desire for value and convenience
• Experienced management team with diverse retail and investment backgrounds, shareholder centric, and free from conflicts of interest
• Unique, scalable operating platform that drives strong and consistent results and creates incremental value
• Focused on NAV growth and long-term value creation
• Prudent risk profile with free cash flow to reinvest in the portfolio and room to further grow the dividend
20
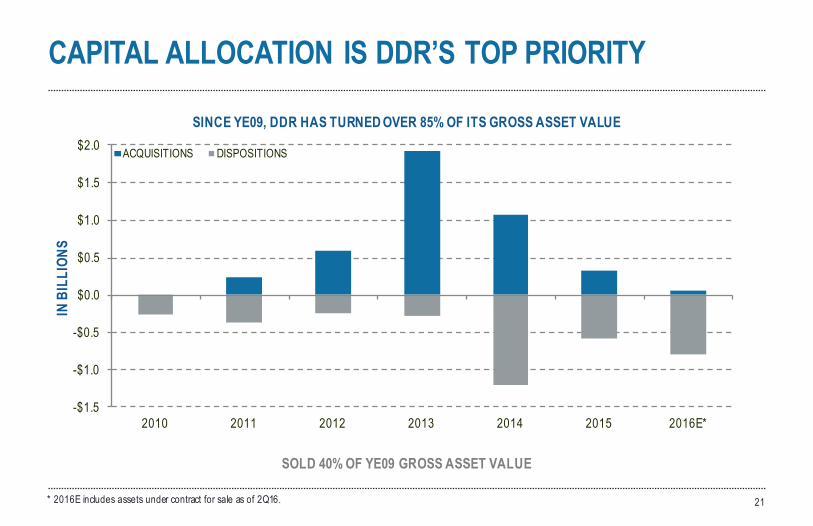
CAPITAL ALLOCATION IS DDR’S TOP PRIORITY
21
SINCE YE09, DDR HAS TURNED OVER 85% OF ITS GROSS ASSET VALUE
SOLD 40% OF YE09 GROSS ASSET VALUE
43%
36%
29%25%
-$1.5
-$1.0
-$0.5
$0.0
$0.5
$1.0
$1.5
$2.0
2010 2011 2012 2013 2014 2015 2016E*
ACQUISITIONS DISPOSITIONS
* 2016E includes assets under contract for sale as of 2Q16.
IN B
ILLI
ONS
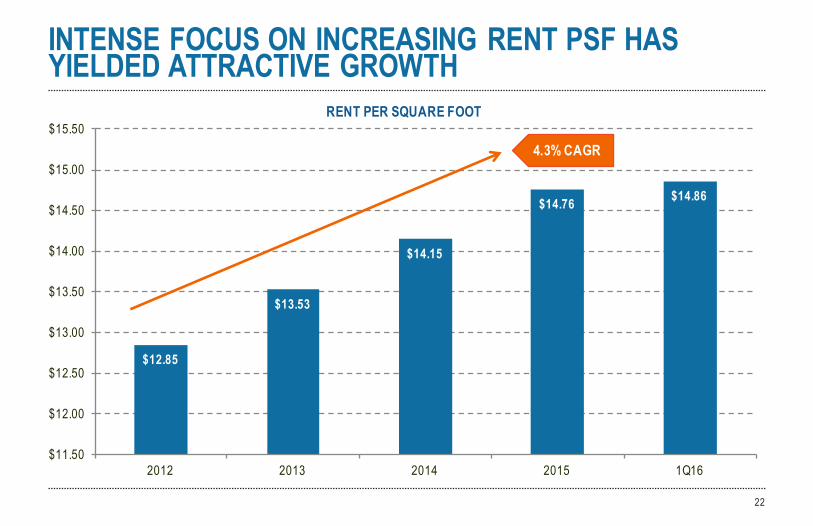
$12.85
$13.53
$14.15
$14.76 $14.86
$11.50
$12.00
$12.50
$13.00
$13.50
$14.00
$14.50
$15.00
$15.50
2012 2013 2014 2015 1Q16
INTENSE FOCUS ON INCREASING RENT PSF HAS YIELDED ATTRACTIVE GROWTH
22
RENT PER SQUARE FOOT
4.3% CAGR
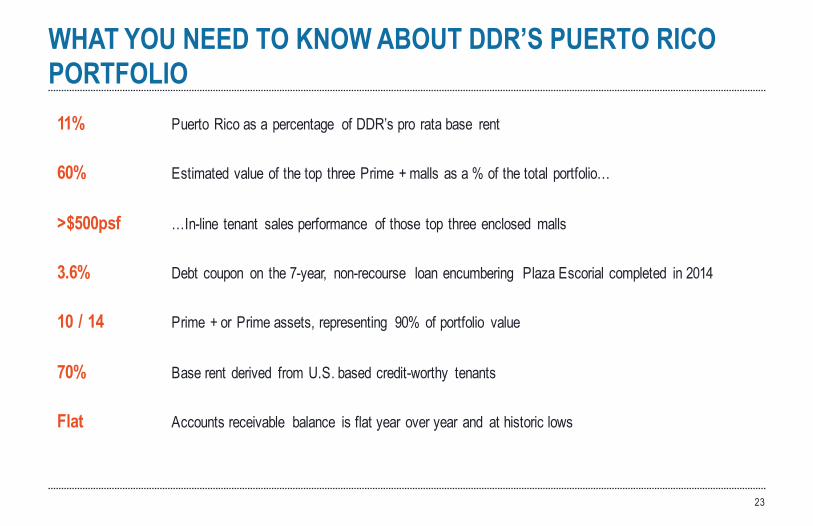
WHAT YOU NEED TO KNOW ABOUT DDR’S PUERTO RICO PORTFOLIO
23
11% Puerto Rico as a percentage of DDR’s pro rata base rent
60% Estimated value of the top three Prime + malls as a % of the total portfolio…
>$500psf …In-line tenant sales performance of those top three enclosed malls
3.6% Debt coupon on the 7-year, non-recourse loan encumbering Plaza Escorial completed in 2014
10 / 14 Prime + or Prime assets, representing 90% of portfolio value
70% Base rent derived from U.S. based credit-worthy tenants
Flat Accounts receivable balance is flat year over year and at historic lows
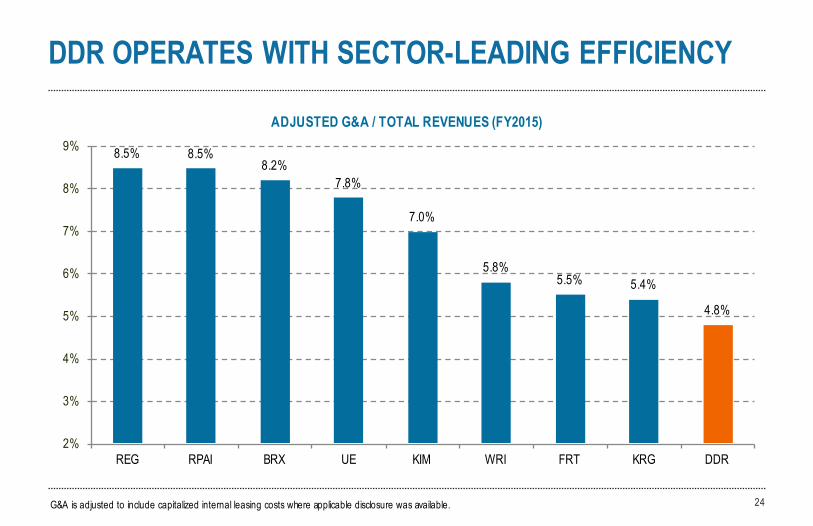
DDR OPERATES WITH SECTOR-LEADING EFFICIENCY
24
8.5% 8.5%8.2%
7.8%
7.0%
5.8%5.5% 5.4%
4.8%
2%
3%
4%
5%
6%
7%
8%
9%
REG RPAI BRX UE KIM WRI FRT KRG DDR
G&A is adjusted to include capitalized internal leasing costs where applicable disclosure was available.
ADJUSTED G&A / TOTAL REVENUES (FY2015)
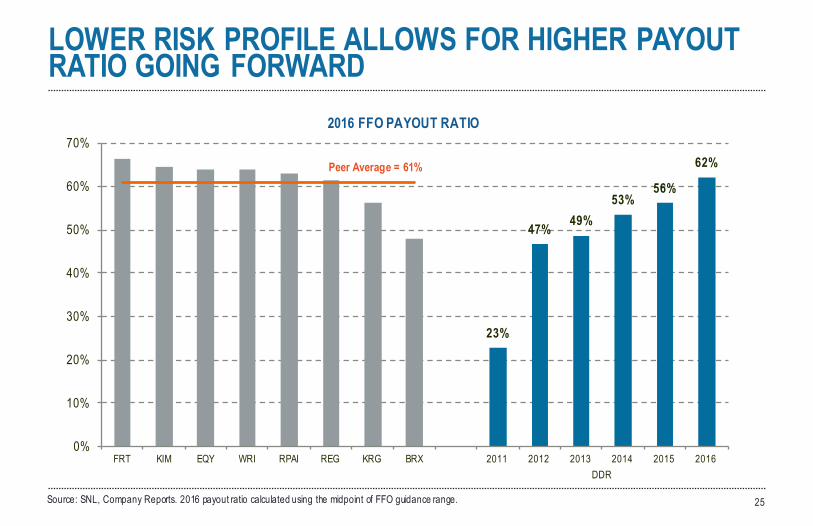
23%
47% 49%53%
56%
62%
0%
10%
20%
30%
40%
50%
60%
70%
FRT KIM EQY WRI RPAI REG KRG BRX 2011 2012 2013 2014 2015 2016
LOWER RISK PROFILE ALLOWS FOR HIGHER PAYOUT RATIO GOING FORWARD
Source: SNL, Company Reports. 2016 payout ratio calculated using the midpoint of FFO guidance range. 25
2016 FFO PAYOUT RATIO
Peer Average = 61%
DDR

THE POWER CENTER THESIS
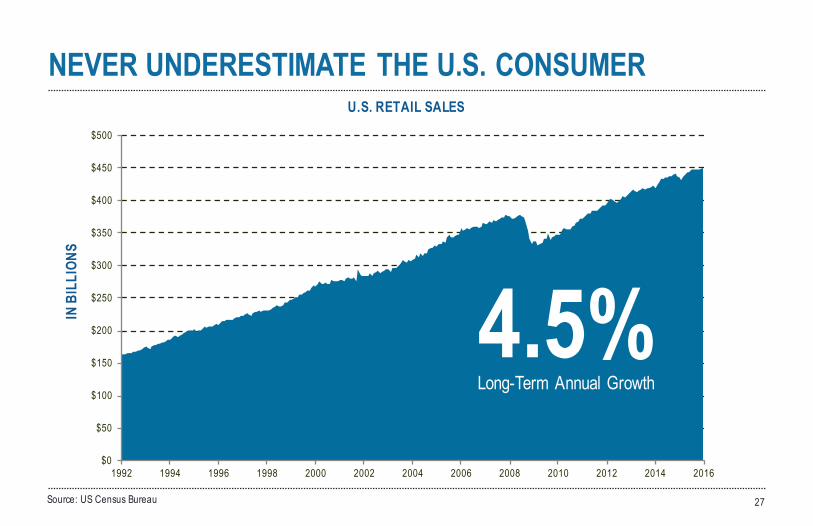
NEVER UNDERESTIMATE THE U.S. CONSUMER
Source: US Census Bureau 27
U.S. RETAIL SALES
IN B
ILLI
ONS
$0
$50
$100
$150
$200
$250
$300
$350
$400
$450
$500
1992 1994 1996 1998 2000 2002 2004 2006 2008 2010 2012 2014 2016
4.5%Long-Term Annual Growth
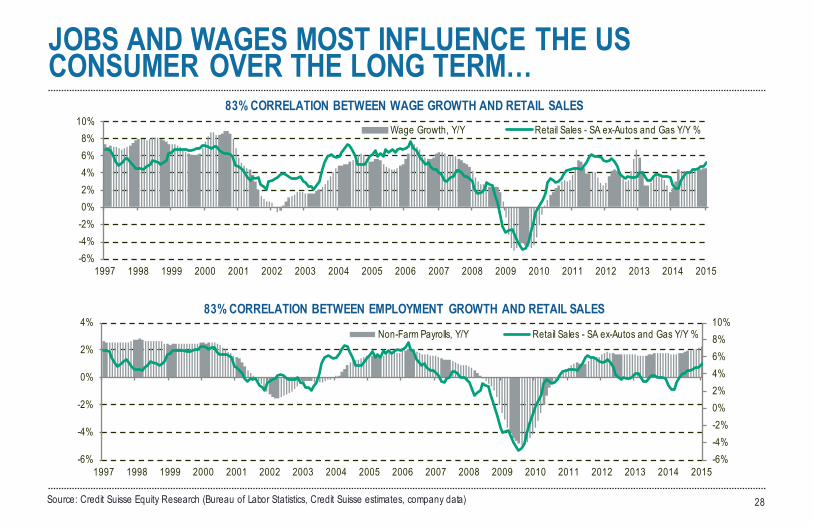
JOBS AND WAGES MOST INFLUENCE THE US CONSUMER OVER THE LONG TERM…
Source: Credit Suisse Equity Research (Bureau of Labor Statistics, Credit Suisse estimates, company data) 28
83% CORRELATION BETWEEN WAGE GROWTH AND RETAIL SALES
-6%-4%-2%0%2%4%6%8%
10%
1997 1998 1999 2000 2001 2002 2003 2004 2005 2006 2007 2008 2009 2010 2011 2012 2013 2014 2015
Wage Growth, Y/Y Retail Sales - SA ex-Autos and Gas Y/Y %
-6%-4%-2%0%2%4%6%8%10%
-6%
-4%
-2%
0%
2%
4%
1997 1998 1999 2000 2001 2002 2003 2004 2005 2006 2007 2008 2009 2010 2011 2012 2013 2014 2015
Non-Farm Payrolls, Y/Y Retail Sales - SA ex-Autos and Gas Y/Y %
83% CORRELATION BETWEEN EMPLOYMENT GROWTH AND RETAIL SALES
$31
$32
$33
$34
$35
$36
2005 2006 2007 2008 2009 2010 2011 2012 2013 2014 2015 2016TH
OUSA
NDS
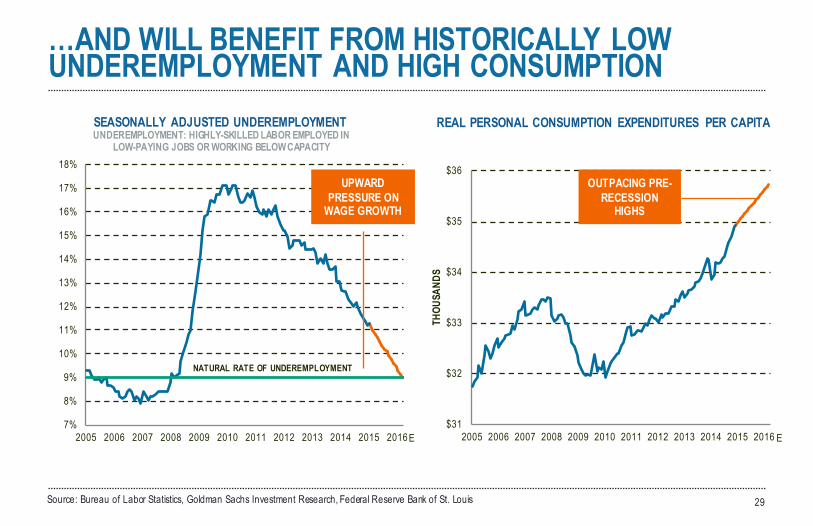
…AND WILL BENEFIT FROM HISTORICALLY LOW UNDEREMPLOYMENT AND HIGH CONSUMPTION
29Source: Bureau of Labor Statistics, Goldman Sachs Investment Research, Federal Reserve Bank of St. Louis
7%
8%
9%
10%
11%
12%
13%
14%
15%
16%
17%
18%
2005 2006 2007 2008 2009 2010 2011 2012 2013 2014 2015 2016
UPWARD PRESSURE ON
WAGE GROWTH
OUTPACING PRE-RECESSION
HIGHS
SEASONALLY ADJUSTED UNDEREMPLOYMENT REAL PERSONAL CONSUMPTION EXPENDITURES PER CAPITA
NATURAL RATE OF UNDEREMPLOYMENT
E E
UNDEREMPLOYMENT: HIGHLY-SKILLED LABOR EMPLOYED IN LOW-PAYING JOBS OR WORKING BELOW CAPACITY
35%
45%
55%
65%
2001 2002 2003 2004 2005 2006 2007 2008 2009 2010 2011 2012 2013 2014
0%
20%
40%
60%
80%
100%
1988 1990 1992 1994 1996 1998 2000 2002 2004 2006 2008 2010 2012 2014
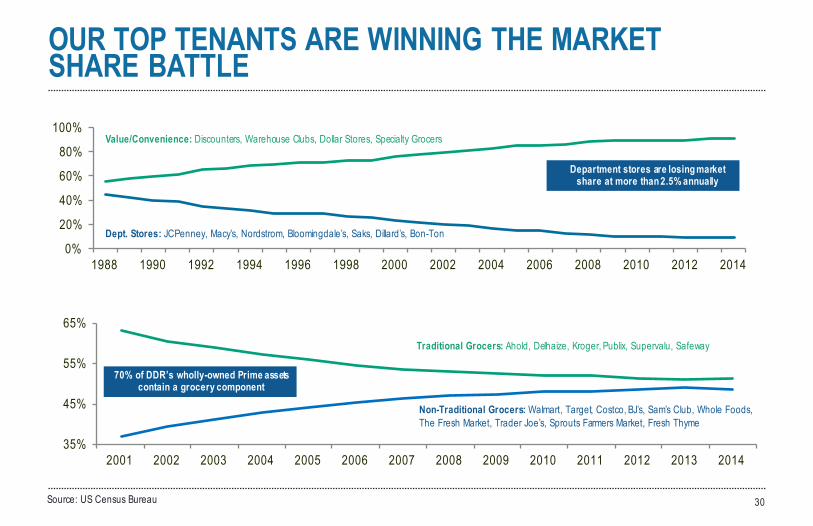
Value/Convenience: Discounters, Warehouse Clubs, Dollar Stores, Specialty Grocers
Dept. Stores: JCPenney, Macy’s, Nordstrom, Bloomingdale’s, Saks, Dillard’s, Bon-Ton
OUR TOP TENANTS ARE WINNING THE MARKETSHARE BATTLE
Source: US Census Bureau 30
Traditional Grocers: Ahold, Delhaize, Kroger, Publix, Supervalu, Safeway
Non-Traditional Grocers: Walmart, Target, Costco, BJ’s, Sam’s Club, Whole Foods,The Fresh Market, Trader Joe’s, Sprouts Farmers Market, Fresh Thyme
70% of DDR’s wholly-owned Prime assets contain a grocery component
Department stores are losing market share at more than 2.5% annually
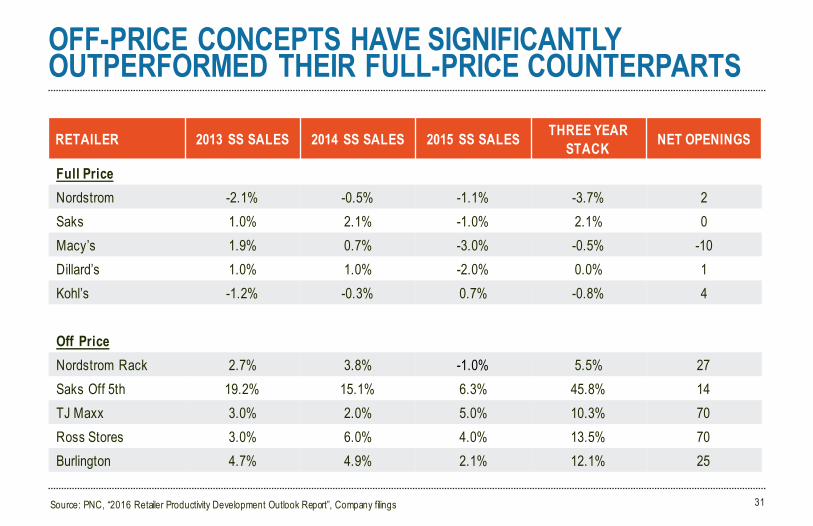
OFF-PRICE CONCEPTS HAVE SIGNIFICANTLY OUTPERFORMED THEIR FULL-PRICE COUNTERPARTS
31
RETAILER 2013 SS SALES 2014 SS SALES 2015 SS SALES THREE YEAR STACK NET OPENINGS
Full PriceNordstrom -2.1% -0.5% -1.1% -3.7% 2Saks 1.0% 2.1% -1.0% 2.1% 0Macy’s 1.9% 0.7% -3.0% -0.5% -10Dillard’s 1.0% 1.0% -2.0% 0.0% 1Kohl’s -1.2% -0.3% 0.7% -0.8% 4
Off PriceNordstrom Rack 2.7% 3.8% -1.0% 5.5% 27Saks Off 5th 19.2% 15.1% 6.3% 45.8% 14TJ Maxx 3.0% 2.0% 5.0% 10.3% 70Ross Stores 3.0% 6.0% 4.0% 13.5% 70Burlington 4.7% 4.9% 2.1% 12.1% 25
Source: PNC, “2016 Retailer Productivity Development Outlook Report”, Company filings
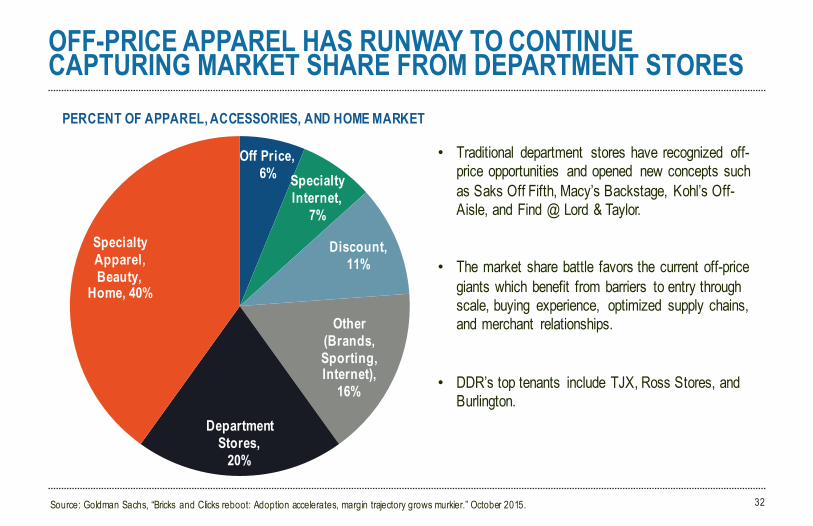
OFF-PRICE APPAREL HAS RUNWAY TO CONTINUE CAPTURING MARKET SHARE FROM DEPARTMENT STORES
32
Off Price, 6% Specialty
Internet, 7%
Discount, 11%
Other (Brands, Sporting, Internet),
16%
Department Stores,
20%
Specialty Apparel, Beauty,
Home, 40%
PERCENT OF APPAREL, ACCESSORIES, AND HOME MARKET
Source: Goldman Sachs, “Bricks and Clicks reboot: Adoption accelerates, margin trajectory grows murkier.” October 2015.
• Traditional department stores have recognized off-price opportunities and opened new concepts such as Saks Off Fifth, Macy’s Backstage, Kohl’s Off-Aisle, and Find @ Lord & Taylor.
• The market share battle favors the current off-price giants which benefit from barriers to entry through scale, buying experience, optimized supply chains, and merchant relationships.
• DDR’s top tenants include TJX, Ross Stores, and Burlington.
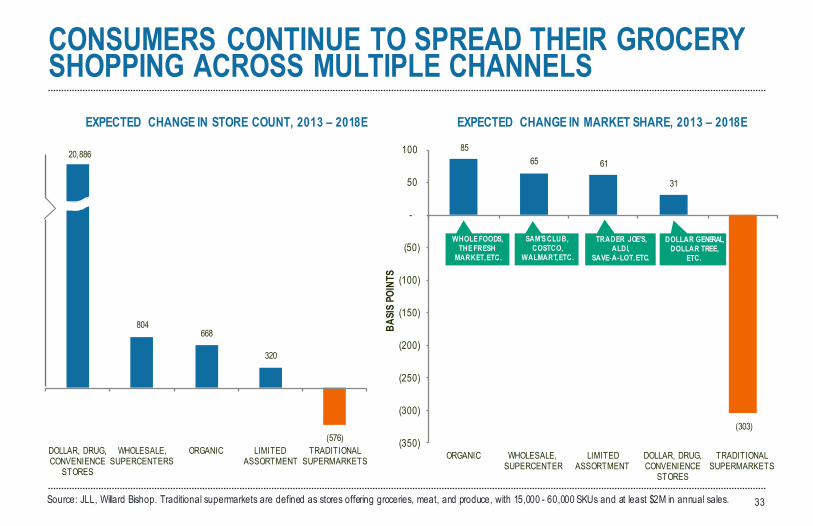
804668
320
(576)DOLLAR, DRUG, CONVENIENCE
STORES
WHOLESALE, SUPERCENTERS
ORGANIC LIMITED ASSORTMENT
TRADITIONAL SUPERMARKETS
CONSUMERS CONTINUE TO SPREAD THEIR GROCERY SHOPPING ACROSS MULTIPLE CHANNELS
33Source: JLL, Willard Bishop. Traditional supermarkets are defined as stores offering groceries, meat, and produce, with 15,000 - 60,000 SKUs and at least $2M in annual sales.
20,88685
65 61
31
(303)
(350)
(300)
(250)
(200)
(150)
(100)
(50)
-
50
100
ORGANIC WHOLESALE, SUPERCENTER
LIMITED ASSORTMENT
DOLLAR, DRUG, CONVENIENCE
STORES
TRADITIONAL SUPERMARKETS
BASI
S PO
INTS
EXPECTED CHANGE IN STORE COUNT, 2013 – 2018E EXPECTED CHANGE IN MARKET SHARE, 2013 – 2018E
TRADER JOE’S, ALDI,
SAVE-A-LOT, ETC.
SAM’S CLUB, COSTCO,
WALMART, ETC.
WHOLE FOODS, THE FRESH
MARKET, ETC.
DOLLAR GENERAL, DOLLAR TREE,
ETC.
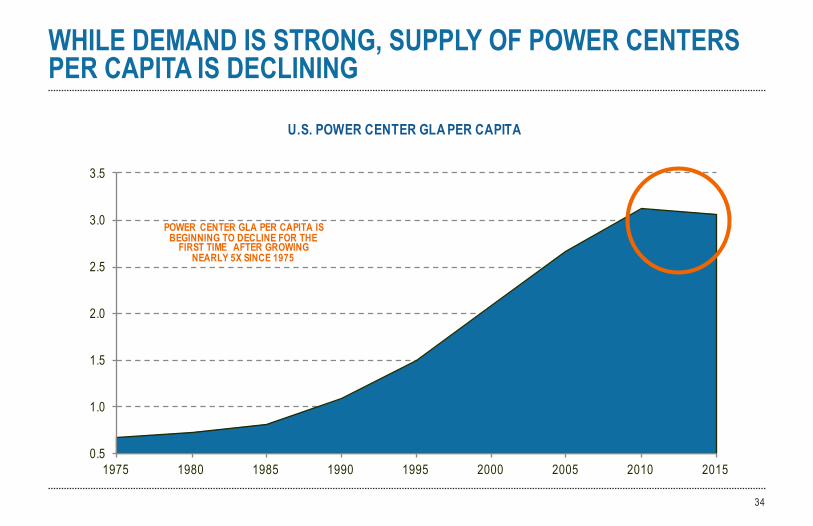
0.5
1.0
1.5
2.0
2.5
3.0
3.5
1975 1980 1985 1990 1995 2000 2005 2010 2015
WHILE DEMAND IS STRONG, SUPPLY OF POWER CENTERS PER CAPITA IS DECLINING
34
U.S. POWER CENTER GLA PER CAPITA
POWER CENTER GLA PER CAPITA IS BEGINNING TO DECLINE FOR THE
FIRST TIME AFTER GROWING NEARLY 5X SINCE 1975
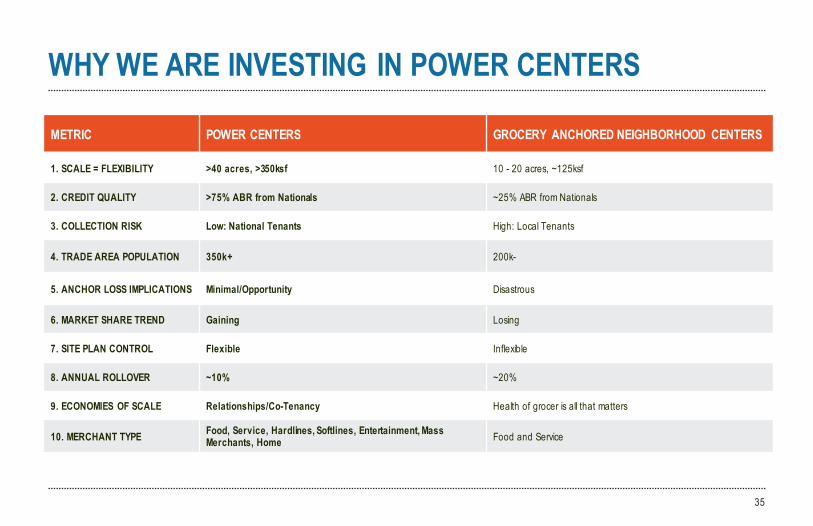
WHY WE ARE INVESTING IN POWER CENTERS
35
METRIC POWER CENTERS GROCERY ANCHORED NEIGHBORHOOD CENTERS
1. SCALE = FLEXIBILITY >40 acres, >350ksf 10 - 20 acres, ~125ksf
2. CREDIT QUALITY >75% ABR from Nationals ~25% ABR from Nationals
3. COLLECTION RISK Low: National Tenants High: Local Tenants
4. TRADE AREA POPULATION 350k+ 200k-
5. ANCHOR LOSS IMPLICATIONS Minimal/Opportunity Disastrous
6. MARKET SHARE TREND Gaining Losing
7. SITE PLAN CONTROL Flexible Inflexible
8. ANNUAL ROLLOVER ~10% ~20%
9. ECONOMIES OF SCALE Relationships/Co-Tenancy Health of grocer is all that matters
10. MERCHANT TYPE Food, Service, Hardlines, Softlines, Entertainment, Mass Merchants, Home Food and Service
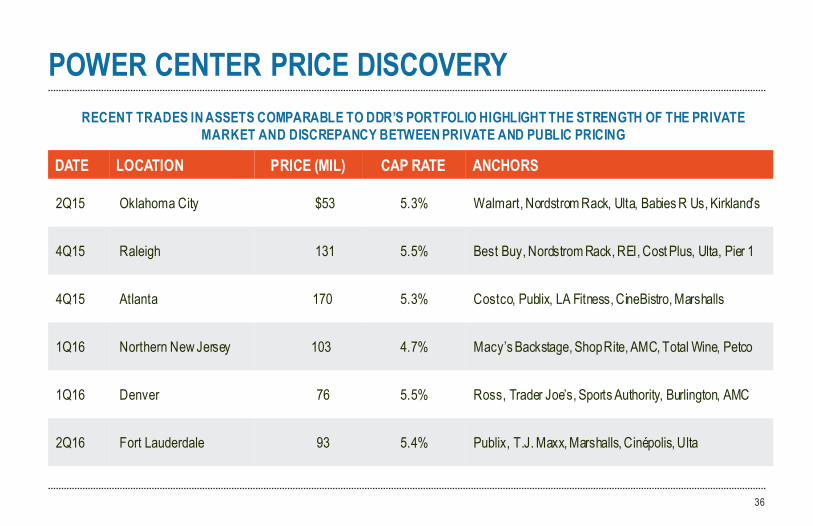
POWER CENTER PRICE DISCOVERY
36
RECENT TRADES IN ASSETS COMPARABLE TO DDR’S PORTFOLIO HIGHLIGHT THE STRENGTH OF THE PRIVATE MARKET AND DISCREPANCY BETWEEN PRIVATE AND PUBLIC PRICING
DATE LOCATION PRICE (MIL) CAP RATE ANCHORS
2Q15 Oklahoma City $53 5.3% Walmart, Nordstrom Rack, Ulta, Babies R Us, Kirkland’s
4Q15 Raleigh 131 5.5% Best Buy, Nordstrom Rack, REI, Cost Plus, Ulta, Pier 1
4Q15 Atlanta 170 5.3% Costco, Publix, LA Fitness, CineBistro, Marshalls
1Q16 Northern New Jersey 103 4.7% Macy’s Backstage, Shop Rite, AMC, Total Wine, Petco
1Q16 Denver 76 5.5% Ross, Trader Joe’s, Sports Authority, Burlington, AMC
2Q16 Fort Lauderdale 93 5.4% Publix, T.J. Maxx, Marshalls, Cinépolis, Ulta
PORTFOLIOMANAGEMENT
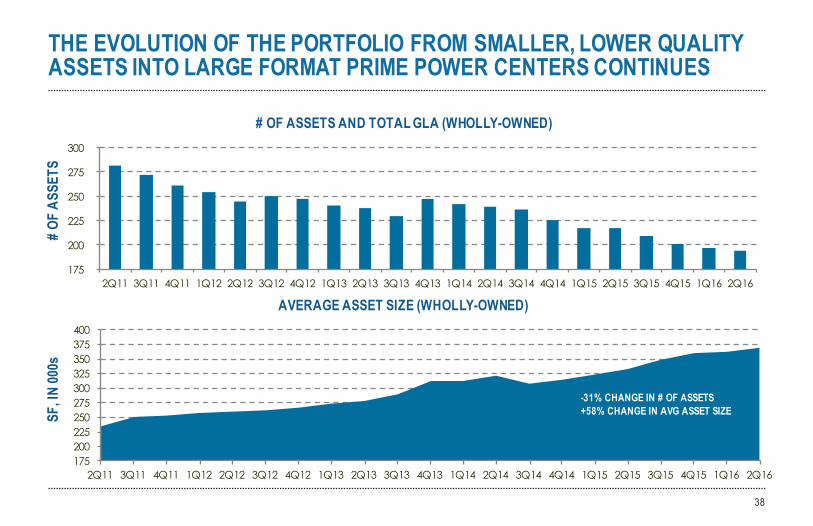
THE EVOLUTION OF THE PORTFOLIO FROM SMALLER, LOWER QUALITY ASSETS INTO LARGE FORMAT PRIME POWER CENTERS CONTINUES
38
# OF ASSETS AND TOTAL GLA (WHOLLY-OWNED)
AVERAGE ASSET SIZE (WHOLLY-OWNED)
# OF
ASS
ETS
SF, I
N 00
0s
175200225250275300325350375400
2Q11 3Q11 4Q11 1Q12 2Q12 3Q12 4Q12 1Q13 2Q13 3Q13 4Q13 1Q14 2Q14 3Q14 4Q14 1Q15 2Q15 3Q15 4Q15 1Q16 2Q16
175
200
225
250
275
300
2Q11 3Q11 4Q11 1Q12 2Q12 3Q12 4Q12 1Q13 2Q13 3Q13 4Q13 1Q14 2Q14 3Q14 4Q14 1Q15 2Q15 3Q15 4Q15 1Q16 2Q16
-31% CHANGE IN # OF ASSETS+58% CHANGE IN AVG ASSET SIZE
39
0%
5%
10%
15%
20%
25%
30%
35%
40%
45%
FRT REG WRI KRG BRX RPAI KIM DDR UE
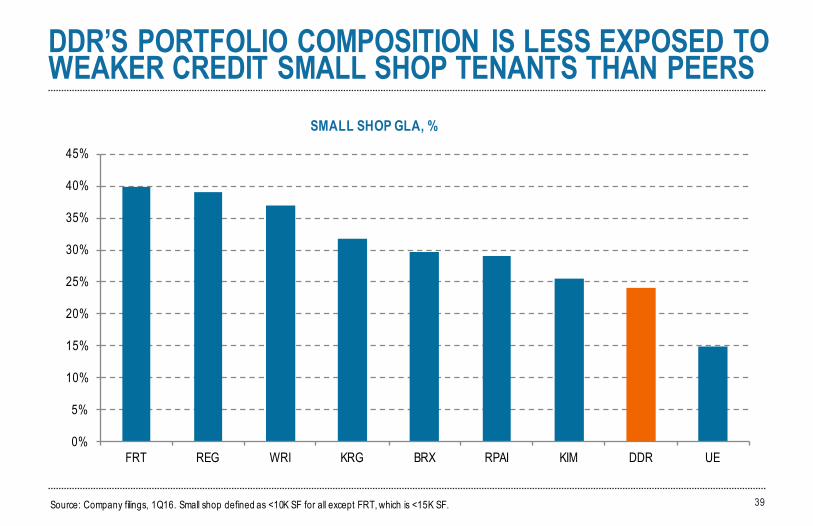
DDR’S PORTFOLIO COMPOSITION IS LESS EXPOSED TO WEAKER CREDIT SMALL SHOP TENANTS THAN PEERS
SMALL SHOP GLA, %
Source: Company filings, 1Q16. Small shop defined as <10K SF for all except FRT, which is <15K SF.
40
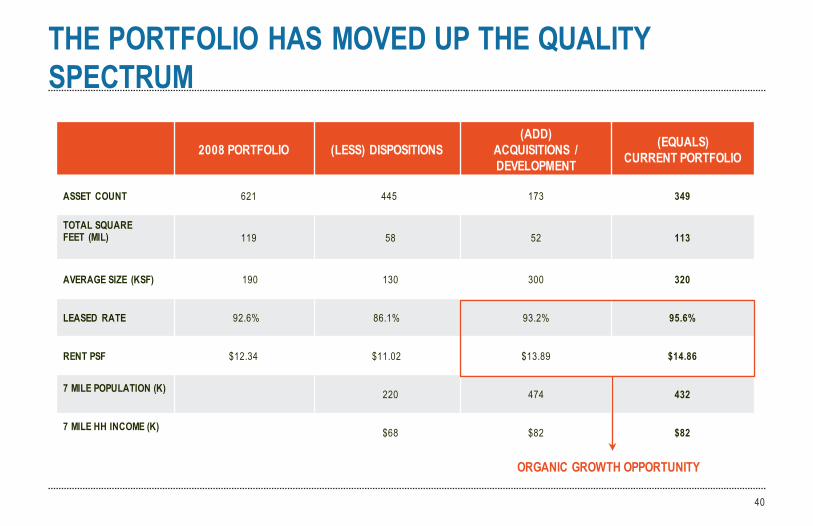
2008 PORTFOLIO (LESS) DISPOSITIONS(ADD)
ACQUISITIONS / DEVELOPMENT
(EQUALS)CURRENT PORTFOLIO
ASSET COUNT 621 445 173 349
TOTAL SQUAREFEET (MIL) 119 58 52 113
AVERAGE SIZE (KSF) 190 130 300 320
LEASED RATE 92.6% 86.1% 93.2% 95.6%
RENT PSF $12.34 $11.02 $13.89 $14.86
7 MILE POPULATION (K) 220 474 432
7 MILE HH INCOME (K) $68 $82 $82
ORGANIC GROWTH OPPORTUNITY
THE PORTFOLIO HAS MOVED UP THE QUALITY SPECTRUM
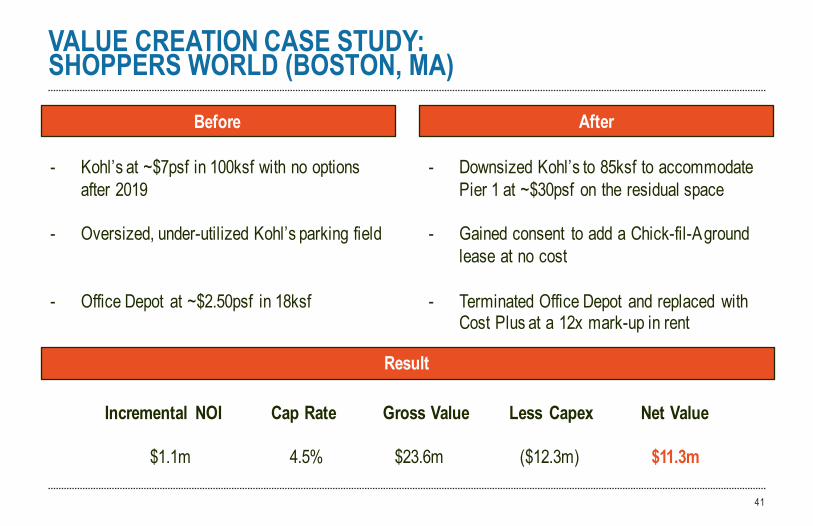
VALUE CREATION CASE STUDY:SHOPPERS WORLD (BOSTON, MA)
41
- Kohl’s at ~$7psf in 100ksf with no options after 2019
- Oversized, under-utilized Kohl’s parking field
- Office Depot at ~$2.50psf in 18ksf
Before After
- Downsized Kohl’s to 85ksf to accommodate Pier 1 at ~$30psf on the residual space
- Gained consent to add a Chick-fil-A ground lease at no cost
- Terminated Office Depot and replaced with Cost Plus at a 12x mark-up in rent
Result
Incremental NOI Cap Rate Gross Value Less Capex Net Value
$1.1m 4.5% $23.6m ($12.3m) $11.3m
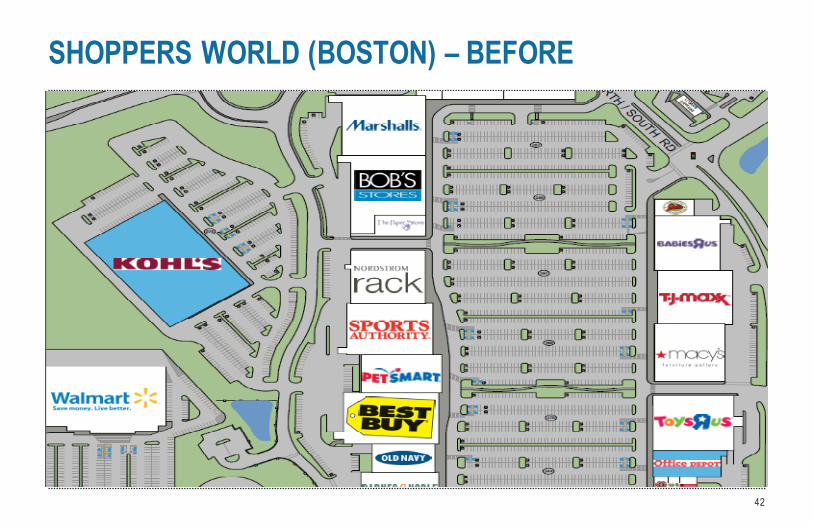
SHOPPERS WORLD (BOSTON) – BEFORE
42
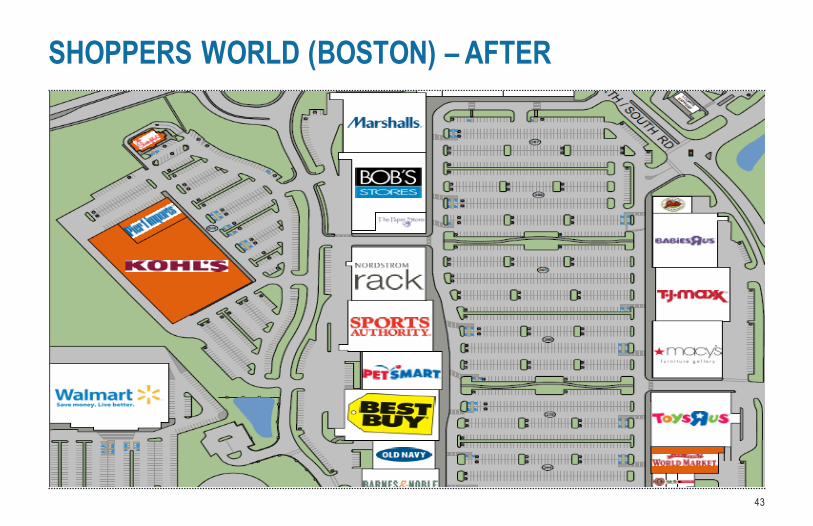
SHOPPERS WORLD (BOSTON) – AFTER
43
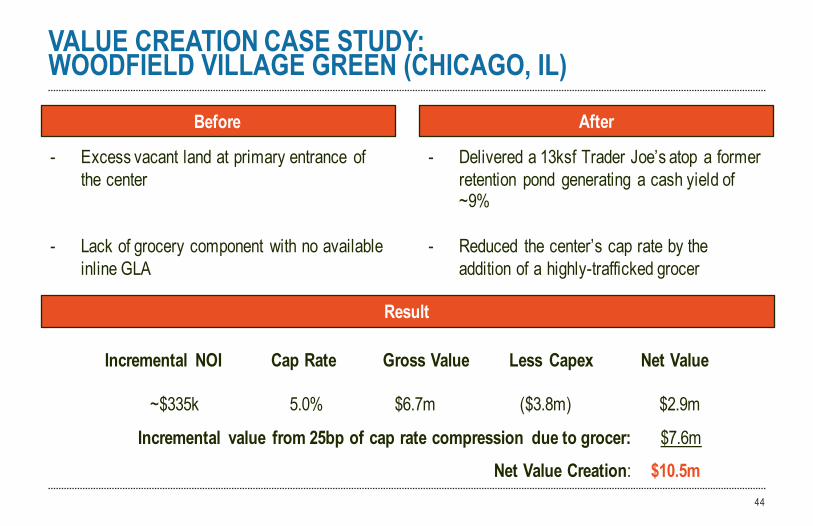
VALUE CREATION CASE STUDY:WOODFIELD VILLAGE GREEN (CHICAGO, IL)
44
- Excess vacant land at primary entrance of the center
- Lack of grocery component with no available inline GLA
Before After
- Delivered a 13ksf Trader Joe’s atop a former retention pond generating a cash yield of ~9%
- Reduced the center’s cap rate by the addition of a highly-trafficked grocer
Result
Incremental NOI Cap Rate Gross Value Less Capex Net Value
~$335k 5.0% $6.7m ($3.8m) $2.9m
Incremental value from 25bp of cap rate compression due to grocer: $7.6m
Net Value Creation: $10.5m
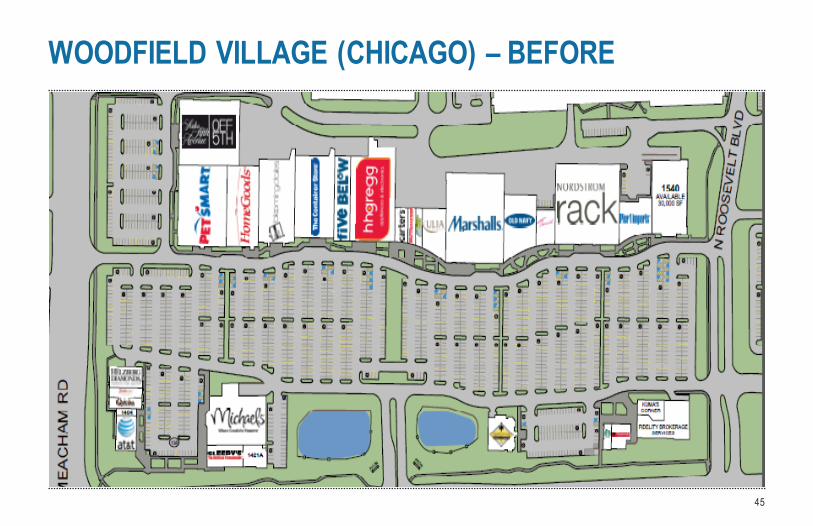
WOODFIELD VILLAGE (CHICAGO) – BEFORE
45
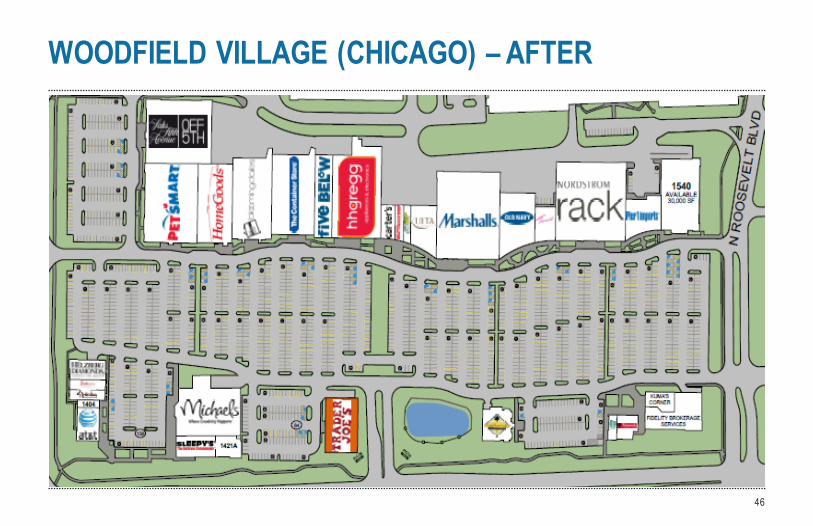
WOODFIELD VILLAGE (CHICAGO) – AFTER
46
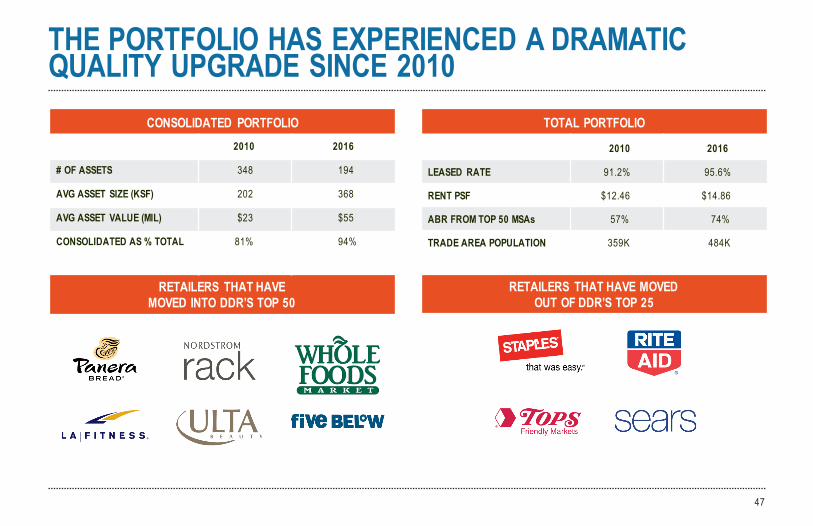
THE PORTFOLIO HAS EXPERIENCED A DRAMATICQUALITY UPGRADE SINCE 2010
47
CONSOLIDATED PORTFOLIO2010 2016
# OF ASSETS 348 194
AVG ASSET SIZE (KSF) 202 368
AVG ASSET VALUE (MIL) $23 $55
CONSOLIDATED AS % TOTAL 81% 94%
RETAILERS THAT HAVEMOVED INTO DDR’S TOP 50
TOTAL PORTFOLIO
2010 2016
LEASED RATE 91.2% 95.6%
RENT PSF $12.46 $14.86
ABR FROM TOP 50 MSAs 57% 74%
TRADE AREA POPULATION 359K 484K
RETAILERS THAT HAVE MOVEDOUT OF DDR’S TOP 25
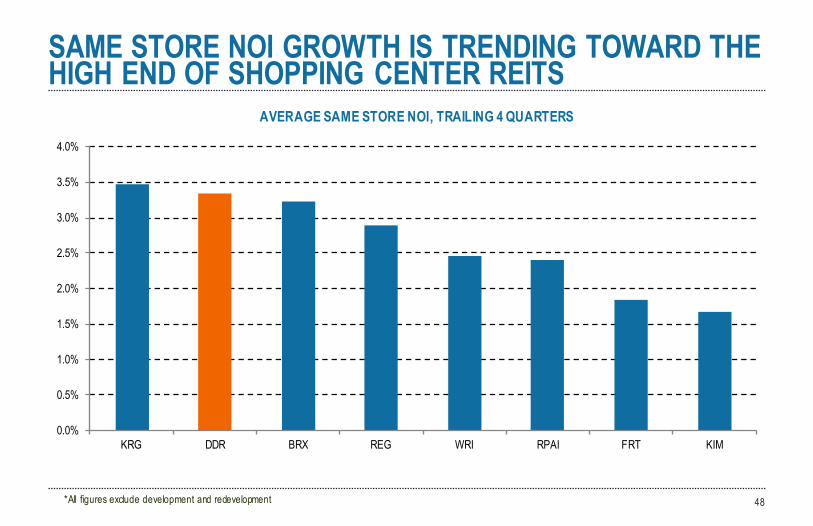
SAME STORE NOI GROWTH IS TRENDING TOWARD THE HIGH END OF SHOPPING CENTER REITS
48*All figures exclude development and redevelopment
AVERAGE SAME STORE NOI, TRAILING 4 QUARTERS
0.0%
0.5%
1.0%
1.5%
2.0%
2.5%
3.0%
3.5%
4.0%
KRG DDR BRX REG WRI RPAI FRT KIM
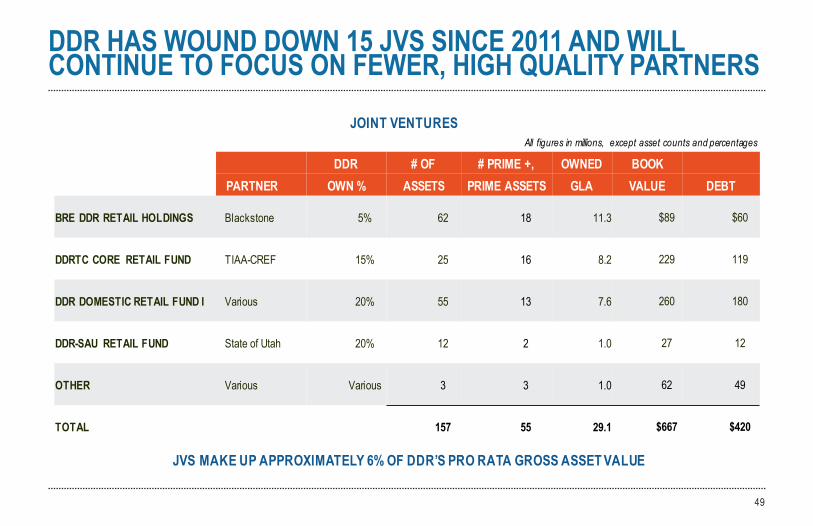
DDR HAS WOUND DOWN 15 JVS SINCE 2011 AND WILL CONTINUE TO FOCUS ON FEWER, HIGH QUALITY PARTNERS
49
JOINT VENTURES
DDR # OF # PRIME +, OWNED BOOK PARTNER OWN % ASSETS PRIME ASSETS GLA VALUE DEBT
BRE DDR RETAIL HOLDINGS Blackstone 5% 62 18 11.3 $89 $60
DDRTC CORE RETAIL FUND TIAA-CREF 15% 25 16 8.2 229 119
DDR DOMESTIC RETAIL FUND I Various 20% 55 13 7.6 260 180
DDR-SAU RETAIL FUND State of Utah 20% 12 2 1.0 27 12
OTHER Various Various 3 3 1.0 62 49
TOTAL 157 55 29.1 $667 $420
All figures in millions, except asset counts and percentages
JVS MAKE UP APPROXIMATELY 6% OF DDR’S PRO RATA GROSS ASSET VALUE

CAPITALMARKETS
$0
$200
$400
$600
$800
$1,000
$1,200
2016 2017 2018 2019 2020 2021 2022 2023 2024 2025+
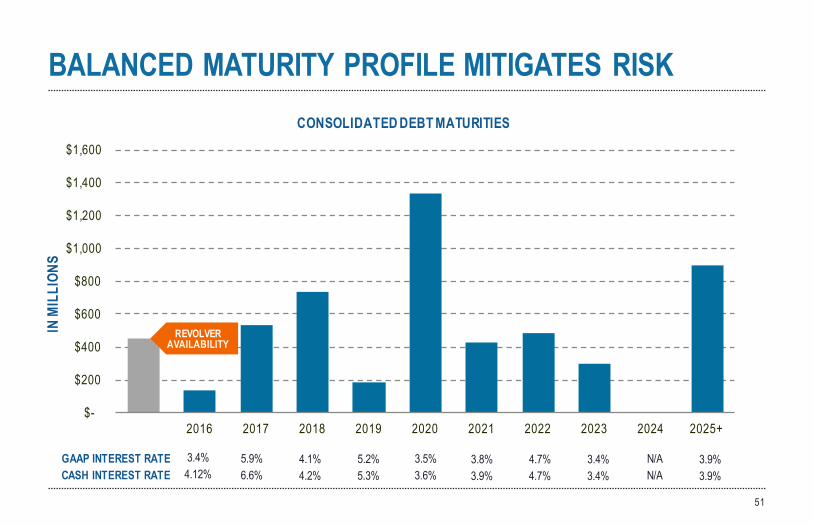
BALANCED MATURITY PROFILE MITIGATES RISKCONSOLIDATED DEBT MATURITIES
IN M
ILLI
ONS
GAAP INTEREST RATE 5.9% 4.1% 5.2% 3.5% 4.7%3.8% 3.4% N/A3.4% 3.9%CASH INTEREST RATE 6.6% 4.2% 5.3% 3.6% 4.7%3.9% 3.4% N/A4.12% 3.9%
51
$-
$200
$400
$600
$800
$1,000
$1,200
$1,400
$1,600
2016 2017 2018 2019 2020 2021 2022 2023 2024 2025+
REVOLVERAVAILABILITY
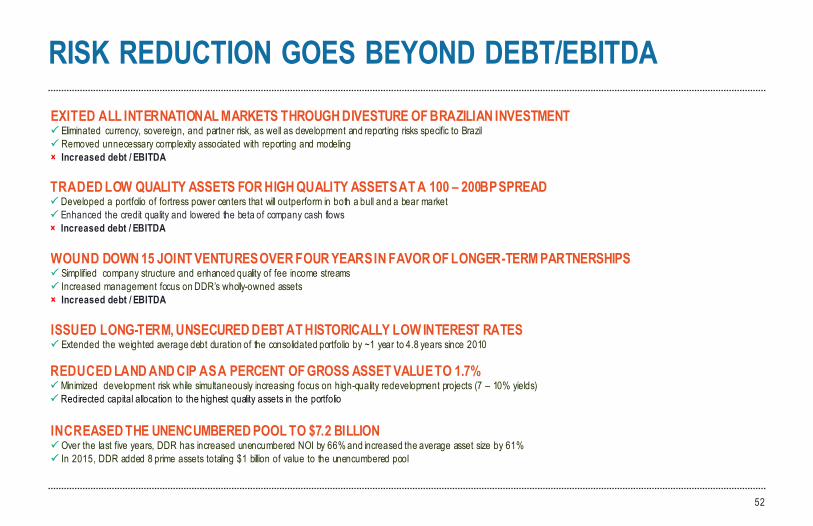
RISK REDUCTION GOES BEYOND DEBT/EBITDA
52
EXITED ALL INTERNATIONAL MARKETS THROUGH DIVESTURE OF BRAZILIAN INVESTMENTP Eliminated currency, sovereign, and partner risk, as well as development and reporting risks specific to BrazilP Removed unnecessary complexity associated with reporting and modeling × Increased debt / EBITDA
TRADED LOW QUALITY ASSETS FOR HIGH QUALITY ASSETS AT A 100 – 200BP SPREADP Developed a portfolio of fortress power centers that will outperform in both a bull and a bear marketP Enhanced the credit quality and lowered the beta of company cash flows× Increased debt / EBITDA
REDUCED LAND AND CIP AS A PERCENT OF GROSS ASSET VALUE TO 1.7%P Minimized development risk while simultaneously increasing focus on high-quality redevelopment projects (7 – 10% yields)P Redirected capital allocation to the highest quality assets in the portfolio
WOUND DOWN 15 JOINT VENTURES OVER FOUR YEARS IN FAVOR OF LONGER-TERM PARTNERSHIPSP Simplified company structure and enhanced quality of fee income streamsP Increased management focus on DDR’s wholly-owned assets× Increased debt / EBITDA
ISSUED LONG-TERM, UNSECURED DEBT AT HISTORICALLY LOW INTEREST RATESP Extended the weighted average debt duration of the consolidated portfolio by ~1 year to 4.8 years since 2010
INCREASED THE UNENCUMBERED POOL TO $7.2 BILLIONP Over the last five years, DDR has increased unencumbered NOI by 66% and increased the average asset size by 61%P In 2015, DDR added 8 prime assets totaling $1 billion of value to the unencumbered pool
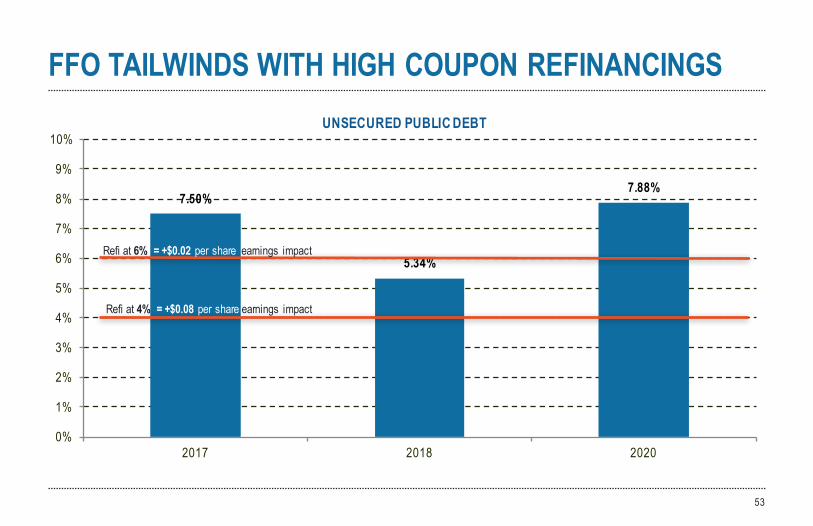
7.50%
5.34%
7.88%
0%
1%
2%
3%
4%
5%
6%
7%
8%
9%
10%
2017 2018 2020
FFO TAILWINDS WITH HIGH COUPON REFINANCINGS
53
Refi at 6% = +$0.02 per share earnings impact
Refi at 4% = +$0.08 per share earnings impact
UNSECURED PUBLIC DEBT
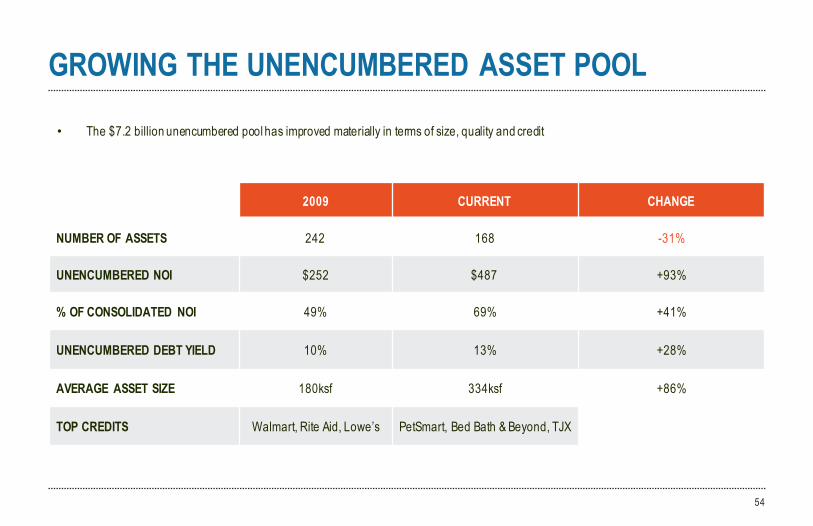
GROWING THE UNENCUMBERED ASSET POOL
54
2009 CURRENT CHANGE
NUMBER OF ASSETS 242 168 -31%
UNENCUMBERED NOI $252 $487 +93%
% OF CONSOLIDATED NOI 49% 69% +41%
UNENCUMBERED DEBT YIELD 10% 13% +28%
AVERAGE ASSET SIZE 180ksf 334ksf +86%
TOP CREDITS Walmart, Rite Aid, Lowe’s PetSmart, Bed Bath & Beyond, TJX
• The $7.2 billion unencumbered pool has improved materially in terms of size, quality and credit