dct low temperature fracture testing pilot projectdct low temperature fracture testing pilot...
TRANSCRIPT

DCT Low Temperature Fracture Testing Pilot Project
Dave Van Deusen, Principal InvestigatorO�ce of Materials and Road Research
Minnesota Department of Transportation
May 2015
Research ProjectFinal Report 2015-20

To request this document in an alternative format call 651-366-4718 or 1-800-657-3774 (Greater Minnesota) or email your request to [email protected]. Please request at least one week in advance.
Technical Report Documentation Page 1. Report No. 2. 3. Recipients Accession No. MN/RC 2015-20 4. Title and Subtitle DCT Low Temperature Fracture Testing Pilot Project
5. Report Date May 2015 6.
7. Author(s) 8. Performing Organization Report No. Luke Johanneck, Jerry Geib, Dave Van Deusen, John Garrity, Chelsea Hanson, Eshan V. Dave
9. Performing Organization Name and Address 10. Project/Task/Work Unit No. Office of Materials and Road Research Minnesota Department of Transportation St. Paul, MN 55109
11. Contract (C) or Grant (G) No.
(c) LAB2012 12. Sponsoring Organization Name and Address 13. Type of Report and Period Covered Minnesota Department of Transportation Research Services & Library 395 John Ireland Boulevard, MS 330 St. Paul, Minnesota 55155-1899
Final Report 14. Sponsoring Agency Code
15. Supplementary Notes http://www.lrrb.org/pdf/201520.pdf 16. Abstract (Limit: 250 words) This report summarizes efforts of using the disk-shaped compact tension (DCT) test to measure thermal fracture properties of asphalt mixtures on five asphalt paving projects in Minnesota during the 2013 construction season. Five construction projects throughout the state were chosen by a team of researchers at the Minnesota Department of Transportation (MnDOT) and University of Minnesota Duluth (UMD) representing differing climatic conditions, construction practices, and asphalt PG binder grades. Contractors from these varying projects provided UMD with mix design and production pills and MnDOT with loose production mix and raw materials for specimen fabrication. Testing was done to verify mixes met the required fracture energy value of 400 J/m2. If DCT results did not meet this requirement, mix adjustment recommendations were made by the research team. When recommendations were accepted, test sections with adjusted mix were paved. DCT testing was conducted on both adjusted and unadjusted production mix. Results of these efforts showed a drop in fracture energy between mix design and production for each project. The cause is not known at this time, but will be investigated in future research. Preliminary distress surveys indicated projects with mill and overlay experienced higher amounts of cracking compared to projects with reclaim or new construction. It should be noted distress surveys were conducted 9 months after initial paving, with the roadways subjected to only one season of freezing conditions. Condition of underlying pavement structure was not investigated before paving began in the cases of mill and overlays. 17. Document Analysis/Descriptors 18. Availability Statement Thermal degradation, Cracking, Fracture properties, disk-shaped compact tension (DCT) test, Asphalt pavements, Pavement design, Paving, Construction engineering
No restrictions. Document available from: National Technical Information Services, Alexandria, Virginia 22312
19. Security Class (this report) 20. Security Class (this page) 21. No. of Pages 22. Price Unclassified Unclassified 32
DCT Low Temperature Fracture Testing Pilot Project
Final Report
Prepared by:
Luke Johanneck Jerry Geib
Dave Van Deusen John Garrity
Office of Materials and Road Research Minnesota Department of Transportation
Chelsea Hanson Eshan V. Dave
Department of Civil Engineering University of Minnesota Duluth
May 2015
Published by:
Minnesota Department of Transportation Research Services & Library
395 John Ireland Boulevard, MS 330 St. Paul, MN 55155
This report represents the results of research conducted by the authors and does not necessarily represent the views or policies of the Minnesota Department of Transportation or the University of Minnesota Duluth. This report does not contain a standard or specified technique. The authors, the Minnesota Department of Transportation, and the University of Minnesota Duluth do not endorse products or manufacturers. Any trade or manufacturers’ names that may appear herein do so solely because they are considered essential to this report.

Acknowledgments The financial support provided by the MnDOT Office of Research Services is gratefully acknowledged. The authors also wish to thank the following for their generous contributions towards making this project a success:
• Minnesota Asphalt Producers and Paving Contractors • Dave Linell, MnDOT Bituminous Office • Ray Betts, MnDOT Trial Mix Laboratory • MnDOT District Construction and Materials Offices

Table of Contents Chapter 1. Introduction ......................................................................................................... 1
1.1 Background and Motivation................................................................................................................ 1
1.2 Disk-Shaped Compact Tension Test (DCT) ....................................................................................... 1
1.2.1 Sample Preparation ..................................................................................................................... 2
1.2.2 DCT Specimen Temperature Conditioning .................................................................................. 3
1.2.3 DCT Test Temperature................................................................................................................. 4
1.2.4 DCT Test Operation ..................................................................................................................... 4
1.3 Goals of the study ............................................................................................................................... 5
Chapter 2. Project Selection .................................................................................................. 6 2.1 Research Approach ............................................................................................................................. 6
2.2 Project Selection ................................................................................................................................. 6
Chapter 3. Mixture Testing and Adjustment ...................................................................... 8 3.1 Mixture testing requirements .............................................................................................................. 8
3.2 TH 56, District 6 ................................................................................................................................. 9
3.3 TH 310, District 2 ............................................................................................................................. 10
3.4 TH 10, District 3 ............................................................................................................................... 11
3.5 TH 371, District 3 ............................................................................................................................. 12
3.6 TH 69, District 6 ............................................................................................................................... 13
3.7 Summary of Results .......................................................................................................................... 14
Chapter 4. Initial Pavement Performance ......................................................................... 16 4.1 Distress Surveys ................................................................................................................................ 16
4.2 Results ............................................................................................................................................... 16
4.2.1 TH 69, Mill and Overlay ............................................................................................................ 17
4.2.2 TH 56, SFDR .............................................................................................................................. 17
4.2.3 TH 371, New Construction and Mill and Overlay ..................................................................... 18
4.2.4 TH 310, FDR and Mill and Overlay .......................................................................................... 18
4.3 Summary of Results .......................................................................................................................... 19
Chapter 5. Summary, Conclusions, and Future Work ..................................................... 21 5.1 Summary and Conclusions................................................................................................................ 21
5.2 Future and Current Work .................................................................................................................. 23
References ............................................................................................................................. 24
List of Tables
Table 2.1: Summary of Selected Projects ....................................................................................... 7 Table 3.1: Summary of results and adjustments at mix design..................................................... 15 Table 3.2: Summary of results at production. ............................................................................... 15 Table 3.3: Fracture energy changes from mix design to production. ........................................... 15 Table 3.4: Binder modifications and average fracture energies at mix design ............................. 15 Table 4.1: Percent cracking calculated by equation (conducted April 2014). .............................. 17 Table 4.2: TH 69 transverse cracking amounts. ........................................................................... 17 Table 4.3: TH 56 transverse cracking amounts. ........................................................................... 18 Table 4.4: TH 371 transverse cracking amounts. ......................................................................... 18 Table 4.5: TH 310 transverse cracking amounts. ......................................................................... 19
List of Figures Figure 1.1: Gyratory pill (left) and field core (right). ..................................................................... 2 Figure 1.2: Completed DCT specimen. .......................................................................................... 3 Figure 1.3: DCT specimen geometry (mm). ................................................................................... 3 Figure 1.4: Example of Load vs. CMOD graph.............................................................................. 5 Figure 1.5: DCT specimen ligament length (L) and width (B)....................................................... 5 Figure 2.1: Map of project locations across Minnesota. ................................................................. 7 Figure 3.1: Flowchart of mixture testing and adjustment process. ................................................. 8 Figure 3.2: TH 56 fracture energy results. .................................................................................... 10 Figure 3.3: TH 310 fracture energy results. .................................................................................. 11 Figure 3.4: TH 10 fracture energy results. .................................................................................... 12 Figure 3.5: TH 371 fracture energy results. .................................................................................. 13 Figure 3.6: TH 69 fracture energy results. .................................................................................... 14 Figure 4.1: TH 69 Mill and Overlay (represents typical cracking on mill and overlay sections) 20 Figure 4.2: TH 56 SFDR (represents typical cracking on reclaims) ............................................. 20 Figure 5.1: Summary of DCT pilot study testing. ........................................................................ 22

Executive Summary
This report summarizes efforts of using the disk-shaped compact tension (DCT) test to measure thermal fracture properties of asphalt mixtures on five asphalt paving projects in Minnesota during the 2013 construction season. Five construction projects throughout the state were chosen by a team of researchers at the Minnesota Department of Transportation (MnDOT) and University of Minnesota Duluth (UMD) representing differing climatic conditions, construction practices, and asphalt PG binder grades. Contractors from these varying projects provided UMD with mix design and production pills and MnDOT with loose production mix and raw materials for specimen fabrication. Testing was done to verify whether mixes met the required fracture energy value of 400 J/m2. If DCT results did not meet this requirement, mix adjustment recommendations were made by the research team. When recommendations were accepted, test sections with adjusted mix were paved. DCT testing was conducted on both adjusted and unadjusted production mix. Results of these efforts showed a drop in fracture energy between mix design and production for each project. The cause is not known at this time, but will be investigated in future research. Preliminary distress surveys indicated projects with mill and overlay experienced higher amounts of cracking compared to projects with reclaim or new construction. It should be noted distress surveys were conducted nine months after initial paving, with the roadways subjected to only one season of freezing conditions. Condition of underlying pavement structure was not investigated before paving began in the cases of mill and overlays.
1
Chapter 1. Introduction
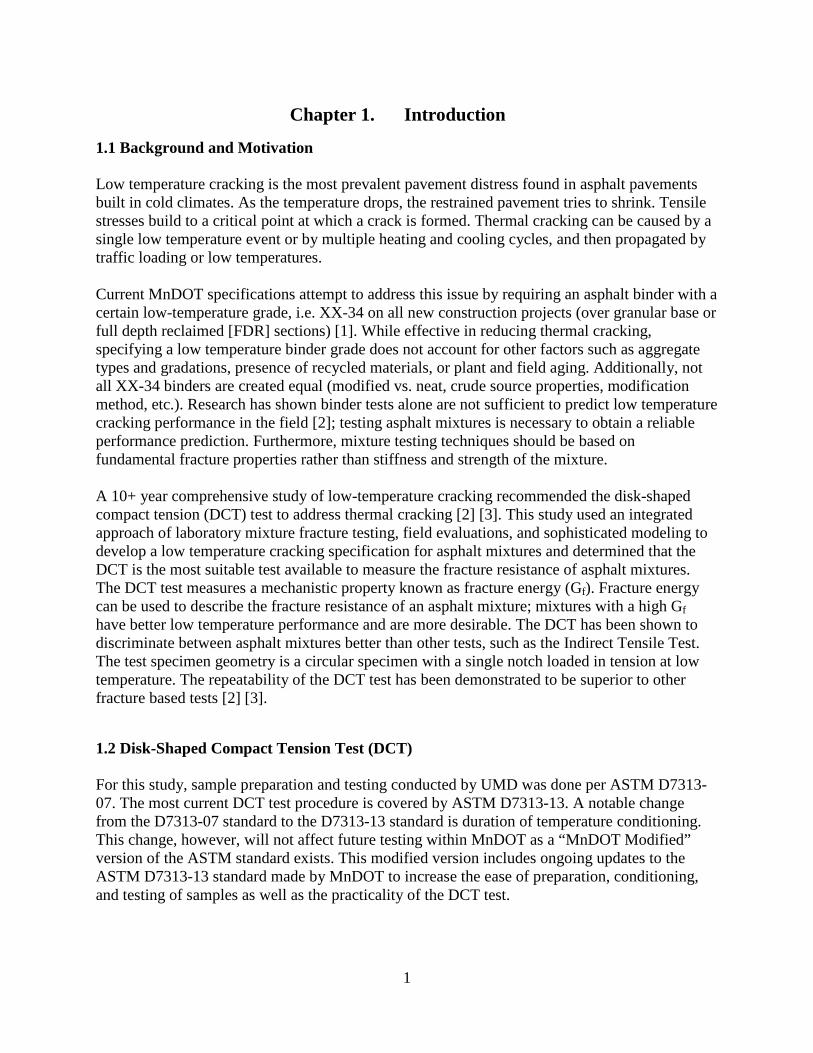
1.1 Background and Motivation Low temperature cracking is the most prevalent pavement distress found in asphalt pavements built in cold climates. As the temperature drops, the restrained pavement tries to shrink. Tensile stresses build to a critical point at which a crack is formed. Thermal cracking can be caused by a single low temperature event or by multiple heating and cooling cycles, and then propagated by traffic loading or low temperatures. Current MnDOT specifications attempt to address this issue by requiring an asphalt binder with a certain low-temperature grade, i.e. XX-34 on all new construction projects (over granular base or full depth reclaimed [FDR] sections) [1]. While effective in reducing thermal cracking, specifying a low temperature binder grade does not account for other factors such as aggregate types and gradations, presence of recycled materials, or plant and field aging. Additionally, not all XX-34 binders are created equal (modified vs. neat, crude source properties, modification method, etc.). Research has shown binder tests alone are not sufficient to predict low temperature cracking performance in the field [2]; testing asphalt mixtures is necessary to obtain a reliable performance prediction. Furthermore, mixture testing techniques should be based on fundamental fracture properties rather than stiffness and strength of the mixture. A 10+ year comprehensive study of low-temperature cracking recommended the disk-shaped compact tension (DCT) test to address thermal cracking [2] [3]. This study used an integrated approach of laboratory mixture fracture testing, field evaluations, and sophisticated modeling to develop a low temperature cracking specification for asphalt mixtures and determined that the DCT is the most suitable test available to measure the fracture resistance of asphalt mixtures. The DCT test measures a mechanistic property known as fracture energy (Gf). Fracture energy can be used to describe the fracture resistance of an asphalt mixture; mixtures with a high Gf have better low temperature performance and are more desirable. The DCT has been shown to discriminate between asphalt mixtures better than other tests, such as the Indirect Tensile Test. The test specimen geometry is a circular specimen with a single notch loaded in tension at low temperature. The repeatability of the DCT test has been demonstrated to be superior to other fracture based tests [2] [3].
1.2 Disk-Shaped Compact Tension Test (DCT) For this study, sample preparation and testing conducted by UMD was done per ASTM D7313-07. The most current DCT test procedure is covered by ASTM D7313-13. A notable change from the D7313-07 standard to the D7313-13 standard is duration of temperature conditioning. This change, however, will not affect future testing within MnDOT as a “MnDOT Modified” version of the ASTM standard exists. This modified version includes ongoing updates to the ASTM D7313-13 standard made by MnDOT to increase the ease of preparation, conditioning, and testing of samples as well as the practicality of the DCT test.
2
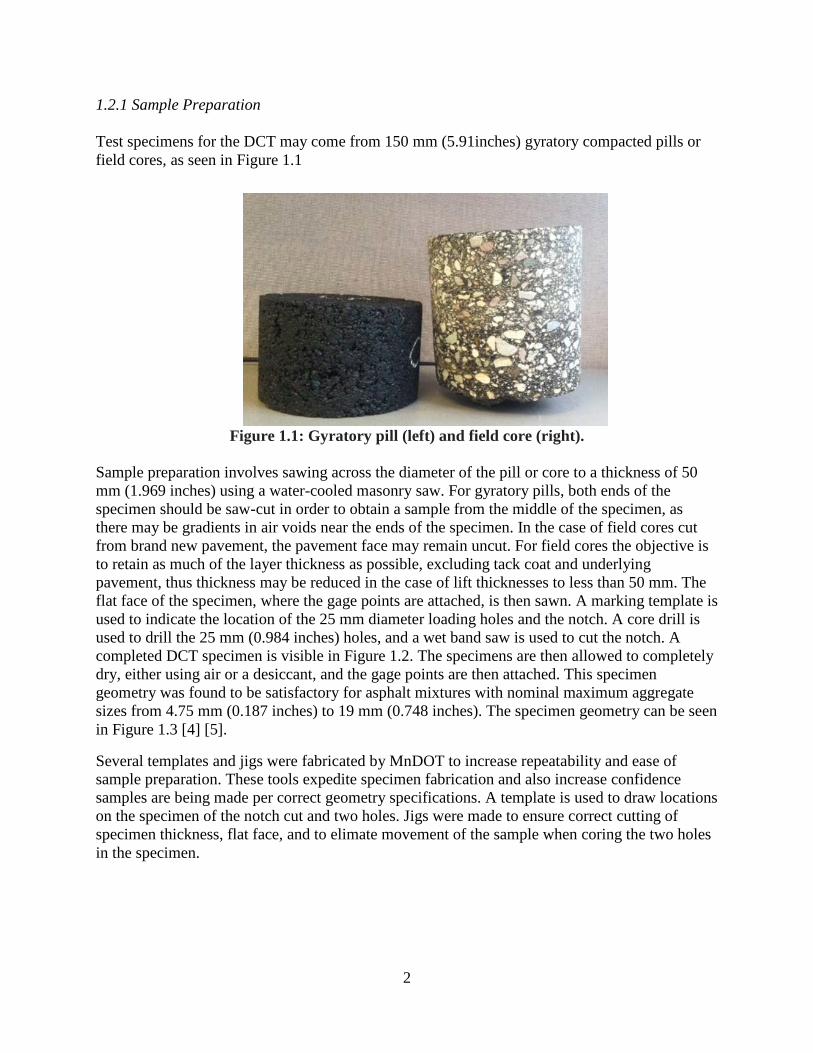
1.2.1 Sample Preparation Test specimens for the DCT may come from 150 mm (5.91inches) gyratory compacted pills or field cores, as seen in Figure 1.1
Figure 1.1: Gyratory pill (left) and field core (right).
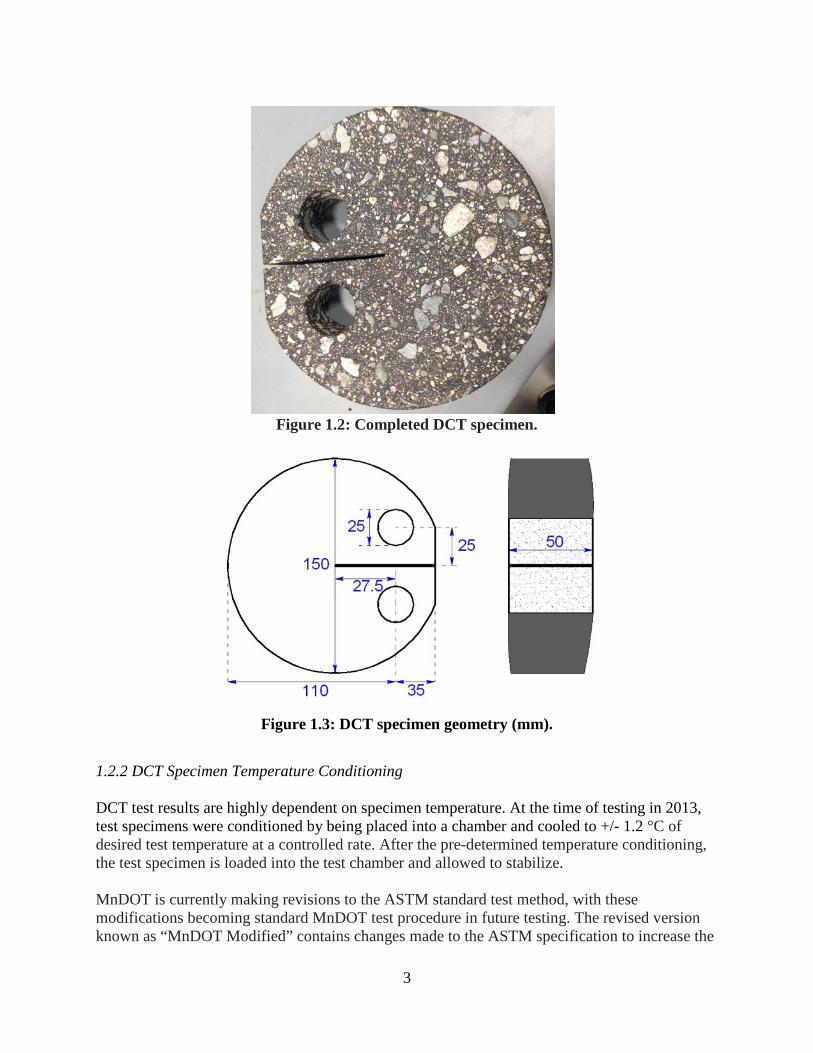
Sample preparation involves sawing across the diameter of the pill or core to a thickness of 50 mm (1.969 inches) using a water-cooled masonry saw. For gyratory pills, both ends of the specimen should be saw-cut in order to obtain a sample from the middle of the specimen, as there may be gradients in air voids near the ends of the specimen. In the case of field cores cut from brand new pavement, the pavement face may remain uncut. For field cores the objective is to retain as much of the layer thickness as possible, excluding tack coat and underlying pavement, thus thickness may be reduced in the case of lift thicknesses to less than 50 mm. The flat face of the specimen, where the gage points are attached, is then sawn. A marking template is used to indicate the location of the 25 mm diameter loading holes and the notch. A core drill is used to drill the 25 mm (0.984 inches) holes, and a wet band saw is used to cut the notch. A completed DCT specimen is visible in Figure 1.2. The specimens are then allowed to completely dry, either using air or a desiccant, and the gage points are then attached. This specimen geometry was found to be satisfactory for asphalt mixtures with nominal maximum aggregate sizes from 4.75 mm (0.187 inches) to 19 mm (0.748 inches). The specimen geometry can be seen in Figure 1.3 [4] [5].
Several templates and jigs were fabricated by MnDOT to increase repeatability and ease of sample preparation. These tools expedite specimen fabrication and also increase confidence samples are being made per correct geometry specifications. A template is used to draw locations on the specimen of the notch cut and two holes. Jigs were made to ensure correct cutting of specimen thickness, flat face, and to elimate movement of the sample when coring the two holes in the specimen.
3
Figure 1.2: Completed DCT specimen.
Figure 1.3: DCT specimen geometry (mm).
1.2.2 DCT Specimen Temperature Conditioning DCT test results are highly dependent on specimen temperature. At the time of testing in 2013, test specimens were conditioned by being placed into a chamber and cooled to +/- 1.2 °C of desired test temperature at a controlled rate. After the pre-determined temperature conditioning, the test specimen is loaded into the test chamber and allowed to stabilize. MnDOT is currently making revisions to the ASTM standard test method, with these modifications becoming standard MnDOT test procedure in future testing. The revised version known as “MnDOT Modified” contains changes made to the ASTM specification to increase the

4
ease and practicality of testing, most notably for the temperature conditioning portion of testing. No changes will be made to the fracture energy threshold value of 400 J/m2.
1.2.3 DCT Test Temperature Standard test temperature for DCT specimens was recommended by the pooled-fund studies to be 10°C warmer than the PG low temperature limit. [2] [3] However, for the test temperature to more accurately reflect the actual environment the pavement will be exposed to when placed in the field, temperature for DCT testing in this study was recommended to be 10 °C warmer than the asphalt binder PGLT required for 98% reliability as determined by LTPPBind 3.1 software. For example, for a location requiring PG XX-34 binder, test temperature would be -24 °C.
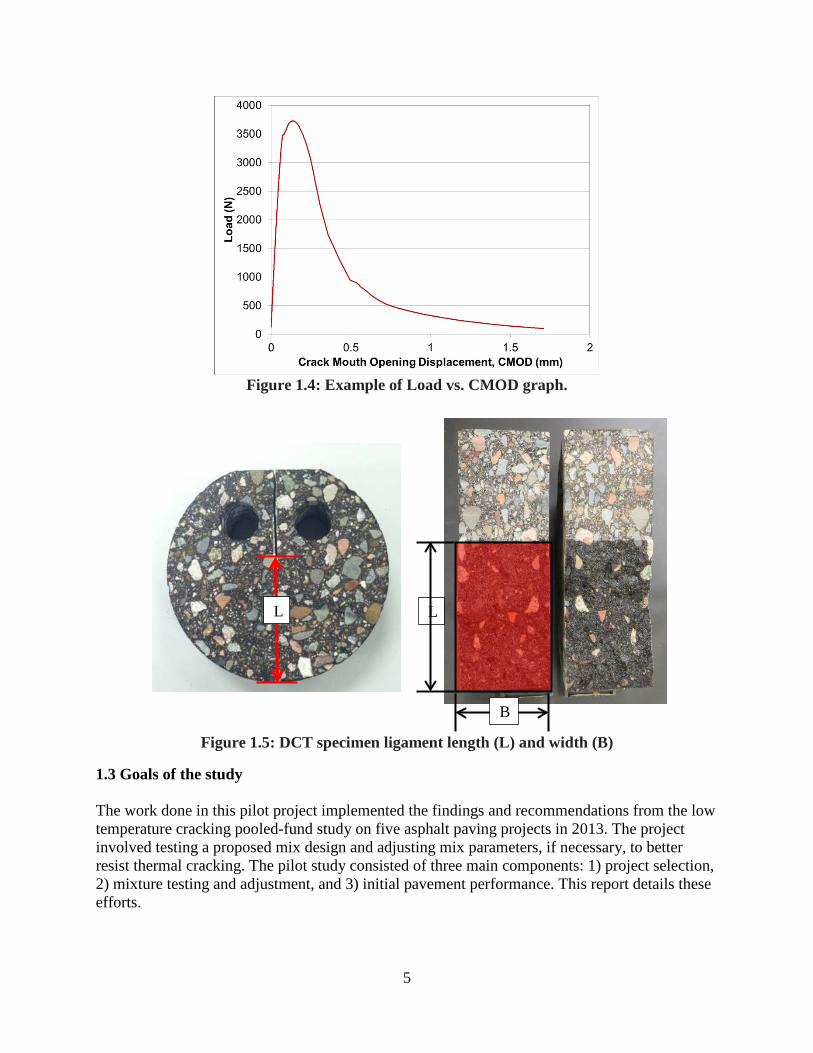
1.2.4 DCT Test Operation The DCT test is controlled by a constant crack mouth opening displacement (CMOD) rate of 0.017 mm/s (approximately 1.0 mm/min). This loading rate is fast enough to essentially eliminate the majority of creep behavior of the mixture during testing [4] [6] [7]. Data essential to the calculation of fracture energy are load and CMOD. Load is plotted vs. CMOD, with the area under the curve being fracture work; when normalized for specimen thickness and initial ligament length, area under the load vs. CMOD curve is known as fracture energy. Specimen thickness and initial ligament length are measured prior to DCT testing of the sample. A specimen before and after testing with these measurements illustrated can be seen in Figure 1.5, with L indicating ligament length (straight line measured from end of notch where cracking is initiated to the edge of specimen) and B indicating thickness of specimen. An example of load vs. CMOD plot can be seen in Figure 1.4. Fracture energy is the energy required to create a unit surface fracture of the asphalt mixture. After testing, the specimen is pulled apart to view the path of crack propagation.
5
Figure 1.4: Example of Load vs. CMOD graph.
L
B
L
Figure 1.5: DCT specimen ligament length (L) and width (B)
1.3 Goals of the study The work done in this pilot project implemented the findings and recommendations from the low temperature cracking pooled-fund study on five asphalt paving projects in 2013. The project involved testing a proposed mix design and adjusting mix parameters, if necessary, to better resist thermal cracking. The pilot study consisted of three main components: 1) project selection, 2) mixture testing and adjustment, and 3) initial pavement performance. This report details these efforts.
6
Chapter 2. Project Selection
2.1 Research Approach The goal of this study was to incorporate low temperature performance specifications recommended from the Low Temperature Cracking Pooled-Fund Studies into practice on 3 to 5 bituminous paving projects. The feasibility of implementing the DCT test as a performance specification in Minnesota was assessed, while noting successes and challenges associated with implementation.
MnDOT District Materials Engineers were contacted in order to help identify upcoming construction projects that had a significant amount of bituminous mainline paving to be constructed in 2013. The focus was on new construction (over granular base or full depth reclamation), as the performance specifications were based on new construction projects, i.e. no pre-existing distresses were present. However, mill and overlay projects were also considered, as there was not an overabundance of new construction projects to choose from. Additionally, the research staff wanted to assess whether the recommended fracture energy levels for new construction would also be validated on mill and overlay construction projects. The research staff wanted to incorporate the DCT specification on a variety of construction types, binders, and climatic regions. The pilot project required the contractor to provide test pills at the mix design stage. It was decided mix design pills for testing would be compacted to the same specifications as tensile strength ratio (TSR) specimens (6 inch diameter, 4 inch thickness, and 7% air voids ± 0.5) since the contractor was already fabricating TSR pills. Little additional work was needed to compact four additional specimens as the amount of material needed to fabricate samples was already known. The mix design pills were then tested at the University of Minnesota Duluth (UMD) to verify that the proposed mix designs met the newly proposed fracture energy requirement. If the pills did not meet the minimum fracture energy value of 400 J/m2, mixture adjustment recommendations were made by the research team, and the contractor adjusted the mix accordingly. Any increased costs incurred for materials were compensated through Destination Innovation funds secured by the research team – neither the Districts nor the Contractor were responsible for the expense of mixture adjustments.
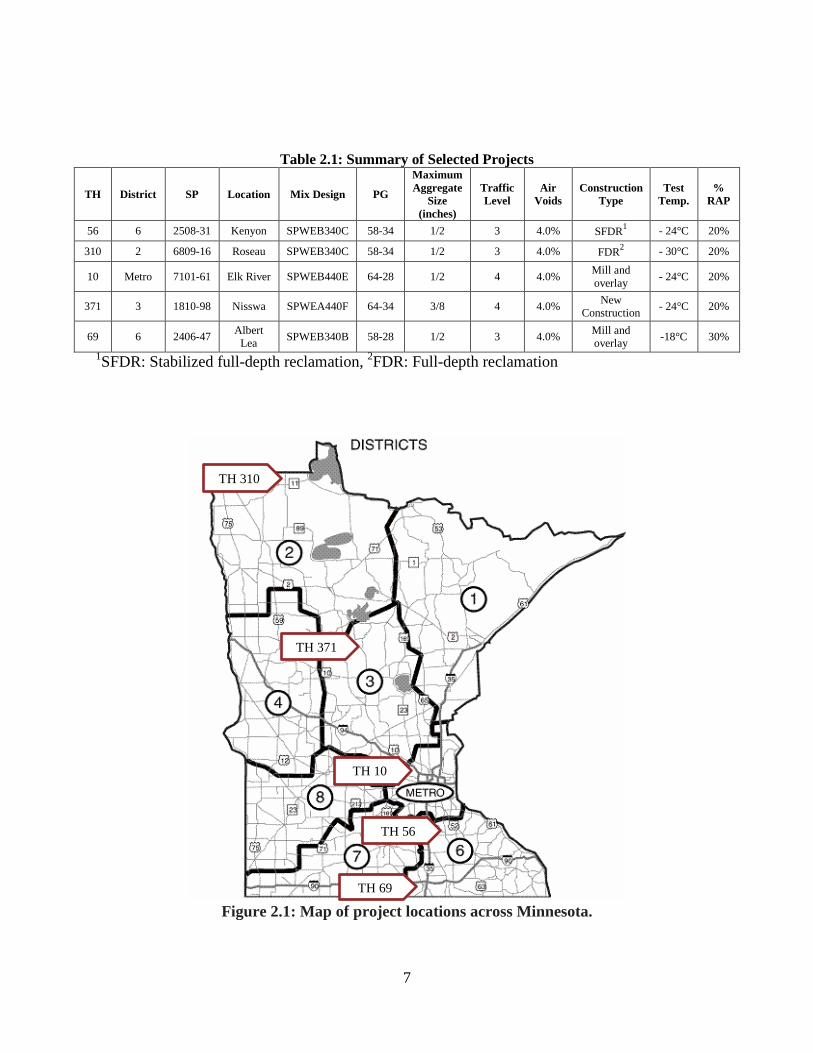
2.2 Project Selection After consulting with materials engineers, project engineers, and contractors, five construction projects, as seen in Table 2.1, were selected for the low temperature fracture testing pilot project. These five projects were located across 4 districts (D2, D3, D6, and Metro), had four different PG binders, and covered several types of construction. The objective of choosing projects with varying climatic conditions was met and can be seen by project locations in Figure 2.1.
7
Table 2.1: Summary of Selected Projects
TH District SP Location Mix Design PG
MaximumAggregate
Size (inches)
Traffic Level
Air Voids
Construction Type
Test Temp.
% RAP
56 6 2508-31 Kenyon SPWEB340C 58-34 1/2 3 4.0% SFDR1 - 24°C 20%
310 2 6809-16 Roseau SPWEB340C 58-34 1/2 3 4.0% FDR2 - 30°C 20%
10 Metro 7101-61 Elk River SPWEB440E 64-28 1/2 4 4.0% Mill and overlay - 24°C 20%
371 3 1810-98 Nisswa SPWEA440F 64-34 3/8 4 4.0% New Construction - 24°C 20%
69 6 2406-47 Albert Lea SPWEB340B 58-28 1/2 3 4.0% Mill and
overlay -18°C 30%
1SFDR: Stabilized full-depth reclamation, 2FDR: Full-depth reclamation
TH 310
TH 371
TH 10
TH 56
TH 69
Figure 2.1: Map of project locations across Minnesota.
8
Chapter 3. Mixture Testing and Adjustment
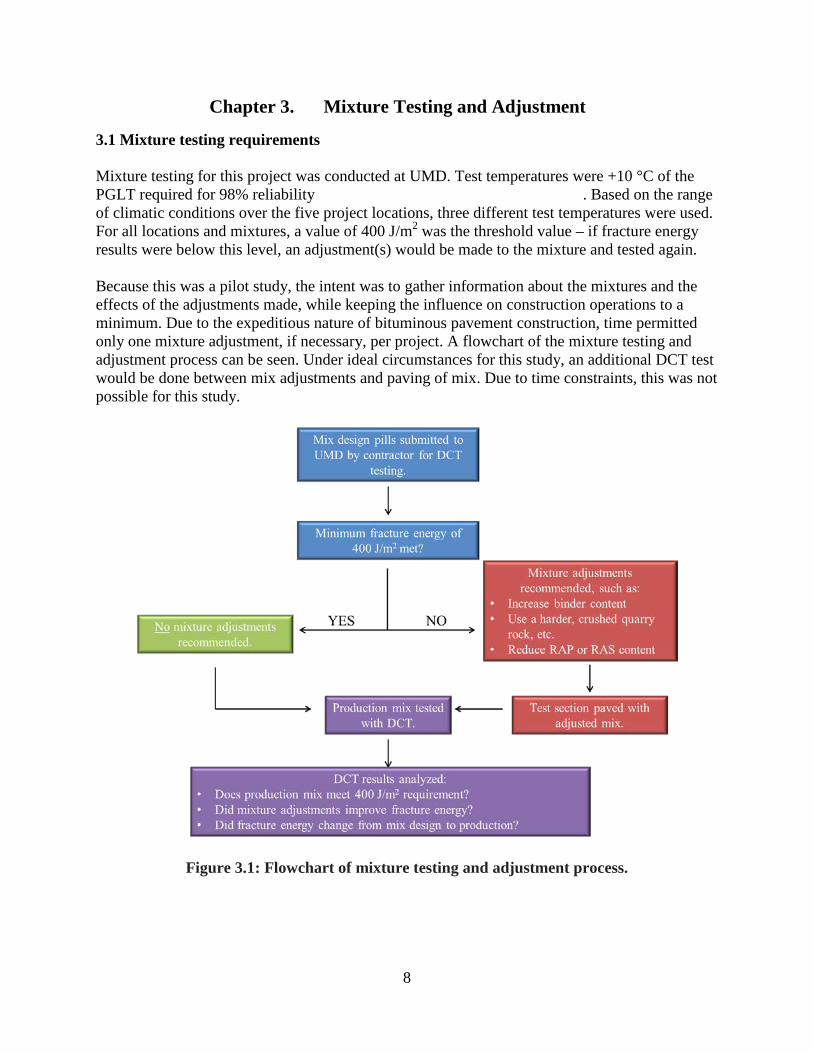
3.1 Mixture testing requirements Mixture testing for this project was conducted at UMD. Test temperatures were +10 °C of the PGLT required for 98% reliability as determined by LTPPBind 3.1 software. Based on the range of climatic conditions over the five project locations, three different test temperatures were used. For all locations and mixtures, a value of 400 J/m2 was the threshold value – if fracture energy results were below this level, an adjustment(s) would be made to the mixture and tested again. Because this was a pilot study, the intent was to gather information about the mixtures and the effects of the adjustments made, while keeping the influence on construction operations to a minimum. Due to the expeditious nature of bituminous pavement construction, time permitted only one mixture adjustment, if necessary, per project. A flowchart of the mixture testing and adjustment process can be seen. Under ideal circumstances for this study, an additional DCT test would be done between mix adjustments and paving of mix. Due to time constraints, this was not possible for this study.
Figure 3.1: Flowchart of mixture testing and adjustment process.

9
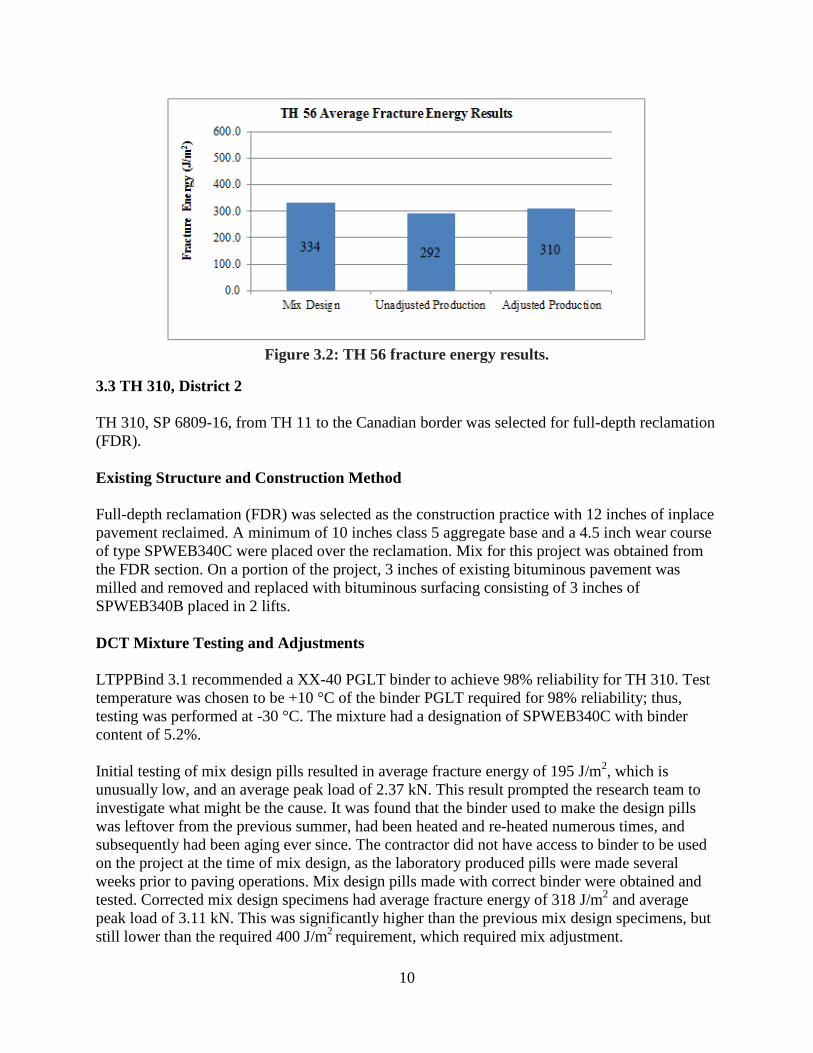
3.2 TH 56, District 6 Trunk Highway 56, SP 2508-31, from Trondheim Road (Kenyon) to the Cannon River was a candidate for stabilized full-depth reclamation (SFDR). Existing Structure and Construction Method Three inches of existing bituminous pavement was milled and removed. The first pass with the reclaimer was at a variable depth of 6 inches to 12 inches in the area where mixtures were sampled for DCT testing, as well as for the majority of the 16.9 mile long project. The second pass with the reclaimer injected 3.8% asphalt emulsion into the top 6 in. of the reclaim layer. Bituminous surfacing consisted of 3 inches type SPWEB340C mixture placed in two lifts. DCT Mixture Testing and Adjustments LTPPBind 3.1 required a XX-34 PGLT binder to achieve 98% reliability. Test temperature was chosen to be +10 °C of the binder PGLT required for 98% reliability; thus, testing was performed at -24 °C. Mix design samples and unadjusted production mix were obtained at the same time. The bituminous mixture designation was SPWEB340C with a binder content of 5.5%. Mix design specimens had average fracture energy of 334 J/m2 and average peak load of 2.78 kN. Because this was below the 400 J/m2 threshold an adjustment was required. Unadjusted production mix had average fracture energy of 292 J/m2 and average peak load of 2.92 kN. The difference in fracture energy from mix design to produced mix was substantial, and was also found to be the case in each project. After testing the lab produced mix design pills and unadjusted plant produced mix, only eight days of paving remained on the project. With relatively little time remaining, the construction engineer and contractor requested a relatively simple and low-risk adjustment. The research team suggested adding an additional 0.1% of virgin binder to the mix, raising the total binder content from 5.5% to 5.6%. Test results for the adjusted mix yielded average fracture energy of 310 J/m2 and average peak load of 2.89 kN, still well below the 400 J/m2 threshold. The increased virgin binder content of 0.1% resulted in an increase of 18 J/m2 from the unadjusted production mix. This adjustment was not suitable for this mix, as it did not increase the fracture energy above the required minimum value. However, this difference was not insignificant as it appeared to reliably increase the fracture energy of the mix even though the effect was relatively small. Fracture energy results from mix design and production can be seen in Figure 3.2.
10
Figure 3.2: TH 56 fracture energy results.
3.3 TH 310, District 2 TH 310, SP 6809-16, from TH 11 to the Canadian border was selected for full-depth reclamation (FDR). Existing Structure and Construction Method Full-depth reclamation (FDR) was selected as the construction practice with 12 inches of inplace pavement reclaimed. A minimum of 10 inches class 5 aggregate base and a 4.5 inch wear course of type SPWEB340C were placed over the reclamation. Mix for this project was obtained from the FDR section. On a portion of the project, 3 inches of existing bituminous pavement was milled and removed and replaced with bituminous surfacing consisting of 3 inches of SPWEB340B placed in 2 lifts. DCT Mixture Testing and Adjustments LTPPBind 3.1 recommended a XX-40 PGLT binder to achieve 98% reliability for TH 310. Test temperature was chosen to be +10 °C of the binder PGLT required for 98% reliability; thus, testing was performed at -30 °C. The mixture had a designation of SPWEB340C with binder content of 5.2%. Initial testing of mix design pills resulted in average fracture energy of 195 J/m2, which is unusually low, and an average peak load of 2.37 kN. This result prompted the research team to investigate what might be the cause. It was found that the binder used to make the design pills was leftover from the previous summer, had been heated and re-heated numerous times, and subsequently had been aging ever since. The contractor did not have access to binder to be used on the project at the time of mix design, as the laboratory produced pills were made several weeks prior to paving operations. Mix design pills made with correct binder were obtained and tested. Corrected mix design specimens had average fracture energy of 318 J/m2 and average peak load of 3.11 kN. This was significantly higher than the previous mix design specimens, but still lower than the required 400 J/m2 requirement, which required mix adjustment.
11
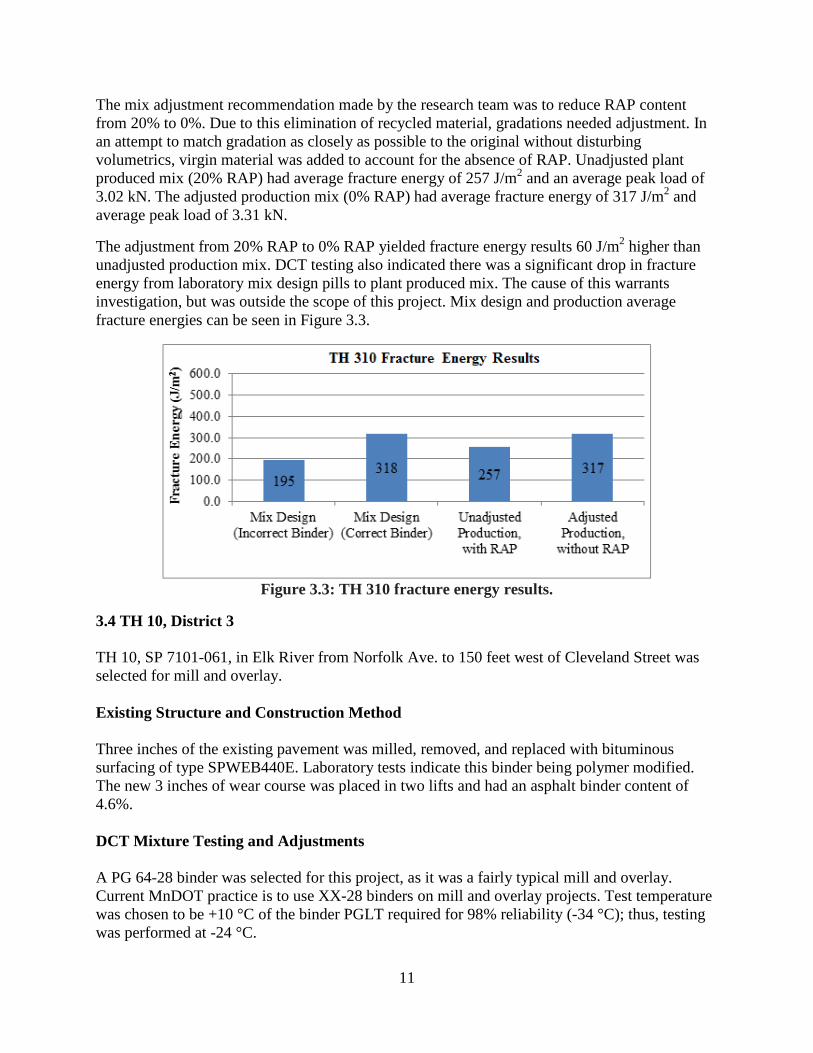
The mix adjustment recommendation made by the research team was to reduce RAP content from 20% to 0%. Due to this elimination of recycled material, gradations needed adjustment. In an attempt to match gradation as closely as possible to the original without disturbing volumetrics, virgin material was added to account for the absence of RAP. Unadjusted plant produced mix (20% RAP) had average fracture energy of 257 J/m2 and an average peak load of 3.02 kN. The adjusted production mix (0% RAP) had average fracture energy of 317 J/m2 and average peak load of 3.31 kN.
The adjustment from 20% RAP to 0% RAP yielded fracture energy results 60 J/m2 higher than unadjusted production mix. DCT testing also indicated there was a significant drop in fracture energy from laboratory mix design pills to plant produced mix. The cause of this warrants investigation, but was outside the scope of this project. Mix design and production average fracture energies can be seen in Figure 3.3.
Figure 3.3: TH 310 fracture energy results.
3.4 TH 10, District 3 TH 10, SP 7101-061, in Elk River from Norfolk Ave. to 150 feet west of Cleveland Street was selected for mill and overlay. Existing Structure and Construction Method Three inches of the existing pavement was milled, removed, and replaced with bituminous surfacing of type SPWEB440E. Laboratory tests indicate this binder being polymer modified. The new 3 inches of wear course was placed in two lifts and had an asphalt binder content of 4.6%. DCT Mixture Testing and Adjustments A PG 64-28 binder was selected for this project, as it was a fairly typical mill and overlay. Current MnDOT practice is to use XX-28 binders on mill and overlay projects. Test temperature was chosen to be +10 °C of the binder PGLT required for 98% reliability (-34 °C); thus, testing was performed at -24 °C.
12
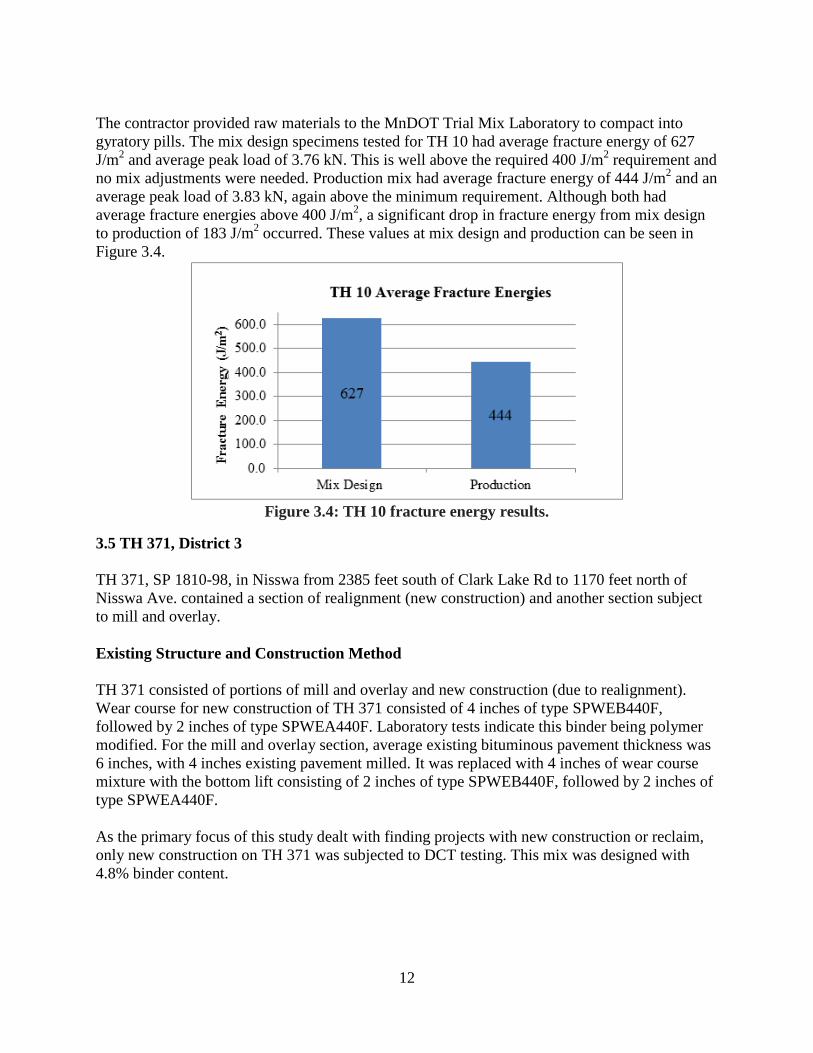
The contractor provided raw materials to the MnDOT Trial Mix Laboratory to compact into gyratory pills. The mix design specimens tested for TH 10 had average fracture energy of 627 J/m2 and average peak load of 3.76 kN. This is well above the required 400 J/m2 requirement and no mix adjustments were needed. Production mix had average fracture energy of 444 J/m2 and an average peak load of 3.83 kN, again above the minimum requirement. Although both had average fracture energies above 400 J/m2, a significant drop in fracture energy from mix design to production of 183 J/m2 occurred. These values at mix design and production can be seen in Figure 3.4.
Figure 3.4: TH 10 fracture energy results.
3.5 TH 371, District 3 TH 371, SP 1810-98, in Nisswa from 2385 feet south of Clark Lake Rd to 1170 feet north of Nisswa Ave. contained a section of realignment (new construction) and another section subject to mill and overlay. Existing Structure and Construction Method TH 371 consisted of portions of mill and overlay and new construction (due to realignment). Wear course for new construction of TH 371 consisted of 4 inches of type SPWEB440F, followed by 2 inches of type SPWEA440F. Laboratory tests indicate this binder being polymer modified. For the mill and overlay section, average existing bituminous pavement thickness was 6 inches, with 4 inches existing pavement milled. It was replaced with 4 inches of wear course mixture with the bottom lift consisting of 2 inches of type SPWEB440F, followed by 2 inches of type SPWEA440F. As the primary focus of this study dealt with finding projects with new construction or reclaim, only new construction on TH 371 was subjected to DCT testing. This mix was designed with 4.8% binder content.
13
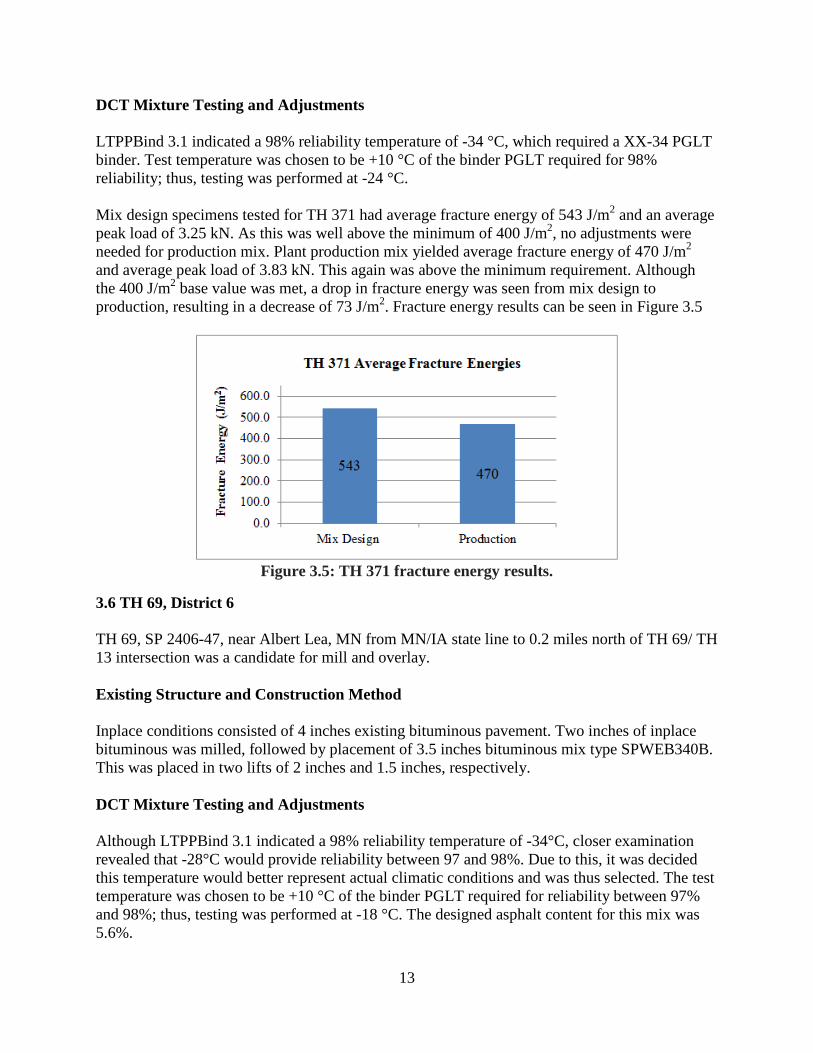
DCT Mixture Testing and Adjustments LTPPBind 3.1 indicated a 98% reliability temperature of -34 °C, which required a XX-34 PGLT binder. Test temperature was chosen to be +10 °C of the binder PGLT required for 98% reliability; thus, testing was performed at -24 °C. Mix design specimens tested for TH 371 had average fracture energy of 543 J/m2 and an average peak load of 3.25 kN. As this was well above the minimum of 400 J/m2, no adjustments were needed for production mix. Plant production mix yielded average fracture energy of 470 J/m2 and average peak load of 3.83 kN. This again was above the minimum requirement. Although the 400 J/m2 base value was met, a drop in fracture energy was seen from mix design to production, resulting in a decrease of 73 J/m2. Fracture energy results can be seen in Figure 3.5
Figure 3.5: TH 371 fracture energy results.
3.6 TH 69, District 6 TH 69, SP 2406-47, near Albert Lea, MN from MN/IA state line to 0.2 miles north of TH 69/ TH 13 intersection was a candidate for mill and overlay. Existing Structure and Construction Method Inplace conditions consisted of 4 inches existing bituminous pavement. Two inches of inplace bituminous was milled, followed by placement of 3.5 inches bituminous mix type SPWEB340B. This was placed in two lifts of 2 inches and 1.5 inches, respectively. DCT Mixture Testing and Adjustments Although LTPPBind 3.1 indicated a 98% reliability temperature of -34°C, closer examination revealed that -28°C would provide reliability between 97 and 98%. Due to this, it was decided this temperature would better represent actual climatic conditions and was thus selected. The test temperature was chosen to be +10 °C of the binder PGLT required for reliability between 97% and 98%; thus, testing was performed at -18 °C. The designed asphalt content for this mix was 5.6%.
14
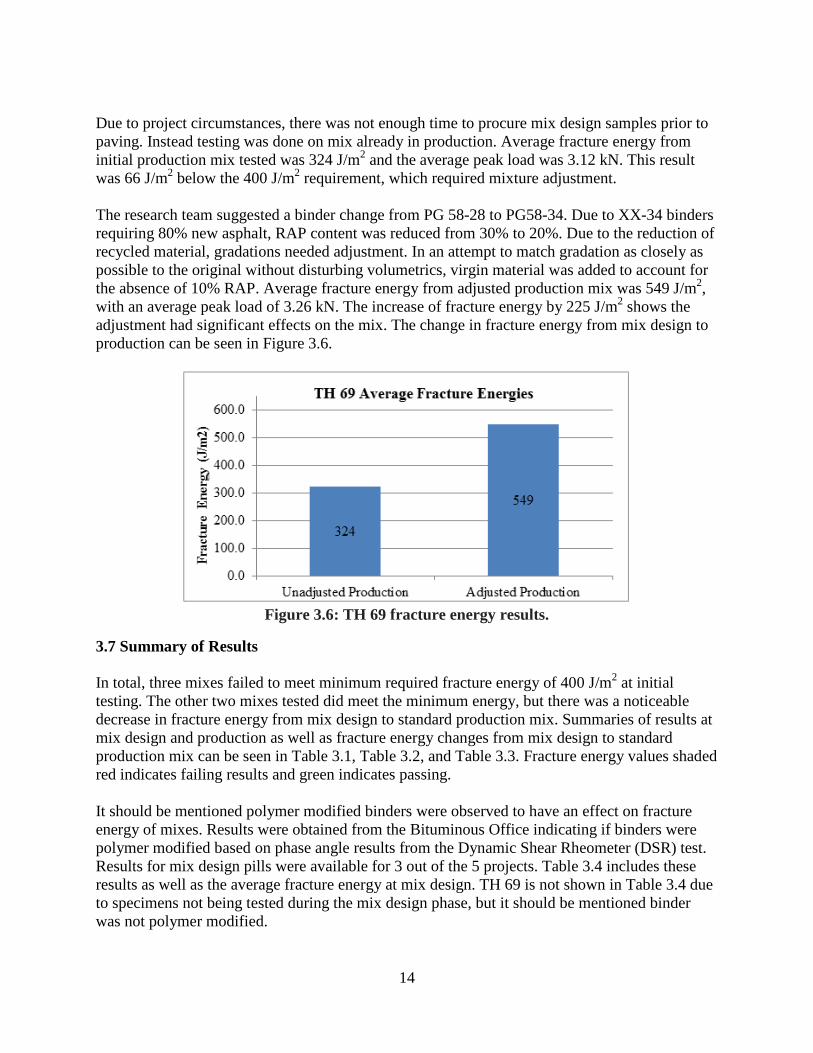
Due to project circumstances, there was not enough time to procure mix design samples prior to paving. Instead testing was done on mix already in production. Average fracture energy from initial production mix tested was 324 J/m2 and the average peak load was 3.12 kN. This result was 66 J/m2 below the 400 J/m2 requirement, which required mixture adjustment. The research team suggested a binder change from PG 58-28 to PG58-34. Due to XX-34 binders requiring 80% new asphalt, RAP content was reduced from 30% to 20%. Due to the reduction of recycled material, gradations needed adjustment. In an attempt to match gradation as closely as possible to the original without disturbing volumetrics, virgin material was added to account for the absence of 10% RAP. Average fracture energy from adjusted production mix was 549 J/m2, with an average peak load of 3.26 kN. The increase of fracture energy by 225 J/m2 shows the adjustment had significant effects on the mix. The change in fracture energy from mix design to production can be seen in Figure 3.6.
Figure 3.6: TH 69 fracture energy results.
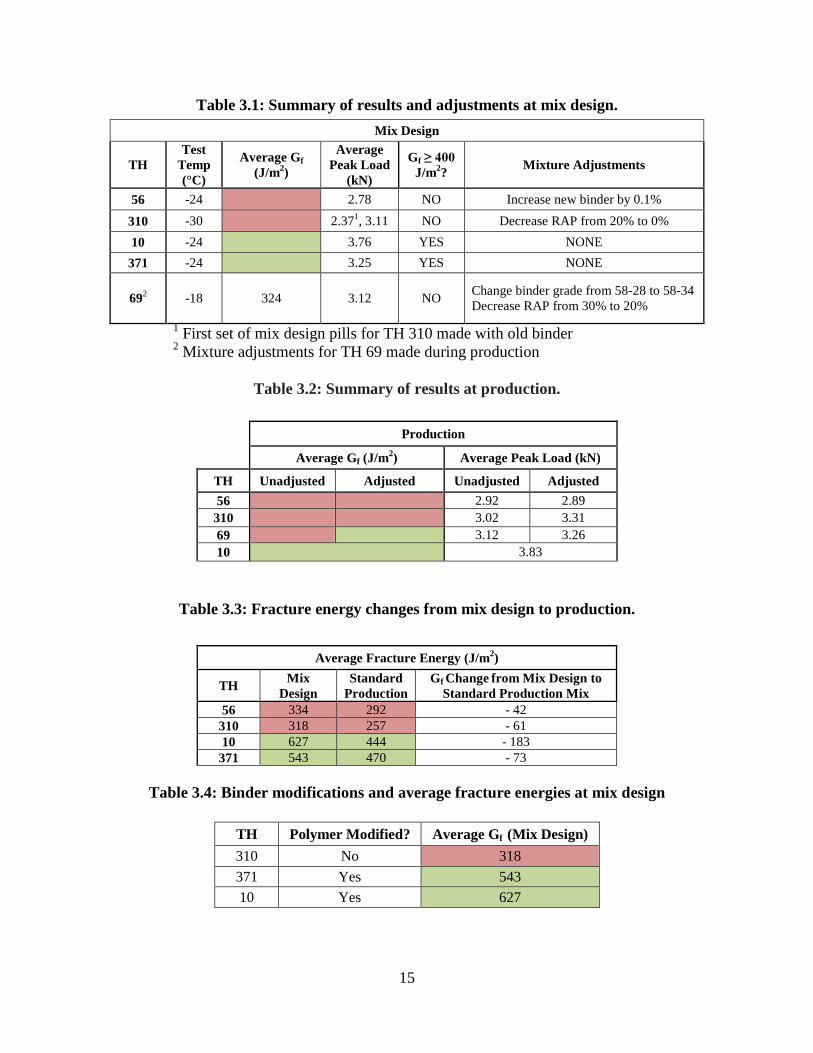
3.7 Summary of Results In total, three mixes failed to meet minimum required fracture energy of 400 J/m2 at initial testing. The other two mixes tested did meet the minimum energy, but there was a noticeable decrease in fracture energy from mix design to standard production mix. Summaries of results at mix design and production as well as fracture energy changes from mix design to standard production mix can be seen in Table 3.1, Table 3.2, and Table 3.3. Fracture energy values shaded red indicates failing results and green indicates passing. It should be mentioned polymer modified binders were observed to have an effect on fracture energy of mixes. Results were obtained from the Bituminous Office indicating if binders were polymer modified based on phase angle results from the Dynamic Shear Rheometer (DSR) test. Results for mix design pills were available for 3 out of the 5 projects. Table 3.4 includes these results as well as the average fracture energy at mix design. TH 69 is not shown in Table 3.4 due to specimens not being tested during the mix design phase, but it should be mentioned binder was not polymer modified.
15
Table 3.1: Summary of results and adjustments at mix design. Mix Design
TH Test
Temp (°C)
Average Gf 2)(J/m
Average Peak Load
(kN)
Gf ≥ 400 2?J/m Mixture Adjustments
56 -24 334 2.78 NO Increase new binder by 0.1%
310 -30 1951, 318 2.371, 3.11 NO Decrease RAP from 20% to 0% 10 -24 627 3.76 YES NONE
371 -24 543 3.25 YES NONE
692 -18 324 3.12 NO Change binder grade from 58-28 to 58-34 Decrease RAP from 30% to 20%
1 First set of mix design pills for TH 310 made with old binder 2 Mixture adjustments for TH 69 made during production
Table 3.2: Summary of results at production.
Production
Average Gf 2)(J/m Average Peak Load (kN)
TH Unadjusted Adjusted Unadjusted Adjusted 56 292 310 2.92 2.89
310 257 317 3.02 3.31 69 324 549 3.12 3.26 10 444 3.83
Table 3.3: Fracture energy changes from mix design to production.
2)Average Fracture Energy (J/m
TH Mix Design
Standard Production
Gf Change from Mix Design Standard Production Mix
to
56 334 292 - 42 310 318 257 - 61 10 627 444 - 183
371 543 470 - 73
Table 3.4: Binder modifications and average fracture energies at mix design
TH Polymer Modified? Average Gf (Mix Design) 310 No 318 371 Yes 543 10 Yes 627
16
Chapter 4. Initial Pavement Performance
4.1 Distress Surveys Distress surveys consisting of transverse crack counts were conducted on four of the five projects (TH 56, TH 371, TH 69, and TH 310). These were conducted in April of 2014, approximately 9 months after initial construction. All pavements were subjected to one season of freezing conditions. Distress surveys were performed on 1,000 ft. sections. Crack Calculations Cracking amounts were quantified using two methods, with one being an equation calculating percent cracking as seen in Equation 4.1. The equation represents cracking that occurred as a percentage of the total length of the observed section; in this case 1,000 ft. It was also used in the low temperature crackin
%
g pool
𝐶𝑟𝑎𝑐
ed f
𝑘𝑖𝑛
und s
𝑔 =
t
𝑛
uation 4.1:
�
udi
∑
es [2] [3].
𝑖=1
Eq Perc
𝑙𝑒𝑛𝑔𝑡ℎ 𝑜𝑓 𝑐𝑟𝑎𝑐𝑘𝑙𝑒𝑛𝑔
en𝑡ℎt c
𝑜𝑓ra
ck𝑠𝑒𝑐𝑡𝑖𝑜𝑛
𝑖� × 100
ing formula The other method quantifying cracking was recording total cracking in feet, as well as number of transverse cracks. Severity of cracking was not recorded during these distress surveys, such as width of crack. To better understand extent of cracking, cracks 12 ft. in length were reported, as seen in Table 4.2 through Table 4.5. These represent cracking spanning the entire width of the driving lane. Tables containing cracking information for each project can be found in the following sections.
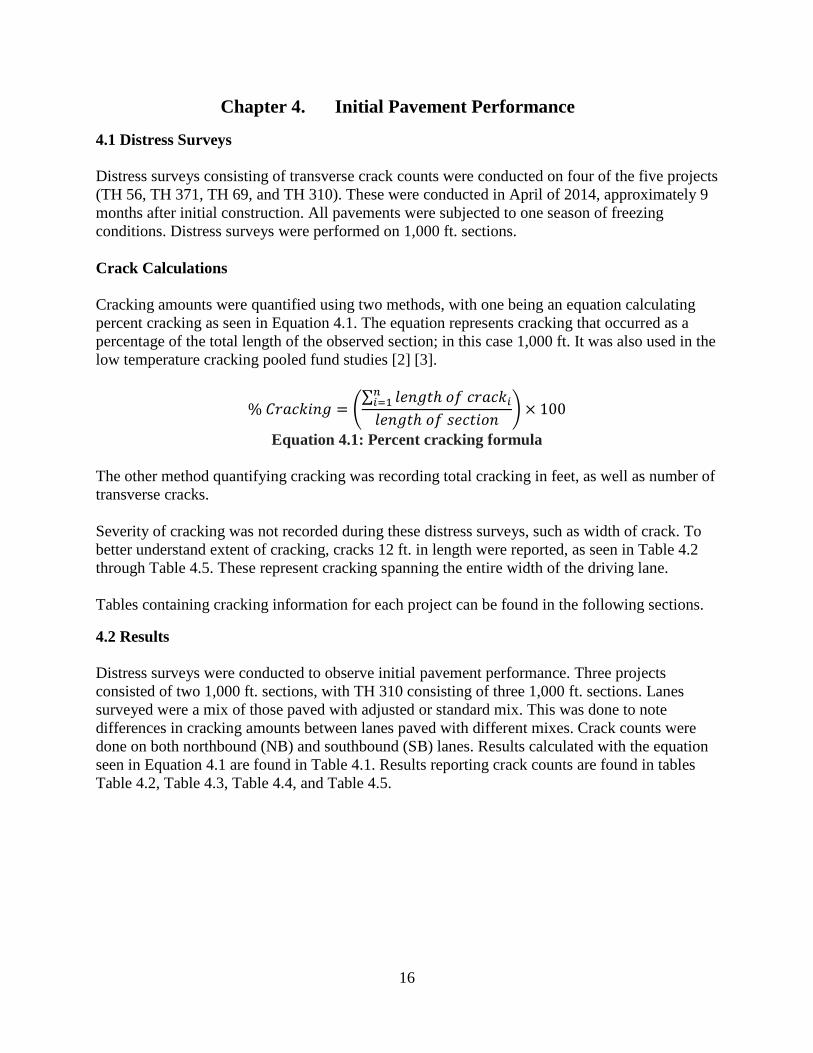
4.2 Results Distress surveys were conducted to observe initial pavement performance. Three projects consisted of two 1,000 ft. sections, with TH 310 consisting of three 1,000 ft. sections. Lanes surveyed were a mix of those paved with adjusted or standard mix. This was done to note differences in cracking amounts between lanes paved with different mixes. Crack counts were done on both northbound (NB) and southbound (SB) lanes. Results calculated with the equation seen in Equation 4.1 are found in Table 4.1. Results reporting crack counts are found in tables Table 4.2, Table 4.3, Table 4.4, and Table 4.5.
17
Table 4.1: Percent cracking calculated by equation (conducted April 2014).
TH Standard
Mix Gf (J/m2)
Adjusted Mix Gf (J/m2)
Production Mix Type Construction Type
% Cracking NB
% Cracking SB
56 292 310 NB Standard, SB
Adjusted SFDR 0.6 0.7
NB and SB Adjusted 0.3 0.3
69 324 549 NB and SB Adjusted
Mill and Overlay 5.2 4.7
NB and SB Standard 5.6 5.9
310 257 317
NB and SB Standard
Mill and Overlay 17.3 16.3
FDR 3.0 2.4
NB Standard, SB Adjusted 3.6 3.6
371 470 None
NB and SB Standard
New Construction 0 0
Mill and Overlay 6.6 3.2
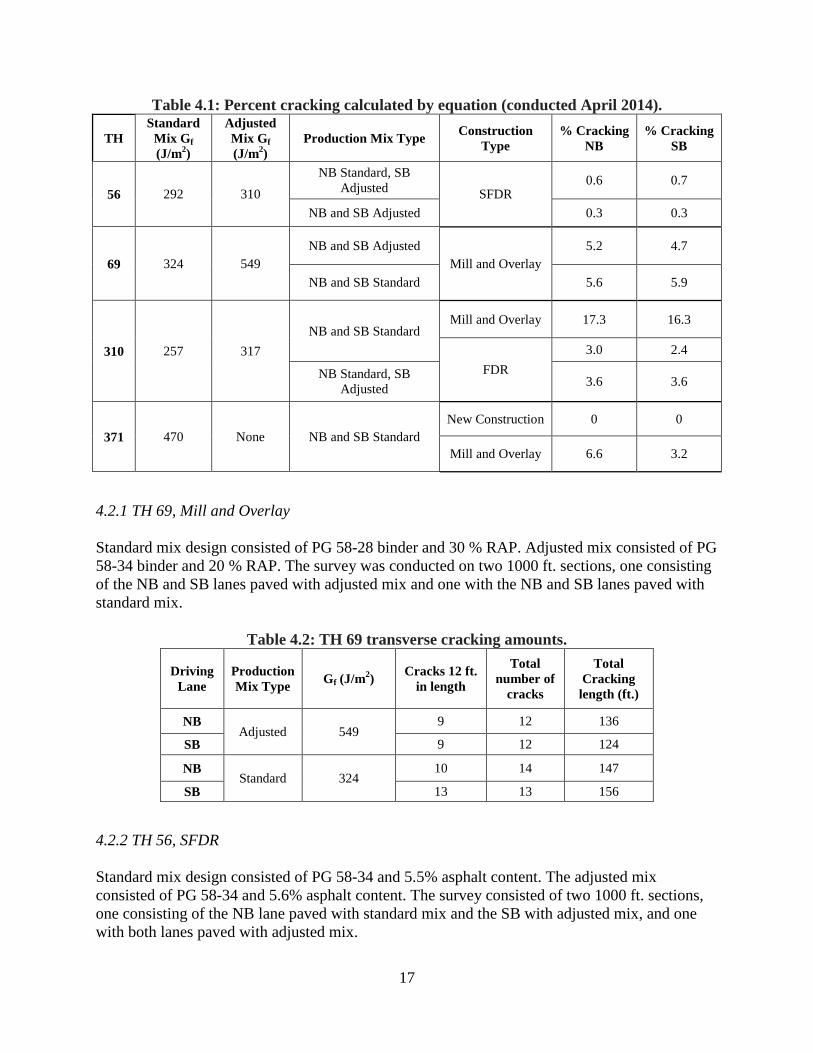
4.2.1 TH 69, Mill and Overlay Standard mix design consisted of PG 58-28 binder and 30 % RAP. Adjusted mix consisted of PG 58-34 binder and 20 % RAP. The survey was conducted on two 1000 ft. sections, one consisting of the NB and SB lanes paved with adjusted mix and one with the NB and SB lanes paved with standard mix.
Table 4.2: TH 69 transverse cracking amounts.
Driving Lane
Production Mix Type Gf (J/m2) Cracks 12 ft.
in length
Total number of
cracks
Total Cracking
length (ft.)
NB Adjusted
549
9 12 136
SB 9 12 124
NB Standard
324
10 14 147
SB 13 13 156
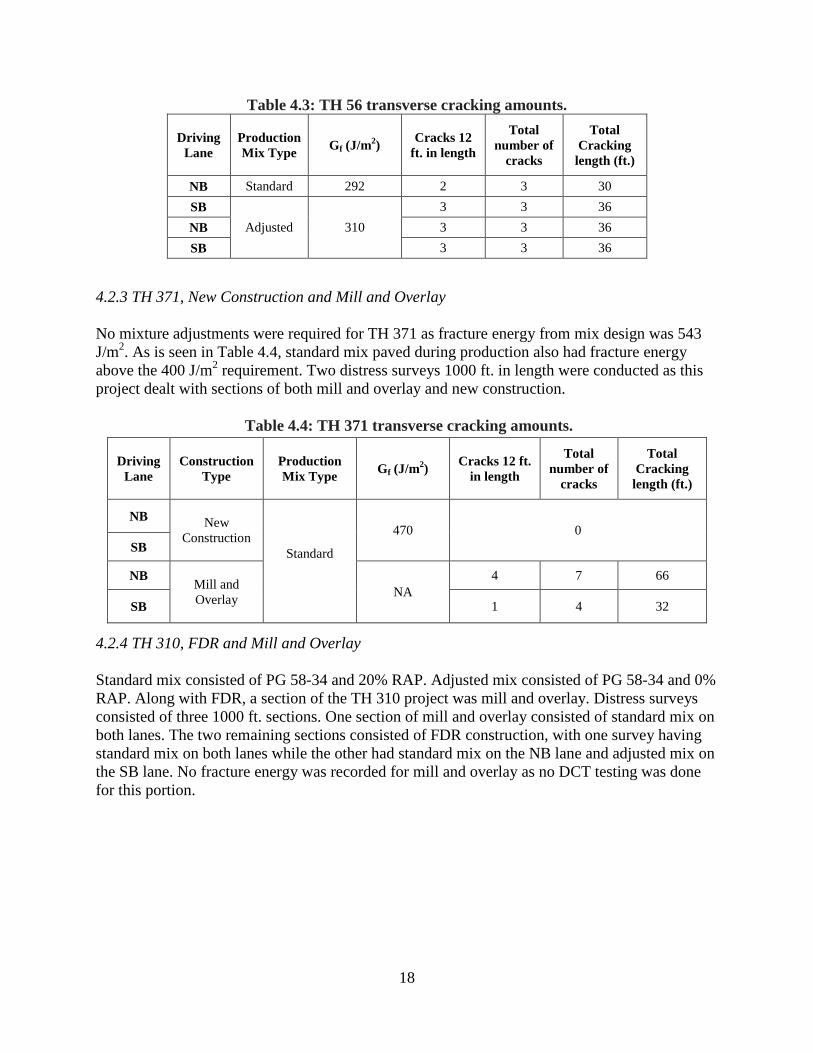
4.2.2 TH 56, SFDR Standard mix design consisted of PG 58-34 and 5.5% asphalt content. The adjusted mix consisted of PG 58-34 and 5.6% asphalt content. The survey consisted of two 1000 ft. sections, one consisting of the NB lane paved with standard mix and the SB with adjusted mix, and one with both lanes paved with adjusted mix.
18
Table 4.3: TH 56 transverse cracking amounts.
Driving Lane
Production Mix Type Gf (J/m2) Cracks 12
ft. in length
Total number of
cracks
Total Cracking
length (ft.)
NB Standard 292 2 3 30 SB
Adjusted
310 3 3 36
NB 3 3 36 SB 3 3 36
4.2.3 TH 371, New Construction and Mill and Overlay No mixture adjustments were required for TH 371 as fracture energy from mix design was 543 J/m2. As is seen in Table 4.4, standard mix paved during production also had fracture energy above the 400 J/m2 requirement. Two distress surveys 1000 ft. in length were conducted as this project dealt with sections of both mill and overlay and new construction.
Table 4.4: TH 371 transverse cracking amounts.
Driving Lane
Construction Type
Production Mix Type Gf (J/m2) Cracks 12 ft.
in length
Total number of
cracks
Total Cracking
length (ft.)
NB
New Construction
Standard
470 0 SB
NB Mill and Overlay
NA 4 7 66
SB 1 4 32
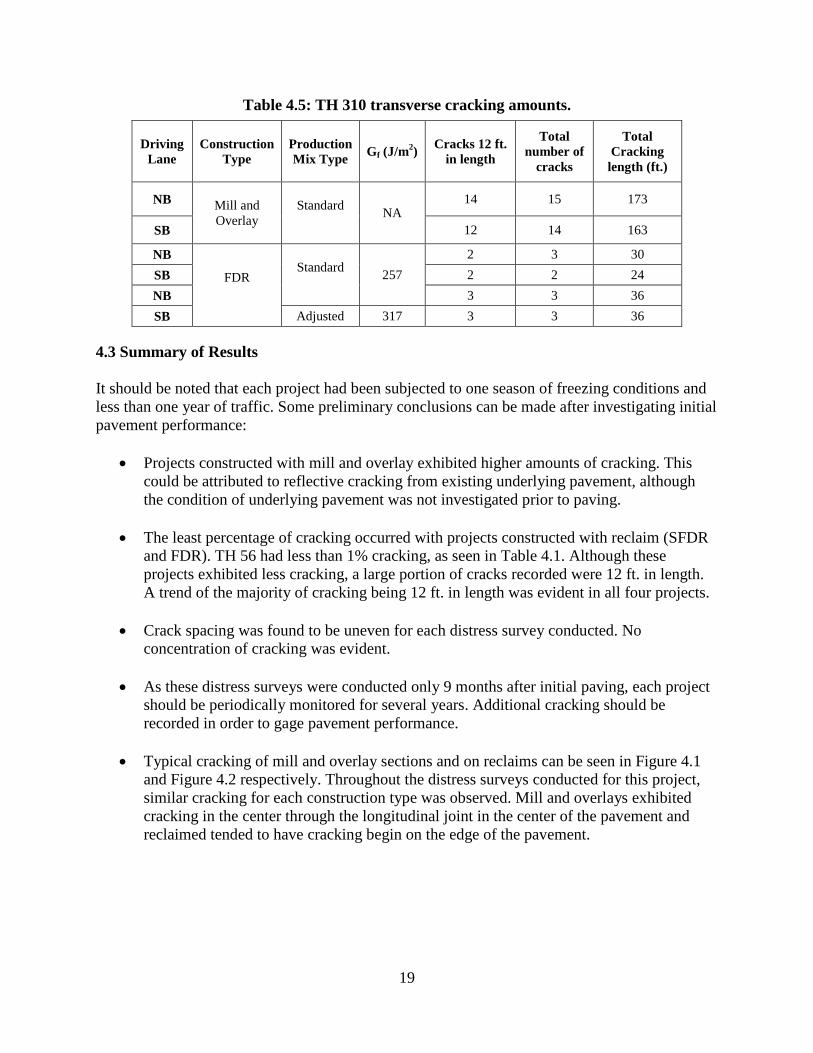
4.2.4 TH 310, FDR and Mill and Overlay Standard mix consisted of PG 58-34 and 20% RAP. Adjusted mix consisted of PG 58-34 and 0% RAP. Along with FDR, a section of the TH 310 project was mill and overlay. Distress surveys consisted of three 1000 ft. sections. One section of mill and overlay consisted of standard mix on both lanes. The two remaining sections consisted of FDR construction, with one survey having standard mix on both lanes while the other had standard mix on the NB lane and adjusted mix on the SB lane. No fracture energy was recorded for mill and overlay as no DCT testing was done for this portion.
19
Table 4.5: TH 310 transverse cracking amounts.
Driving Lane
Construction Type
Production Mix Type Gf (J/m2) Cracks 12 ft.
in length
Total number of
cracks
Total Cracking
length (ft.)
NB
Mill and Overlay
Standard NA
14 15 173
SB 12 14 163
NB
FDR
Standard 257
2 3 30 SB 2 2 24 NB 3 3 36 SB Adjusted 317 3 3 36
4.3 Summary of Results It should be noted that each project had been subjected to one season of freezing conditions and less than one year of traffic. Some preliminary conclusions can be made after investigating initial pavement performance:
• Projects constructed with mill and overlay exhibited higher amounts of cracking. This could be attributed to reflective cracking from existing underlying pavement, although the condition of underlying pavement was not investigated prior to paving.
• The least percentage of cracking occurred with projects constructed with reclaim (SFDR
and FDR). TH 56 had less than 1% cracking, as seen in Table 4.1. Although these projects exhibited less cracking, a large portion of cracks recorded were 12 ft. in length. A trend of the majority of cracking being 12 ft. in length was evident in all four projects.
• Crack spacing was found to be uneven for each distress survey conducted. No
concentration of cracking was evident.
• As these distress surveys were conducted only 9 months after initial paving, each project should be periodically monitored for several years. Additional cracking should be recorded in order to gage pavement performance.
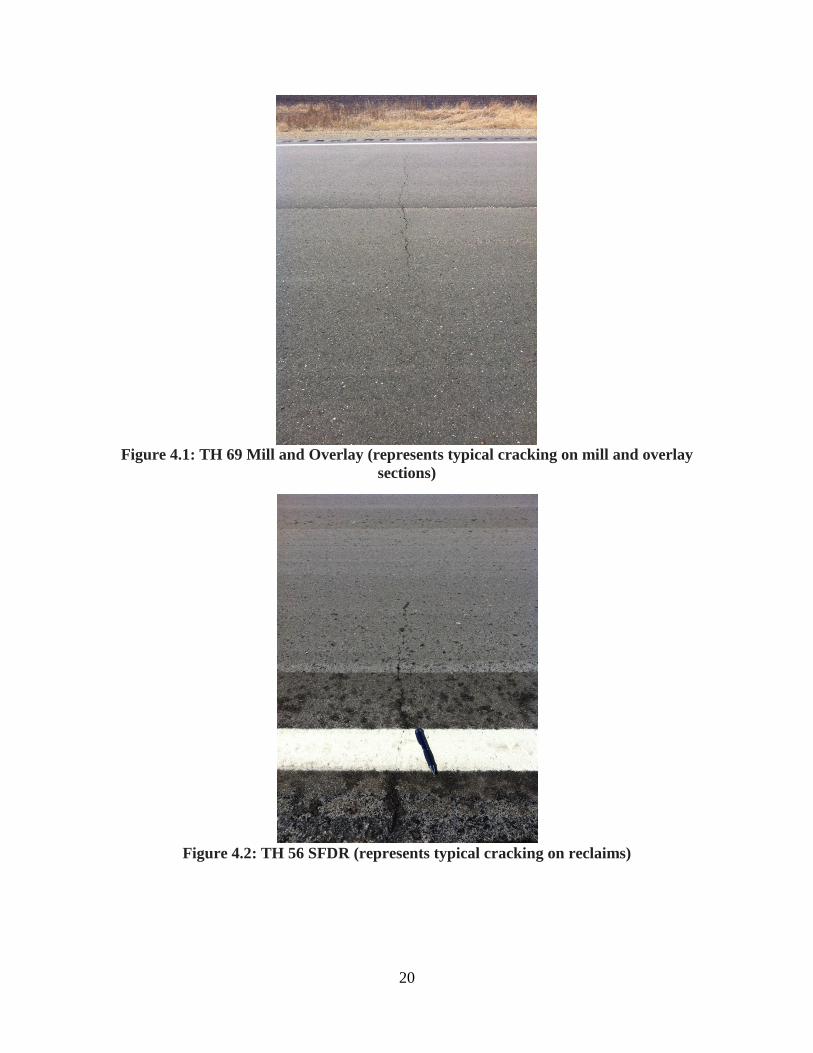
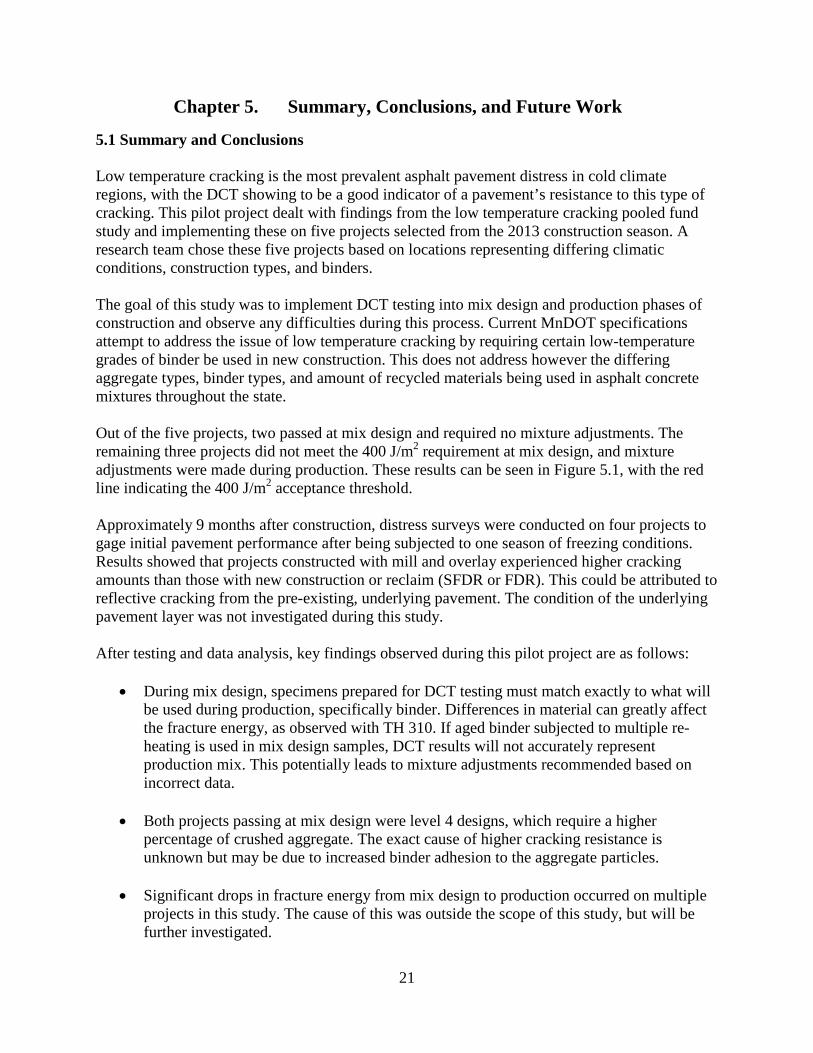
• Typical cracking of mill and overlay sections and on reclaims can be seen in Figure 4.1 and Figure 4.2 respectively. Throughout the distress surveys conducted for this project, similar cracking for each construction type was observed. Mill and overlays exhibited cracking in the center through the longitudinal joint in the center of the pavement and reclaimed tended to have cracking begin on the edge of the pavement.
20
Figure 4.1: TH 69 Mill and Overlay (represents typical cracking on mill and overlay sections)
Figure 4.2: TH 56 SFDR (represents typical cracking on reclaims)
21
Chapter 5. Summary, Conclusions, and Future Work
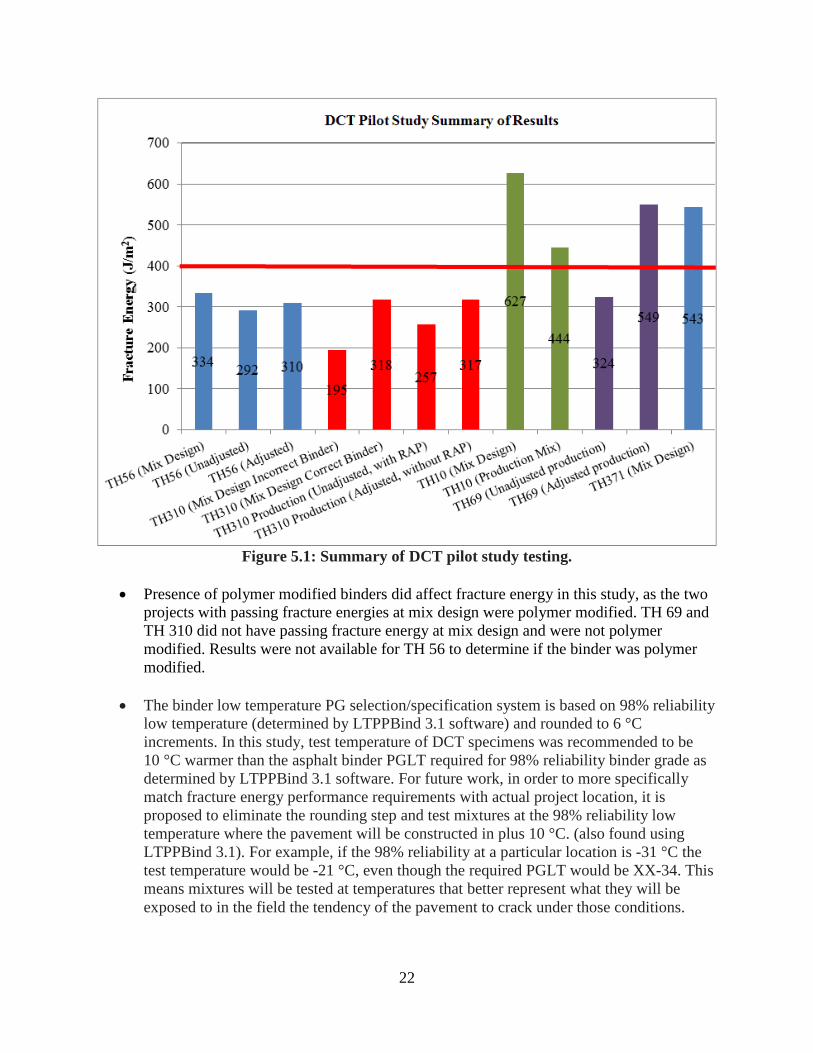
5.1 Summary and Conclusions Low temperature cracking is the most prevalent asphalt pavement distress in cold climate regions, with the DCT showing to be a good indicator of a pavement’s resistance to this type of cracking. This pilot project dealt with findings from the low temperature cracking pooled fund study and implementing these on five projects selected from the 2013 construction season. A research team chose these five projects based on locations representing differing climatic conditions, construction types, and binders. The goal of this study was to implement DCT testing into mix design and production phases of construction and observe any difficulties during this process. Current MnDOT specifications attempt to address the issue of low temperature cracking by requiring certain low-temperature grades of binder be used in new construction. This does not address however the differing aggregate types, binder types, and amount of recycled materials being used in asphalt concrete mixtures throughout the state. Out of the five projects, two passed at mix design and required no mixture adjustments. The remaining three projects did not meet the 400 J/m2 requirement at mix design, and mixture adjustments were made during production. These results can be seen in Figure 5.1, with the red line indicating the 400 J/m2 acceptance threshold. Approximately 9 months after construction, distress surveys were conducted on four projects to gage initial pavement performance after being subjected to one season of freezing conditions. Results showed that projects constructed with mill and overlay experienced higher cracking amounts than those with new construction or reclaim (SFDR or FDR). This could be attributed to reflective cracking from the pre-existing, underlying pavement. The condition of the underlying pavement layer was not investigated during this study. After testing and data analysis, key findings observed during this pilot project are as follows:
• During mix design, specimens prepared for DCT testing must match exactly to what will be used during production, specifically binder. Differences in material can greatly affect the fracture energy, as observed with TH 310. If aged binder subjected to multiple re-heating is used in mix design samples, DCT results will not accurately represent production mix. This potentially leads to mixture adjustments recommended based on incorrect data.
• Both projects passing at mix design were level 4 designs, which require a higher
percentage of crushed aggregate. The exact cause of higher cracking resistance is unknown but may be due to increased binder adhesion to the aggregate particles.
• Significant drops in fracture energy from mix design to production occurred on multiple
projects in this study. The cause of this was outside the scope of this study, but will be further investigated.
22
Figure 5.1: Summary of DCT pilot study testing.
• Presence of polymer modified binders did affect fracture energy in this study, as the two
projects with passing fracture energies at mix design were polymer modified. TH 69 and TH 310 did not have passing fracture energy at mix design and were not polymer modified. Results were not available for TH 56 to determine if the binder was polymer modified.
• The binder low temperature PG selection/specification system is based on 98% reliability low temperature (determined by LTPPBind 3.1 software) and rounded to 6 °C increments. In this study, test temperature of DCT specimens was recommended to be 10 °C warmer than the asphalt binder PGLT required for 98% reliability binder grade as determined by LTPPBind 3.1 software. For future work, in order to more specifically match fracture energy performance requirements with actual project location, it is proposed to eliminate the rounding step and test mixtures at the 98% reliability low temperature where the pavement will be constructed in plus 10 °C. (also found using LTPPBind 3.1). For example, if the 98% reliability at a particular location is -31 °C the test temperature would be -21 °C, even though the required PGLT would be XX-34. This means mixtures will be tested at temperatures that better represent what they will be exposed to in the field the tendency of the pavement to crack under those conditions.

5.2 Future and Current Work A trend of decreasing fracture energy from mix design to production was seen in each project where mix design pills were provided. To determine why this occurred, a study is currently being conducted by MnDOT and UMD consisting of 8 projects selected throughout Minnesota during the 2014 construction season. These projects were selected based on varying climatic conditions, project locations, and mix designs. Specimens obtained from four stages including mix design, production (hot mix compacted at production plant), production (reheated and compacted in lab), and field cores, will be tested in an effort to gain insight to the drop in fracture energy. This knowledge will assist future studies dealing with implementing the DCT, ultimately on a statewide basis. An additional study being conducted involves investigation of DCT test repeatability between four independent laboratories. This study deals with 16 projects selected throughout the state during the 2014 construction season. Results will be analyzed to determine repeatability of the DCT test when specimens are tested on different lab equipment and prepared by different operators. Four pails of loose mix from each project were collected between August and October of 2014. Four pills from each of the 16 projects will be provided to, and tested by, the participating laboratories. A final report on this project is anticipated fall 2015.
23

24
References [1] Lukanen (2011), “Effect of PG XX-34 on Transverse Cracking in Minnesota”,
Transportation Research Record, 2207: 58-61.
[2] Marasteanu, Zofka, Turos, Li, Velasquez, Li, Buttlar, Paulino, Braham, Dave, Ojo, Bahia, Williams, Bausano, Gallistel, McGraw (2007), Investigation of Low Temperature Cracking in Asphalt Pavements National pooled Fund Study 776 , MnDOT, St. Paul, MN.
[3] Marasteanu, Moon, Teshale, Falchetto, Turos, Buttlar, Dave, Paulino, Ahmed, Leon,
Braham, Behnia, Bahia, Tabatabaee, Velasquez, Arshadi, Puchalski, Mangiafico, Williams, Buss, Bausano, Kvasnak (2012), Investigation of Low Temperature Cracking in Asphalt Pavements, National Pooled Fund Study -Phase II, MnDOT, St. Paul, MN.
[4] Wagoner, “Fracture Tests for Bituminous-aggregate Mixtures”, Ph.D. Dissertation, University of Illinois, Urbana, IL, (2006).
[5] Wagoner, Buttlar, Paulino, Blankenship (2006), “Laboratory Testing Suite for
Characterization of Asphalt Concrete Mixtures Obtained from Field Cores”, Journal of the Association of Asphalt Paving Technologists, 75: 215-251.
[6] Song (2006), “Fracture of asphalt concrete: a cohesive zone modeling approach considering viscoelastic effects”, Ph.D. Dissertion, University of Illinois, Urbana, IL. [7] Song, Wagoner, Paulino, Buttler (2008), “Crack opening displacement parameter in
cohesive zone models: experiments and simulations in asphalt concrete”, Fatigue and Fracture of Engineering Materials and Structures, 31(10): 850-856.