daylighting metrics static vs. dynamic assessment · daylighting metrics static vs. dynamic...
TRANSCRIPT
11/7/2017
1
Daylighting Metrics Static vs. Dynamic Assessment
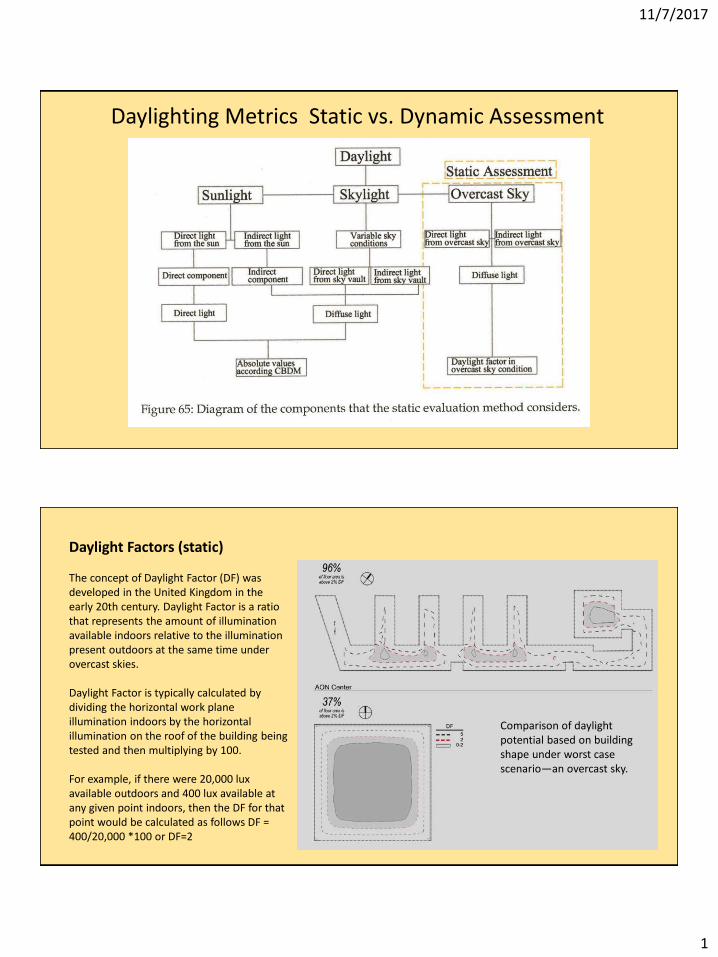
Daylight Factors (static)
The concept of Daylight Factor (DF) was developed in the United Kingdom in the early 20th century. Daylight Factor is a ratio that represents the amount of illumination available indoors relative to the illumination present outdoors at the same time under overcast skies.
Daylight Factor is typically calculated by dividing the horizontal work plane illumination indoors by the horizontal illumination on the roof of the building being tested and then multiplying by 100.
For example, if there were 20,000 lux available outdoors and 400 lux available at any given point indoors, then the DF for that point would be calculated as follows DF = 400/20,000 *100 or DF=2
Comparison of daylight potential based on building shape under worst case scenario—an overcast sky.
11/7/2017
2
European Daylight Assessment (dynamic)
Useful daylight Illuminance (UDI) [110–2,500 lux] Based on climate data analysis• UDI fell short [0–100 lux] insufficient illumination• UDI supplementary [100–300 (500) lux] integrate with electric light• UDI autonomous [300 (500)–2,500 lux] no electric light required• UDI exceeded [>2,500 lux] bad situation: glare, overheating, etc.
Daylight autonomy (DA) and Continuous daylight autonomy (cDA)• DA = percentage of annual daylight hours 500–2,500 lux• cDA = DA + the sum of (x/500) when illumination x is below 500 lux
Daylight Saturation Percentage (DSP)• Full credit for 430–4,300 lux• Penalty >4,300 lux
Bibliotecque Nationale, Paris, LaBrouste
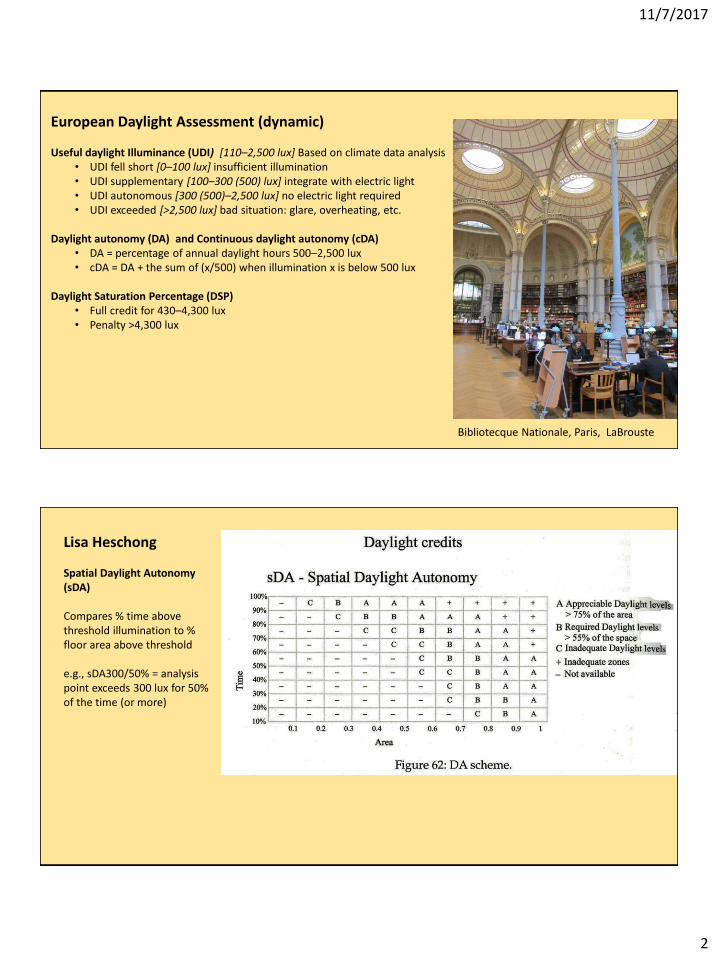
Lisa Heschong
Spatial Daylight Autonomy (sDA)
Compares % time above threshold illumination to % floor area above threshold
e.g., sDA300/50% = analysis point exceeds 300 lux for 50% of the time (or more)
11/7/2017
3
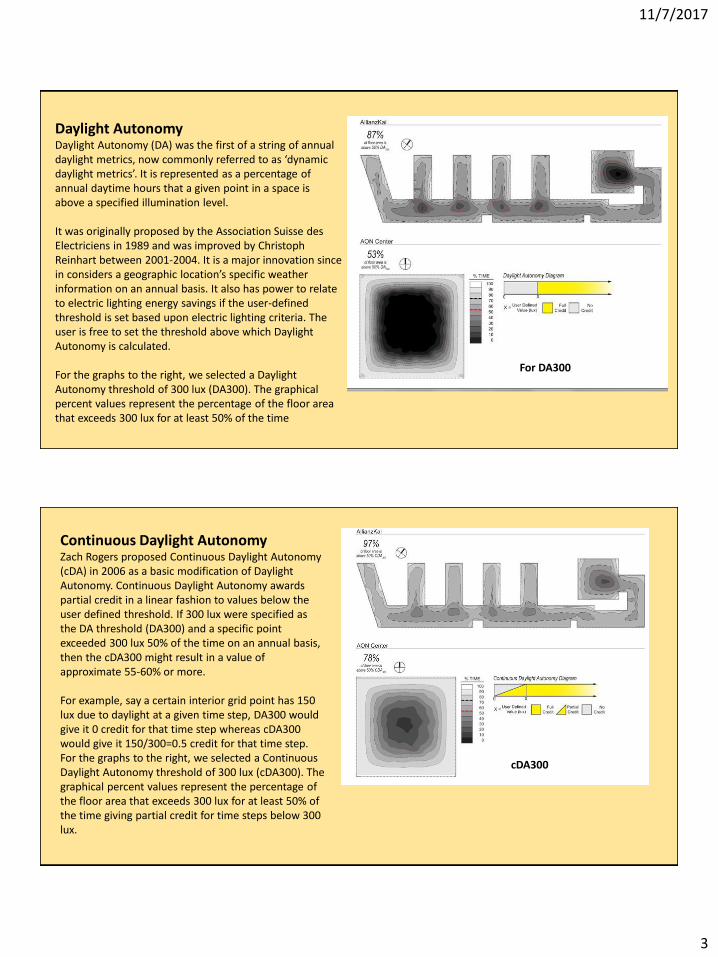
Daylight Autonomy Daylight Autonomy (DA) was the first of a string of annual daylight metrics, now commonly referred to as ‘dynamic daylight metrics’. It is represented as a percentage of annual daytime hours that a given point in a space is above a specified illumination level.
It was originally proposed by the Association Suisse des Electriciens in 1989 and was improved by Christoph Reinhart between 2001-2004. It is a major innovation since in considers a geographic location’s specific weather information on an annual basis. It also has power to relate to electric lighting energy savings if the user-defined threshold is set based upon electric lighting criteria. The user is free to set the threshold above which Daylight Autonomy is calculated.
For the graphs to the right, we selected a Daylight Autonomy threshold of 300 lux (DA300). The graphical percent values represent the percentage of the floor area that exceeds 300 lux for at least 50% of the time
For DA300
Continuous Daylight Autonomy Zach Rogers proposed Continuous Daylight Autonomy (cDA) in 2006 as a basic modification of Daylight Autonomy. Continuous Daylight Autonomy awards partial credit in a linear fashion to values below the user defined threshold. If 300 lux were specified as the DA threshold (DA300) and a specific point exceeded 300 lux 50% of the time on an annual basis, then the cDA300 might result in a value of approximate 55-60% or more.
For example, say a certain interior grid point has 150 lux due to daylight at a given time step, DA300 would give it 0 credit for that time step whereas cDA300 would give it 150/300=0.5 credit for that time step. For the graphs to the right, we selected a Continuous Daylight Autonomy threshold of 300 lux (cDA300). The graphical percent values represent the percentage of the floor area that exceeds 300 lux for at least 50% of the time giving partial credit for time steps below 300 lux.
cDA300
11/7/2017
4
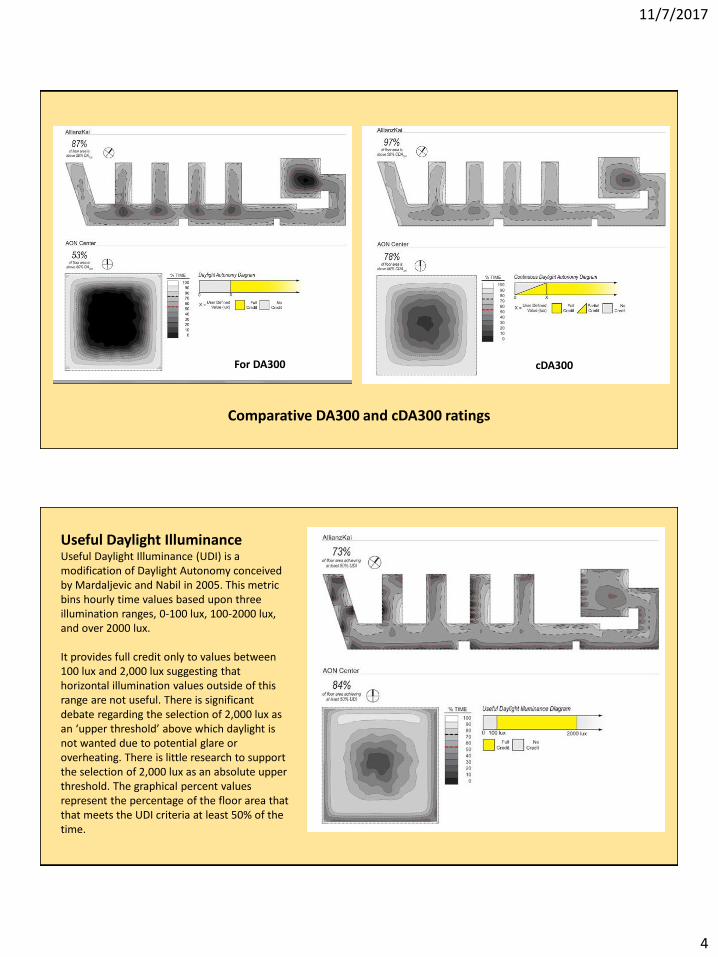
For DA300 cDA300
Comparative DA300 and cDA300 ratings
Useful Daylight Illuminance Useful Daylight Illuminance (UDI) is a modification of Daylight Autonomy conceived by Mardaljevic and Nabil in 2005. This metric bins hourly time values based upon three illumination ranges, 0-100 lux, 100-2000 lux, and over 2000 lux.
It provides full credit only to values between 100 lux and 2,000 lux suggesting that horizontal illumination values outside of this range are not useful. There is significant debate regarding the selection of 2,000 lux as an ‘upper threshold’ above which daylight is not wanted due to potential glare or overheating. There is little research to support the selection of 2,000 lux as an absolute upper threshold. The graphical percent values represent the percentage of the floor area that that meets the UDI criteria at least 50% of the time.
11/7/2017
5
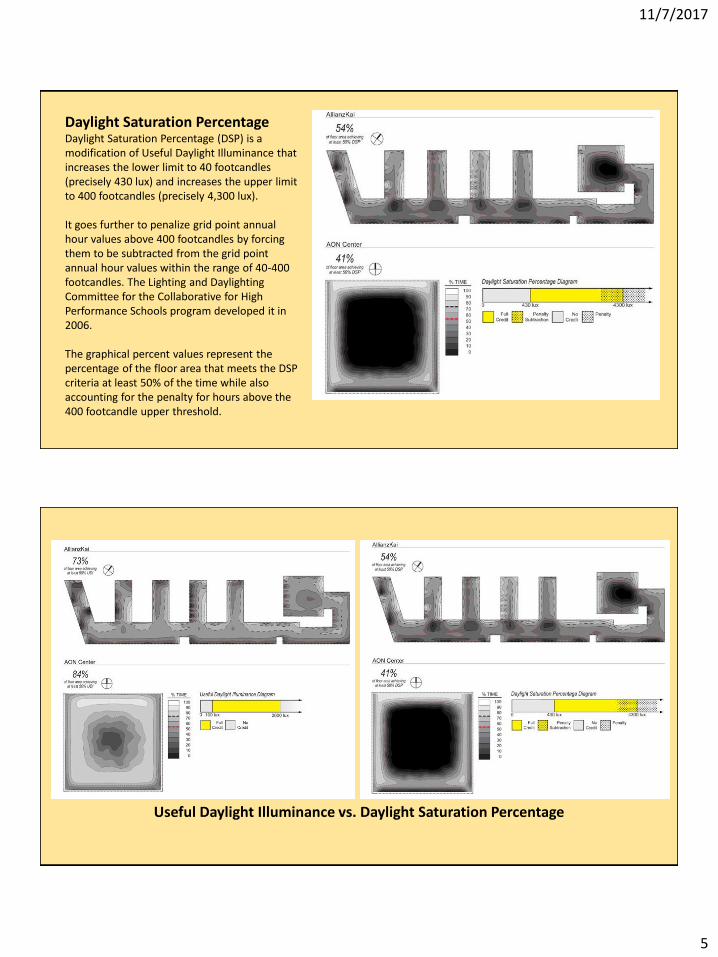
Daylight Saturation Percentage Daylight Saturation Percentage (DSP) is a modification of Useful Daylight Illuminance that increases the lower limit to 40 footcandles(precisely 430 lux) and increases the upper limit to 400 footcandles (precisely 4,300 lux).
It goes further to penalize grid point annual hour values above 400 footcandles by forcing them to be subtracted from the grid point annual hour values within the range of 40-400 footcandles. The Lighting and Daylighting Committee for the Collaborative for High Performance Schools program developed it in 2006.
The graphical percent values represent the percentage of the floor area that meets the DSP criteria at least 50% of the time while also accounting for the penalty for hours above the 400 footcandle upper threshold.
Useful Daylight Illuminance vs. Daylight Saturation Percentage
11/7/2017
6
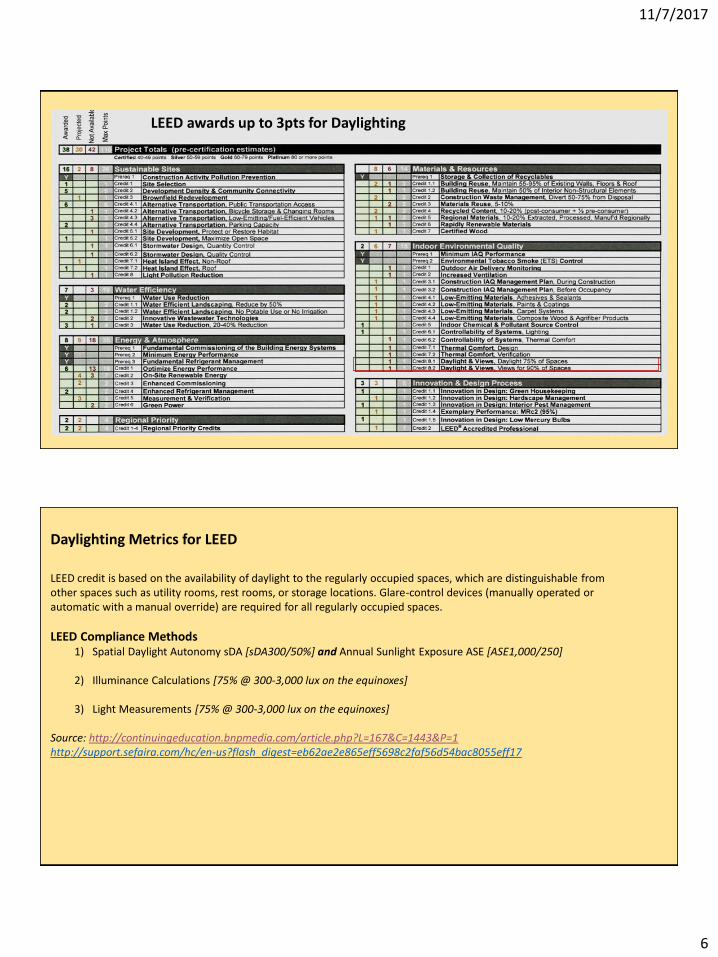
LEED awards up to 3pts for Daylighting
Daylighting Metrics for LEED
LEED credit is based on the availability of daylight to the regularly occupied spaces, which are distinguishable from other spaces such as utility rooms, rest rooms, or storage locations. Glare-control devices (manually operated or automatic with a manual override) are required for all regularly occupied spaces.
LEED Compliance Methods1) Spatial Daylight Autonomy sDA [sDA300/50%] and Annual Sunlight Exposure ASE [ASE1,000/250]
2) Illuminance Calculations [75% @ 300-3,000 lux on the equinoxes]
3) Light Measurements [75% @ 300-3,000 lux on the equinoxes]
Source: http://continuingeducation.bnpmedia.com/article.php?L=167&C=1443&P=1http://support.sefaira.com/hc/en-us?flash_digest=eb62ae2e865eff5698c2faf56d54bac8055eff17
11/7/2017
7
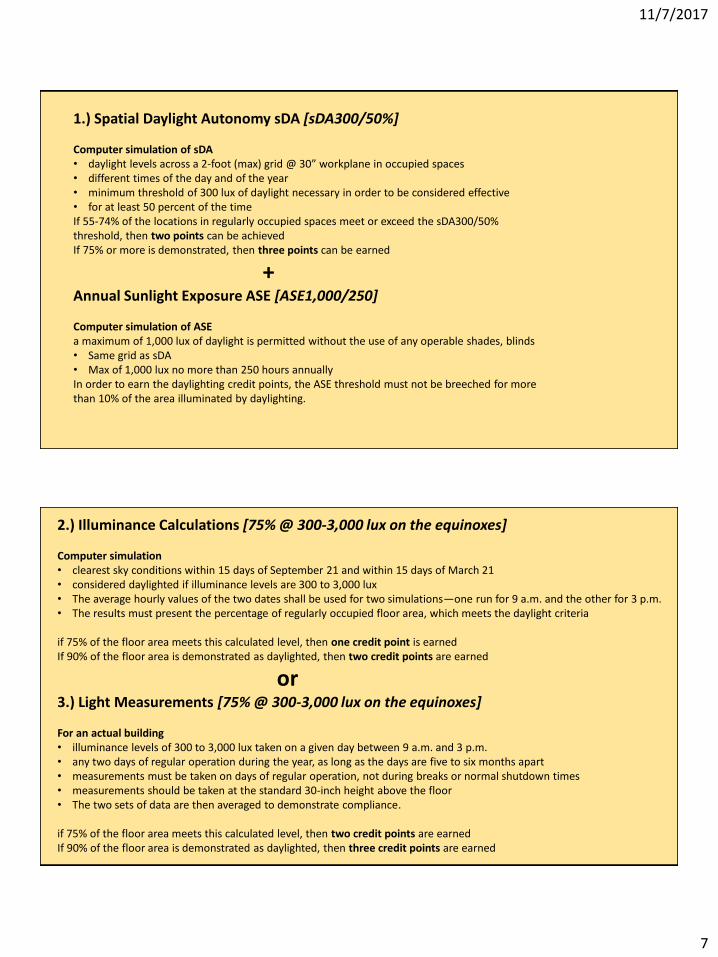
1.) Spatial Daylight Autonomy sDA [sDA300/50%]
Computer simulation of sDA• daylight levels across a 2-foot (max) grid @ 30” workplane in occupied spaces• different times of the day and of the year• minimum threshold of 300 lux of daylight necessary in order to be considered effective• for at least 50 percent of the timeIf 55-74% of the locations in regularly occupied spaces meet or exceed the sDA300/50% threshold, then two points can be achievedIf 75% or more is demonstrated, then three points can be earned
+Annual Sunlight Exposure ASE [ASE1,000/250]
Computer simulation of ASEa maximum of 1,000 lux of daylight is permitted without the use of any operable shades, blinds• Same grid as sDA• Max of 1,000 lux no more than 250 hours annuallyIn order to earn the daylighting credit points, the ASE threshold must not be breeched for more than 10% of the area illuminated by daylighting.
2.) Illuminance Calculations [75% @ 300-3,000 lux on the equinoxes]
Computer simulation• clearest sky conditions within 15 days of September 21 and within 15 days of March 21• considered daylighted if illuminance levels are 300 to 3,000 lux • The average hourly values of the two dates shall be used for two simulations—one run for 9 a.m. and the other for 3 p.m.• The results must present the percentage of regularly occupied floor area, which meets the daylight criteria
if 75% of the floor area meets this calculated level, then one credit point is earnedIf 90% of the floor area is demonstrated as daylighted, then two credit points are earned
or3.) Light Measurements [75% @ 300-3,000 lux on the equinoxes]
For an actual building• illuminance levels of 300 to 3,000 lux taken on a given day between 9 a.m. and 3 p.m.• any two days of regular operation during the year, as long as the days are five to six months apart• measurements must be taken on days of regular operation, not during breaks or normal shutdown times• measurements should be taken at the standard 30-inch height above the floor• The two sets of data are then averaged to demonstrate compliance.
if 75% of the floor area meets this calculated level, then two credit points are earnedIf 90% of the floor area is demonstrated as daylighted, then three credit points are earned
11/7/2017
8
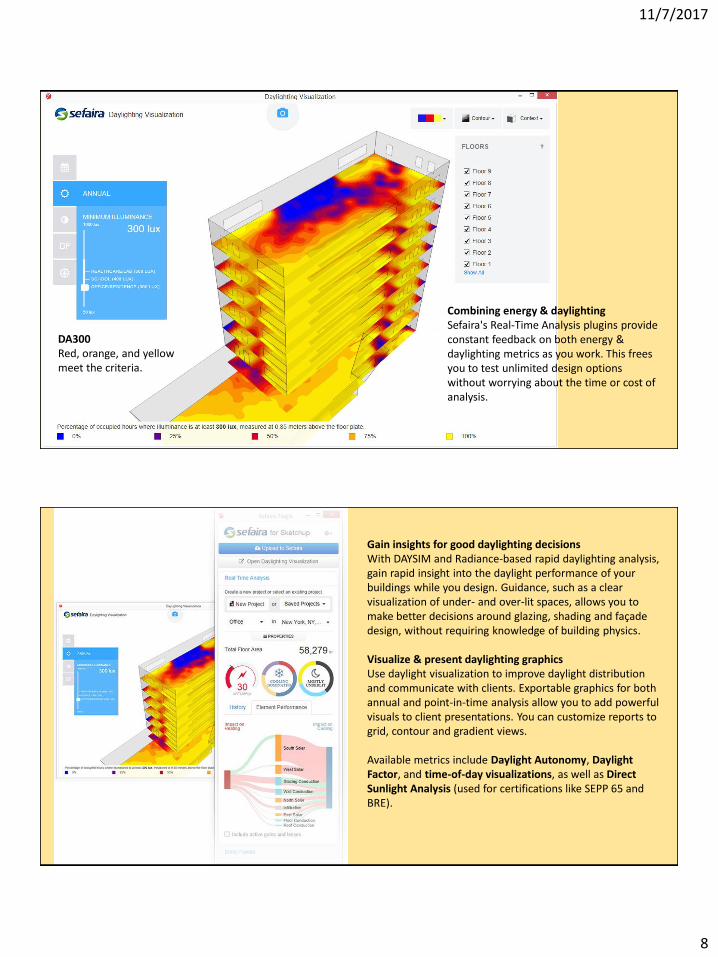
Combining energy & daylightingSefaira's Real-Time Analysis plugins provide constant feedback on both energy & daylighting metrics as you work. This frees you to test unlimited design options without worrying about the time or cost of analysis.
DA300Red, orange, and yellow meet the criteria.
Gain insights for good daylighting decisionsWith DAYSIM and Radiance-based rapid daylighting analysis, gain rapid insight into the daylight performance of your buildings while you design. Guidance, such as a clear visualization of under- and over-lit spaces, allows you to make better decisions around glazing, shading and façade design, without requiring knowledge of building physics.
Visualize & present daylighting graphicsUse daylight visualization to improve daylight distribution and communicate with clients. Exportable graphics for both annual and point-in-time analysis allow you to add powerful visuals to client presentations. You can customize reports to grid, contour and gradient views.
Available metrics include Daylight Autonomy, Daylight Factor, and time-of-day visualizations, as well as Direct Sunlight Analysis (used for certifications like SEPP 65 and BRE).
11/7/2017
9
Daylighting Visualizations in Sefaira Architecture
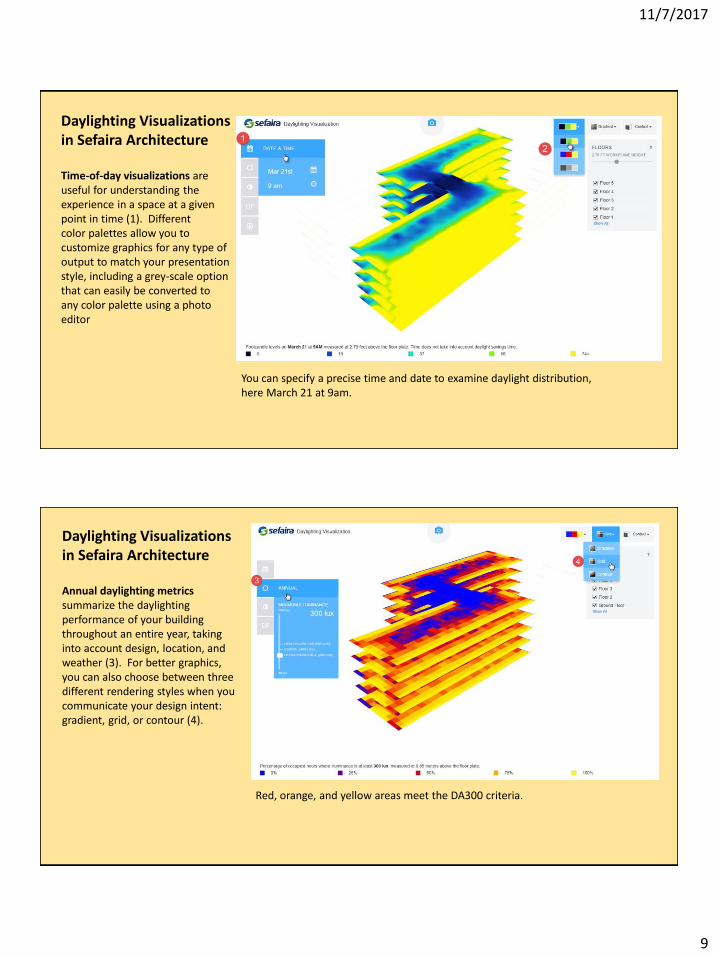
Time-of-day visualizations are useful for understanding the experience in a space at a given point in time (1). Different color palettes allow you to customize graphics for any type of output to match your presentation style, including a grey-scale option that can easily be converted to any color palette using a photo editor
You can specify a precise time and date to examine daylight distribution, here March 21 at 9am.
Daylighting Visualizations in Sefaira Architecture
Annual daylighting metrics summarize the daylighting performance of your building throughout an entire year, taking into account design, location, and weather (3). For better graphics, you can also choose between three different rendering styles when you communicate your design intent: gradient, grid, or contour (4).
Red, orange, and yellow areas meet the DA300 criteria.
11/7/2017
10
Daylighting Visualizations in Sefaira Architecture
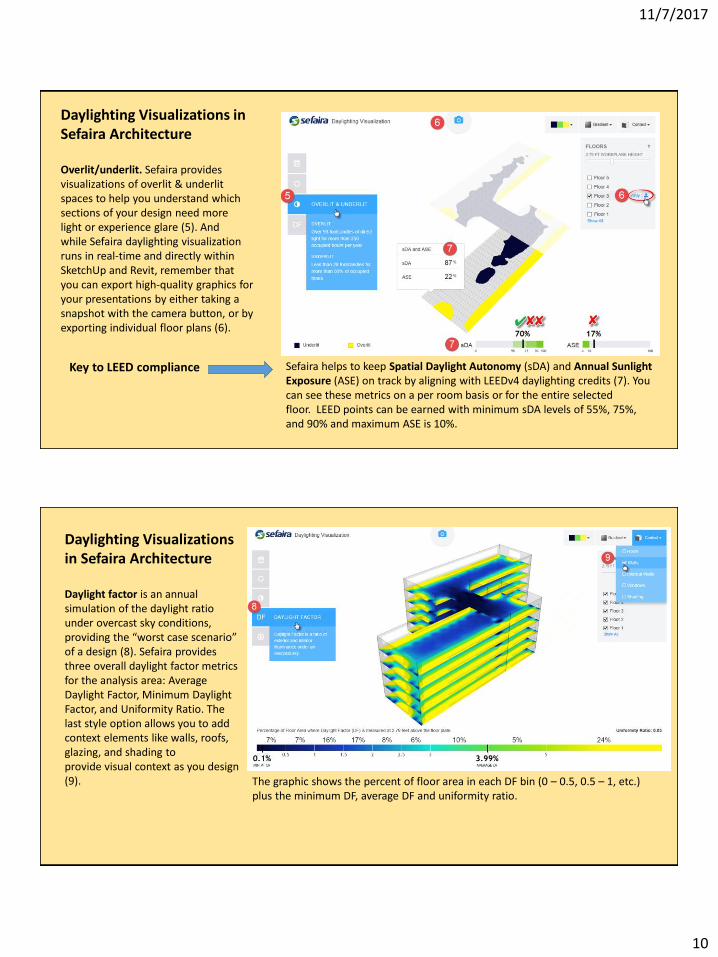
Overlit/underlit. Sefaira provides visualizations of overlit & underlitspaces to help you understand which sections of your design need more light or experience glare (5). And while Sefaira daylighting visualization runs in real-time and directly within SketchUp and Revit, remember that you can export high-quality graphics for your presentations by either taking a snapshot with the camera button, or by exporting individual floor plans (6).
Sefaira helps to keep Spatial Daylight Autonomy (sDA) and Annual Sunlight Exposure (ASE) on track by aligning with LEEDv4 daylighting credits (7). You can see these metrics on a per room basis or for the entire selected floor. LEED points can be earned with minimum sDA levels of 55%, 75%, and 90% and maximum ASE is 10%.
Key to LEED compliance
Daylighting Visualizations in Sefaira Architecture
Daylight factor is an annual simulation of the daylight ratio under overcast sky conditions, providing the “worst case scenario” of a design (8). Sefaira provides three overall daylight factor metrics for the analysis area: Average Daylight Factor, Minimum Daylight Factor, and Uniformity Ratio. The last style option allows you to add context elements like walls, roofs, glazing, and shading to provide visual context as you design (9). The graphic shows the percent of floor area in each DF bin (0 – 0.5, 0.5 – 1, etc.)
plus the minimum DF, average DF and uniformity ratio.
11/7/2017
11
Glare
Luminance based analysis methods have been historically difficult to conduct in scenes with daylight due to expensive equipment and the variable nature of scenes with daylight. Hand held luminance meters are not only expensive but it is difficult to record data in a space with daylight in a comprehensive manner before the daylight conditions change. High Dynamic Range (HDR) photography techniques have made access to luminance data from real daylighted spaces far more feasible to generate and computational methods are facilitating rapid development of new luminance-based analysis metrics. These techniques have been available in digital daylight simulations for many years but the development of these techniques for real spaces is more recent. Culplite recognizes that your camera is a multipoint luminance meter.
Each pixel gives relative luminance.
Glare
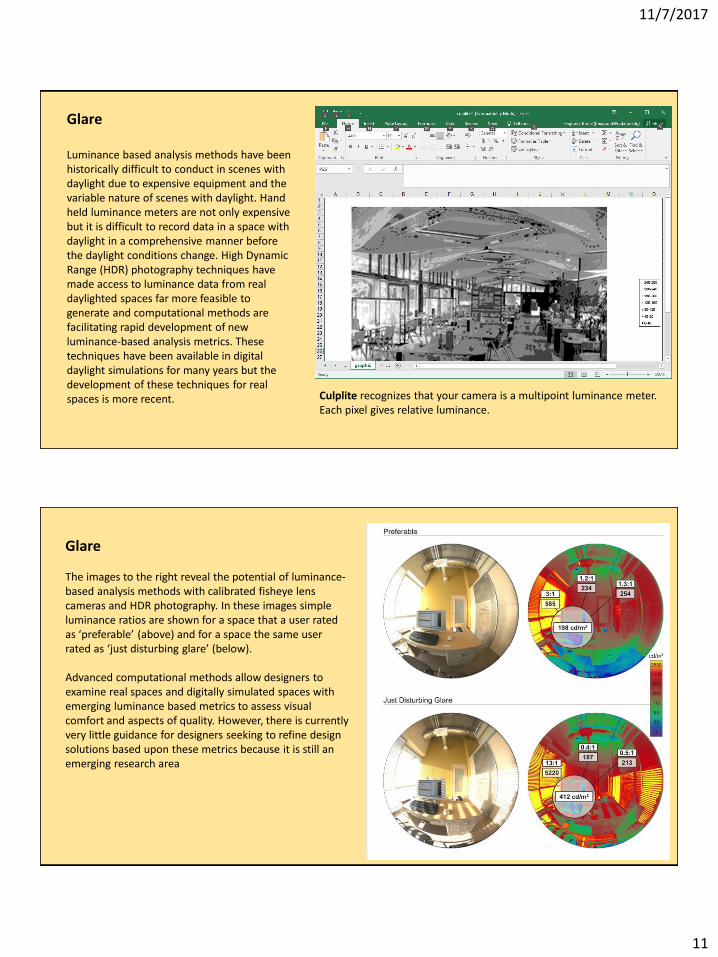
The images to the right reveal the potential of luminance-based analysis methods with calibrated fisheye lens cameras and HDR photography. In these images simple luminance ratios are shown for a space that a user rated as ‘preferable’ (above) and for a space the same user rated as ‘just disturbing glare’ (below).
Advanced computational methods allow designers to examine real spaces and digitally simulated spaces with emerging luminance based metrics to assess visual comfort and aspects of quality. However, there is currently very little guidance for designers seeking to refine design solutions based upon these metrics because it is still an emerging research area