dawn doppler aerosol wind lidar · pdf file · 2016-09-19dawn doppler aerosol wind...
TRANSCRIPT
DAWNDoppler Aerosol WiNd lidar
(hurricane)Genesis and Rapid Intensification Processes (GRIP)
Science Team MeetingEl Segundo, CA
Michael J. KavayaNASA Langley Research Center
June 6, 2011
1
Acknowledgements
NASA SMD Ramesh Kakar
AITT-07 “DAWN-AIR1”GRIP
Jack Kaye $ Augmentation
NASA SMD ESTOGeorge Komar, Janice Buckner, Parminder Ghuman, Carl Wagenfuehrer
LRRP, IIP-04 “DAWN”IIP-07 “DAWN-AIR2”
Airplane Change & Rephasing
NASA LaRC Director Office, Steve Jurczyk, $ AugmentationNASA LaRC Engineering Directorate, Jill Marlowe, John Costulis, $Augmentation
NASA LaRC Chief Engineer, Clayton Turner, 1 FTE
NASA LaRC Science DirectorateGarnett Hutchinson, Stacey Lee, and Keith Murray
2

Project Personnel (DAWN-AIR1, DAWN-AIR2, & GRIP)
3
Dr. Michael J. Kavaya* PI, LaRCOverall project coordination including cost and schedule
control and reporting. Lead, coherent lidar & data processing
Dr. Robert A. Atlas Co-I, NOAA AOML Dir. Science planning and data analysisDr. Jeffrey Y. Beyon* Co-I, LaRC Lead, data acquisition hardware and softwareGarfield A. Creary* LaRC Project Manager
Dr. G. David Emmitt Co-I, SWA Pres. Science planning, data analysis, lidar attitude knowledge
Dr. Grady J. Koch* Co-I, LaRC Lead, lidar system overview, lidar receiver design, lidar remote sensing
Paul J. Petzar* LaRC Lead , electronicsDr. Upendra N. Singh Co-I, LaRC Pulsed laser design, lidar remote sensing
Bo C. Trieu* Co-I, LaRC Lead, mechanical and thermal lidar subsystemsDr. Jirong Yu* Co-I, LaRC Lead, pulsed laser design, lidar remote sensing
Dr. Yingxin Bai SSAI Laser alignmentBruce W. Barnes LaRC SoftwareFrank L. Boyer LaRC Mechanical engineering
Dr. Joel F. Campbell LaRC Data processingDr. Songsheng Chen LaRC Laser alignmentMichael E. Coleman AMA Mechanical engineering
Larry J. Cowen LaRC Electronics technicianJoseph F. Cronauer SSAI SchedulingFred D. Fitzpatrick LaRC Electronics technician
Mark L. Jones LaRC INS/GPS softwareNathan Massick SSAI Mechanical engineeringEd A. Modlin LaRC Mechanical technicianAnna M. Noe LaRC Aircraft accommodationDon P. Oliver LaRC Aircraft accommodation
Karl D. Reithmaier SSAI Mechanical designGeoffrey K. Rose LaRC Mechanical engineeringTeh-Hwa Wong SSAI Mechanical engineering
William A. Wood LaRC Software
*also were DAWN operators on GRIP flights

4
Pulsed Coherent Lidar Wind Measurement - 7Frequency Estimation Error
• Abscissa is 7 orders of magnitude of SNR
• Upper ordinate is g/w [-]
• g – velocity error of “good” wind estimates [m/s]
• w is return signal spectral width [m/s]
• Wind turbulence σV [m/s] usually dominates value of w
• g/w is constrained between 0.1 and 1.1, only 1 order of
magnitude!
• b – fraction of wind estimates that are bad
• b is the deciding parameter!• Ω – 0.19 range gate length / pulse length• M – number of data samples
= SNR/M

DAWN Ground-Based Wind Performanceat Howard University, Beltsville, MD
5
0
1000
2000
3000
4000
5000
6000
7000
0 5 10 15 20
altit
ude
(m)
wind speed (m/s)
VALIDAR (3-minute integration)sonde
sonde on February 24, 2009 at 17:59 local
0
1000
2000
3000
4000
5000
6000
7000
270 280 290 300 310 320 330 340
altit
ude
(m)
wind direction (degrees)
VALIDAR (3-minute integration)sonde
Wind Direction• root-mean-square of difference between two sensors for all points shown = 5.78 deg
Wind Speed• root-mean-square of difference between two sensors for all points shown = 1.06 m/s
0
1000
2000
3000
4000
5000
6000
7000
-4 -3 -2 -1 0 1 2
alti
tude
(m)
sonde speed - VALIDAR speed (m/s)
0
1000
2000
3000
4000
5000
6000
7000
-20 -15 -10 -5 0 5 10 15 20
alti
tude
(m)
sonde direction - VALIDAR direction (degrees)

Nominal Scan Pattern: DAWN During GRIP Campaign
5 different azimuth angles from -45 to + 45°2 sec shot integration; 2 sec scanner turn time
30.12°
+45°
+22.5°
-45° -22.5°
0°
2 s, 288 m
Example:1 pattern = 22 s = 3,168 m
Along-Track & Temporal Resolution
Swath Width Depends on FlightAnd Measurement Altitudes
e.g., Flight Altitude = 10,586.4 mMeasurement Altitude = 0 m
Swath Width = 8,688 mNadir
144 m/s ground speed-45°
-22.5°
0°
+22.5°
+45°
6
Trade Off
Fast revisit time to less azimuth angles
vs.Slower revisit time to more azimuth angles
(less cloud blockage?, wind variability
studies, measure w)
Note: weather models assimilate LOS winds

7
196 seconds = 3 min, 16 sec = 28,224 m
Actual DC-8 and dropsonde trajectories for 9-1-2010Dropsonde launched at 17:20:15.49 Zulu
Dropsonde hit water 17:33:36.5 Zulu. Fall time = 201 sec
Nominal Scan Pattern: DAWN During GRIP Campaign
• DC-8 forward motion = 29 km
• 1 scan pattern = 22 sec
• Several different lidar scan
patterns may collocate with the
dropsonde at different altitudes
Same dropsonde shown
for two arbitrary
launches relative to
lidar scan pattern
DAWN Data ProductsAll vs. Along-Track Dimension
Near Term
1. 5 LOS wind profiles vs. altitude
2. 5 LOS relative aerosol backscatter profiles vs. altitude
3. Profile of u, v, and w vs. altitude (MAIN PRODUCT)
Farther Term
4. Wind turbulence profiles vs. altitude
5. Correlations of wind, wind turbulence, and aerosol backscatter
6. Assimilation of wind data into NWP models (NOAA)
7. Study of near ocean surface velocities (wind, spray, wave, current)
8. Multiple profiles of u, v, and w vs. altitude for investigating wind spatial variability (3 out
of 5)
GRIP Science Team
9. Fusion of wind data with other GRIP or non-GRIP data for hurricane research (GRIP
science team)8
9
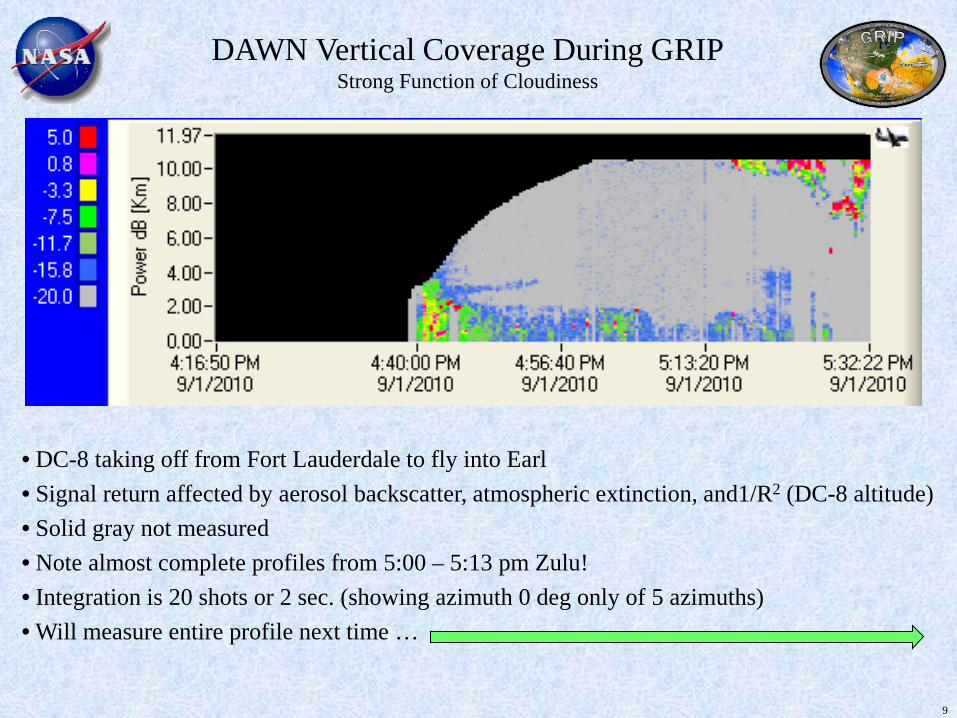
DAWN Vertical Coverage During GRIPStrong Function of Cloudiness
• DC-8 taking off from Fort Lauderdale to fly into Earl• Signal return affected by aerosol backscatter, atmospheric extinction, and1/R2 (DC-8 altitude)• Solid gray not measured• Note almost complete profiles from 5:00 – 5:13 pm Zulu!• Integration is 20 shots or 2 sec. (showing azimuth 0 deg only of 5 azimuths)• Will measure entire profile next time …

10
Why Entire Profiles Next Time
• Post-GRIP: Discovered burn on telescope secondary mirror likely entire GRIP ~ 10 dB loss. Already fixed 4/28/11.• Post-GRIP: Discovered slight lidar misalignment, at altitude had to cool laser to keep it working. This cooling misaligned the receiver ~ 3 dB loss for most of GRIP. Already fixed.• Planned 250 mJ, 10 Hz laser but actually 200 mJ, 10 Hz. Already fixed.• So we effectively flew a 200/10/2 = 10 mJ, 10 Hz laser• Next time will be 250 mJ, 10 Hz
For GRIP data, we still need to:• Implement best noise whitening• Implement zero padding for multiple shot frequency registration• Get 5-axis processing working• Combine several scan patterns by altitude bins for handoff to science team
11
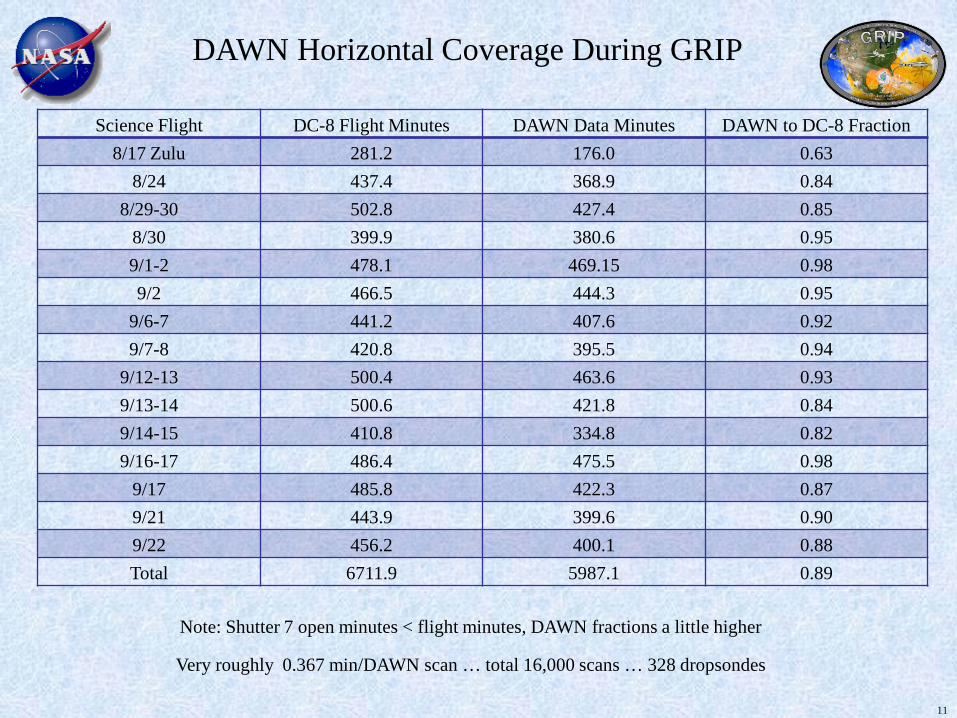
DAWN Horizontal Coverage During GRIP
Science Flight DC-8 Flight Minutes DAWN Data Minutes DAWN to DC-8 Fraction8/17 Zulu 281.2 176.0 0.63
8/24 437.4 368.9 0.848/29-30 502.8 427.4 0.85
8/30 399.9 380.6 0.959/1-2 478.1 469.15 0.989/2 466.5 444.3 0.95
9/6-7 441.2 407.6 0.929/7-8 420.8 395.5 0.94
9/12-13 500.4 463.6 0.939/13-14 500.6 421.8 0.849/14-15 410.8 334.8 0.829/16-17 486.4 475.5 0.98
9/17 485.8 422.3 0.879/21 443.9 399.6 0.909/22 456.2 400.1 0.88Total 6711.9 5987.1 0.89
Note: Shutter 7 open minutes < flight minutes, DAWN fractions a little higher
Very roughly 0.367 min/DAWN scan … total 16,000 scans … 328 dropsondes
12
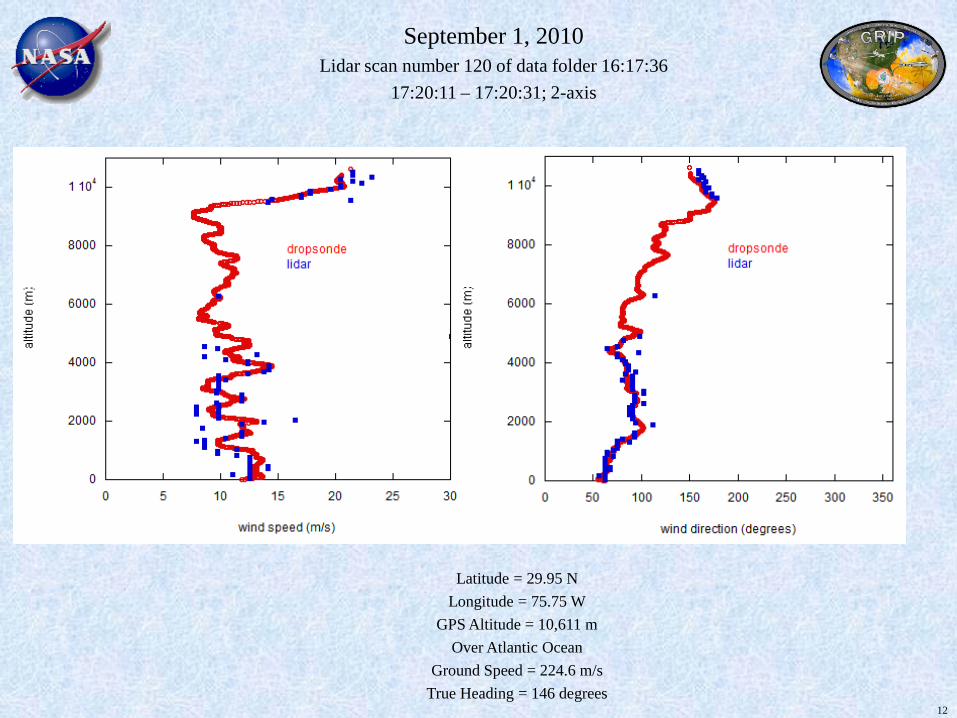
September 1, 2010Lidar scan number 120 of data folder 16:17:36
17:20:11 – 17:20:31; 2-axis
Latitude = 29.95 NLongitude = 75.75 W
GPS Altitude = 10,611 mOver Atlantic Ocean
Ground Speed = 224.6 m/sTrue Heading = 146 degrees
13
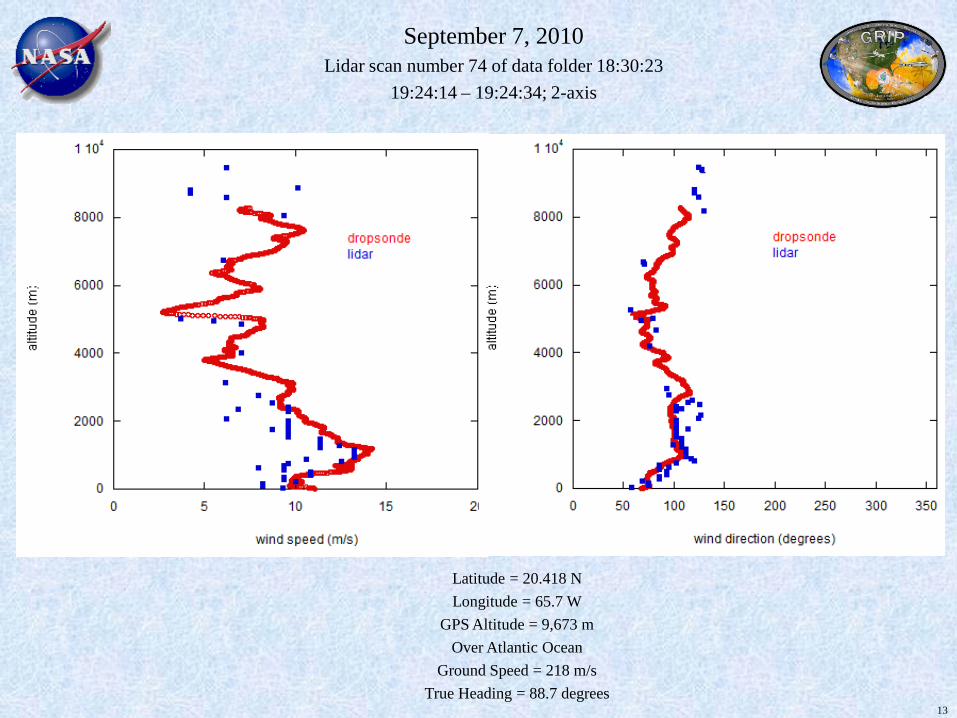
September 7, 2010Lidar scan number 74 of data folder 18:30:23
19:24:14 – 19:24:34; 2-axis
Latitude = 20.418 NLongitude = 65.7 W
GPS Altitude = 9,673 mOver Atlantic Ocean
Ground Speed = 218 m/sTrue Heading = 88.7 degrees
14
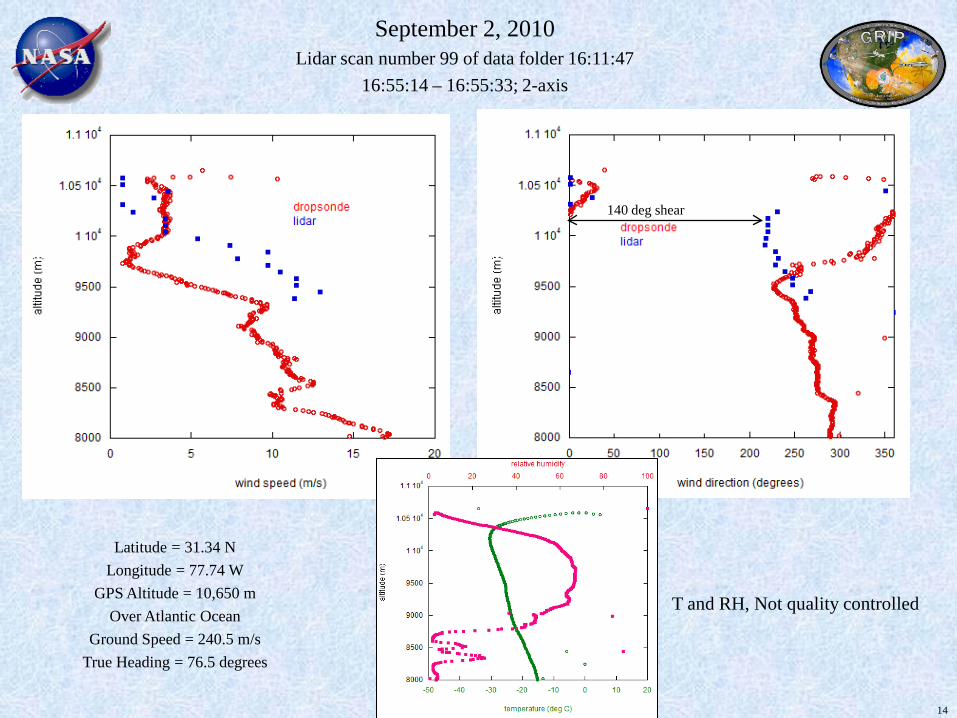
September 2, 2010Lidar scan number 99 of data folder 16:11:47
16:55:14 – 16:55:33; 2-axis
Latitude = 31.34 NLongitude = 77.74 W
GPS Altitude = 10,650 mOver Atlantic Ocean
Ground Speed = 240.5 m/sTrue Heading = 76.5 degrees
140 deg shear
T and RH, Not quality controlled

Didn’t Know Flight Campaigns Were So Fun
15

Back Up Slides
16

DAWNDoppler Aerosol WiNd lidar
Previous implementation90 mJ per pulse
Completed DAWN packageSmall, Robust, 250 mJ per pulse
DAWN Transceiver (Transmitter + Receiver)250 mJ/pulse, 10 pulses/sec.
5.9” x 11.6” x 26.5”, 75 lbs.; 15 x 29 x 67 cm, 34 kg
Fiscal years 2008 – 2010Compactly and robustly package the 2-micron, Ho:Tm:LuLiF, pulsed laser technology developed at Langley for
eventual global wind measurements from earth orbit (Jay’s section)Langley has previously demonstrated a world record 1200 mJ of pulse energy with this technologySimulations of the winds space mission indicate a requirement of 250 mJ pulse energy at 5 HzLaser derating of technology is wise for space missions
5.9” x 11.6” x 26.5”; 75 lbs
17
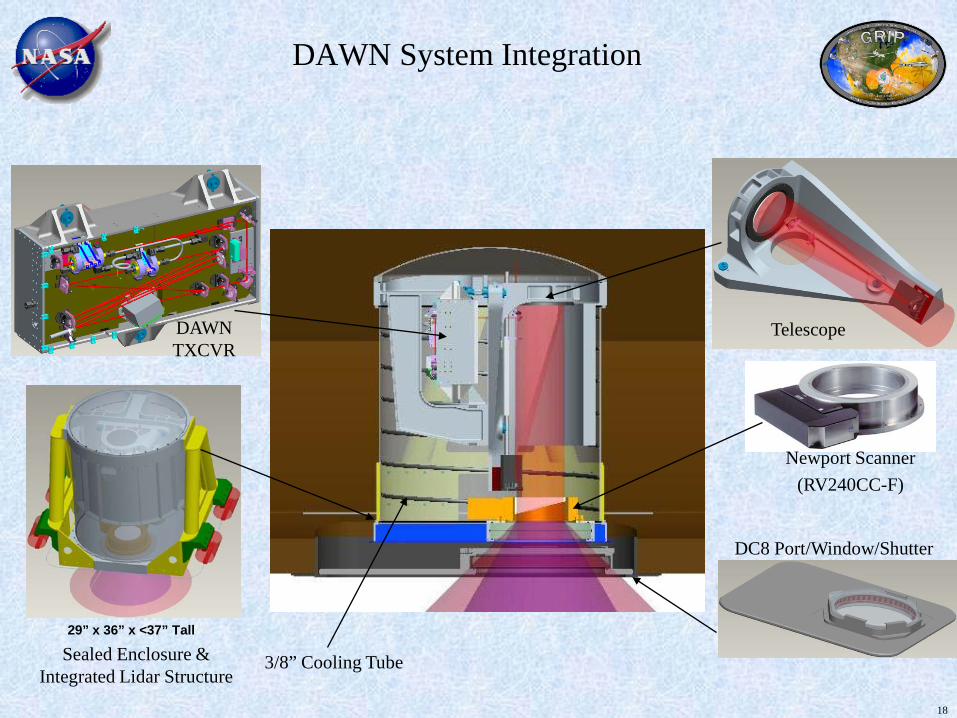
DAWN System Integration
DAWN TXCVR
3/8” Cooling Tube
Telescope
29” x 36” x <37” Tall
Sealed Enclosure & Integrated Lidar Structure
Newport Scanner(RV240CC-F)
DC8 Port/Window/Shutter
18

Pulsed Coherent-Detection 2-MicronDoppler Wind Lidar System
Lidar System
Propagation Path (Atmosphere)
Computer, Data Acquisition, and Signal Processing
(including software)
Laser & Optics Scanner Telescope
Target(Atmospheric
Aerosols)
Pulsed Transmitter Laser(includes CW injection laser)
Detector/Receiver(may include 2nd CW LO laser)
Polarizing Beam
Splitter
λ/4Plate
Transceiver
Electronics(Power Supplies,
Controllers)Laser Chillers
19
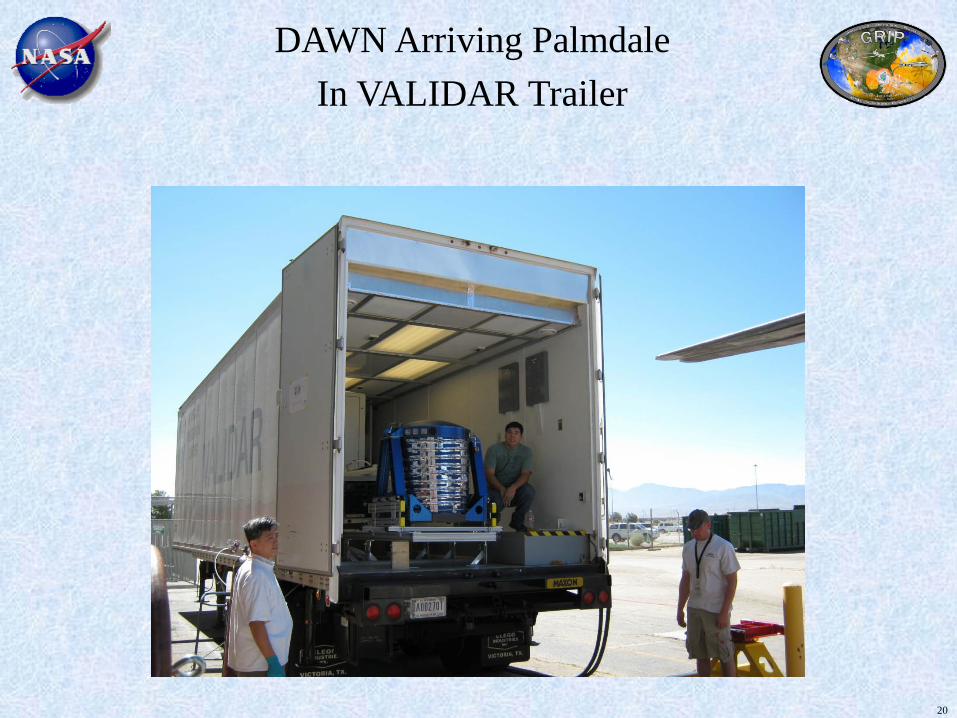
DAWN Arriving PalmdaleIn VALIDAR Trailer
20

DAWN Optics Mounted in DC-8 Cargo Level
21

Three Cabin Stations with 2 or 3 Operators
22
1. Laser Control (L) 2. Data Processing (R)
3. 3 Laser Chillers

Frequencies, Angles, and Velocities
SEED
LASER
PULSED
LASER
AOM
OPTICAL
DETECTOR 1
AEROSOL PARTICLES
VAC
VW
OPTICAL
DETECTOR 2
fAOM
fJITTER
0 0;assume AOM JITTER AOM AOM JITTERf f f f f f = − > >
assume k JITTER AC W AC JITTER Wf f f f f f f = + + > +
0Rn Tn AIRCRAFTn Wn n kn AOMf f f f f f f⇒ − = + = + −
Lidar SystemAV
WV
ΩA-L
ΩW-L
LV
plane samein not and WA VV
Aerosol Particle
2 cos cosR T A A L W W LT
f f V Vλ − −
− = Ω − Ω
( )( )
cos sin sin cos cos cos
cos sin sin cos cos cosA L A L A L A L
W L W L W L W L
θ θ φ φ θ θ
θ θ φ φ θ θ−
−
Ω = − +
Ω = − +
23

1 2 3 4
Coordinate System
Aircraft Body Coordinates
Forward-Right-DownFRD
North-East-Down Coordinates
NED
East-North-UpCoordinates
ENU
NEDExcept
“Air Coming From”* “SWD”
Right-Hand,Perpendicular
Axes
Axes glued to aircraft body
Axes fixed in air wherever you are
Axes fixed in air wherever you are No such axes
2 Laser Beam Direction Angles
θL, φL from optics offsets and lidar
scanner
3 Aircraft Rotations
Yaw = Heading, Pitch, Roll from
INS/GPS
3 Aircraft Velocity Components
VAE, VAN, VAUfrom INS/GPS
3 Desired Wind Components VWU VWN, VWE
Equations Down = Belly Direction
VAN = VAEVAE = VANVAD = -VAU
VAN* = -VANVAE* = -VAEVAD* =VAD
Juggling 4 Coordinate Systems
Use INS/GPS yaw, pitch, roll to go between these two coordinate systems Simple equations go between these pairs of coordinate systems
24

25
Each pair of lines
drawn represents
shot accumulation
consisting of 2 sec
and 20 laser shots
Each scan pattern has 5 of
these “20 string harps” tilted
rectangles. Each “harp
string” is approximately a
cylinder of 20 cm diameter.
Nominal Scan Pattern: DAWN During GRIP Campaign
Example of range
gate length, 153.5
m in range, 133 m
in height

26
Wind Measurement Volume and TimeAssume DC-8 at 10.6 km or 34.7 Kft; going 144 m/s or 280 knots
Single Laser Pulse• Light travels 12.242 km slant range to surface in 40.8 microsec (light in atmosphere)• Beam diameter grows from 15 cm at DC-8 to 30 cm at surface• Illuminated measurement volume ~ π x (0.1 m)2 x range gate length ~ 5 m3
• DC-8 flies forward 6 mm• Repeats every 100 ms or 14.4 m; along-track duty cycle = 0.04%
LOS Wind Profile• Consists of 20 laser shots evenly spaced over 2 s and 288 m• Light in atmosphere time = 20 x 40.8 microsec = 817 microsec• Illuminated measurement volume = 20 x 5 m3 ~ 100 m3
• Repeats every 4 s and 576 m along track distance; along-track duty cycle = 0.02% or 50%
u,v,w Wind Profile• Consists of 5 LOS wind profiles at different azimuth angles• Light in atmosphere time = 5 x 817 microsec = 4.1 ms• Illuminated measurement volume = 5 x 100 m3 ~ 500 m3
• Repeats every 22 s and 3168 m along track distance• Along-track duty cycle = 0.02% or 50% or 100%

Coherent detection wind lidar figure of merit*
DAWN Compared to Commercial Doppler Lidar Systems
27
Lidar System Energy PRF D FOM FOM Ratio
Lockheed Martin CT
WindTracer2 mJ 500 Hz 10 cm 4,472 40
Leosphere Windcube 0.01 20,000 2.2 7 25,400
LaRC DAWN 250 10 15 177,878 1
The LaRC DAWN advantage in FOM may be used to simultaneously improve aerosol sensitivity, maximum range,
range resolution, and measurement time (horizontal resolution).
( ) 1 2Minimum Required Aerosol Backscatter E PRF D− ∝
*SNR is not a good FOM for coherent detection wind 29” x 36” x <37” Tall

28
DAWN Lidar Specifications
Mobile and AirborneNASA DC-8
LaRC VALIDAR Trailer
Pulsed LaserHo:Tm:LuLF, 2.05 microns
2.8 m folded resonator~250 mJ pulse energy
10 Hz pulse rate180 ns pulse duration
Master Oscillator Power AmplifierLaser Diode Array side pumped, 792 nm
~Transform limited pulse spectrum~Diffraction limited pulse spatial quality
Designed and built at LaRC
Lidar System in DC-8Optics can in cargo level
Centered nadir port 7One electronics rack in cargo level
Two electronics racks in passenger levelRefractive optical wedge scanner, beam
deflection 30.12 degConical field of regard centered on nadir
All azimuth angles programmable
Lidar System15-cm diameter off-axis telescope
Dual balanced heterodyne detectionInGaAs optical detectors
Integrated INS/GPS
DAWN Operation in GRIP
29
• DAWN was completed and shipped to Palmdale on 7/15/10 as required, much earlier than the AITT and
IIP completion dates of 3/31/11 and 11/30/11
• DAWN operated and collected data for a large fraction of the 25 DC-8 flights (3 shakedown, 1
checkout, 6 ferry, and 15 science flights), and of the 139 total flight hours (113 science hours)
• Many of the flight hours were over or in thick clouds, which blocked the laser beam
• The laser pulse energy decrease from unplanned cooling at altitude was quickly mitigated, and
workarounds implemented by the science flights
• Cloud layers revealed in the laser signal were frequently corroborated with the LASE display
• Post GRIP examination revealed a burned telescope secondary mirror which may have cost 10 dB or
more in SNR
• Coverage of the atmosphere vertically was probably reduced due to the SNR loss
• Data analysis is proceeding and has already revealed lidar agreement with dropsonde when SNR is high
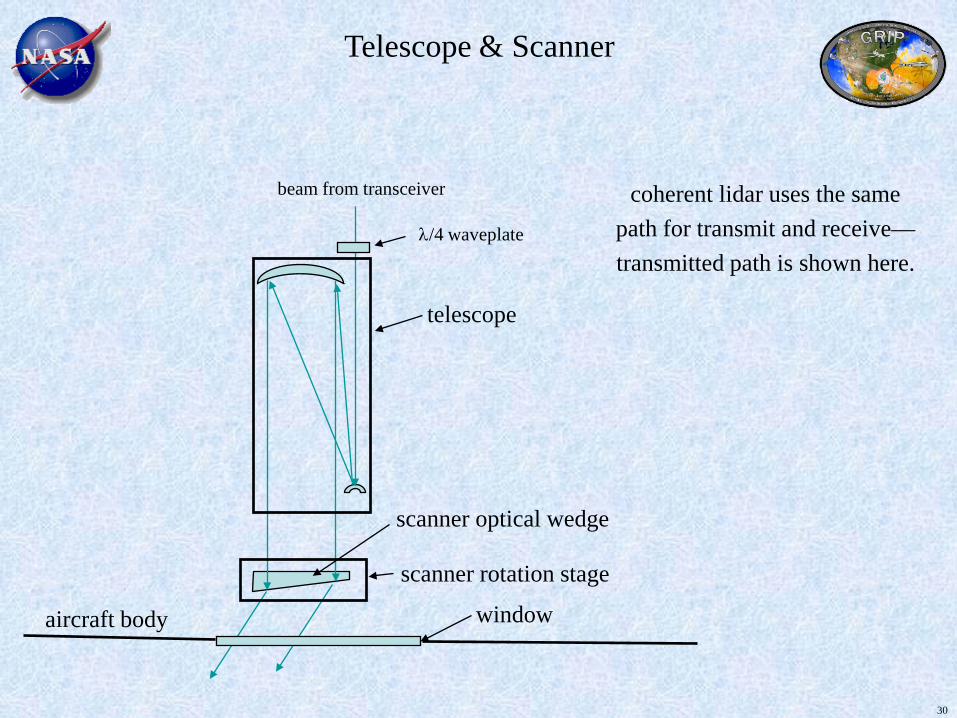
telescope
scanner optical wedge
scanner rotation stage
window
beam from transceiver
aircraft body
Telescope & Scanner
coherent lidar uses the same path for transmit and receive—transmitted path is shown here.
λ/4 waveplate
30
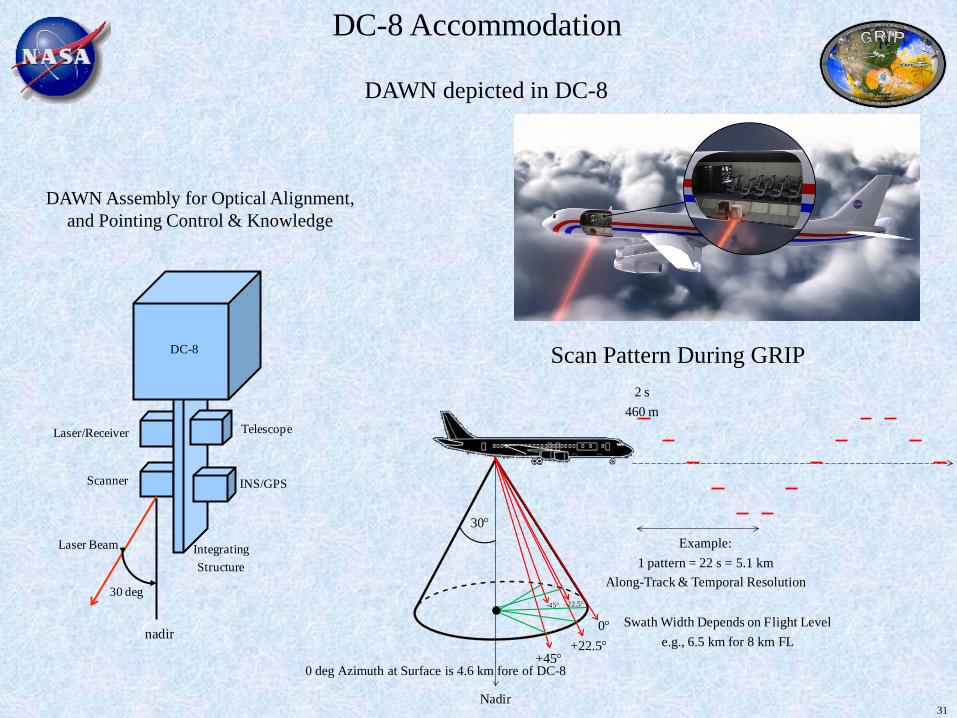
DAWN depicted in DC-8
DC-8
Scanner
TelescopeLaser/Receiver
INS/GPS
Laser Beam
30 deg
nadir
IntegratingStructure
DAWN Assembly for Optical Alignment, and Pointing Control & Knowledge
30°
+45°+22.5°
-45° -22.5°
0°
2 s460 m
Example:1 pattern = 22 s = 5.1 km
Along-Track & Temporal Resolution
Nadir
Swath Width Depends on Flight Levele.g., 6.5 km for 8 km FL
DC-8 Accommodation
0 deg Azimuth at Surface is 4.6 km fore of DC-8
Scan Pattern During GRIP
31

32
Not in the INS/GPS Manual
• Assumes sequence of rotation is yaw, then pitch, then roll
• Assumes sense of rotation is rotating axes rather than rotating vector
• Assumes true north, not magnetic north
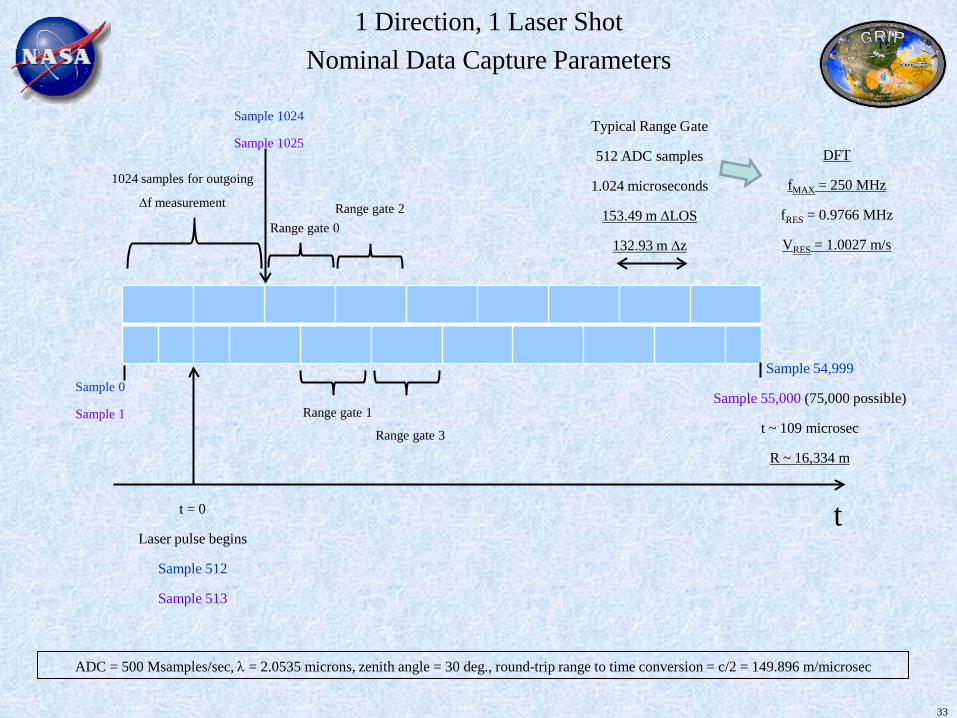
tt = 0
Laser pulse begins
Sample 512
Sample 513
Typical Range Gate
512 ADC samples
1.024 microseconds
153.49 m ∆LOS
132.93 m ∆z
ADC = 500 Msamples/sec, λ = 2.0535 microns, zenith angle = 30 deg., round-trip range to time conversion = c/2 = 149.896 m/microsec
1024 samples for outgoing
∆f measurement
Range gate 0
Range gate 1
Range gate 2
Range gate 3
DFT
fMAX = 250 MHz
fRES = 0.9766 MHz
VRES = 1.0027 m/s
Sample 54,999
Sample 55,000 (75,000 possible)
t ~ 109 microsec
R ~ 16,334 m
Sample 0
Sample 1
Sample 1024
Sample 1025
1 Direction, 1 Laser ShotNominal Data Capture Parameters
33
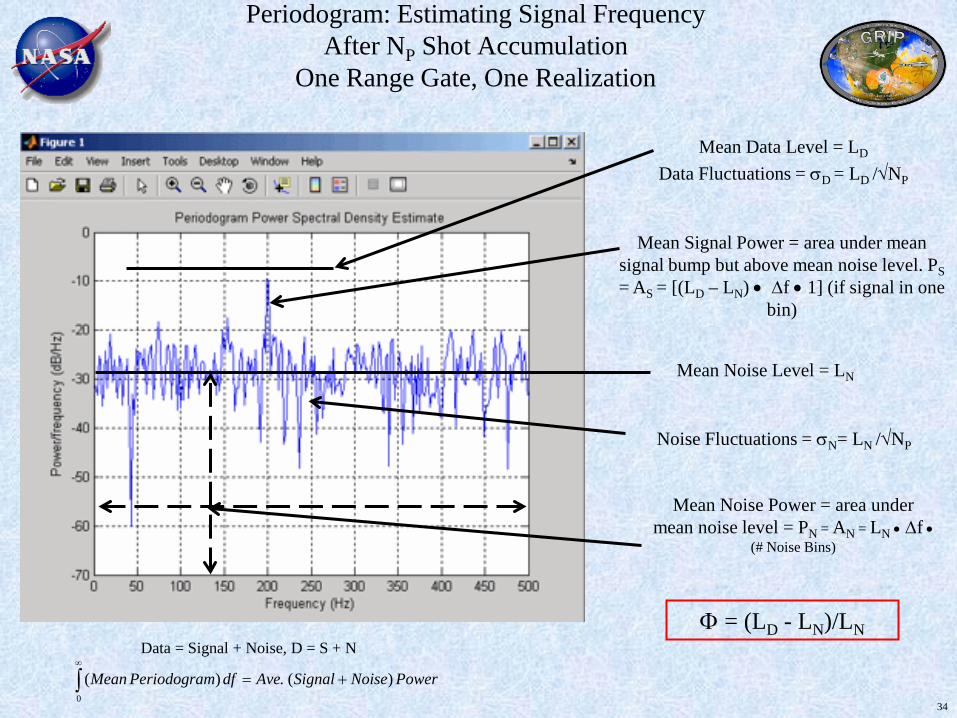
Periodogram: Estimating Signal FrequencyAfter NP Shot Accumulation
One Range Gate, One Realization
Mean Signal Power = area under mean signal bump but above mean noise level. PS = AS = [(LD – LN) • ∆f • 1] (if signal in one
bin)
Mean Noise Level = LN
Mean Data Level = LD
Data Fluctuations = σD = LD /√NP
Noise Fluctuations = σN= LN /√NP
Mean Noise Power = area under mean noise level = PN = AN = LN • ∆f •
(# Noise Bins)
Φ = (LD - LN)/LNData = Signal + Noise, D = S + N
∫∞
+=0
)(.)( PowerNoiseSignalAvedfmPeriodograMean34

Coherent or Heterodyne Lidar
~~CW LO Laser
TelescopePulsedLaser
Detector
1.4599306 1014 Hz or1.4599286 1014 Hz
1.4599296 1014 Hz
100 106 HzADC Computer
Fractional wavelength or frequency change ~ 7 x 10⁻⁷ ~ 0.7 ppm
35

DAWN Pulsed Coherent Doppler Wind LidarEngineering/Science Parameter Tradeoffs
( )( )[ ] ( )
2 1,1,11 2 ,
1.52 2
ln 4 / cos( )(1)
cos( )AIRCRAFT MIN SEARCH AZIMUTHS H AIRCRAFT
MIN
z C V z c C N VPRF x zED T
λ θ
θ β
Φ ∆ + ∆ ∆
( )21 3 ,
2
ln(2)AIRCRAFT SEARCH AZIMUTHS H AIRCRAFT
MIN
z C V z C N VT x zβ
∆ + ∆ ∆
( )1 3ln(3)SEARCH
MIN
C V z C
x zβ
∆ + ∆ ∆
[ ]
z = altitude [m] aircraft altitudeR = range of lidar to target [m] R / cos( )
laser beam nadir angle [radians] 30 = detected coherent photoelectrons per shot per range gate [-]
AIRCRAFT
MAX AIRCRAFT
zz θ
θ
==
= °
Φ
( )( )
1,1,12 minimum usable for 1 shot & 1 m range gate
& 1frequency bin search BW 1
4 / [ ]Data processing range gate length [m]
search band for wind velocity
MIN
SEARCH
SEARCH SEARCH
SEARCH
C
N m
N RV cR
V
λ
Φ = Φ
= = ∆ −
∆ ==
( )
6
[m/s]height resolution cos( ) [ ]
speed of light [m/s] laser wavelength [m] 2.05 10
/ 4 150; c / 4 R 150 / lidar laser pulse energy [J] [250 mJ]
D = circular receiver collection diamet
z R m
c m
c RE
θ
λ
λ λ
−
∆ = = ∆
= = ≈ ∆ ≈ ∆
=
1 1
,
er [m] [0.15 m]T = 1-way atmospheric intensity transmission [-]
= aerosol backscatter coefficient
number lidars scanner azimuths per repeated pattern [-]V Aircraft hor
AZIMUTHS
H AIRCRAFT
m sr
N
β − − == izontal velocity [m/s]
x = along-track horizontal resolution (pattern repeat) [m]∆
1. Before Lidar Design and Fabrication
(Hold each expression constant for parameter trades)
2. After Fabrication, Before Data Collection
3. After Data Collection, Before Dissemination
Trade: aircraft height and velocity, vertical and horizontal resolution, minimum detectible aerosol level, atmospheric transmission, number of measured azimuth
directions, and velocity search space
Trade: vertical and horizontal resolution, minimum detectible aerosol level, and velocity search space GRIP science team input requested for stages 2 & 3.
Send comments to [email protected] 36

37
Wind Measurement Performance
Data Products
Vertical profiles of u, v, w wind field from aircraft to surface, clouds
permitting. Profiles of wind turbulence. Profiles of relative
backscatter. Wind spatial variability.
Velocity accuracy (m/s) < 1-2
Vertical resolution (km) Selectable, typically 133 m
Horizontal integration per LOS (s) Selectable, typically 2 s (~460 m)
Nadir Angle (deg) 30
Scan Pattern5 azimuth angles/pattern (selectable)
1 pattern/22 s (~ 5000 m)(processing speed limited)
Range of regard (km) 0 – 12 (DC-8 to surface)
DAWNon
DC-8
3-D Winds Decadal Survey Space Mission
Pulse Energy 0.25 J 0.25 J
Pulse Rate 10 Hz 5 Hz
Receiver Optical
Diameter0.15 m 0.5 m
# Telescopes 1 4
Scanner Wedge N/A
Nadir Angle 30 deg 45 deg
38
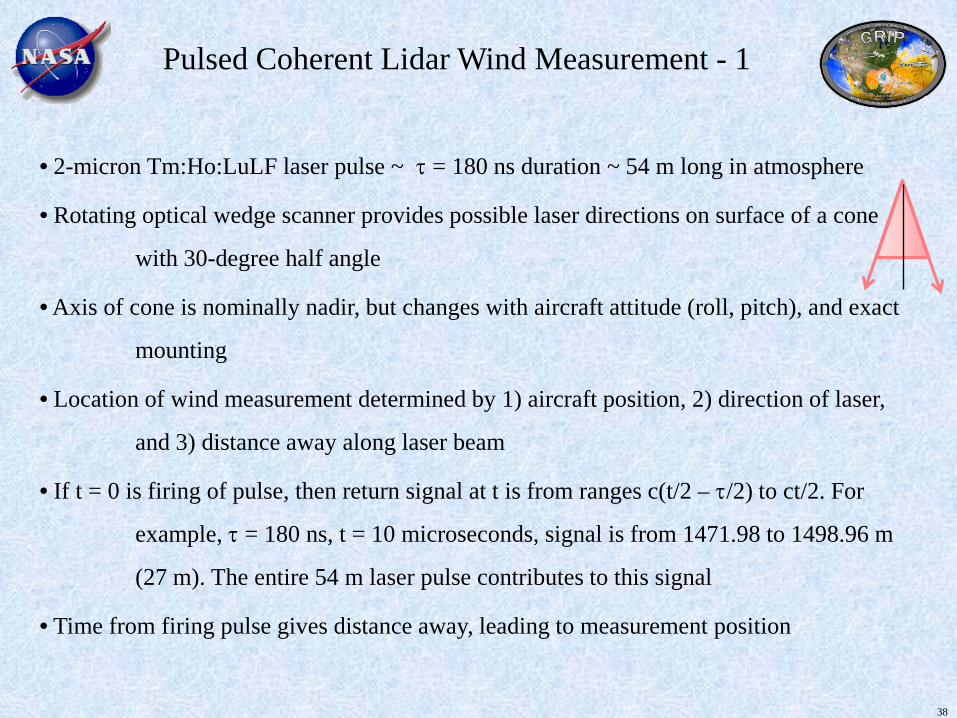
Pulsed Coherent Lidar Wind Measurement - 1
• 2-micron Tm:Ho:LuLF laser pulse ~ τ = 180 ns duration ~ 54 m long in atmosphere
• Rotating optical wedge scanner provides possible laser directions on surface of a cone
with 30-degree half angle
• Axis of cone is nominally nadir, but changes with aircraft attitude (roll, pitch), and exact
mounting
• Location of wind measurement determined by 1) aircraft position, 2) direction of laser,
and 3) distance away along laser beam
• If t = 0 is firing of pulse, then return signal at t is from ranges c(t/2 – τ/2) to ct/2. For
example, τ = 180 ns, t = 10 microseconds, signal is from 1471.98 to 1498.96 m
(27 m). The entire 54 m laser pulse contributes to this signal
• Time from firing pulse gives distance away, leading to measurement position

39
Pulsed Coherent Lidar Wind Measurement - 2
• Laser pulse optical frequency = 1.4599296 1014 Hz (Tm,Ho:LuLiF at 2.053472 microns)
• Return signal Doppler shifted by line-of-sight (LOS) lidar platform and wind velocities
(+973,960 Hz per m/s of closing velocity, neglecting relativity)
• Optical detector surface mixes return signal with local oscillator (LO) beam to lower
signal frequency by 8-14 orders of magnitude
• Maximum design horizontal wind (e.g., 100 m/s): horizontal wind bandwidth = 200 m/s
or 194.792 MHz; LOS wind bandwidth = 97.396 MHz (at 30 deg. nadir)
• Pulsed laser to LO frequency offset and/or platform velocity designed to position 0 m/s
wind signal at freq. f0; possible signal freq. go from f0 – 48.7 to f0 + 48.7 MHz
• Return signal digitized at rate high enough to capture highest frequency, f0 + 48.7 MHz,
for example fS = 500 Msample/second. Sample spacing = 2 ns
• Also mix LO with outgoing laser pulse, digitize, determine pulse-LO frequency
difference, determine t = 0, and store these numbers for each pulse

40
Pulsed Coherent Lidar Wind Measurement - 3
• Now the data are in a computer
• Locate correct t = 0 position in data
• Return signal divided into end-to-end time chunks of duration ∆t for processing
• Range gate length is ∆R = (c∆t)/2. For example, ∆t = 1.024 microseconds, ∆R = 153.5 m
[Height resolution is ∆R * cos(beam nadir angle) ~ ∆R * 0.866 at 30 deg.]
• On each range gate, perform a 1024 ns/2 ns = 512 point FFT and calculate periodogram
(periodogram is energy content vs. frequency)
• Periodogram output frequency spacing = 1/∆T = 0.976562 MHz (1.003 m/s); highest
frequency = fS/2 = 250 MHz (256.7 m/s); number of output complex numbers =
250/0.976562 = 256; number of real output numbers = 2 * 256 = 512
• Repeat for multiple laser pulses and build up an average periodogram for each range gate
periodogram
41
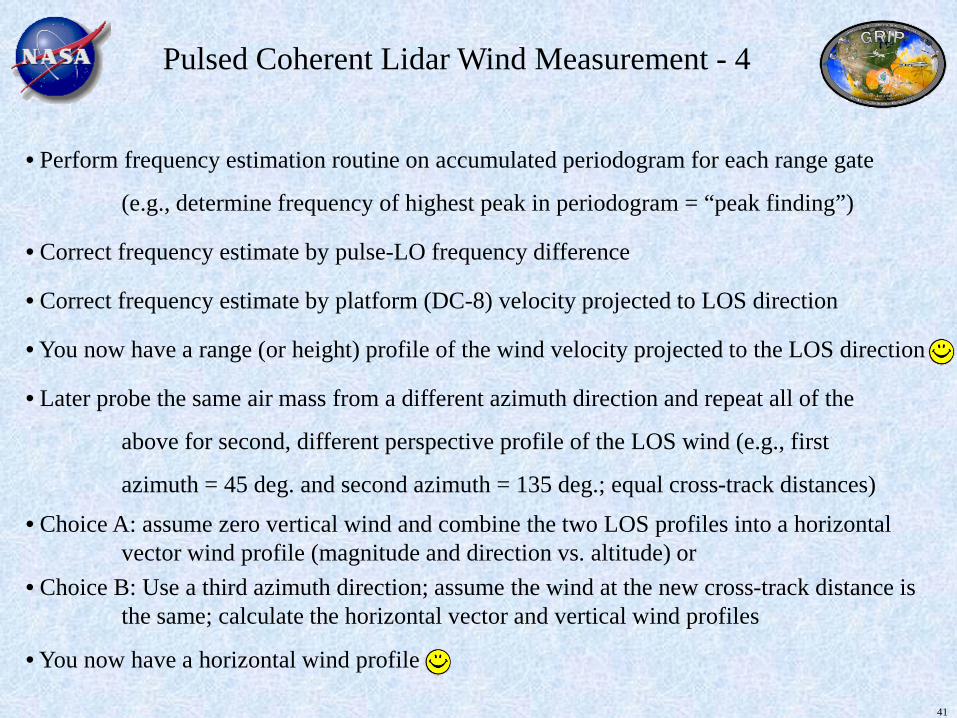
Pulsed Coherent Lidar Wind Measurement - 4
• Perform frequency estimation routine on accumulated periodogram for each range gate
(e.g., determine frequency of highest peak in periodogram = “peak finding”)
• Correct frequency estimate by pulse-LO frequency difference
• Correct frequency estimate by platform (DC-8) velocity projected to LOS direction
• You now have a range (or height) profile of the wind velocity projected to the LOS direction
• Later probe the same air mass from a different azimuth direction and repeat all of the
above for second, different perspective profile of the LOS wind (e.g., first
azimuth = 45 deg. and second azimuth = 135 deg.; equal cross-track distances)
• Choice A: assume zero vertical wind and combine the two LOS profiles into a horizontal vector wind profile (magnitude and direction vs. altitude) or
• Choice B: Use a third azimuth direction; assume the wind at the new cross-track distance is the same; calculate the horizontal vector and vertical wind profiles
• You now have a horizontal wind profile

“heterodyne detection can allow measurement of the phase of a single-frequency wave to a precision
limited only by the uncertainty principle”Michael A. Johnson and Charles H. Townes
Optics Communications 179, 183 (2000)
Heterodyne (Coherent) Detection
42

43
Dropsondes
• Airborne Vertical Atmospheric Profiling System (AVAPS)
• Vaisala
• Wind data every 0.5 sec
• < 400 g
• 7-cm diameter x 41-cm long
• Square-cone parachute
• Fall velocity = 12 m/s at sea level
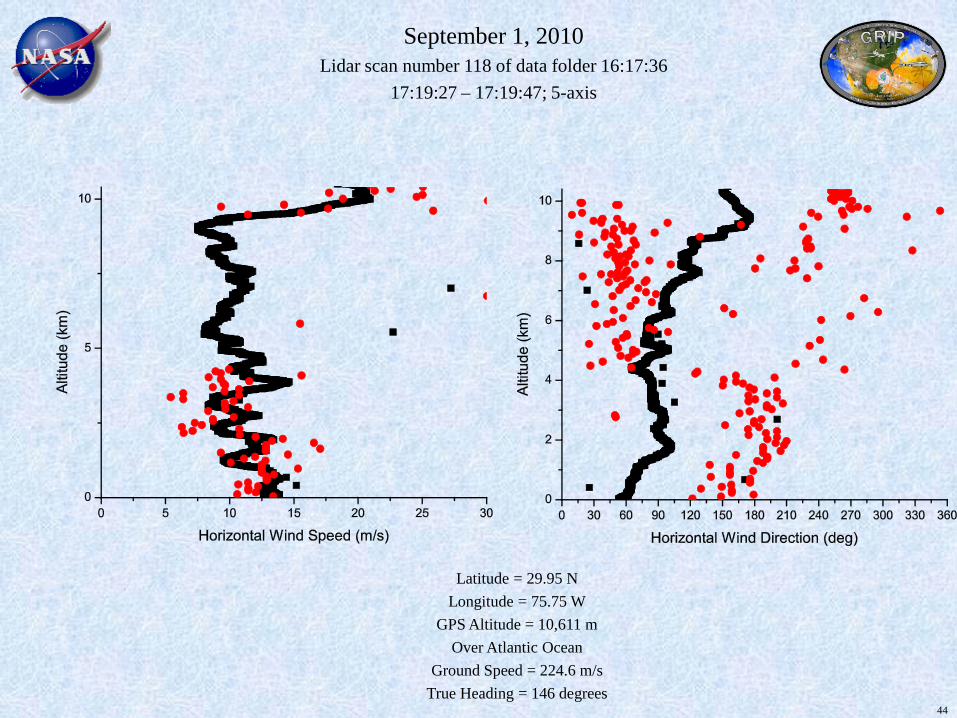
44
September 1, 2010Lidar scan number 118 of data folder 16:17:36
17:19:27 – 17:19:47; 5-axis
Latitude = 29.95 NLongitude = 75.75 W
GPS Altitude = 10,611 mOver Atlantic Ocean
Ground Speed = 224.6 m/sTrue Heading = 146 degrees