david geelan griffith university – gold coast
DESCRIPTION
Effectiveness of Scientific Visualizations in Year 11 Chemistry and Physics Education. David Geelan Griffith University – Gold Coast. Overview. 12 Chemistry classes and 10 physics classes Comparison of student conceptual knowledge gains when taught with and without visualisations - PowerPoint PPT PresentationTRANSCRIPT

David GeelanGriffith University – Gold Coast
Effectiveness of Scientific Visualizations in Year 11 Chemistry and Physics Education

OverviewOverview
12 Chemistry classes and 10 physics classes
Comparison of student conceptual knowledge gains when taught with and without visualisations
Sex of students and academic ability as further variables

Background Lots of good evidence that students enjoy
learning with visualisations Lots of teachers adopting them, lots of
money being spent developing, hosting and sharing them
Not much good quality quantitative evidence of their educational effectiveness, particularly at the high school level
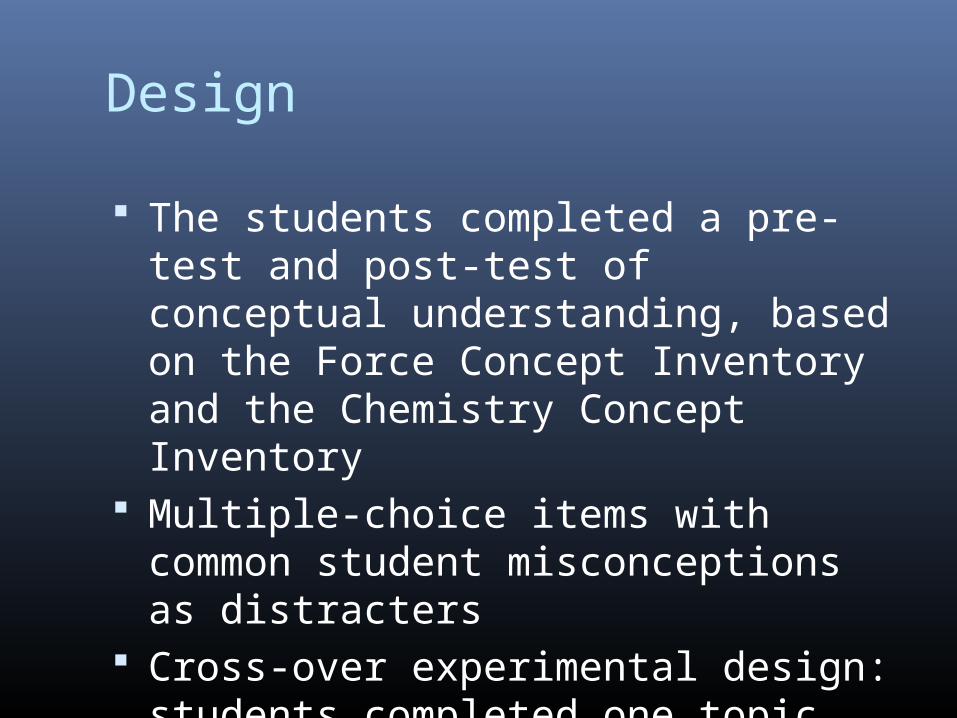
Design
The students completed a pre-test and post-test of conceptual understanding, based on the Force Concept Inventory and the Chemistry Concept Inventory
Multiple-choice items with common student misconceptions as distracters
Cross-over experimental design: students completed one topic with visualisations and one without
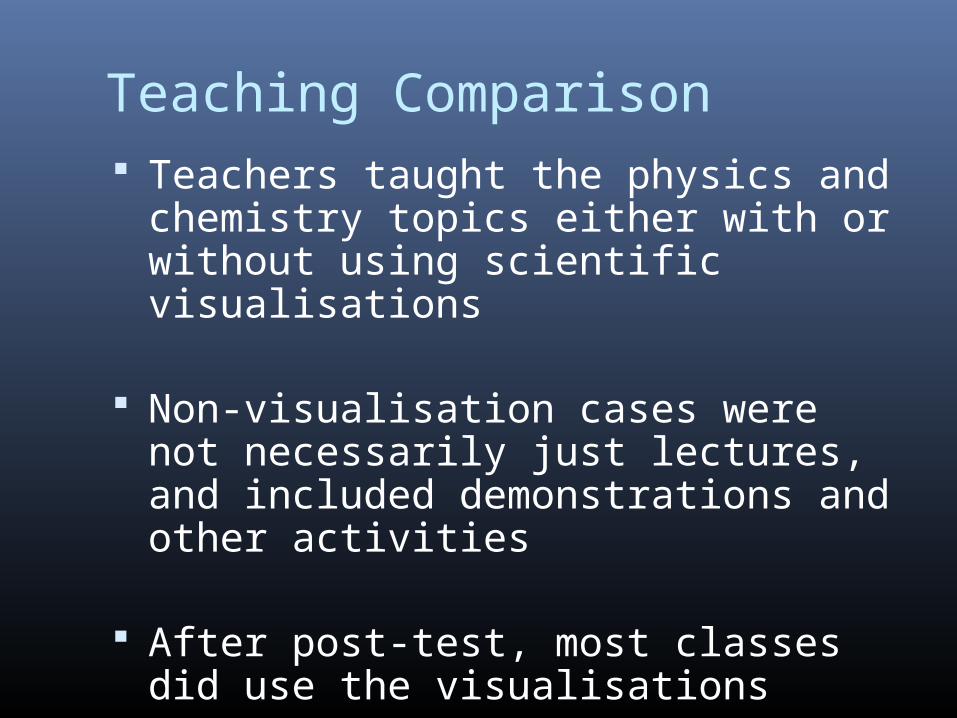
Teaching Comparison Teachers taught the physics and chemistry
topics either with or without using scientific visualisations
Non-visualisation cases were not necessarily just lectures, and included demonstrations and other activities
After post-test, most classes did use the visualisations
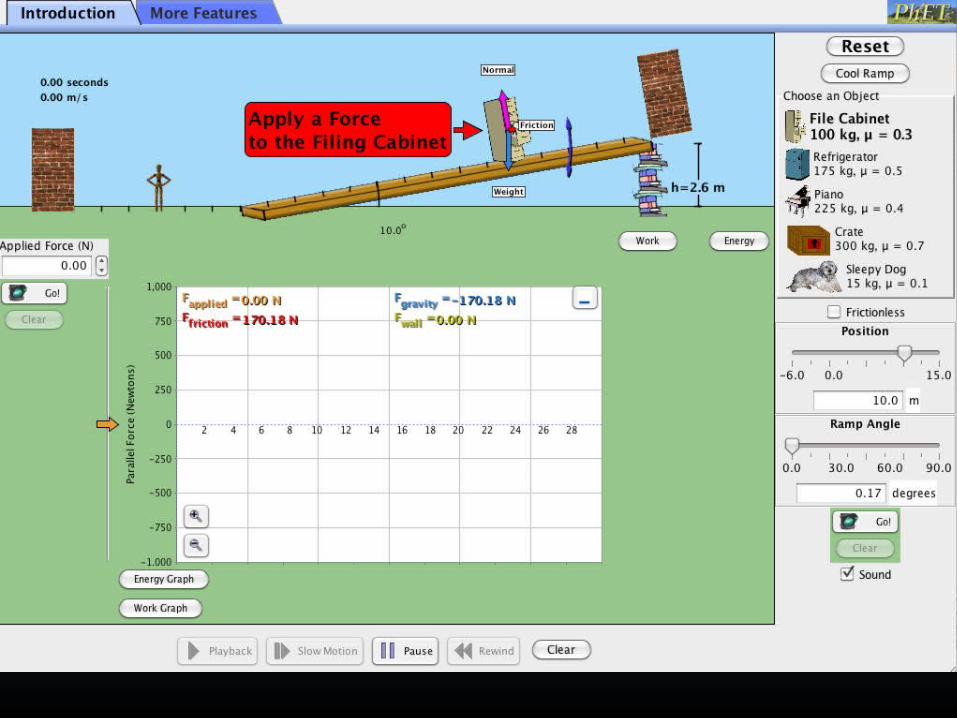
Examples


Results - Overall
79 physics, 78 chemistry 34 male, 123 female
No significant difference t(512) = -1.48, p = .14
Treatment Gain
Mean SD
No visualisation (N=157) 1.19 2.26
Visualisation (N=157) 1.58 2.39

Results - Physics
80 physics
No significant difference t(158)=-1.58, p=.116
Treatment Gain
Mean SD
No visualisation (N=157) .95 2.22
Visualisation (N=157) 1.53 2.38
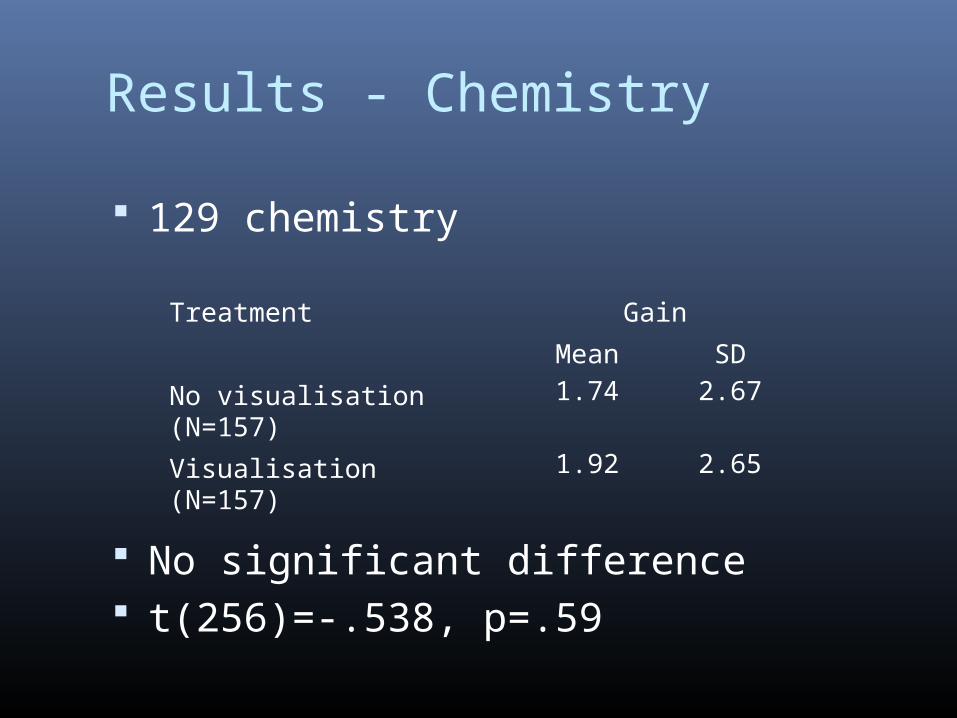
Results - Chemistry
129 chemistry
No significant difference t(256)=-.538, p=.59
Treatment Gain
Mean SD
No visualisation (N=157) 1.74 2.67
Visualisation (N=157) 1.92 2.65

Results - Sex
Chemistry: no significant difference Physics:
significant difference at p<.05 level: (t(78)=2.37, p=.02)
moderate effect size (Cohen’s d=0.54)

Results – Academic Achievement
Chemistry: no significant difference Physics: no significant difference

Results – Learning Styles Very small differences noted for physics
with a slight advantage for kinesthetic learners (not visual learners)
Construct is very shaky and so was the measurement
Can’t get published with this measure included
Therefore this facet discarded

Conclusion
‘First, do no harm’: While there were no large benefits for conceptual learning observed, there was also no decrease in conceptual learning
Given the other benefits of student enjoyment and engagement, use of visualisations is probably justified
Excessive effectiveness claims should be avoided
The Next StudyThe Next Study Applying for ARC Discovery grant: If successful
study will start in 2013
Many detail variables in relation to types of visualisations and ways they were used
Still focused on classroom-based research
More qualitative approach to students’ learning/thinking while learning with visualisations

Contact
Please do get in touch if you have questions, suggestions, solutions or are doing related work: [email protected]