david e. meltzer department of physics and astronomy iowa state university
DESCRIPTION
Learning Gains in Physics in Relation to Students' Mathematics Skills. David E. Meltzer Department of Physics and Astronomy Iowa State University. Assessment of Instruction. Need measure of instructional effectiveness. - PowerPoint PPT PresentationTRANSCRIPT
Learning Gains in Physics in Relation to
Students' Mathematics Skills
David E. Meltzer
Department of Physics and Astronomy
Iowa State University
Assessment of Instruction
• Need measure of instructional effectiveness.
• Posttest by itself measures what students know, not what they’ve learned.
• Key measure: student learning gain (change in score) on some diagnostic instrument.

“Normalized” Gain [g]• Practical problem: maximum score = 100%, so if students
have different pretest scores their maximum possible gain is different.
• One solution: Use normalized gain “g” (introduced by R. Hake)
g = gain/max. possible gain
= [posttest score-pretest score] / [100%-pretest score]
Normalized gain yields a gain score that corrects for pretest score.
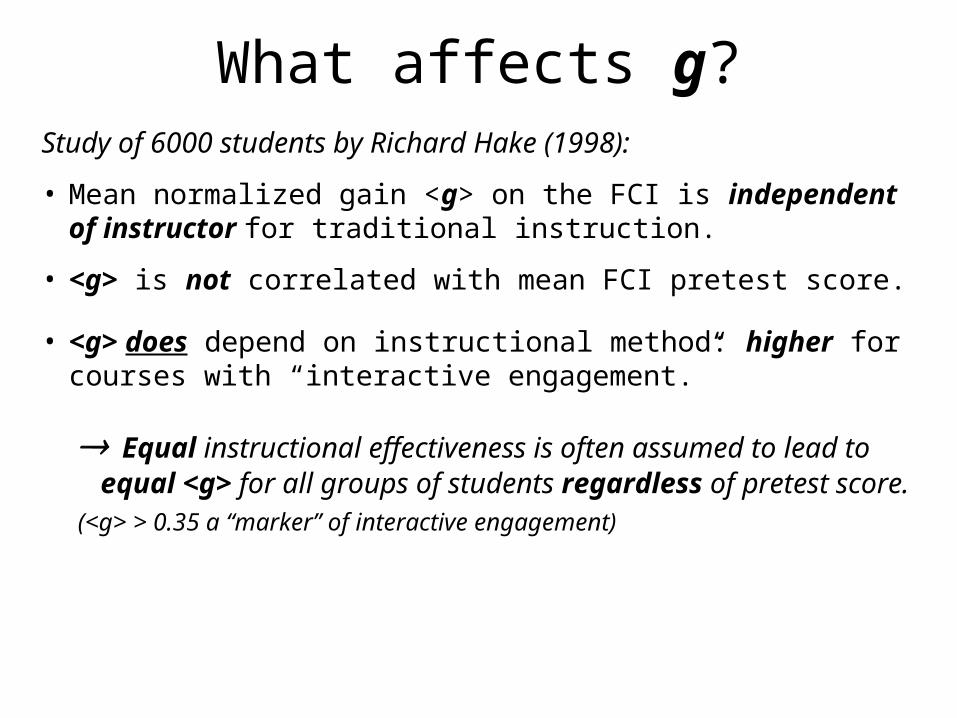
What affects g?Study of 6000 students by Richard Hake (1998):
• Mean normalized gain <g> on the FCI is independent of instructor for traditional instruction.
• <g> is not correlated with mean FCI pretest score.
• <g> does depend on instructional method: higher for courses with “interactive engagement.”
Equal instructional effectiveness is often assumed to lead to equal <g> for all groups of students regardless of pretest score.
(<g> > 0.35 a “marker” of interactive engagement)
Is Normalized Gain Correlated With Individual Students’ Pretest Score?
• We investigate learning gains on “Conceptual Survey of Electricity” (CSE) by O’Kuma, Hieggelke, Maloney, and Van Heuvelen (conceptual, qualitative questions).
• Four student samples, two different universities
• Algebra-based general physics: instruction used interactive lectures, “peer instruction,” “tutorials,” etc.
Diagnostic Instruments
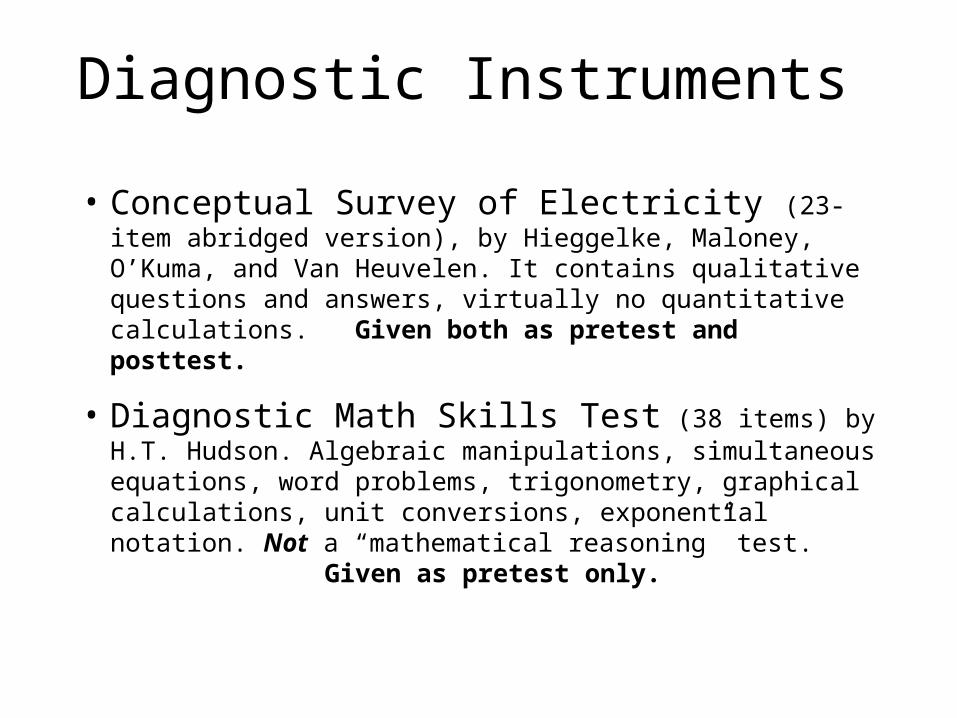
• Conceptual Survey of Electricity (23-item abridged version), by Hieggelke, Maloney, O’Kuma, and Van Heuvelen. It contains qualitative questions and answers, virtually no quantitative calculations. Given both as pretest and posttest.
• Diagnostic Math Skills Test (38 items) by H.T. Hudson. Algebraic manipulations, simultaneous equations, word problems, trigonometry, graphical calculations, unit conversions, exponential notation. Not a “mathematical reasoning” test. Given as pretest only.
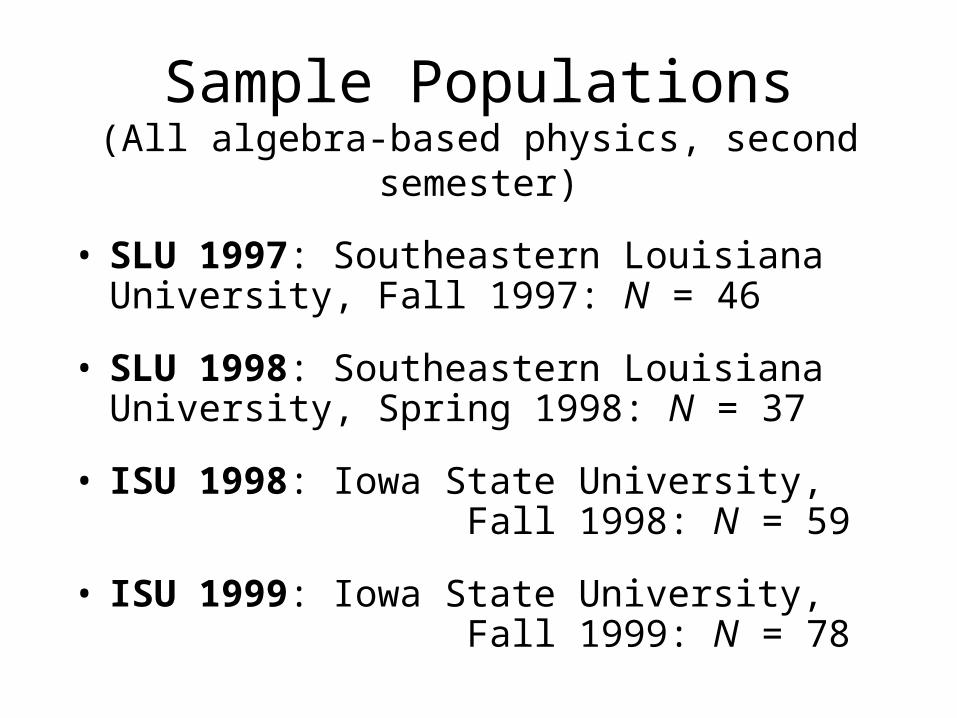
Sample Populations(All algebra-based physics, second semester)
• SLU 1997: Southeastern Louisiana University, Fall 1997: N = 46
• SLU 1998: Southeastern Louisiana University, Spring 1998: N = 37
• ISU 1998: Iowa State University, Fall 1998: N = 59
• ISU 1999: Iowa State University, Fall 1999: N = 78
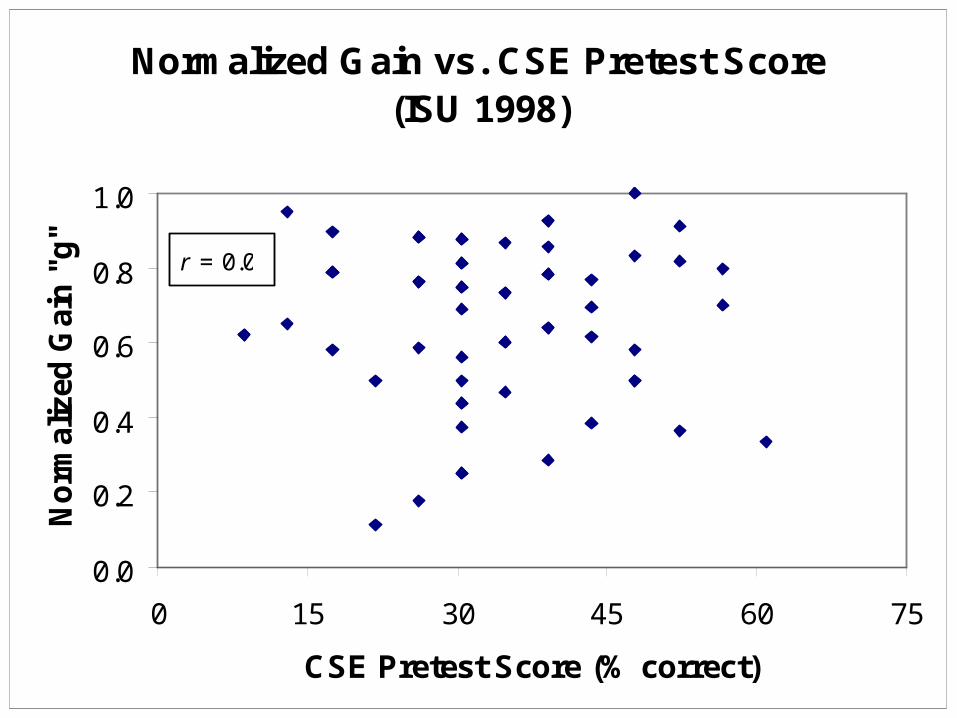
Normalized Gain vs. CSE Pretest Score (ISU 1998)
0.0
0.2
0.4
0.6
0.8
1.0
0 15 30 45 60 75
CSE Pretest Score (% correct)
No
rmal
ized
Gai
n "
g"
r = 0.0
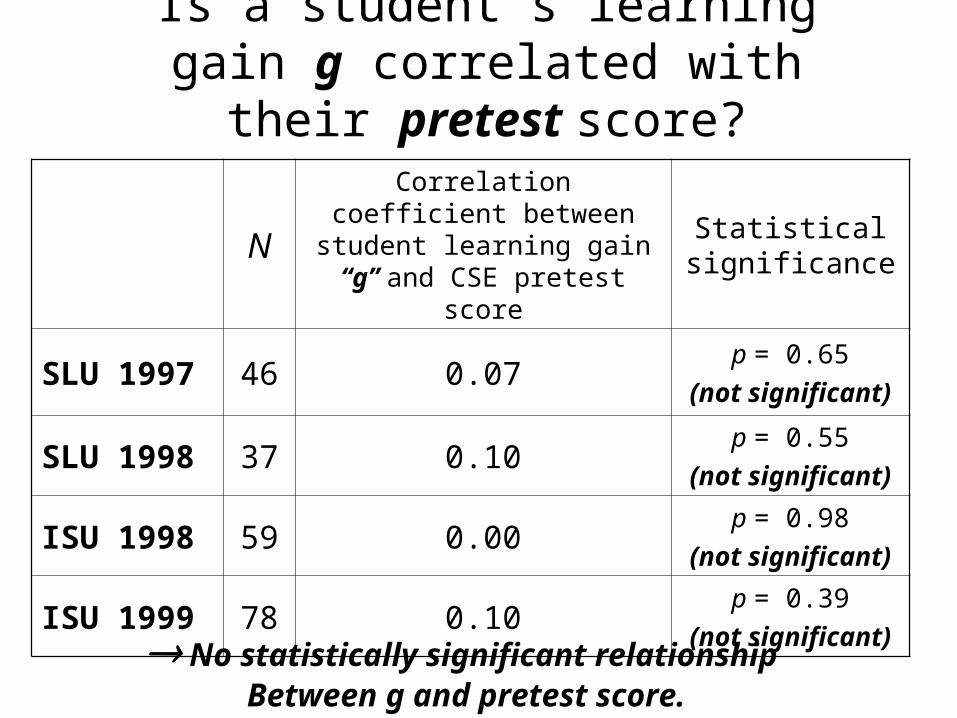
Is a student’s learning gain g correlated with their pretest score?
NCorrelation coefficient
between student learning gain “g” and CSE pretest score
Statistical significance
SLU 1997 46 0.07p = 0.65
(not significant)
SLU 1998 37 0.10p = 0.55
(not significant)
ISU 1998 59 0.00p = 0.98
(not significant)
ISU 1999 78 0.10p = 0.39
(not significant)
No statistically significant relationship Between g and pretest score.
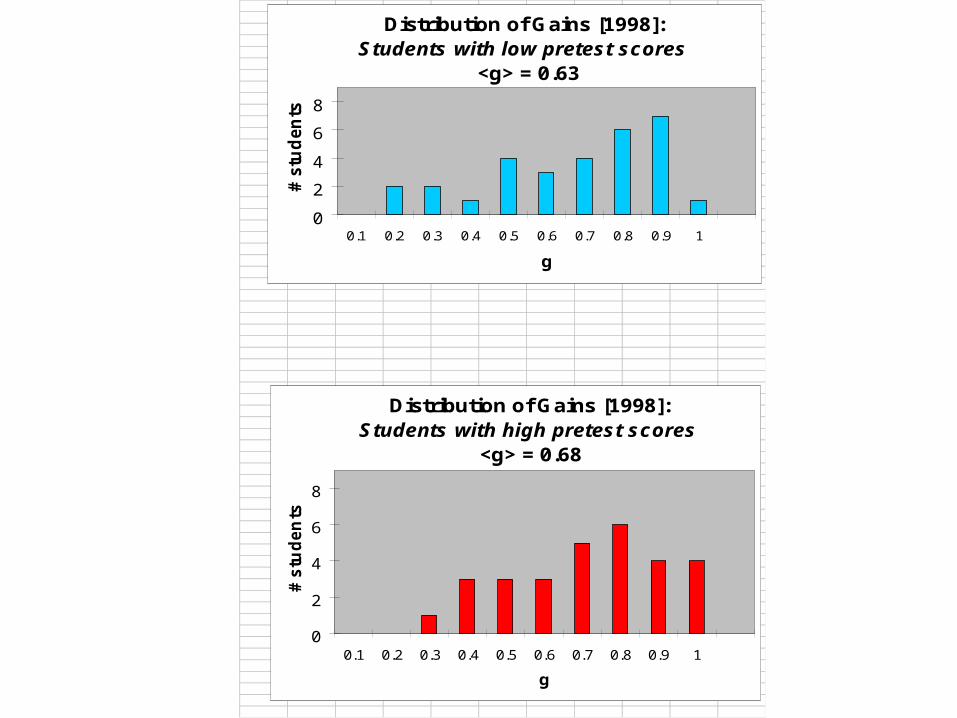
Distribution of Gains [1998]:Students with low pretest scores
<g> = 0.63
0
2
4
6
8
0.1 0.2 0.3 0.4 0.5 0.6 0.7 0.8 0.9 1
g
# s
tud
en
ts
Distribution of Gains [1998]:Students with high pretest scores
<g> = 0.68
0
2
4
6
8
0.1 0.2 0.3 0.4 0.5 0.6 0.7 0.8 0.9 1
g
# s
tud
en
ts
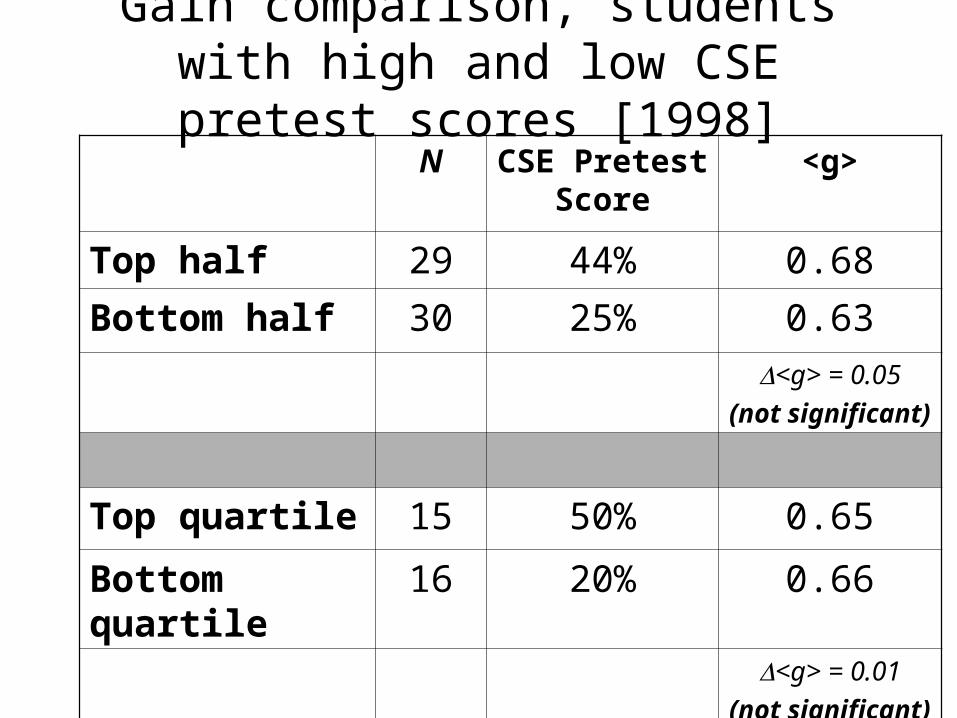
Gain comparison, students with high and low CSE pretest scores [1998]
N CSE Pretest Score
<g>
Top half 29 44% 0.68
Bottom half 30 25% 0.63
<g> = 0.05
(not significant)
Top quartile 15 50% 0.65
Bottom quartile 16 20% 0.66
<g> = 0.01
(not significant)

Gain comparison, students with high and low CSE pretest scores [1999]
N CSE Pretest Score
<g>
Top third 30 43% 0.74
Bottom third 27 18% 0.72
<g> = 0.02
(not significant)
Top fifth 14 49% 0.73
Bottom fifth 15 14% 0.67
<g> = 0.06
(not significant)
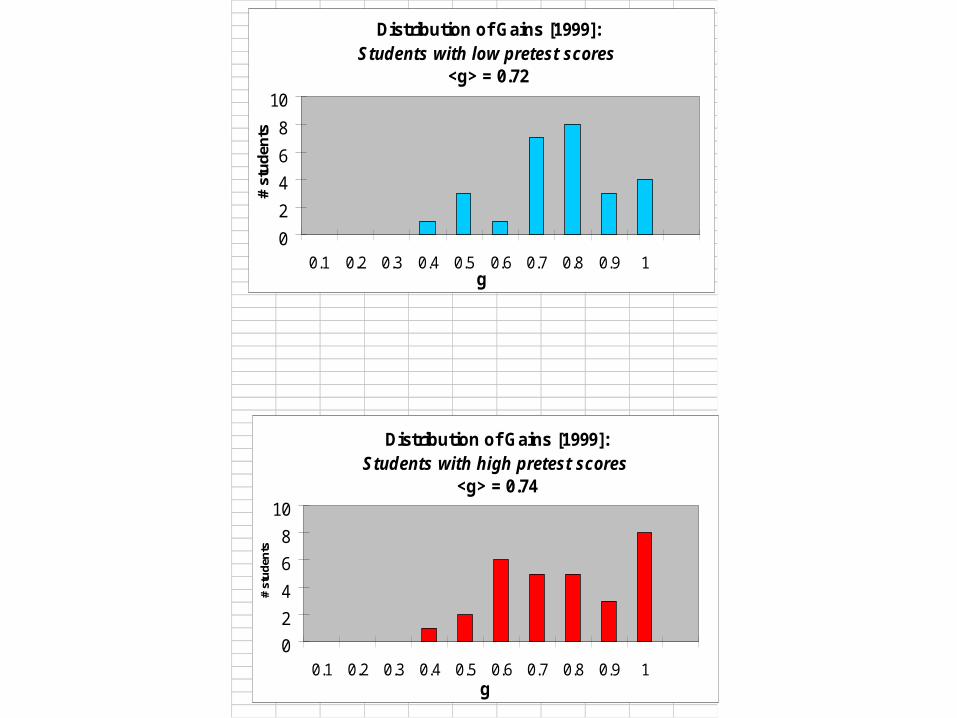
Distribution of Gains [1999]:Students with low pretest scores
<g> = 0.72
0
2
4
6
8
10
0.1 0.2 0.3 0.4 0.5 0.6 0.7 0.8 0.9 1g
# st
ud
ents
Distribution of Gains [1999]:Students with high pretest scores
<g> = 0.74
0
2
4
6
8
10
0.1 0.2 0.3 0.4 0.5 0.6 0.7 0.8 0.9 1g
# st
ud
ents

Consistent Result: No Correlation of g With Pretest Score on CSE
• Even though lower half of class scored 20% on pretest (random guessing), while upper half scored 40-50%, both groups achieved same normalized gain.
• Implication: Can not use pretest score to predict student’s performance (as measured by g).
So . . . Can Any Preinstruction Measure Predict Student Performance?
Many studies have demonstrated a correlation between math skills and physics performance, HOWEVER:
– performance was measured by traditional quantitative problems
– student’s pre-instruction knowledge was not taken into account (i.e., only posttest scores were used)
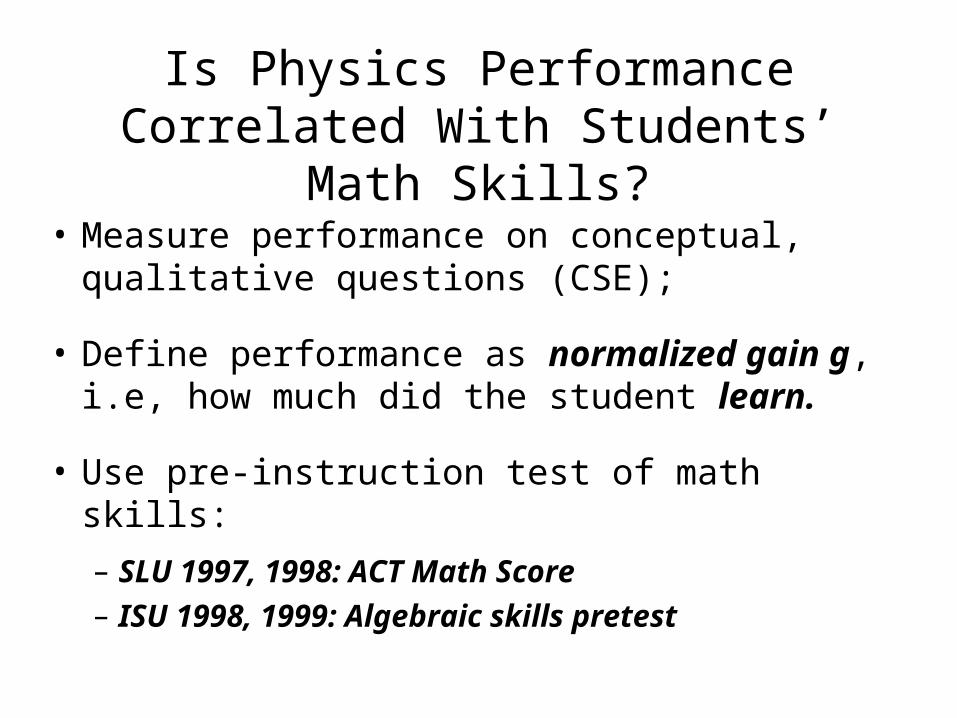
Is Physics Performance Correlated With Students’ Math Skills?
• Measure performance on conceptual, qualitative questions (CSE);
• Define performance as normalized gain g, i.e, how much did the student learn.
• Use pre-instruction test of math skills:
– SLU 1997, 1998: ACT Math Score
– ISU 1998, 1999: Algebraic skills pretest
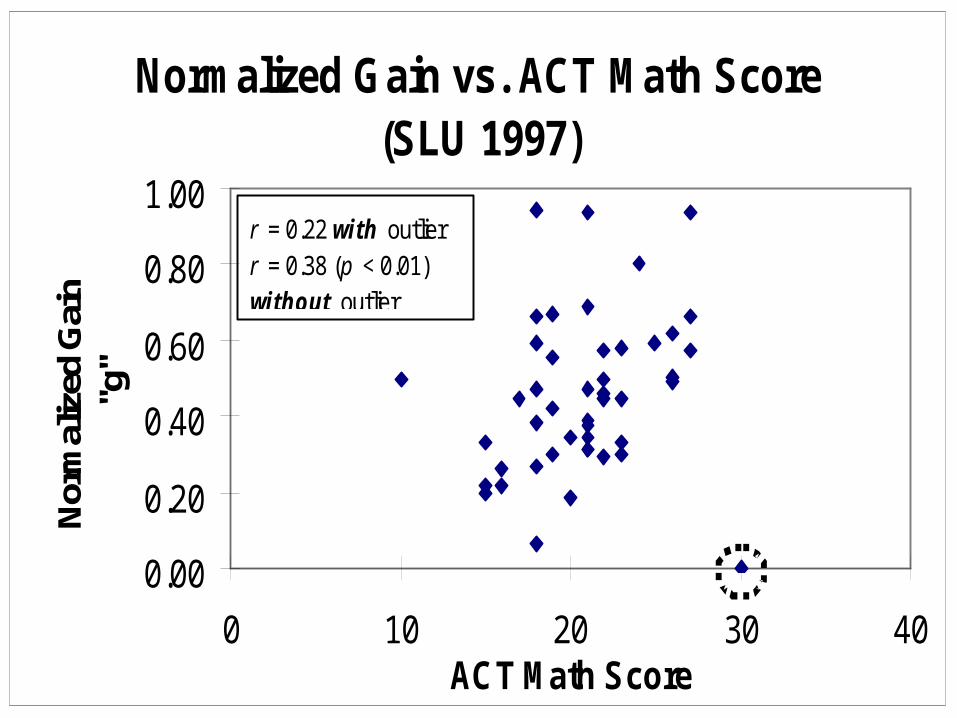
Normalized Gain vs. ACT Math Score(SLU 1997)
0.00
0.20
0.40
0.60
0.80
1.00
0 10 20 30 40ACT Math Score
Nor
mal
ized
Gai
n "g
"
r = 0.22 with outlierr = 0.38 (p < 0.01) without outlier
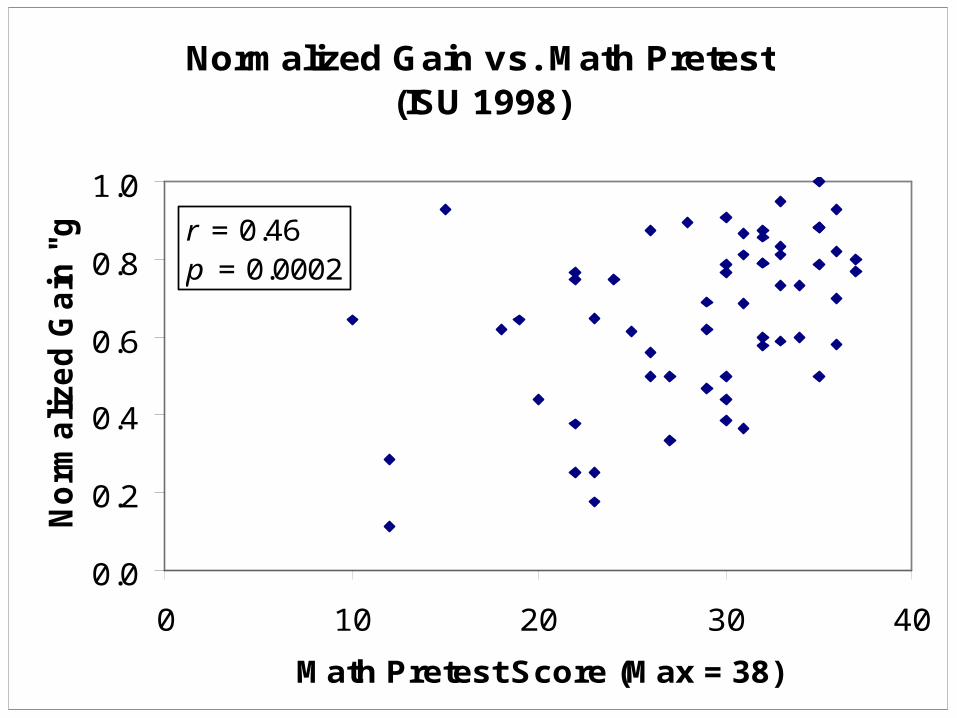
Normalized Gain vs. Math Pretest(ISU 1998)
0.0
0.2
0.4
0.6
0.8
1.0
0 10 20 30 40
Math Pretest Score (Max = 38)
No
rma
lize
d G
ain
"g
"
r = 0.46p = 0.0002
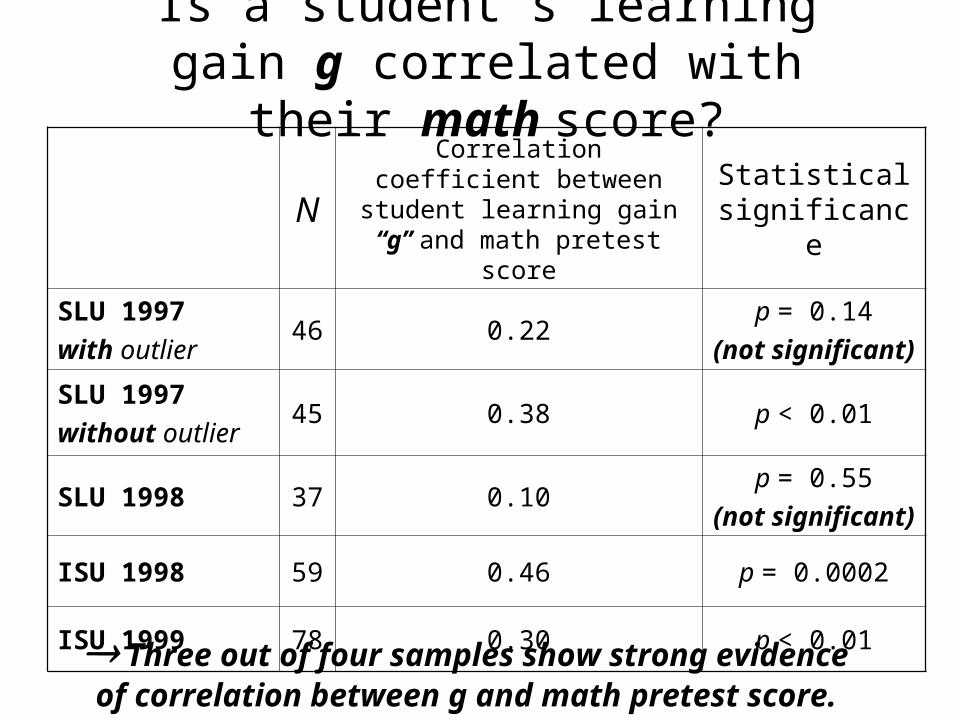
Is a student’s learning gain g correlated with their math score?
NCorrelation coefficient between student learning gain “g” and
math pretest score
Statistical significance
SLU 1997
with outlier 46 0.22
p = 0.14
(not significant)
SLU 1997
without outlier45 0.38 p < 0.01
SLU 1998 37 0.10p = 0.55
(not significant)
ISU 1998 59 0.46 p = 0.0002
ISU 1999 78 0.30 p < 0.01
Three out of four samples show strong evidence of correlation between g and math pretest score.

Gain comparison, students with high and low math scores [1998]
N Math Score <g>
Top half 28 89% 0.75
Bottom half 31 63% 0.56
<g> = 0.19
p = 0.0001
Top quartile 13 93% 0.77
Bottom quartile 14 49% 0.49
<g> = 0.28
p = 0.001
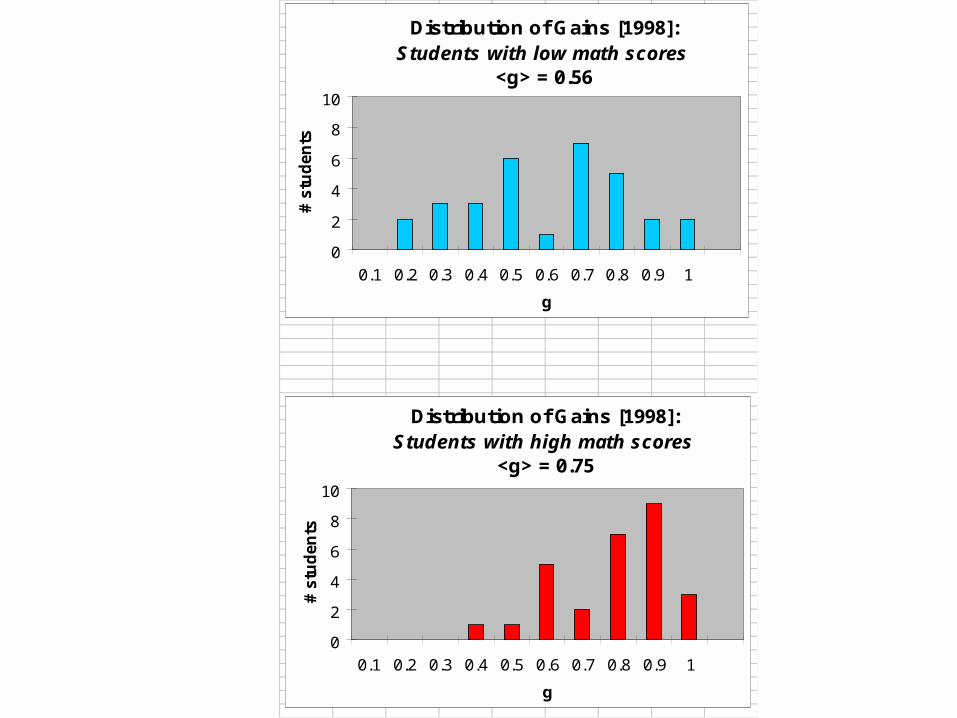
Distribution of Gains [1998]:Students with low math scores
<g> = 0.56
0
2
4
6
8
10
0.1 0.2 0.3 0.4 0.5 0.6 0.7 0.8 0.9 1
g# s
tud
en
ts
Distribution of Gains [1998]:Students with high math scores
<g> = 0.75
0
2
4
6
8
10
0.1 0.2 0.3 0.4 0.5 0.6 0.7 0.8 0.9 1
g
# s
tud
en
ts
Significant changes in instruction, ISU 1999:
• Both TA’s were members of Physics Education Research Group.
• There was an additional undergraduate TA present during many tutorials.
• Both TA’s and course instructor spent many out-of-class hours in individual instruction with weaker students.
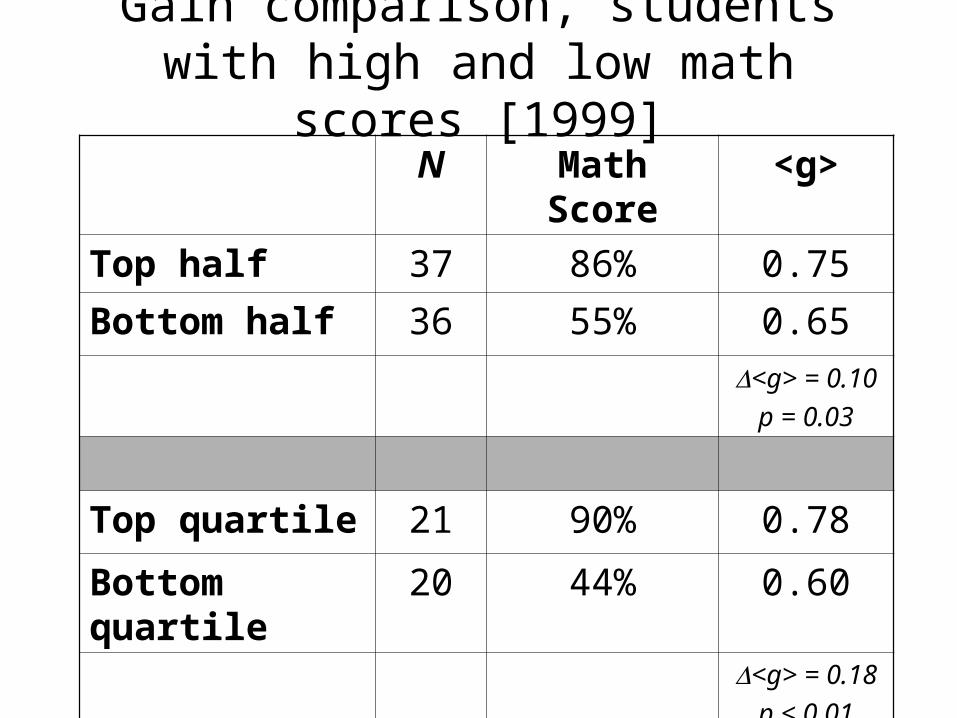
Gain comparison, students with high and low math scores [1999]
N Math Score <g>
Top half 37 86% 0.75
Bottom half 36 55% 0.65
<g> = 0.10
p = 0.03
Top quartile 21 90% 0.78
Bottom quartile 20 44% 0.60
<g> = 0.18
p < 0.01
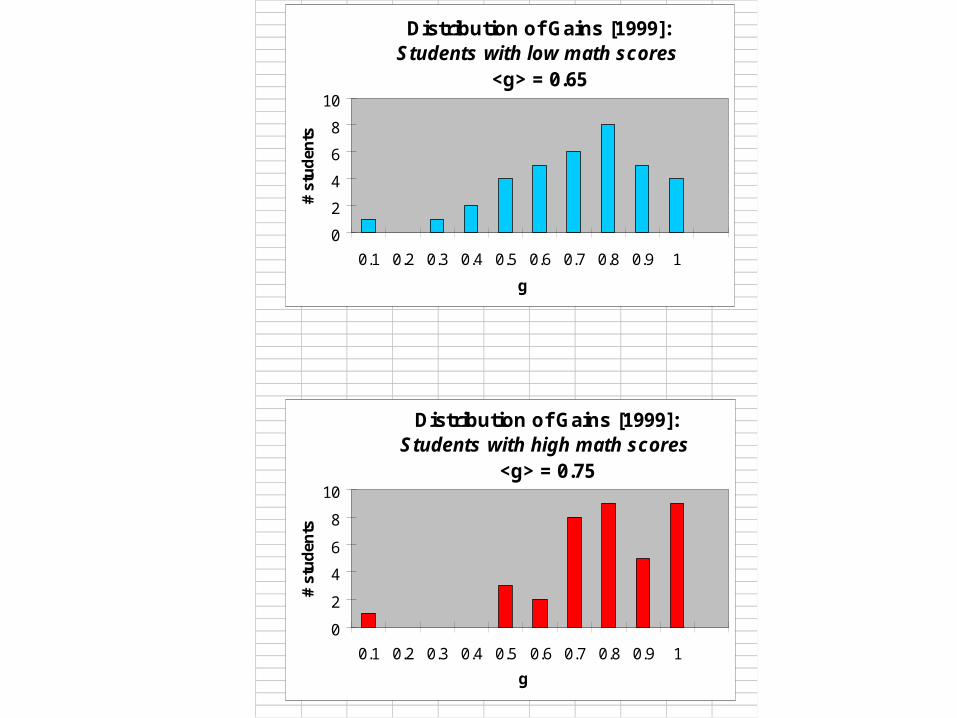
Distribution of Gains [1999]:Students with low math scores
<g> = 0.65
0
2
4
6
8
10
0.1 0.2 0.3 0.4 0.5 0.6 0.7 0.8 0.9 1
g#
stu
den
ts
Distribution of Gains [1999]:Students with high math scores
<g> = 0.75
0
2
4
6
8
10
0.1 0.2 0.3 0.4 0.5 0.6 0.7 0.8 0.9 1
g
# st
ud
ents
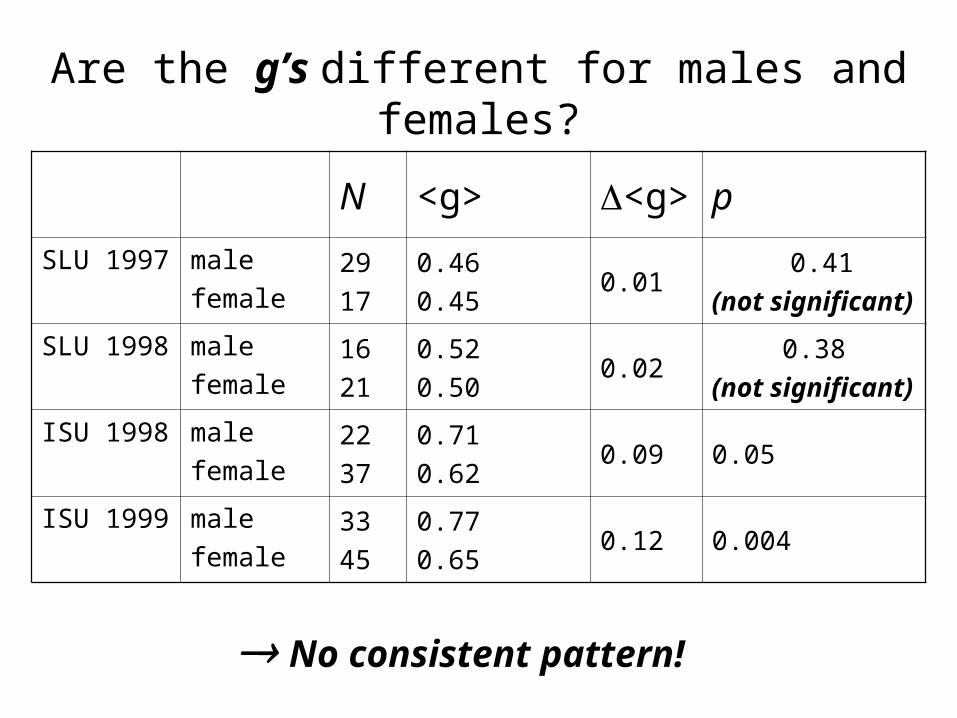
Are the g’s different for males and females?
N <g> <g> p
SLU 1997 male
female29
17
0.46
0.450.01
0.41
(not significant)
SLU 1998 male
female16
21
0.52
0.500.02
0.38
(not significant)
ISU 1998 male
female22
37
0.71
0.620.09 0.05
ISU 1999 male
female33
45
0.77
0.650.12 0.004
No consistent pattern!
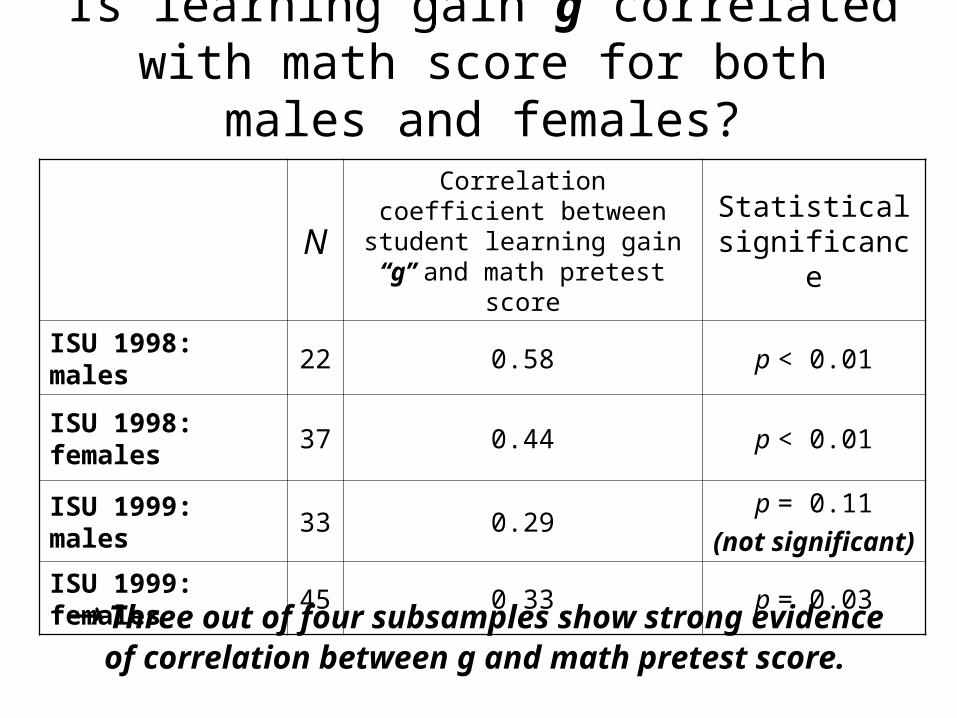
Is learning gain g correlated with math score for both males and females?
NCorrelation coefficient
between student learning gain “g” and math pretest score
Statistical significance
ISU 1998: males 22 0.58 p < 0.01
ISU 1998: females 37 0.44 p < 0.01
ISU 1999: males 33 0.29p = 0.11
(not significant)
ISU 1999: females 45 0.33 p = 0.03
Three out of four subsamples show strong evidence of correlation between g and math pretest score.
Summary
• Strong evidence of correlation (not causation!) between computational math skills and conceptual learning gains. (Consistent with results of Hake et al., 1994.)
(Are there additional “hidden” variables?)
• Results suggest that diverse populations may achieve significantly different normalized learning gains (measured by “g”) even with identical instruction.