datasets for the programme review · the nelson mandela metropolitan university (nmmu) resulted...
TRANSCRIPT

1
DATASETS FOR THE PROGRAMME REVIEW
Charles Sheppard1
1. INTRODUCTION
Reliable datasets are a key requirement for conducting a programme review. The types of data should provide a useful perspective on the characteristics of the programmes and the profile of enrolled students and their academic achievements. Historical data trends indicate the demand for the programme over time, the success rates, and the human and physical resources needed for offering the programme. Datasets must be prepared as follows:
a) An initial consolidation of existing programmes.
b) The allocation of academic activities to the various sites of the institution.
c) The programme review and consolidation process.
Details of these are supplied in Sections 2, 3 and 4 below.
2. AN INITIAL CONSOLIDATION OF EXISTING PROGRAMMES
The first stage of the programme consolidation involves consolidating the merging institutions’ existing programmes. This requires Programme Qualification Mix (PQM) information and must take into consideration pipeline students.
2.1 Development of a new PQM document for the merged institution:
The first major exercise for merging institutions is to go through the consolidation process and develop a new PQM document for the merged institution. This consolidation results in different groups of programmes, namely
• Sets of pipeline programmes, one set for students of each of the former institutions. These are programmes that will be phased out within set time frames.
• A set of consolidated, continuing and new qualifications for the merged institution.
1 Dr Charles Sheppard is Director of Management Information at the Nelson Mandela Metropolitan University (NMMU).
2
The PQM must list all the existing programmes according to qualification level and the new or interim faculty structure of the merged institution. The programmes may be grouped according to specific academic units such as departments or schools, though some will be faculty based. If a programme is inter-faculty based, one might need to decide which faculty has primary responsibility for the programme. The PQM should indicate the envisaged date when a pipeline programme will have been phased out.
The PQM must list programme attributes such as the qualification code, approved qualification name, qualification type code, qualification type name, offering type of the programme, delivery sites and offering status (full-time and/or part-time), majors or fields of specialisation according to the second order Classification of Educational Subject Matter (CESM), minimum total time, minimum formal time, minimum experiential time and approved Identification Number (ID). The programme’s accreditation status must also be captured on the PQM, with the date of formal approval of the programme and the approving body. It is useful, for recording how the new consolidated PQM has evolved, to include a column for internal comments such as when the last intake in a pipeline programme was allowed, which programmes have been consolidated, which pipeline programme is being replaced by a new consolidated programme, etc.
The Nelson Mandela Metropolitan University (NMMU) resulted from the incorporation of the Port Elizabeth campus of Vista University (Vista–PE) into the University of Port Elizabeth (UPE) on 1 January 2004 and the subsequent merging of UPE and Port Elizabeth Technikon (PET) on 1 January 2005. When Vista–PE was incorporated into UPE the programmes on the PQM were grouped into the following categories:
• NMMU programmes (new and consolidated UPE and VISTA Programmes);
• NMMU programmes (continuing UPE programmes);
• NMMU programmes (continuing VISTA programmes);
• UPE pipeline programmes (no new enrolments);
• VISTA pipeline programmes (no new enrolments); and
• Programmes not approved for funding.
These groupings illustrate the evolution of the new programme structure and the strategy for phasing out pipeline programmes. Those that had had no enrolments for a number of years and programmes that were phased out were dropped from the PQM. One should, however, be careful when deciding to remove postgraduate qualifications, because enrolments in these tend to fluctuate considerably.
2.2 Implications of programme consolidations for the academic structure on the database
Many of the existing programmes and even consolidated programmes may now be offered at more than one campus or delivery site within the new institution. This will necessitate
3
registering additional offering types (usually indicating the site where the programme will be offered) for the programmes, as well as the subjects of the programmes.
2.3 Database implications of pipeline programmes
For pipeline students, the coding and the academic structure set up on the merged database must be carefully considered.
2.3.1 Need for the registration of additional offering types
In many instances the fee structure of merging institutions will differ for historical reasons. If the fee structures differ considerably, a migration of all fee structures to a new equal set of fees might not be feasible within one year or even a number of years. This will especially be the case where the institutions’ services and resources differ in range and quality. The argument would be that if students pay the same fees they are entitled to services and resources of the same quality. Since the merged institutions would need time to get the various sites’ services and resources on a par, students enrolled at different sites might pay different fees during the interim period. The registration of additional offering types for qualifications and subjects will enable the institutions to link differential fees to the same qualifications and subjects.
2.3.2 Maintaining credits for pipeline students who move between programmes
It is important to decide how credits will be maintained for pipeline students who choose to move between programmes. When coding is done for pipeline students, it must be taken into consideration that graduates’ records must balance, and too many credits for graduates can lead to scaling down the credits of currently enrolled students.
The main difficulty experienced with pipeline students’ NQF credits and stats credits (relative course weights) is reconciling the total programme credits of individual students transferring between programmes. These include students transferring between programmes of the merging institutions as well as those transferring to new qualifications within the merged institution. This makes it difficult to be fair when determining whether a student qualifies for the completion of a programme. The student must qualify in terms of two criteria:
• Total credits completed.
• Adherence to the curriculum content (inclusion of core modules in the programme and a sufficient mix of electives).
Because of the differences in numbers of credits required for modules in similar qualifications at the merging institutions, it is impossible in most instances to accurately balance the total credits of transfer students eligible for completion of a programme. If the student qualifies in
4
terms of curriculum content, but the total credits acquired are too few or too many, the student’s total credit values need to be balanced.
If the student needs credits, correctional credits can be added to the student record by adding dummy modules. A module must thus be created with the correct number of credits to balance the student record. If the student has too many credits it causes problems with regard to the 0% test all university type programmes are subject to.
If the over-registration is considerably higher than the credit values on the academic structure of the receiving institution the net effect of the 0% test effectively decreases the full-time equivalent (FTE) values of the current enrolments in the programme. Depending on the cumulative effect on FTE values, it might also be necessary to adjust the records of students with too many credits to limit the resulting subsidy loss. This can also be achieved through correctional modules.
When a student transfers between programmes, previously obtained credits must be maintained on the system. A mistake to avoid is giving exemptions to students transferring between programmes of the merged institution, because no subsidy is generated by exemptions. The previously obtained credits and marks must be maintained on the student’s academic record. Exemptions will have serious implications for HEMIS (Higher Education Management Information Systems) and management information systems and must not be used to facilitate the transfer of pipeline students between programmes.
A particular problem is pipeline students who have interrupted their studies just prior to or during the year of incorporation or merging. In the case of incorporation, the merged institution is not responsible for maintaining the student data history belonging to the institution that was incorporated. The legal successor takes responsibility for the historical data and for issuing certificates and academic records. Only the history of the students who registered in the year of incorporation is included in the database of the merged institution. If a pipeline student returns in the second year of the merged institution, then that student’s historical academic record must be obtained from the legal successor. In these cases the only way to balance the returning students’ credits is through the use of exemptions.
2.3.3 Impact of pipeline students on the history of the databases
In instances where one of the institutions is incorporated, the history and issuing of certificates will become the responsibility of the legal successor. The merged institution will, however, need the history of the students from the incorporated institution who are registered with the merged institution for the maintenance of their credits, the balancing of their credits when they complete the programmes, and the issuing of academic records. This is only possible if the history of these students is included in the merged institution’s database. The result of this is that the historical data of the institution whose database was chosen as the ‘main’ database will be changed incorrectly.
In the merging of databases, one of the institutions’ databases is chosen as the ‘main’ one. The data from the other institution is then appended to this ‘main’ database, which will reflect the data as though the students from the incorporated institution have been part of the former institution whose database was chosen as the ‘main’ database. This will change the audited headcount and FTE information of the ‘main’ institution. It is thus crucial to ensure that at
5
least the audited tables are saved separately before the merging of the database to ensure that correct audited records are available.
2.4 Checking the stats credits of the merging institutions’ qualifications
Although National Qualifications Framework (NQF) credits and stats credits (relative course weights) are two separate concepts independent from one another, many institutions are using a method of direct translation of NQF credits to stats credits. Caution must be exercised where institutions have programmes that contain more than 120 NQF credits for one year formal time. These could lead to the incorrect translation of NQF credits to stats credits. For example, if an institution has a programme that contains 180 NQF credits for one year formal time, the NQF credits will have to be divided by 180 to translate them to one stats credit. If divided by 120 the FTEs will be incorrect, which will lead to incorrect HEMIS submissions.
3. THE ALLOCATION OF ACADEMIC ACTIVITIES TO THE VARIOUS SITES OF THE INSTITUTION
3.1 Site allocations of academic activities
In a newly merged institution decisions need to be made on the site allocations of academic activities to ensure:
1) Access to a range of programmes on each site.
2) An adequate academic profile for each site.
3) Cost effectiveness and optimal use of staff, facilities and space.
4) Operational streamlining.
5) Academic coherence.
Decisions must be made on the location of faculties. Programme offerings are also important for considerations of programme duplication. The consideration of service modules and the interrelatedness and dependency of programmes on service modules is crucial for decisions on site allocations. A comprehensive range of programmes must be offered on the various campuses of a merged institution, without unnecessary duplication or overlap.
An integrated PQM will inform these decisions. When testing various scenarios for site allocations, the PQM must be reorganised according to the site allocation proposals. Programme enrolment figures organised by site will have to be prepared to test whether the number of students enrolled will be appropriate for the proposed sites. Space information, such as the number of venues and their capacity, is needed so as to test the various allocation scenarios. If space data are not readily available, a full-scale space audit might be needed, preferably a mapping of programme enrolments to module enrolments, to establish whether enough venues of suitable sizes are available to accommodate site allocation proposals. The
6
venues and their seating capacity must be matched to the frequency (number) of modules in categories of enrolment size. Facilities (laboratories, library facilities, special equipment and specialised areas) must also match programmes or otherwise these facilities might have to be added. Cost considerations will be a strong driver in decisions about site allocations. The cost of adding additional facilities to sites and the available budgets for infrastructure development must be available during the decision-making process. It is also important to have programme enrolment projections available, to ensure that possible growth is taken into consideration when decisions are made.
Decisions need to be made about the duplication of programmes across sites. The rationale for programme duplication may necessitate considering student demand at various learning sites; different modes of delivery at various learning sites (e.g. a day programme at one site and an evening one at another); the programme mix at specific sites; the offering of similar programmes at satellite campuses; and the availability of academic staff for programme duplication. Where sites are close to one another, and depending on timetabling possibilities, it could be possible for staff to travel between campuses to offer a programme at more than one site.
The information needed to measure student demand includes historical enrolments of students according to offering type and full-time or part-time enrolment in programmes at the sites and satellite campuses for a period of at least three to four years. The PQM according to site will provide information on the programmes offered at each site. Staff qualifications, teaching experience and workload models will enable decision makers to decide whether programme duplication is possible at various sites. It must be determined how many academic staff members will be offering the programmes, and how many will have to support and service the administrative functions at these sites and whether sufficient office space is available.
3.2 Projections of student enrolment numbers
The NMMU is still in the process of developing an appropriate student enrolment projection model. As a first attempt, datasets were prepared of the student enrolments in programmes according to the following categories for the period 2002–2005:
a) First time entering students.
b) Transfer students.
c) Entering students.
d) Non-entering students.
The average growth rate over the period 2002–2004 for each of these categories of students was calculated for each programme. On the basis of these average growth rates, enrolments in each programme were projected for 2006. Information sessions were held with each faculty to discuss the methodology applied. To get a better idea of the average growth rate and feedback on the outcomes of the projections, faculties were asked to check the data for correctness and to say which programmes should be grouped together. The programme managers were asked to make adjustments to the projections to ensure they were realistic, based on their experience
7
and knowledge of capacity. Once programme managers were satisfied with the projected numbers for 2006, projections of enrolments for 2007 and 2008 were made on the basis of the adjusted 2002–2006 (expected 2006 enrolments) average growth rates.
The following formula (geometric mean) was used:
Let Ri denote the average growth rate in the student enrolments over time.
R1 is the growth rate between Year 1 and 2, R2 is the growth rate between Year 2 and 3, etc.
Annual growth rate = (Year 1 enrolments/Year 2 enrolments)-1, etc.
Average growth rate over the period = {[(1 + R1),(1 + R2),(1 + R3),…(1 +Rn)] 1/n }-1 (where n = the number of periods).
The NMMU experienced a drop in enrolments in 2005 as a result of:
a) A steep decline in off-campus education student enrolments, mostly because of measures taken to improve the quality of off-campus programmes. The drop in enrolments was, however, more than expected.
b) A large number of students did not return to complete their studies. Follow-up on a sample of these students revealed that this was mainly because of financial constraints, or enrolments at other higher education institutions as a result of uncertainty about the outcomes of the merger.
c) Financial measures that were taken to curtail bad debt linked to poor academic performance.
d) A drop in applications for admissions to the University.
This unexpected drop in enrolments (approximately 3000 fewer students than expected), made projections for 2006 very difficult. It is hoped that the University will recover to at least the 2004 enrolment levels. It was then decided that although the 2005 enrolments would be used as the base of 2006 projections, the average annual growth rates over the 2002–2004 period would be used to project the 2006 enrolments.
The unavailability of historical data for the Port Elizabeth VISTA Campus also had to be considered. Although most VISTA programmes are being phased out, and no new enrolments are allowed in these programmes, a large number of former VISTA students enrolled at the former UPE Summerstrand Campus following the incorporation. These trends distorted the historical data of the former UPE. It is assumed that the quality of projections will improve in future years as enrolment in programmes stabilises.
Projections of enrolments in pipeline programmes were done by analysing the current enrolments in the programmes. On the basis of historical pass rates and dropout rates and the current number of students in the final year of the pipeline programmes, projections were
8
made for the 2006–2008 enrolments, which would be a decline in enrolments since these programmes are being phased out.
4. THE PROGRAMME REVIEW AND CONSOLIDATION PROCESS
4.1 Information on the programme structure
In preparation for the programme review the NMMU developed datasets listing all modules linked to each qualification by study year with all the relevant attributes, such as:
• Faculty code and faculty name of the faculty that is responsible for programme coordination.
• Department code and department name.
• Qualification code and qualification name.
• Approved qualification identification code and approved qualification name.
• Subject/module code and subject/module name.
• SAPSE level code and SAPSE level name.
• Offering type code and offering type name (contains information on the campus/ where the subject/module of the programme is offered).
• Major (yes/no).
• CESM category.
• NQF credits.
• Stats credits (relative course weight – RCW).
• Current enrolments.
• Contact/distance classification.
• Full-time/part-time classification.
• Date instituted.
• Date phased out.
The SAPSE level of the non-research and research modules of master’s degrees must be thoroughly checked for correctness of coding to ensure that the correct subsidy is claimed. There is a huge difference in subsidy for the research and non-research master’s modules: the
9
former receive approximately 12 times the amount of the latter. Graduate research modules are funded as research outputs, while non-research modules are funded as teaching outputs.
A summary of the following information was also prepared:
• Total NQF credits per programme and per NQF level of the programme.
• Minimum formal, experiential and total time of the programme.
It is difficult to get a very clear picture of the academic curriculum from databases, because a large number of modules, even those not currently offered, are linked to the qualifications on the database. The reasons for this are as follows:
• When a student qualifies, that student’s record must be balanced in terms of the stats credits of the modules/subjects that were taken as part of his or her academic curriculum.
• Because the 0% test for university type programmes and the calculation of the FTE values for master’s and doctoral students are based on the history of the graduates of the last three years, all modules/subjects that were taken during the course of their academic history must be kept on the database. These include all modules/subjects even if they were taken many years ago by one of the graduates.
• Even if modules/subjects have been phased out or their module codes have been changed they must still be linked to the programme record on the database because of there might still be future graduates who had taken the module as part of their curriculum before it was phased out.
These datasets provide all the details of the modules grouped according to the prospectus. It was also indicated which modules are core and which are electives. A summary of the total NQF credits was made to evaluate the correctness of the stats credits. These datasets thus contain profiles of the programmes’ structures and core and elective modules. It is envisaged that these profiles will be maintained as a separate database as changes occur, so that an electronic correct profile of each programme will be immediately available when needed.
4.2 Evaluation of the efficiency of programmes
During the programme consolidation process, the possible modification or termination of low demand, inefficient and obsolete programmes must be addressed. A dataset of headcount enrolments according to the PQM layout over a number of years (at least three to four years) must be developed to evaluate recent enrolment trends. A workload model or staff allocation model can evaluate how efficiently staff are being used. These models point out areas of over- and/or under-provisioning of staff.

10
4.3 Balance of enrolments at various levels and in various main fields
An important consideration for the programme review and consolidation process is to ensure that the PQM will support the desired percentage distribution in Science, Engineering and Technology (SET), Business and Management, Education, and Humanities. It is also important to evaluate the balance of enrolments at various undergraduate and postgraduate levels and compare it with the Department of Education’s enrolment planning targets. This exercise will also inform areas for institutional capping and areas for growth.
The data that are needed to determine the percentage distribution are total enrolments at various qualification levels and headcounts divided into CESM categories. To assess whether enrolment trends are improving in the direction of the desired percentage distributions, the data for at least three years are needed and growth rates and percentage distributions in the various categories must be calculated.
4.4 Staff information that will be needed for programme reviews
The following staff information is needed to compile a profile of the academic and non-academic human resources available for programme reviews:
• Number of staff at various levels according to rank and according to the following categories of appointment type:
a) Permanently appointed (full-time and part-time).
b) Temporary appointment for a period of 12 months or more (full-time and part-time).
c) Temporary appointment for a period of less than 12 months (full-time and part-time).
• Staff information tabled by race and gender, for equity considerations in planning.
• A comparison of the appointed staff with the existing post structures, to determine in cases where there are staff shortages whether these are the result of scarcity of available academics or a budget issue.
• Information on the staff qualifications and relevant experience, to help formulate guidelines for staff recruitment, suggest possibilities for staff redeployment where necessary, or identify a need for staff recruitment.
• Staff FTE to student FTE ratios per academic unit (based on the number of students enrolled in the modules assigned to the unit and the number of staff lecturing the modules), to broadly indicate areas of over/understaffing. Unweighted FTE information must be used for these calculations and compared with norms set by the institution guided by the new funding framework and current level of state funding.
• Information on support/administrative staff per academic unit (department or school level), to indicate how much support is available to academic staff, i.e. what help they are receiving so as to be able to focus on their core activities. Information is needed on
11
the support/administrative staff at various levels, classified as professional support, administrative, technical, crafts and trades, and services, and whether they are employed full-time or part-time.
The NMMU has developed an academic staff workload model to assess the level of academic staff provisioning in academic units. This model is discussed in the following sections.
4.5 Academic staff workload model for the NMMU
A workload model is useful for assessing whether there are enough academic staff to offer the programmes, and thus help make decisions about resource allocations for existing, consolidated and new programmes. The most important (and most costly) part of programme provision is the academic staff time needed to provide service to the students. This can be directly related to the cost of providing staff.
The NMMU’s model estimates the staff time required to offer modules and generate research outputs. Each faculty, school and department has a set of modules which will be allocated a number of senior lecturer hours. The actual distribution of staff (junior lecturers to professors) can vary according to the needs, provided that the senior lecturer units (senior lecturer hours converted to senior lecturer units) are not exceeded.
The model proposes that each module, (including coursework and research degree supervision) is resourced by the University with a determined number of senior lecturer hours and provision is also made for staff time for research. A reasonable amount of staff time is allocated to each module on a standard basis, rather than trying to determine how much time is needed for each module with its own peculiarities and subjective demands. The principles of the new funding formula are used to allocate resources in a way that is related to funding, and thus provide drivers to steer faculties, schools and departments in the direction of cost efficiency.
All modules/ subjects offered by the University are grouped by:
• CESM category. This is based on the nature of the subject material and is funded at a ratio of 1, 1.5, 2.5, or 3.5 according to category.
• Level. Undergraduate subjects/modules are funded at level 1, coursework modules at postgraduate level are funded at level 2, research master’s at level 3, and doctoral studies at level 4.
• Contact or distance delivery mode. Modules or subjects offered by contact delivery mode are funded at a ratio of 1 and modules or subjects offered by distance delivery mode are funded at a ratio of 0.5.
The workload model provides workload hours for the coursework or individual supervision of research students. The allocation of workload hours is proportional to the credit value of the module (NQF credits in this instance).
12
4.5.1 Determination of the time required for the standard module
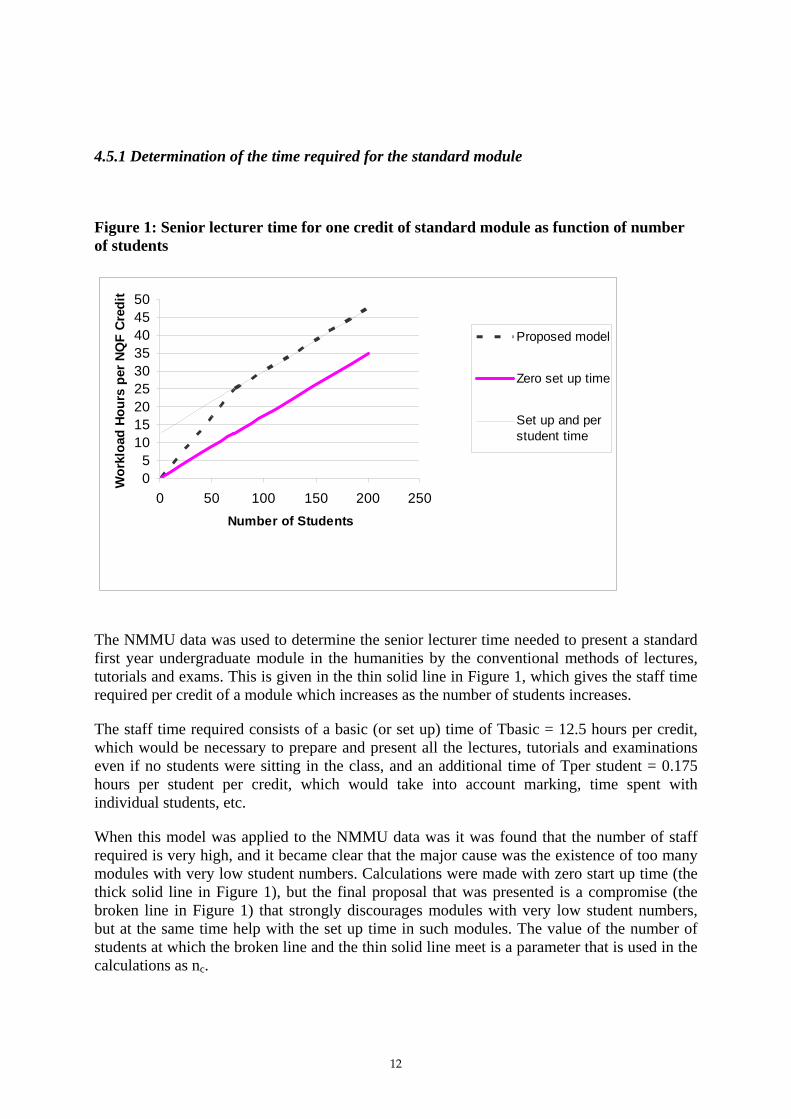
Figure 1: Senior lecturer time for one credit of standard module as function of number of students
05
101520253035404550
0 50 100 150 200 250Number of Students
Wor
kloa
d Ho
urs
per N
QF
Cred
it
Proposed model
Zero set up time
Set up and perstudent time
The NMMU data was used to determine the senior lecturer time needed to present a standard first year undergraduate module in the humanities by the conventional methods of lectures, tutorials and exams. This is given in the thin solid line in Figure 1, which gives the staff time required per credit of a module which increases as the number of students increases.
The staff time required consists of a basic (or set up) time of Tbasic = 12.5 hours per credit, which would be necessary to prepare and present all the lectures, tutorials and examinations even if no students were sitting in the class, and an additional time of Tper student = 0.175 hours per student per credit, which would take into account marking, time spent with individual students, etc.
When this model was applied to the NMMU data was it was found that the number of staff required is very high, and it became clear that the major cause was the existence of too many modules with very low student numbers. Calculations were made with zero start up time (the thick solid line in Figure 1), but the final proposal that was presented is a compromise (the broken line in Figure 1) that strongly discourages modules with very low student numbers, but at the same time help with the set up time in such modules. The value of the number of students at which the broken line and the thin solid line meet is a parameter that is used in the calculations as nc.
13
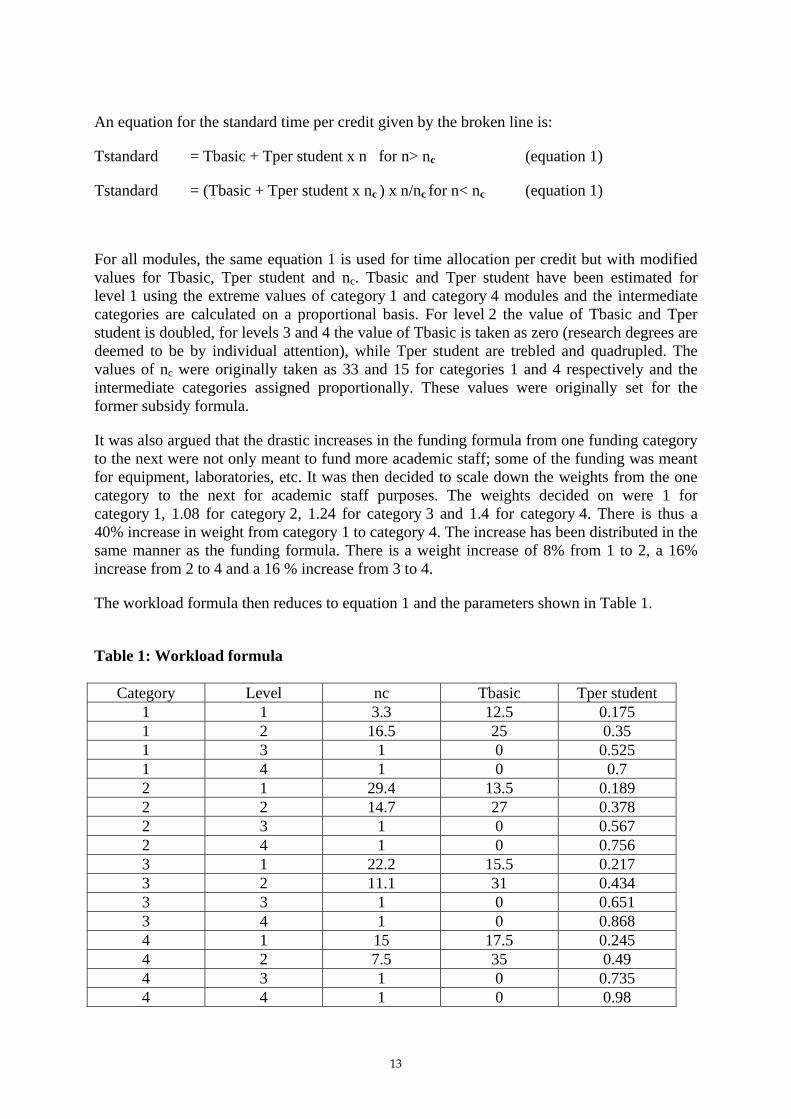
An equation for the standard time per credit given by the broken line is:
Tstandard = Tbasic + Tper student x n for n> nc (equation 1)
Tstandard = (Tbasic + Tper student x nc ) x n/nc for n< nc (equation 1)
For all modules, the same equation 1 is used for time allocation per credit but with modified values for Tbasic, Tper student and nc. Tbasic and Tper student have been estimated for level 1 using the extreme values of category 1 and category 4 modules and the intermediate categories are calculated on a proportional basis. For level 2 the value of Tbasic and Tper student is doubled, for levels 3 and 4 the value of Tbasic is taken as zero (research degrees are deemed to be by individual attention), while Tper student are trebled and quadrupled. The values of nc were originally taken as 33 and 15 for categories 1 and 4 respectively and the intermediate categories assigned proportionally. These values were originally set for the former subsidy formula.
It was also argued that the drastic increases in the funding formula from one funding category to the next were not only meant to fund more academic staff; some of the funding was meant for equipment, laboratories, etc. It was then decided to scale down the weights from the one category to the next for academic staff purposes. The weights decided on were 1 for category 1, 1.08 for category 2, 1.24 for category 3 and 1.4 for category 4. There is thus a 40% increase in weight from category 1 to category 4. The increase has been distributed in the same manner as the funding formula. There is a weight increase of 8% from 1 to 2, a 16% increase from 2 to 4 and a 16 % increase from 3 to 4.
The workload formula then reduces to equation 1 and the parameters shown in Table 1.
Table 1: Workload formula
Category Level nc Tbasic Tper student 1 1 3.3 12.5 0.175 1 2 16.5 25 0.35 1 3 1 0 0.525 1 4 1 0 0.7 2 1 29.4 13.5 0.189 2 2 14.7 27 0.378 2 3 1 0 0.567 2 4 1 0 0.756 3 1 22.2 15.5 0.217 3 2 11.1 31 0.434 3 3 1 0 0.651 3 4 1 0 0.868 4 1 15 17.5 0.245 4 2 7.5 35 0.49 4 3 1 0 0.735 4 4 1 0 0.98
14
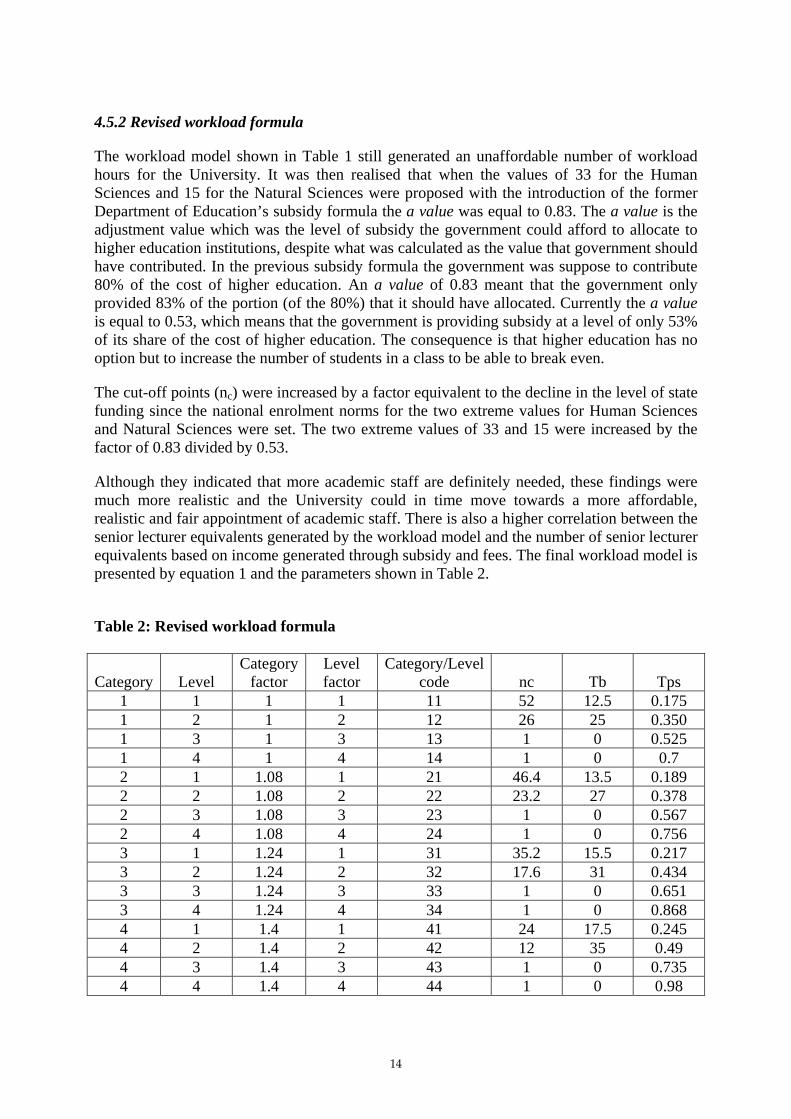
4.5.2 Revised workload formula
The workload model shown in Table 1 still generated an unaffordable number of workload hours for the University. It was then realised that when the values of 33 for the Human Sciences and 15 for the Natural Sciences were proposed with the introduction of the former Department of Education’s subsidy formula the a value was equal to 0.83. The a value is the adjustment value which was the level of subsidy the government could afford to allocate to higher education institutions, despite what was calculated as the value that government should have contributed. In the previous subsidy formula the government was suppose to contribute 80% of the cost of higher education. An a value of 0.83 meant that the government only provided 83% of the portion (of the 80%) that it should have allocated. Currently the a value is equal to 0.53, which means that the government is providing subsidy at a level of only 53% of its share of the cost of higher education. The consequence is that higher education has no option but to increase the number of students in a class to be able to break even.
The cut-off points (nc) were increased by a factor equivalent to the decline in the level of state funding since the national enrolment norms for the two extreme values for Human Sciences and Natural Sciences were set. The two extreme values of 33 and 15 were increased by the factor of 0.83 divided by 0.53.
Although they indicated that more academic staff are definitely needed, these findings were much more realistic and the University could in time move towards a more affordable, realistic and fair appointment of academic staff. There is also a higher correlation between the senior lecturer equivalents generated by the workload model and the number of senior lecturer equivalents based on income generated through subsidy and fees. The final workload model is presented by equation 1 and the parameters shown in Table 2.
Table 2: Revised workload formula
Category Level Category
factor Level factor
Category/Level code nc Tb Tps
1 1 1 1 11 52 12.5 0.175 1 2 1 2 12 26 25 0.350 1 3 1 3 13 1 0 0.525 1 4 1 4 14 1 0 0.7 2 1 1.08 1 21 46.4 13.5 0.189 2 2 1.08 2 22 23.2 27 0.378 2 3 1.08 3 23 1 0 0.567 2 4 1.08 4 24 1 0 0.756 3 1 1.24 1 31 35.2 15.5 0.217 3 2 1.24 2 32 17.6 31 0.434 3 3 1.24 3 33 1 0 0.651 3 4 1.24 4 34 1 0 0.868 4 1 1.4 1 41 24 17.5 0.245 4 2 1.4 2 42 12 35 0.49 4 3 1.4 3 43 1 0 0.735 4 4 1.4 4 44 1 0 0.98
15
4.5.3 Time per credit of any given research supervision module
A given research module will have a credit value (cr), a category (1, 2, 3 or 4), a level (3 or 4), and there is no distinction between delivery by contact or distance mode. The same time allocation as for coursework modules is used but with the proviso that Tbasic = 0, Tper student =0.175, Flevel = 3 for level 3 and 4 for level 4, and Fcontact/distance = 1 for contact and distance. The level of research supervision modules is at master’s and doctoral level and the new funding framework gives a weight of 3 and 4 for these modules. The new funding framework also funds contact and distance master’s and doctoral students equally and therefore the same weight is given to contact and distance students. The above model calculates the time required to deliver any research supervision module.
4.5.4 Research output and time
The research output of an academic for a year is determined as the sum of the number of published journal articles that qualify for subsidy, completed research master’s students, and completed doctorates (multiplied by 3) during the year. The new funding formula has set the normal output as 1.25 for former university staff and 0.5 for former technikon staff. Currently the Department of Education still applies these separate values even for merged institutions.
It is suggested that to produce 1.25 units for university staff, a researcher would take 33.3% of the available hours per annum. Further it is noted that provision for research staff from subsidies comes from both research student input subsidies and research output subsidies. Research output subsidies make up 47.3% of research student input subsidies plus research output subsidies, so the senior lecturer units (SLUs) from research outputs = (Units/1.25) x 0.333 x 0.473. The hours are obtained by multiplying the SLU by 1550.
For former technikon staff the norm of 0.5 will imply that proportionally less time will have to be spent on research = (0.5/1.25) x 0.333 = 0.1332. A former technikon staff member would thus spend 13.32% of his or her time on research. The formula for former technikon staff thus changes to:
Senior lecturer units from research = (Units/0.5) x 0.1332 x 0.473.
4.5.5 Total workload
The total workload of an individual, department or faculty is the sum of teaching time, research time and administration time. An academic has approximately 45 weeks of 40 hours to spend for the University with a total time per annum of 1800 hours. If one sets aside 14% for administration (250 hours) this leaves 1550 hours for teaching and research, and so 1550 hours is considered equivalent to a senior lecturer. Once the total number of workload hours has been calculated with the workload model, the total time is divided by 1550 to calculate the number of senior lecturer units.
16
4.5.6 Comparison of SLUs based on income generated, SLUs generated by the workload model and SLUs based on current academic staff
To draw any conclusions from the results of the workload model, the workload hours and SLUs must be compared with SLUs based on income generated as well as the SLUs provided for in the current academic staff provisioning.
4.5.7 Calculation of SLUs based on income generated
The income of each department and faculty is calculated as the total income of each module and research output ‘owned’ by that unit. The input subsidies are uniquely attached to modules by the funding formula and can be calculated from the HEMIS data. The fees are very largely raised by module in the billing system and total fee income for each module can be determined. The main difficulty is to attach the teaching output subsidy to each module, since the subsidy is paid for success by each student in a programme by obtaining credit in all the required modules, which may come from different departments from more than one faculty. To recognise all the contributions to successfully graduating a student, it is proposed that the distribution of the total output subsidy be apportioned to modules on the basis of the product of two weights. The first weight is the total income of the module and the second weight is the pass rate. The pass rate is defined as the number of successful students divided by the number of students studying. Students studying are defined as the number of enrolled students minus the number of students who cancelled before the HEMIS census date. This will encourage attention to pass rates in modules and is the most equitable basis.
The total earned SLUs is calculated as 35% of the combined earnings of all module and research outputs of each faculty and department as this is very close to the actual situation in the present budget. In order to translate the earnings to SLUs, the earnings are divided by the average cost-to-company package of a senior lecturer. This value was R285 460 for the NMMU in 2005. The workload hours earned are the SLU x 1800 x 0.86. This is based on the assumption that the number of academic staff is approximately the same as the number of SLUs, and that 86% of the time is spent on research and module delivery, with 14% of the academic staff time spent on administration.
4.5.8 Calculation of SLUs based on actual academic staff provisioning
The number of SLUs can be calculated on the basis of the current cost-to-company packages of academic staff employed. The current cost-to-company package of each staff member is divided by the average cost-to-company package of a senior lecturer to convert the actual staff provisioning to SLUs.
4.5.9 Adjusting the SLUs for budgeting purposes
If the University, for example, decides that it can only afford the staff allocations generated by the actual total earnings, the SLUs generated by the workload model can be proportionally adjusted either by faculty (if no cross-subsidisation will be done between faculties) or by the total academic staff of the University (if cross-subsidisation will be allowed).

17
4.5.10 Usefulness of the workload model for programme review
The workload model results will help the review committee assess the adequacy of human resources for the anticipated staffing requirements of programmes and modules. Since the workload hours and SLUs and the subsidy income calculations are done per module, these calculations can also be done by programme. Where modules are taken as part of more than one programme, the hours, income and staff inputs can be split proportionally according to the ‘portion’ of the module that forms part of a particular programme. This will also provide valuable information on the viability of particular modules. The NMMU model provides a valuable comparison of the income generated by a module through fees and subsidies, the number of workload hours needed to offer the module at an acceptable standard of academic staff provisioning, and the current actual staff provided through the current budget allocations. All three components are expressed as SLUs to make the information comparable.
Because information is provided by module, a basis is provided for the allocation of work to academic staff and to determine the distribution of workloads within faculties and departments.
The NMMU’s workload model currently only applies to academic staff. The NMMU has not yet developed norms and standards for the provision of administrative and support staff. The results of the workload model of the NMMU for the Faculty of Business and Economic Sciences are shown in Tables 3, 4 and 5.
Table 3: Hours, SLUs and staff budget based on income generated through fees and subsidies
Hours, SLUs and staff budget based on income generated through fees and subsidies
Total earned
Faculty name
System Department Hours SLUs Staff budget
Applied Accounting 11,256 7.3 R2,073,009
Business Management 12,556 8.1 R2,312,446
Human Resources Management 10,365 6.7 R1,908,979
Logistics Management & Economics 13,730 8.9 R2,528,586
Business & Economic Sciences
PET
Management Accounting 9,701 6.3 R1,786,527
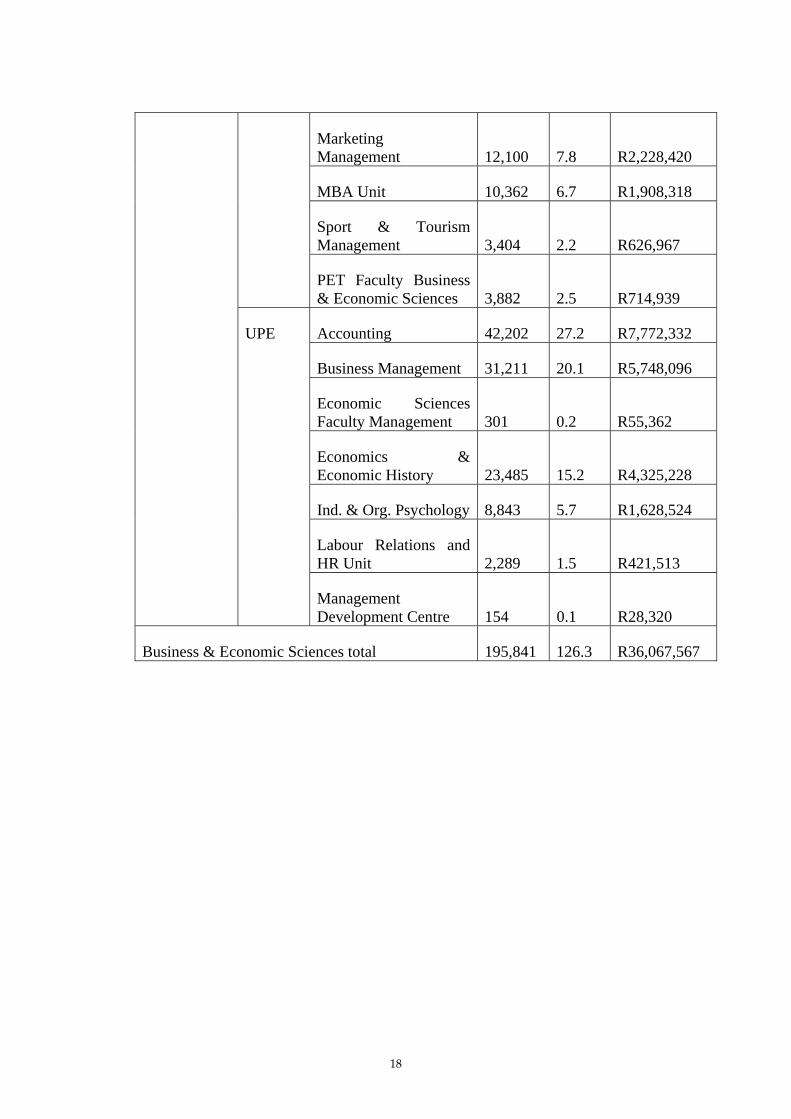
18
Marketing Management 12,100 7.8 R2,228,420
MBA Unit 10,362 6.7 R1,908,318
Sport & Tourism Management 3,404 2.2 R626,967
PET Faculty Business & Economic Sciences 3,882 2.5 R714,939
Accounting 42,202 27.2 R7,772,332
Business Management 31,211 20.1 R5,748,096
Economic Sciences Faculty Management 301 0.2 R55,362
Economics & Economic History 23,485 15.2 R4,325,228
Ind. & Org. Psychology 8,843 5.7 R1,628,524
Labour Relations and HR Unit 2,289 1.5 R421,513
UPE
Management Development Centre 154 0.1 R28,320
Business & Economic Sciences total 195,841 126.3 R36,067,567
19
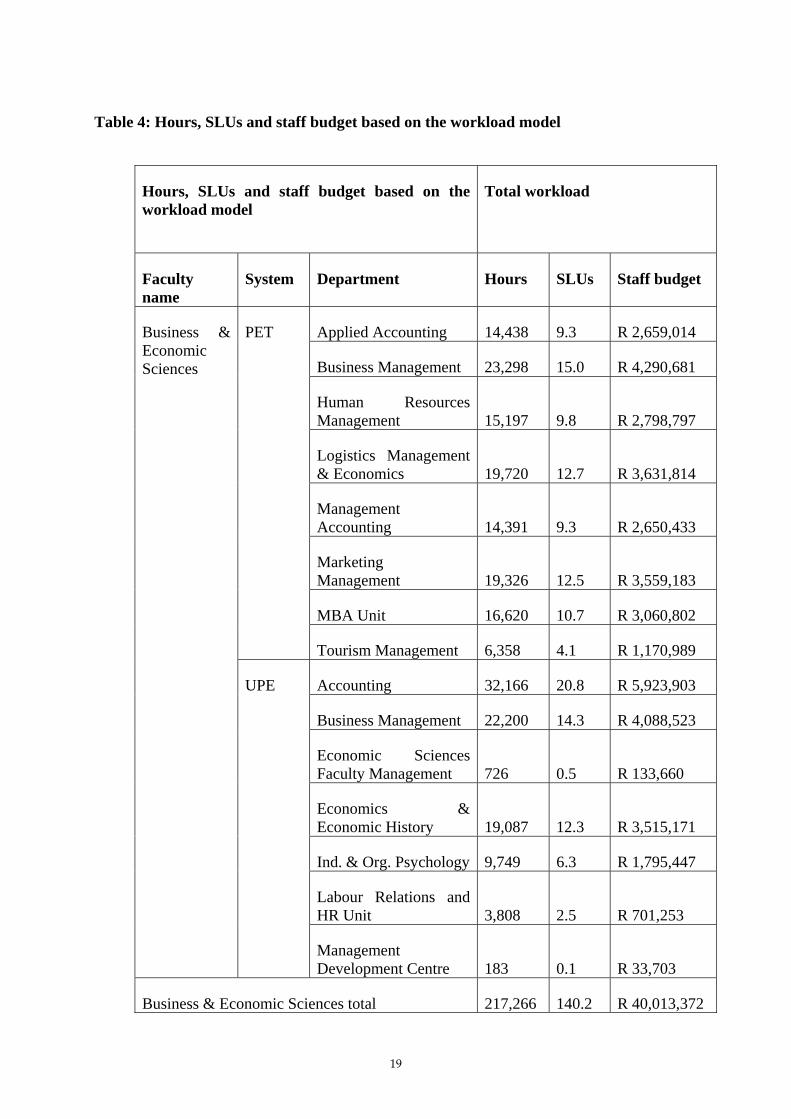
Table 4: Hours, SLUs and staff budget based on the workload model
Hours, SLUs and staff budget based on the workload model
Total workload
Faculty name
System Department Hours SLUs Staff budget
Applied Accounting 14,438 9.3 R 2,659,014
Business Management 23,298 15.0 R 4,290,681
Human Resources Management 15,197 9.8 R 2,798,797
Logistics Management & Economics 19,720 12.7 R 3,631,814
Management Accounting 14,391 9.3 R 2,650,433
Marketing Management 19,326 12.5 R 3,559,183
MBA Unit 16,620 10.7 R 3,060,802
PET
Tourism Management 6,358 4.1 R 1,170,989
Accounting 32,166 20.8 R 5,923,903
Business Management 22,200 14.3 R 4,088,523
Economic Sciences Faculty Management 726 0.5 R 133,660
Economics & Economic History 19,087 12.3 R 3,515,171
Ind. & Org. Psychology 9,749 6.3 R 1,795,447
Labour Relations and HR Unit 3,808 2.5 R 701,253
Business & Economic Sciences
UPE
Management Development Centre 183 0.1 R 33,703
Business & Economic Sciences total 217,266 140.2 R 40,013,372
20
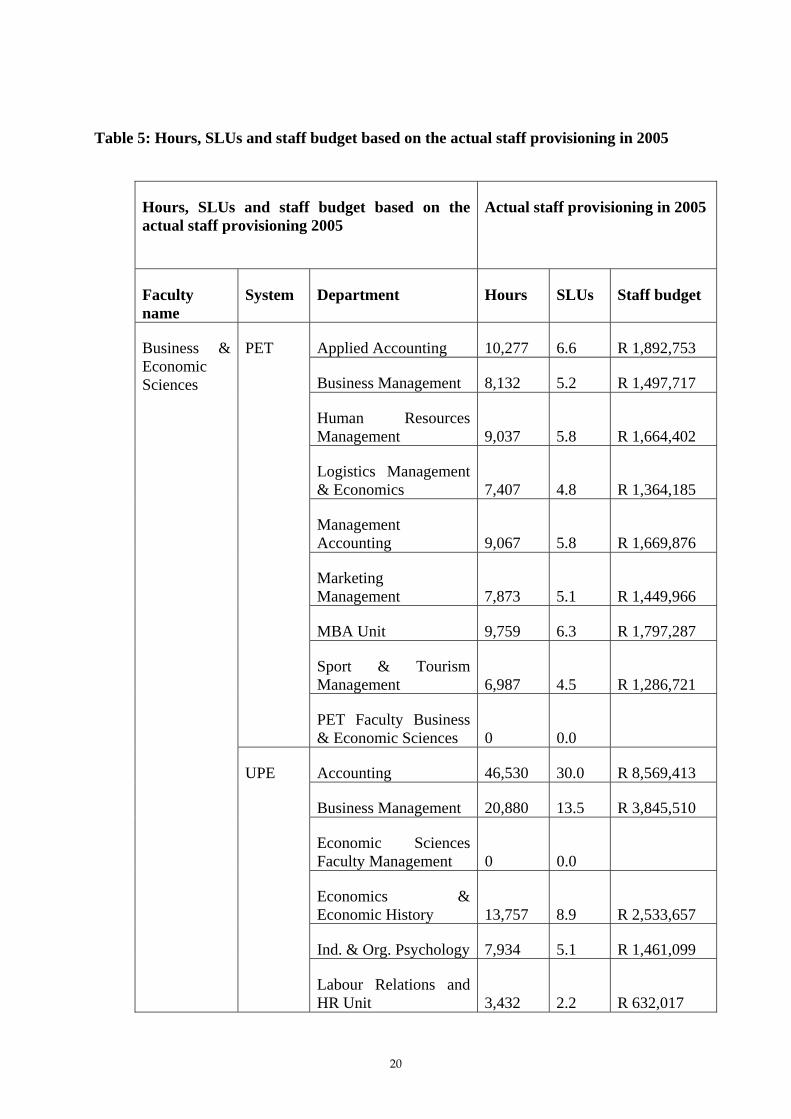
Table 5: Hours, SLUs and staff budget based on the actual staff provisioning in 2005
Hours, SLUs and staff budget based on the actual staff provisioning 2005
Actual staff provisioning in 2005
Faculty name
System Department Hours SLUs Staff budget
Applied Accounting 10,277 6.6 R 1,892,753
Business Management 8,132 5.2 R 1,497,717
Human Resources Management 9,037 5.8 R 1,664,402
Logistics Management & Economics 7,407 4.8 R 1,364,185
Management Accounting 9,067 5.8 R 1,669,876
Marketing Management 7,873 5.1 R 1,449,966
MBA Unit 9,759 6.3 R 1,797,287
Sport & Tourism Management 6,987 4.5 R 1,286,721
PET
PET Faculty Business & Economic Sciences 0 0.0
Accounting 46,530 30.0 R 8,569,413
Business Management 20,880 13.5 R 3,845,510
Economic Sciences Faculty Management 0 0.0
Economics & Economic History 13,757 8.9 R 2,533,657
Ind. & Org. Psychology 7,934 5.1 R 1,461,099
Business & Economic Sciences
UPE
Labour Relations and HR Unit 3,432 2.2 R 632,017
21
Management Development Centre 0 0.0 R 0
Business & Economic Sciences total 161,074 103.9 R 29,664,603
From these results it was evident that the Faculty of Business and Economic Sciences was understaffed and that in terms of both its income generated and the results of the workload model they were entitled to a larger academic staff budget. A huge increase in the 2006 allocation for academic staff for this Faculty was allocated to begin to eradicate its academic staff shortages.
4.6 Headcount versus FTE information
Headcounts relate to enrolment planning and are needed to establish the demand for a programme as well as fee income. They are also needed for staff workload models and the establishment of space needs. FTEs express headcounts in modules and programmes as comparable FTEs based on the stats credits of modules for which students are enrolled. FTEs relate to subsidy income, viability of programmes, budget allocations, and cost effectiveness.
The calculation of subsidy income is linked to the weighted FTEs of modules (headcounts multiplied by the stats credits and weighted according to funding level and course level). Income can be calculated by module and programme, since it is possible to extract from the HEMIS data the FTEs per module for all the modules taken by students enrolled for a specific programme. FTE information on programmes and thus subsidy income per programme can be linked to staff information, provided that the institution has linked staff proportionally to the modules that they lecture. It is, however, more complicated than calculating the FTEs and income of academic units based on the modules they are responsible for.
The provision of headcount information for full-time and part-time enrolments is needed for space requirements. Space is normally not a problem for part-time students, but is very important for full-time ones. Part-time enrolment numbers indicate the demand for evening classes and the proportion of working students.
Headcount and FTE information should be tabulated by race and gender to track the achievement of equity targets or to make planning decisions for achieving them. The data must also be split for contact and distance students, to monitor enrolment targets for on-campus and off-campus enrolments and to evaluate the students’ success separately. Distance FTEs are funded at 50% of the level of contact FTEs, so these need to be separated.
4.7 Information on student success
It is important to calculate indicators of student success during the programme review process so as to identify programmes that are not equipping students with the necessary skills within the prescribed time for the programme and to develop strategies to improve the effectiveness and efficiency of programmes. The following measures are indicators of student success:
22
• Pass rates. Defined as the percentage of enrolled students who pass their modules (number of students who pass the module divided by the number who enrolled for the module). It is recommended that students who cancel before the HEMIS census date must be subtracted from the enrolled students to give a more accurate picture of pass rates. Students who pass supplementary examinations should be included as passes, but care must be taken not to double count these students as enrolments. Students who do not show for the examinations or who do not get admitted to examinations because of poor performance during semester tests are counted as failures. Pass rates can be calculated by module or by academic unit such as a department/school or faculty.
• Success rates. Success rates are defined as the percentage of (passed credits divided by enrolled credits). This is actually a much better reflection of the degree of success achieved. It can be calculated by module or by academic unit such as a department or school or faculty. Success rates differ from pass rates. In the calculation of pass rates of academic units, the ‘weighting’ of the modules in the total of a department or school or faculty is loss. Success rates ‘weigh’ the modules in the overall success rate in proportion to their credits.
• Throughput and dropout rates per programme. Throughput rates are defined as the percentage of students who successfully complete a programme within the minimum prescribed time. Dropout rates are students who do not complete the programme. A dropout may enrol at another tertiary institution but it is not possible for individual institutions to monitor what a student who leaves the institution does afterwards. To calculate dropout rates is very labour intensive if done properly. One needs to look at data from several years to select a cohort of students of a reasonable size and follow their academic success over a number of years. The number of years that the students’ records are followed for a particular programme is determined by the minimum prescribed time. It is also useful to monitor at least an additional year or two following the expected year of completion because in some cases large numbers of students complete the qualification a year or two later. The analyses must be done based on individual student records.
• Graduation rates. Defined as the percentage of students in a programme who graduate in a particular year as a percentage of the students enrolled in the programme in the same year. This is not a very reliable measure if it is a programme experiencing growth or decline in enrolments. The new funding framework has defined national norms against which graduation rates can be benchmarked. Graduation rates must be evaluated in relation to the prescribed minimum time for completion.
4.8 Financial information
Financial information is needed to indicate the costs involved in offering programmes and modules, to assess their financial viability. The risk is that this could often become the only criterion for decisions whether to offer these programmes or modules in future. The institution also needs to pay careful attention to the strategic importance of the offering, especially in view of national priorities, human resources needs for economic growth, and the institution’s vision, mission and strategic objectives. It might also be possible to improve financial viability by implementing cost-effectiveness measures, increasing third stream income, sponsorships, and more effective marketing of the programmes. Where programmes are
23
evaluated as strategic, cross-subsidisation can be considered if they are not financially viable currently. It is also extremely important that institutions set aside funding in their budgets for developing and introducing new programmes and enhancing strategic programmes. New programmes will have to be carried by the institution until they become financially sustainable.
The former subsidy funding formula contributed to institutional costs and funded some of the overheads separately. A basic feature of the new framework is that it is a goal oriented mechanism for distributing government grants to institutions in accordance with national priorities and approved institutional plans. The government funds institutions for rendering services related to the production of graduates and diplomates, research findings, and other forms of knowledge output. This means that all overheads are included in the various subsidy components. The institution must thus calculate what percentage of the subsidy can be allocated to the programmes or modules based on the institution’s historical patterns of budgets and expenditure.
The income of programmes is generated by the following three sources:
• Subsidy income consisting of: teaching input subsidies, teaching output subsidies, teaching output development subsidies, research output subsidies and research output development subsidies. The institution can also decide whether a portion of the institutional factor for size and for disadvantage should also be channelled to programmes/modules.
• Tuition fee income that can be calculated by programme or module depending on whether the institution raises fees by programme or module.
• Third stream income.
To determine the financial viability and sustainability of programmes, cost estimations must be made of the expenses of programmes to compare with the income the programmes generate. If costing models are unavailable, current budgets and a split of overheads among departments can assist in making estimations. Direct costs such as staff salaries for academic, support, administrative and other staff, and expenses related to fixed assets and running expenses can be obtained from the financial systems. Indirect costs such as overheads can be estimated from the total budget.
4.9 Templates for programme and module changes
It is necessary to develop templates to keep track of programme and module changes, to ensure that the necessary motivations are in place, and to see that the academic staff, facilities, specialised venues, library resources and budget provisioning have been considered to ensure that the proposed changes will be viable. Where new modules will be introduced a module registration form must be completed. These documents are needed to ensure that the PQM is updated; the academic structure on the database is changed accordingly; new modules are captured on the database; fees are linked for the introduction of the new modules; and the University’s prospectus includes the new programme and module information.

24
These templates should focus on testing the feasibility/sustainability of programmes and modules. The following questions must be answered:
• What are the staff implications of the programme and or modules?
• Is the ratio of full-time to part-time staff appropriate?
• Are new positions required, or can they be re-allocated from elsewhere – e.g. by moving staff from other programmes that are being phased out? Reference should be made to academic, administrative and technical staff.
• To what extent is the expertise and experience of existing institutional staff sufficient to address the requirements of the programme – and to what extent will use be made of external expertise?
• Are there specific staff development needs relating to this programme?
• Are there specific problems in terms of library and information technology that need to be addressed in order to present the programme at certain institutional delivery sites (either within the main campus, at satellite campuses or at off-campus teaching and learning centres)?
• What kinds of interventions will be necessary to address problems in terms of library and information technology (additional budget, more support staff, upgrading of facilities)?
• Are there specific problems in terms of infrastructure and equipment that need to be addressed in order to present the programme at certain institutional delivery sites (either within the main campus, at satellite campuses or at off-campus teaching and learning centres)?
• What kinds of interventions will be necessary to address identified problems in terms of infrastructure and equipment (additional budget, more support staff, upgrading of facilities)?
The following procedures must also be followed:
• The total NQF credits of the module and or programme (broken down according to core and elective modules) must be provided for the calculation of the correct stats credits (RCW).
• Where modules/ programmes are going to be changed, consolidated, phased out or introduced, the details of the changes must be captured in the templates.
• Clear instructions and guidelines must be provided for the completion of the templates.