database the oecd input-output - dartmouth collegerstaiger/oecd input-output database.pdf · the...
TRANSCRIPT
Please cite this paper as:
Yamano, N. and N. Ahmad (2006), “The OECD Input-Output Database: 2006 Edition”, OECD Science,Technology and Industry Working Papers, 2006/08, OECDPublishing.http://dx.doi.org/10.1787/308077407044
OECD Science, Technology andIndustry Working Papers 2006/08
The OECD Input-OutputDatabase
2006 EDITION
Norihiko Yamano, Nadim Ahmad
Unclassified DSTI/DOC(2006)8 Organisation de Coopération et de Développement Economiques Organisation for Economic Co-operation and Development 20-Oct-2006 ___________________________________________________________________________________________
English text only DIRECTORATE FOR SCIENCE, TECHNOLOGY AND INDUSTRY
THE OECD INPUT-OUTPUT DATABASE: 2006 EDITION STI WORKING PAPER 2006/8 Statistical Analysis of Science, Technology and Industry
Norihiko Yamano and Nadim Ahmad
JT03216296
Document complet disponible sur OLIS dans son format d'origine Complete document available on OLIS in its original format
DST
I/DO
C(2006)8
Unclassified
English text only

DSTI/DOC(2006)8
2
STI Working Paper Series
The Working Paper series of the OECD Directorate for Science, Technology and Industry is designed to make available to a wider readership selected studies prepared by staff in the Directorate or by outside consultants working on OECD projects. The papers included in the series cover a broad range of issues, of both a technical and policy-analytical nature, in the areas of work of the DSTI. The Working Papers are generally available only in their original language � English or French � with a summary in the other.
Comments on the papers are invited, and should be sent to the Directorate for Science, Technology and Industry, OECD, 2 rue André-Pascal, 75775 Paris Cedex 16, France.
The opinions expressed in these papers are the sole responsibility of the author(s) and do not necessarily reflect those of the OECD or of the governments of its member countries.
http://www.oecd.org/sti/working-papers
© Copyright OECD/OCDE, 2006

DSTI/DOC(2006)8
3
THE OECD INPUT-OUTPUT DATABASE: 2006 EDITION∗
Norihiko Yamano and Nadim Ahmad
ABSTRACT
The development of the OECD�s input-output database started over a decade ago and is currently undergoing its second update. Over the years, the database has been used in a number of analytical applications both within and outside the OECD. Two major applications within the OECD concerned the analysis of the diffusion of embodied technology and, more recently, the measurement of carbon dioxide emissions embodied in the international trade of goods. The latest update is being conducted as part of an OECD project looking at global value chains. This paper describes how the database has developed over the last decade, both from a collection and a compilation perspective, and some of the thinking behind the various assumptions used during compilation and the various pre-requisite data needed to compile the tables. The paper also outlines the rationale for producing these harmonised tables on an industry-by-industry basis rather than product-by-product; partly reflecting the importance of linking the tables to many other OECD databases. The purpose of the paper is therefore twofold. The first is to describe the database and its uses. The second is to describe the OECD�s experience in the compilation of these tables in the hope that this may benefit input-output compilers in national statistical offices and provide them with a better understanding of the information needed by the OECD to compile these tables in order to meet the demands of users.
∗ The authors would like to thank the multitude of test users for their comments as well as national statistics
institutes and Norihisa Sakurai for their valuable assistance in providing data.
DSTI/DOC(2006)8
4
LA BASE DE DONNÉES ENTRÉES-SORTIES DE L�OCDE : ÉDITION 2006∗
Norihiko Yamano et Nadim Ahmad
RÉSUMÉ
Le développement de la base de données entrées-sorties de l�OCDE a débuté il y a une dizaine d�années et est actuellement en phase de seconde mise à jour. Au fil des ans, cette base de données a été utilisée dans un certain nombre d�applications analytiques au sein et à l�extérieur de l�OCDE. Au sein de l�OCDE, les deux principales études ont porté sur l�analyse de la diffusion des technologies intrinsèques et, plus récemment, de la mesure des émissions de dioxyde de carbone afférentes au commerce international de biens. La toute dernière mise à jour menée par l�OCDE fait partie intégrante d�un projet traitant des chaînes de valeurs mondiales. Le présent document décrit comment la base de données a été développée au cours des dix dernières années, aussi bien du point de vue de la collecte que de la compilation des données ; il fait également état des quelques réflexions tirées des diverses assomptions utilisées au cours de la compilation et des diverses données pré-requises nécessaires à l�élaboration des tableaux. Ce papier souligne aussi l�intérêt de construire des tableaux harmonisés sur la base d�une ventilation de type industrie par industrie plutôt que produit par produit � reflétant en partie l�importance de lier ces tableaux à plusieurs autres bases de données de l�OCDE. Le but de ce document est donc double. Premièrement, de décrire la base de données et ses usages. Deuxièmement, de décrire l�expérience de l�OCDE dans la compilation de ces tableaux dans l�espoir qu�ils puissent servir aux compilateurs de données d�entrées-sorties des bureaux nationaux de la statistique et leur fournir une meilleure compréhension de l�information requise par l�OCDE pour compiler ces tableaux afin de satisfaire les demandes des analystes.
∗ Les auteurs remercient tous ceux et celles qui se sont portés volontaires pour tester la base de données pour
leurs commentaires, ainsi que les offices nationaux de statistiques et Norihisa Sakurai pour les données qu�ils ont bien voulu leur fournir.
DSTI/DOC(2006)8
5
TABLE OF CONTENTS
1. Introduction and history ................................................................................................................... 6 2. Purpose ............................................................................................................................................. 6 3. Data sources ..................................................................................................................................... 7 4. The database ..................................................................................................................................... 9
4.1 Coverage � country and time ...................................................................................................... 9 4.2 Coverage � industries................................................................................................................ 11
5. Price basis....................................................................................................................................... 15 6 Format of the tables............................................................................................................................ 15
6.1 Value added components .......................................................................................................... 15 6.2 Final demand components ........................................................................................................ 16
7. Transformation to the harmonised industry-by-industry tables ..................................................... 17 8. Industry-by-industry versus product-by-product tables ................................................................. 21
REFERENCES ............................................................................................................................................. 23 ANNEX I: SUMMARY STATISTICS ....................................................................................................... 24 ANNEX II: RECENT COUNTRY TABLES............................................................................................... 25

DSTI/DOC(2006)8
6
1. Introduction and history
The first edition of the OECD Input-Output (I-O) Database dates back to 1995 and covered 10 OECD countries spanning the period 1968 to 1990. The first update to this database began in 2000 culminating in the 2002 edition1 of the database, which increased the country coverage to 18 OECD and 2 large non-OECD countries, spanning the period 1992 to 1997. Work on the second update of the database, the 2006 edition, began in 2005 with coverage extended to 28 OECD and 9 non-OECD countries. These latest tables are based around the year 2000 for most countries, though for some, more recent years are provided (for example, 2003 for Mexico).
This paper is organised as follows: Section 2 describes the purpose of the OECD I-O Database; Section 3 describes the data sources; Section 4, the coverage of the database itself; Section 5, the preferred price basis used by the OECD; Section 6, the format of the tables; Section 7 describes, in detail, the transformation processes used by the OECD to arrive at harmonised tables; and finally Section 8 provides an explanation for the industry-by-industry presentation preferred by the OECD.
2. Purpose
Input-output tables describe the sales and purchases relationships between producers and consumers within an economy. They can be produced by illustrating flows between the sales and purchases, both final and intermediate, of industry outputs or by illustrating the sales and purchases, both final and intermediate, of product outputs. The OECD Input-Output Database is presented on the former basis, reflecting in part the collection mechanisms for many other databases such as R&D expenditure data, employment statistics, pollution data and energy consumption, which are often collected by establishment or enterprise and grouped according to classifications of industrial activity (Section 4 shows the industries used in the I-O Database). They lend themselves to a number of uses that, in the main, can be categorised under two headings: analytical or statistical. Examples of the former include analyses that identify the importance of any industrial sector or product to economic output or growth, not just as a share of gross value-added, say, but as a contributor of activity or growth in other sectors e.g. via embodied analyses methods. Increasingly, they are also being used in environmental analysis � for example, to measure direct and indirect pollutants produced by industrial activity within an economy and importantly, to contribute to �footprint� or �embodied� type analyses. Indeed these are the most recent types of application of the database within the OECD2 and many other institutions.3
As a statistical analysis tool, input-output and the closely related supply-use tables are increasingly becoming the vehicles used to balance the income, expenditure and production estimates of GDP and as the basis for other statistical measures, such as productivity estimates, in particular multi-factor productivity estimates (for example, the EU KLEMS project4). In terms of international comparability they are also used as a diagnostic statistical tool, for example some National Statistics� Institutes use the OECD harmonised tables in a diagnostic way to assist the construction of their own input-output tables. Indeed, the 2002 edition of the tables provided input into the work of the OECD Task Force on Software Measurement, by comparing the widely different relationships between intermediate consumption and investment on software across countries (Ahmad, 2003). 1. Ahmad (2002). Go to www.oecd.org/std/io-tables/data to obtain the 2002 edition of OECD input-output
tables for free.
2. Ahmad and Wyckoff (2003).
3. For example, http://www.mosus.net/project-index.html.
4. See http://www.euklems.net/.

DSTI/DOC(2006)8
7
The maintenance and updating of the OECD�s Input-Output Database is necessarily financed via voluntary contributions. In practice this means that the database update always has a designated user-application since it is, by design, demand driven. The first edition, for example, was motivated by the desire to measure the diffusion of technology embodied in products (Papaconstantinou et al., 1996; Sakurai et al., 1996) while the second edition was mainly developed to measure the importance of CO2
emissions embodied in goods (Ahmad and Wyckoff, 2003). The current edition has been mainly motivated by a recent OECD project on global value chains5 and to update the 2003 work on embodied CO2 emissions.
However the usefulness of the database extends far beyond these specific applications. By making them freely available on request the OECD Input-Output tables have served as important inputs into a wide range of economic analyses, including work on productivity, technology diffusion, global warming, structural change and several other issues.6
Between December 2004 and May 2006, the OECD received over 550 requests from 50 different countries for the 2002 edition of the database (exact records were not kept before this period but the number of users also extended into the hundreds). Of these 550 users, just over half are affiliated to academic institutions and the remainder to private and government institutions. 55% of the users are from OECD European countries, 21% from NAFTA countries, 9% from other OECD countries and 14% from non OECD member countries.
In an effort to ensure that the database retains its relevance and meets users� needs as much as possible, users were recently asked if they could provide information on those areas where they would welcome improvements. Not surprisingly, wider country coverage, a more detailed industry sector breakdown and more recent tables scored highly. As will be shown in the following sections it is precisely in these three areas that the 2006 edition has seen considerable improvements. However other improvements have also been incorporated such as improved international harmonisation of the price bases.
3. Data sources
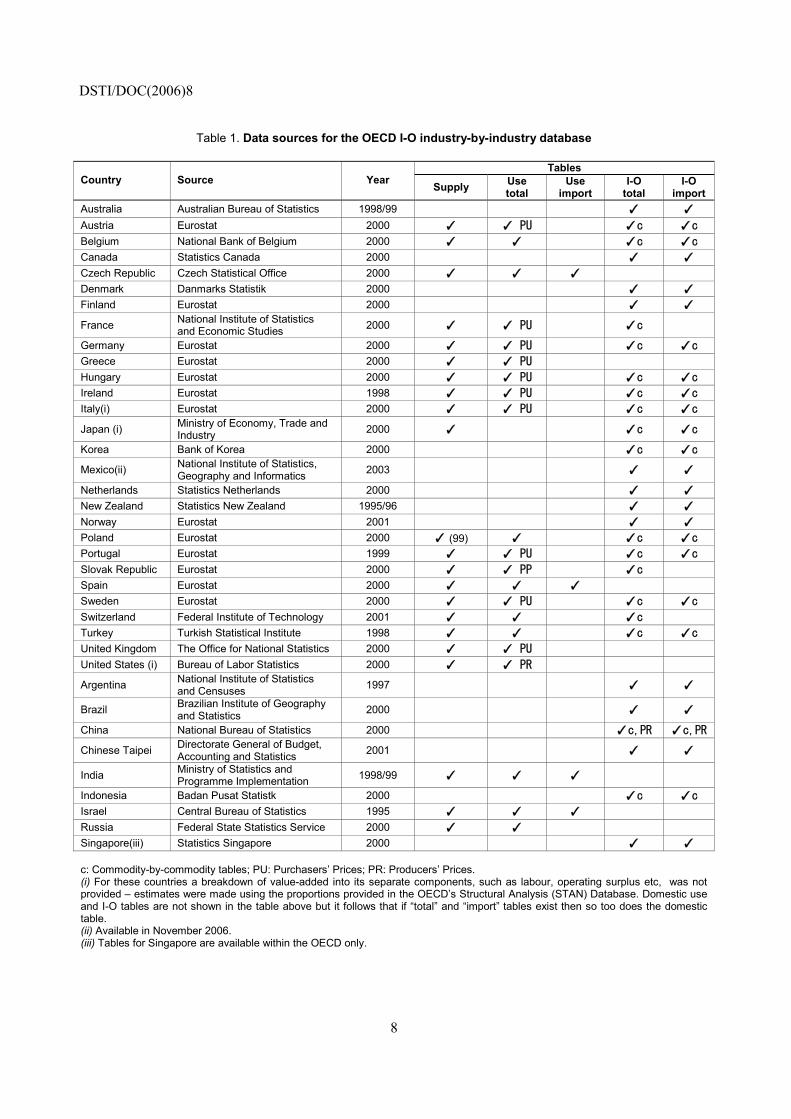
The process of compiling the database begins with requests to national statistical institutes (NSIs) to provide data in accordance with a harmonised industry structure based on the International Standard Industrial Classification of all Economic Activities (ISIC). ISIC Revision 3 provides the basis for the 2006 edition as was the case for the 2002 edition (the 1995 edition was compiled on the basis of ISIC Revision 2). However in order to minimise compliance costs, and to maximise co-operation, the requests stipulate that this pro-forma is not a pre-requisite, and that any relevant data (input-output and/or supply-use tables) at the most detailed and practicable level are welcomed in any (detailed) format. As shown in the table below most countries have chosen to deliver data using their own industrial classification systems and standard presentation in response to the latest request. The request for supply-use tables, in addition to input-output tables, is partly in recognition of the increasing importance of supply-use tables to NSIs within their national accounts frameworks, and, as a consequence, their availability. However it mainly reflects the fact that a number of countries do not produce input-output tables but do produce supply-use tables which can be easily converted into input-output tables using some standard assumptions � see Section 7. Table 1 summarises the information received for each country�s latest table in the OECD database.
5. See Pilat (2006).
6. See Wixted, Yamano and Webb (2006), for a discussion on various analytical uses of input-output tables.
DSTI/DOC(2006)8
8
Table 1. Data sources for the OECD I-O industry-by-industry database
Tables Country Source Year Supply Use
total Use
import I-O
total I-O
import Australia Australian Bureau of Statistics 1998/99 ✓ ✓ Austria Eurostat 2000 ✓ ✓ PU ✓c ✓c Belgium National Bank of Belgium 2000 ✓ ✓ ✓c ✓c Canada Statistics Canada 2000 ✓ ✓ Czech Republic Czech Statistical Office 2000 ✓ ✓ ✓ Denmark Danmarks Statistik 2000 ✓ ✓ Finland Eurostat 2000 ✓ ✓ France National Institute of Statistics
and Economic Studies 2000 ✓ ✓ PU ✓c
Germany Eurostat 2000 ✓ ✓ PU ✓c ✓c Greece Eurostat 2000 ✓ ✓ PU Hungary Eurostat 2000 ✓ ✓ PU ✓c ✓c Ireland Eurostat 1998 ✓ ✓ PU ✓c ✓c Italy(i) Eurostat 2000 ✓ ✓ PU ✓c ✓c Japan (i) Ministry of Economy, Trade and
Industry 2000 ✓ ✓c ✓c Korea Bank of Korea 2000 ✓c ✓c Mexico(ii) National Institute of Statistics,
Geography and Informatics 2003 ✓ ✓ Netherlands Statistics Netherlands 2000 ✓ ✓ New Zealand Statistics New Zealand 1995/96 ✓ ✓ Norway Eurostat 2001 ✓ ✓ Poland Eurostat 2000 ✓ (99) ✓ ✓c ✓c Portugal Eurostat 1999 ✓ ✓ PU ✓c ✓c Slovak Republic Eurostat 2000 ✓ ✓ PP ✓c Spain Eurostat 2000 ✓ ✓ ✓ Sweden Eurostat 2000 ✓ ✓ PU ✓c ✓c Switzerland Federal Institute of Technology 2001 ✓ ✓ ✓c Turkey Turkish Statistical Institute 1998 ✓ ✓ ✓c ✓c United Kingdom The Office for National Statistics 2000 ✓ ✓ PU United States (i) Bureau of Labor Statistics 2000 ✓ ✓ PR
Argentina National Institute of Statistics and Censuses 1997 ✓ ✓
Brazil Brazilian Institute of Geography and Statistics 2000 ✓ ✓
China National Bureau of Statistics 2000 ✓c,PR ✓c,PR Chinese Taipei Directorate General of Budget,
Accounting and Statistics 2001 ✓ ✓
India Ministry of Statistics and Programme Implementation 1998/99 ✓ ✓ ✓
Indonesia Badan Pusat Statistk 2000 ✓c ✓c Israel Central Bureau of Statistics 1995 ✓ ✓ ✓ Russia Federal State Statistics Service 2000 ✓ ✓ Singapore(iii) Statistics Singapore 2000 ✓ ✓ c: Commodity-by-commodity tables; PU: Purchasers� Prices; PR: Producers� Prices. (i) For these countries a breakdown of value-added into its separate components, such as labour, operating surplus etc, was not provided � estimates were made using the proportions provided in the OECD�s Structural Analysis (STAN) Database. Domestic use and I-O tables are not shown in the table above but it follows that if �total� and �import� tables exist then so too does the domestic table. (ii) Available in November 2006. (iii) Tables for Singapore are available within the OECD only.
DSTI/DOC(2006)8
9
This, of course, is only the first part of the process. Each of the submissions, and those received in earlier years, need to be converted onto a harmonised basis � harmonised in the sense that they are: industry-by-industry; on the same price basis (basic prices); aligned to the industry classifications used in the OECD system; and aligned in their treatment of concepts. This process of conversion is explained in more detail in the following sections, including other adjustments needed to overcome differences in some concepts, most notably the treatment of financial intermediation services indirectly measured (FISIM) and differences in the treatment of other items such as non-residents� expenditure and residents� expenditure abroad.
4. The database
4.1 Coverage � country and time
The 2002 edition of the OECD Input-Output Database saw the number of countries covered increase from 10 (OECD) to 20 (18 OECD and 2 non-OECD) compared to the 1995 edition. The 2006 edition has continued this expansion and includes 37 countries (28 OECD and 9 non-OECD) further strengthening the ability of the database to allow the analysis of global issues. The effects of globalisation and increased foreign outsourcing of manufacturing goods and services for example cannot be fully analysed if some of the larger OECD countries such as Mexico and emerging non-member economies such as India, Indonesia and Russia are not included. These countries have been included for the first time � as have Austria, Belgium, Ireland, Portugal, New Zealand, Slovak Republic, Sweden, Switzerland, Turkey, Argentina, Chinese Taipei, Israel, Singapore (although tables for India, New Zealand, Russia and Sweden were available for OECD internal use in the 2002 edition).
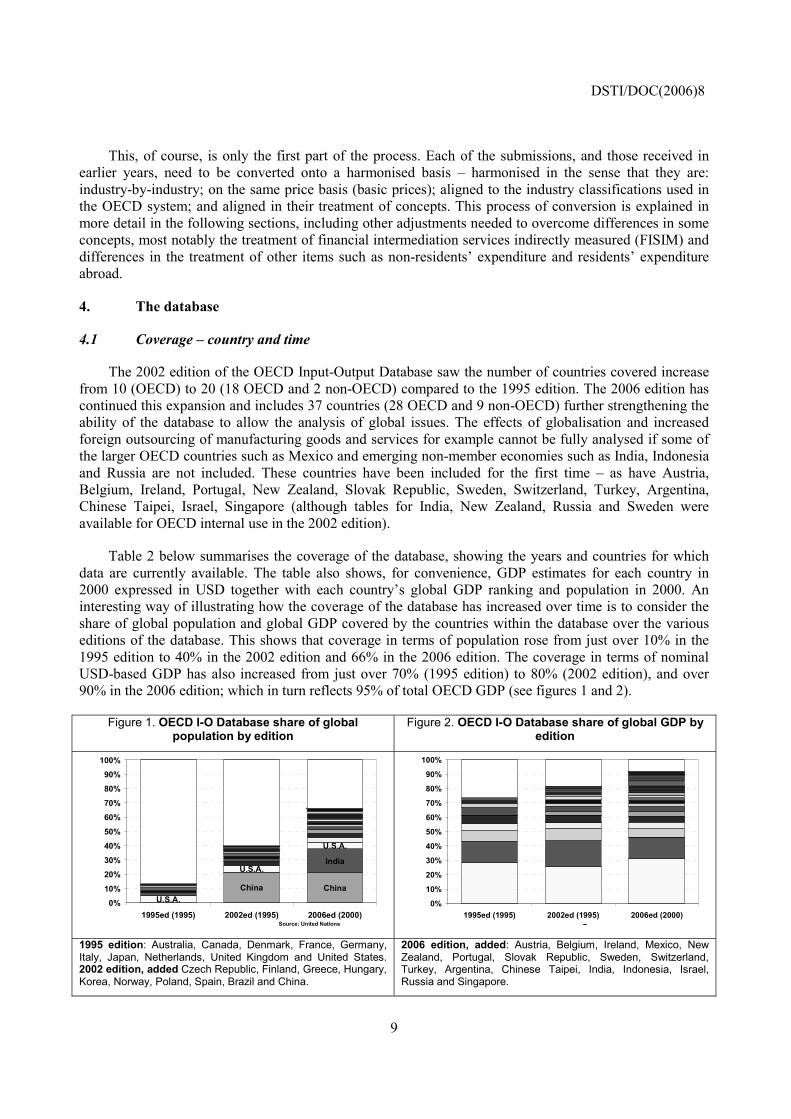
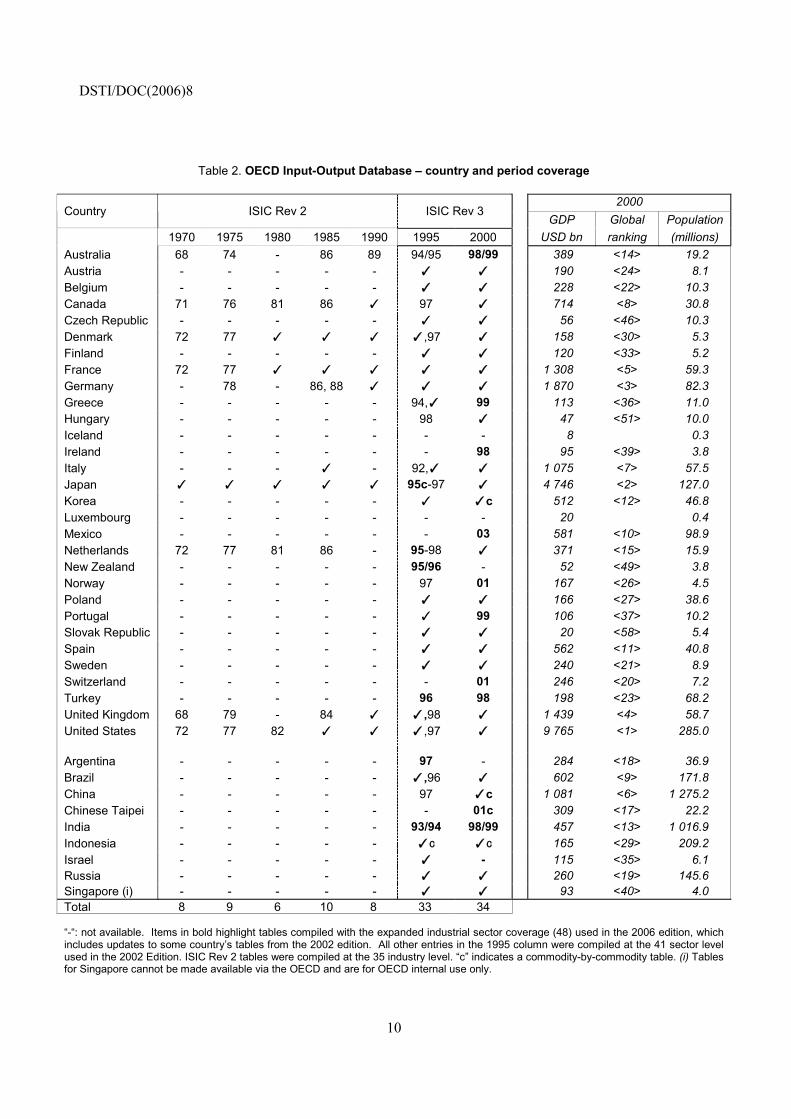
Table 2 below summarises the coverage of the database, showing the years and countries for which data are currently available. The table also shows, for convenience, GDP estimates for each country in 2000 expressed in USD together with each country�s global GDP ranking and population in 2000. An interesting way of illustrating how the coverage of the database has increased over time is to consider the share of global population and global GDP covered by the countries within the database over the various editions of the database. This shows that coverage in terms of population rose from just over 10% in the 1995 edition to 40% in the 2002 edition and 66% in the 2006 edition. The coverage in terms of nominal USD-based GDP has also increased from just over 70% (1995 edition) to 80% (2002 edition), and over 90% in the 2006 edition; which in turn reflects 95% of total OECD GDP (see figures 1 and 2).
Figure 1. OECD I-O Database share of global population by edition
Figure 2. OECD I-O Database share of global GDP by edition
China China
India
U.S.A.
U.S.A.
U.S.A.
0%10%
20%30%
40%50%
60%70%
80%90%
100%
1995ed (1995) 2002ed (1995) 2006ed (2000)Source: United Nations
0%
10%
20%
30%
40%
50%
60%
70%
80%
90%
100%
1995ed (1995) 2002ed (1995) 2006ed (2000)S
1995 edition: Australia, Canada, Denmark, France, Germany, Italy, Japan, Netherlands, United Kingdom and United States. 2002 edition, added Czech Republic, Finland, Greece, Hungary, Korea, Norway, Poland, Spain, Brazil and China.
2006 edition, added: Austria, Belgium, Ireland, Mexico, New Zealand, Portugal, Slovak Republic, Sweden, Switzerland, Turkey, Argentina, Chinese Taipei, India, Indonesia, Israel, Russia and Singapore.
DSTI/DOC(2006)8
10
Table 2. OECD Input-Output Database � country and period coverage
2000 Country ISIC Rev 2 ISIC Rev 3 GDP Global Population
1970 1975 1980 1985 1990 1995 2000 USD bn ranking (millions) Australia 68 74 - 86 89 94/95 98/99 389 <14> 19.2 Austria - - - - - ✓ ✓ 190 <24> 8.1 Belgium - - - - - ✓ ✓ 228 <22> 10.3 Canada 71 76 81 86 ✓ 97 ✓ 714 <8> 30.8 Czech Republic - - - - - ✓ ✓ 56 <46> 10.3 Denmark 72 77 ✓ ✓ ✓ ✓,97 ✓ 158 <30> 5.3 Finland - - - - - ✓ ✓ 120 <33> 5.2 France 72 77 ✓ ✓ ✓ ✓ ✓ 1 308 <5> 59.3 Germany - 78 - 86, 88 ✓ ✓ ✓ 1 870 <3> 82.3 Greece - - - - - 94,✓ 99 113 <36> 11.0 Hungary - - - - - 98 ✓ 47 <51> 10.0 Iceland - - - - - - - 8 0.3 Ireland - - - - - - 98 95 <39> 3.8 Italy - - - ✓ - 92,✓ ✓ 1 075 <7> 57.5 Japan ✓ ✓ ✓ ✓ ✓ 95c-97 ✓ 4 746 <2> 127.0 Korea - - - - - ✓ ✓c 512 <12> 46.8 Luxembourg - - - - - - - 20 0.4 Mexico - - - - - - 03 581 <10> 98.9 Netherlands 72 77 81 86 - 95-98 ✓ 371 <15> 15.9 New Zealand - - - - - 95/96 - 52 <49> 3.8 Norway - - - - - 97 01 167 <26> 4.5 Poland - - - - - ✓ ✓ 166 <27> 38.6 Portugal - - - - - ✓ 99 106 <37> 10.2 Slovak Republic - - - - - ✓ ✓ 20 <58> 5.4 Spain - - - - - ✓ ✓ 562 <11> 40.8 Sweden - - - - - ✓ ✓ 240 <21> 8.9 Switzerland - - - - - - 01 246 <20> 7.2 Turkey - - - - - 96 98 198 <23> 68.2 United Kingdom 68 79 - 84 ✓ ✓,98 ✓ 1 439 <4> 58.7 United States 72 77 82 ✓ ✓ ✓,97 ✓ 9 765 <1> 285.0 Argentina - - - - - 97 - 284 <18> 36.9 Brazil - - - - - ✓,96 ✓ 602 <9> 171.8 China - - - - - 97 ✓c 1 081 <6> 1 275.2 Chinese Taipei - - - - - - 01c 309 <17> 22.2 India - - - - - 93/94 98/99 457 <13> 1 016.9 Indonesia - - - - - ✓c ✓c 165 <29> 209.2 Israel - - - - - ✓ - 115 <35> 6.1 Russia - - - - - ✓ ✓ 260 <19> 145.6 Singapore (i) - - - - - ✓ ✓ 93 <40> 4.0 Total 8 9 6 10 8 33 34 �-�: not available. Items in bold highlight tables compiled with the expanded industrial sector coverage (48) used in the 2006 edition, which includes updates to some country�s tables from the 2002 edition. All other entries in the 1995 column were compiled at the 41 sector level used in the 2002 Edition. ISIC Rev 2 tables were compiled at the 35 industry level. �c� indicates a commodity-by-commodity table. (i) Tables for Singapore cannot be made available via the OECD and are for OECD internal use only.
DSTI/DOC(2006)8
11
4.2 Coverage � industries
The industry classification of the database (2006 and 2002 editions) is based on the ISIC Rev. 3 system, meaning that it is compatible with the OECD�s structural analysis (STAN) industry database7 and Bilateral Trade Database (BTD), IEA�s energy consumption data, and other OECD industry-level databases.8 The 1995 edition was based on the earlier ISIC Revision 2 system, which is broadly comparable to ISIC Revision 3 at the industry level presented.
The number of industries in the 2006 edition has been expanded to 48, 6 more than in the 2002 edition and 13 more than the 1995 edition. A full listing of the 48 industries is provided in Table 3. Comparing the 2006 and 2002 editions, more detailed industry information is available in the following areas:
a) Mining and quarrying (ISIC 10-14) has been split into two sectors: Energy Mining (ISIC 10+11+12) and Non-energy Mining (ISIC 13+14).
b) Electricity, gas and water supply (ISIC 40+41) has been split into 4 sectors: Production, collection and distribution of electricity (ISIC 401); Manufacture of gas, distribution of gaseous fuels through mains (ISIC 402); Steam and hot water supply (ISIC 403); and Collection, purification and distribution of water (ISIC 41).
c) Transport and storage (ISIC 60-63) has been split into 4 sectors: Land transport; Transport via pipelines (ISIC 60); Water transport (ISIC 61); Air transport (ISIC 62); and Supporting and auxiliary transport activities, activities of travel agencies (ISIC 63).
Unfortunately, information on all 48 industrial sectors could not be obtained for every country, reflecting a number of factors that vary by country � these include disclosure restrictions and a lack of detailed statistical sources, but in the main this reflects the loss of industry detail that can occur when moving from a national classification system to ISIC Rev.3. Table 4 illustrates this by describing, for each country, those sectors where imperfect concordances exist between national input output industries, and the requisite ISIC Rev. 3 industries. The table shows for each country, instances where certain activities are included in other I-O industries or missing from others. The concordance relationships used in earlier years typically differ and are described in the relevant notes at www.oecd.org/dataoecd/20/37/34085996.pdf.
7. www.oecd.org/sti/stan.
8. Go to http:/unstats.un.org/unsd/cr/registry/regcst.asp?Cl=2 for a full description of ISIC Rev.3.

DSTI/DOC(2006)8
12
Table 3. OECD I-O Database � Industry classification and concordance with ISIC Rev. 3, 2006 edition
ISIC Rev. 3 code IO industry Description
1+2+5 1 Agriculture, hunting, forestry and fishing 10+11+12 2 Mining and quarrying (energy)
13+14 3 Mining and quarrying (non-energy) 15+16 4 Food products, beverages and tobacco
17+18+19 5 Textiles, textile products, leather and footwear 20 6 Wood and products of wood and cork
21+22 7 Pulp, paper, paper products, printing and publishing 23 8 Coke, refined petroleum products and nuclear fuel
24ex2423 9 Chemicals excluding pharmaceuticals 2423 10 Pharmaceuticals 25 11 Rubber and plastics products 26 12 Other non-metallic mineral products
271+2731 13 Iron & steel 272+2732 14 Non-ferrous metals
28 15 Fabricated metal products, except machinery and equipment 29 16 Machinery and equipment, nec 30 17 Office, accounting and computing machinery 31 18 Electrical machinery and apparatus, nec 32 19 Radio, television and communication equipment 33 20 Medical, precision and optical instruments 34 21 Motor vehicles, trailers and semi-trailers
351 22 Building & repairing of ships and boats 353 23 Aircraft and spacecraft
352+359 24 Railroad equipment and transport equipment n.e.c. 36+37 25 Manufacturing nec; recycling (include Furniture)
401 26 Production, collection and distribution of electricity 402 27 Manufacture of gas; distribution of gaseous fuels through mains 403 28 Steam and hot water supply 41 29 Collection, purification and distribution of water 45 30 Construction
50+51+52 31 Wholesale and retail trade; repairs 55 32 Hotels and restaurants 60 33 Land transport; transport via pipelines 61 34 Water transport 62 35 Air transport 63 36 Supporting & auxiliary transport activities; activities of travel agencies 64 37 Post and telecommunications
65+66+67 38 Finance and insurance 70 39 Real estate activities 71 40 Renting of machinery and equipment 72 41 Computer and related activities 73 42 Research and development 74 43 Other Business Activities 75 44 Public administration and defence; compulsory social security 80 45 Education 85 46 Health and social work
90-93 47 Other community, social and personal services 95+99 48 Private households with employed persons & extra-territorial organisations & bodies

DSTI/DOC(2006)8
13
Table 4. Concordance with OECD I-O (48) industry and sector (in the latest year) by country
Country Industries with imperfect concordances
17 includes Radio, television & communication equipment
29 includes Steam and hot water supply and Sewage and refuse disposal, sanitation and similar activities
39 includes Renting of machinery & equipment
41 includes Research & development
Australia
44 includes extra-territorial organisations & bodies
29 includes Steam and hot water supply
31 includes part of 7250, 3220, 2919 and 3610
43 includes Research and Development (73) Canada
SBFD and Discrepancy includes Confidential values and rounding error
Denmark 23 includes Railroad equipment & transport equip nec
9 includes Pharmaceuticals (2423)
Iron & Steel (271+2731) and Non-ferrous metals (272+2732) are not separated
22 includes non motor vehicle transport equipment (351,353, 352 and 359)
Austria, Belgium, Czech Rep., Finland, France, Germany, Greece, Italy, Netherlands, Norway, Portugal, Sweden, & United Kingdom
26 is Electricity, gas, steam and hot water supply (40)
9 includes Pharmaceuticals (2423)
13 includes Non-ferrous metals (272+2732)
22 includes non motor vehicle transport equipment (351,353, 352 and 359)
26 is Electricity, gas, steam and hot water supply (40)
Hungary, Slovak Republic
48 is not available
9 includes Pharmaceuticals (2423)
Iron & Steel (271+2731) and Non-ferrous metals (272+2732) are not separated
22 includes non motor vehicle transport equipment (351,353, 352 and 359)
25 includes Coke, refined petroleum products and nuclear fuel (23)
Ireland
26 is Electricity, gas, steam and hot water supply (40)
48 includes �other adjustments� such as sales by final demand and purchased by non-residents Korea
Non-comparable imports (cif/fob adj, Direct purchases abroad by residents) is not available
Mexico 27 includes Steam and hot water supply (403)
13 includes Non-ferrous metals (272+2732) 18 includes Office, accounting and computing machinery (30) and Radio, television and communication equipment (32) 24 includes Aircraft and spacecraft (353)
29 includes Steam and hot water supply (403)
New Zealand
35 includes Supporting and auxiliary transport activities (63)
2 includes Non energy mining (13, 14)
9 includes Pharmaceuticals
13 includes Non-ferrous metals (272+2732).
22 includes Aircraft & spacecraft and Railroad equipment & transport equip nec
26 includes Manufacture of gas and Steam and hot water supply
Poland
34 includes Air transport (62)
Figures 1-48 reflect input-output industries. Figures in brackets () indicate ISIC Rev.3 division and group codes.

DSTI/DOC(2006)8
14
Table 4 (continued)
Country Industries with imperfect concordances
9 includes Pharmaceuticals (2423)
13 includes Non-ferrous metals (272+2732)
22 is non motor vehicle transport equipment (351,353, 352 and 359) Spain
27 includes Steam and hot water supply (403)
2 includes mining and quarrying of non-energy (13-14)
9 includes Coke, refined petroleum products and nuclear fuel (23) and pharmaceuticals (2423)
13 includes Non-ferrous metals (272+2732)
17 includes Electrical machinery & apparatus, nec
21 includes Aircraft and spacecraft, railroad equipment and transport equipment nec
26 includes Manufacture of gas and Steam and hot water supply
33 includes All transport services
Switzerland
40 includes Other business activities (74)
13 includes Non-ferrous casting (2732)
Non-ferrous casting (2732) is excluded in 14 Turkey
Steam and hot water supply is not available
USA 29 includes Steam and hot water supply (403)
22 includes Aircraft, spacecraft and locomotives
24 excludes locomotives
29 includes Steam and hot water supply Argentina
43 includes Renting of machinery & equipment, Computer & related activities, and Research & development
29 includes Steam and hot water supply (403) Brazil
43 includes Research and development (73)
24 includes Aircraft & spacecraft
26 includes Manufacture of gas and Steam and hot water supply
33 includes All transport services 43 includes Renting of machinery & equipment, Computer & related activities and Other community, social & personal services 45 includes Research & development
China
48 is unclassified
25 includes Medical, precision & optical instruments and Aircraft & spacecraft
29 includes Steam and hot water supply
39 includes Renting of machinery & equipment
45 includes Research & development
India
47 includes Private households with employed persons
22 includes non motor vehicle transport equipment (351, 353, 352 and 359)
26 includes Manufacture of gas and Steam and hot water supply Israel
41 includes Research & development
Russia Sector classification is not harmonised with ISIC classification system
2, 3, 42 and 48 are not available
24 includes motor vehicles Singapore
29 includes Steam and hot water supply Figures 1-48 reflect input-output industries. Figures in brackets () indicate ISIC Rev.3 division and group codes.
DSTI/DOC(2006)8
15
5. Price basis
In line with the 1993 System of National Accounts (SNA93), the OECD Input-Output Database (2002 and 2006 editions) shows transactions, wherever possible, at basic prices.9 Most European countries follow the basic price valuation system in producing symmetric input-output tables. However, supply-use tables, which are the core building blocks used by the OECD to produce industry-by-industry input-output tables, typically show intermediate and final demand transactions in purchasers� prices. The process of converting these into basic prices is described in Section 7.
6. Format of the tables
6.1 Value added components
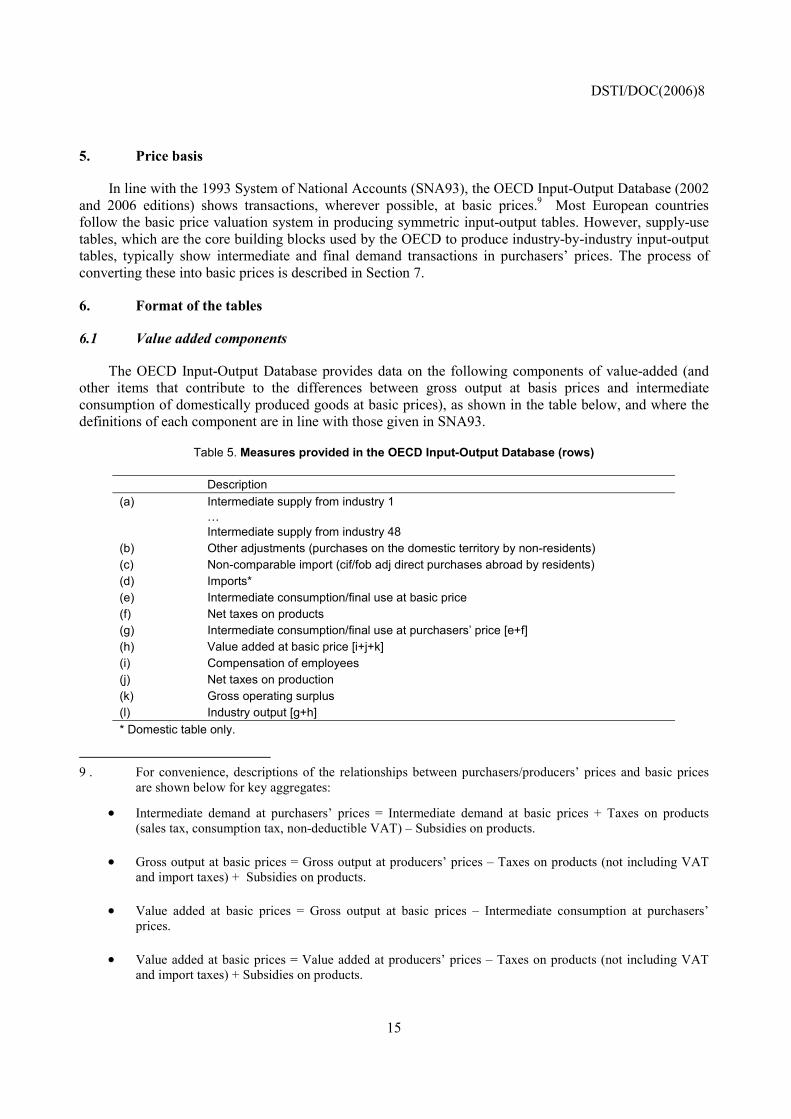
The OECD Input-Output Database provides data on the following components of value-added (and other items that contribute to the differences between gross output at basis prices and intermediate consumption of domestically produced goods at basic prices), as shown in the table below, and where the definitions of each component are in line with those given in SNA93.
Table 5. Measures provided in the OECD Input-Output Database (rows)
Description (a) Intermediate supply from industry 1
� Intermediate supply from industry 48
(b) Other adjustments (purchases on the domestic territory by non-residents) (c) Non-comparable import (cif/fob adj direct purchases abroad by residents) (d) Imports* (e) Intermediate consumption/final use at basic price (f) Net taxes on products (g) Intermediate consumption/final use at purchasers� price [e+f] (h) Value added at basic price [i+j+k] (i) Compensation of employees (j) Net taxes on production (k) Gross operating surplus (l) Industry output [g+h] * Domestic table only.
9 . For convenience, descriptions of the relationships between purchasers/producers� prices and basic prices
are shown below for key aggregates:
• Intermediate demand at purchasers� prices = Intermediate demand at basic prices + Taxes on products (sales tax, consumption tax, non-deductible VAT) � Subsidies on products.
• Gross output at basic prices = Gross output at producers� prices � Taxes on products (not including VAT and import taxes) + Subsidies on products.
• Value added at basic prices = Gross output at basic prices � Intermediate consumption at purchasers� prices.
• Value added at basic prices = Value added at producers� prices � Taxes on products (not including VAT and import taxes) + Subsidies on products.

DSTI/DOC(2006)8
16
6.2 Final demand components
Table 6 below describes the final demand components shown in the database. However, not all countries are able to provide such a breakdown. Indeed only 10 countries report �valuables� separately, which is instead (typically) included within changes in inventories, and 20 countries, NPISH, which is included within HHFC. As was the case for the components of value-added, the definitions of each item of final demand are consistent with SNA93.
Table 6. Measures provided in the OECD Input-Output Database (columns)
Description (a) Intermediate demand of industry 1
� Intermediate demand of industry 48
(b) Total intermediate consumption (c) Final consumption expenditure by households [HHFC] (d) Final consumption expenditure by non-profit org. serving households [NPISH] (e) Final consumption expenditure by government (f) Gross fixed capital formation [GFCF] (g) Changes in inventories (h) Valuables (i) Exports (j) Imports (less) (k) Discrepancy
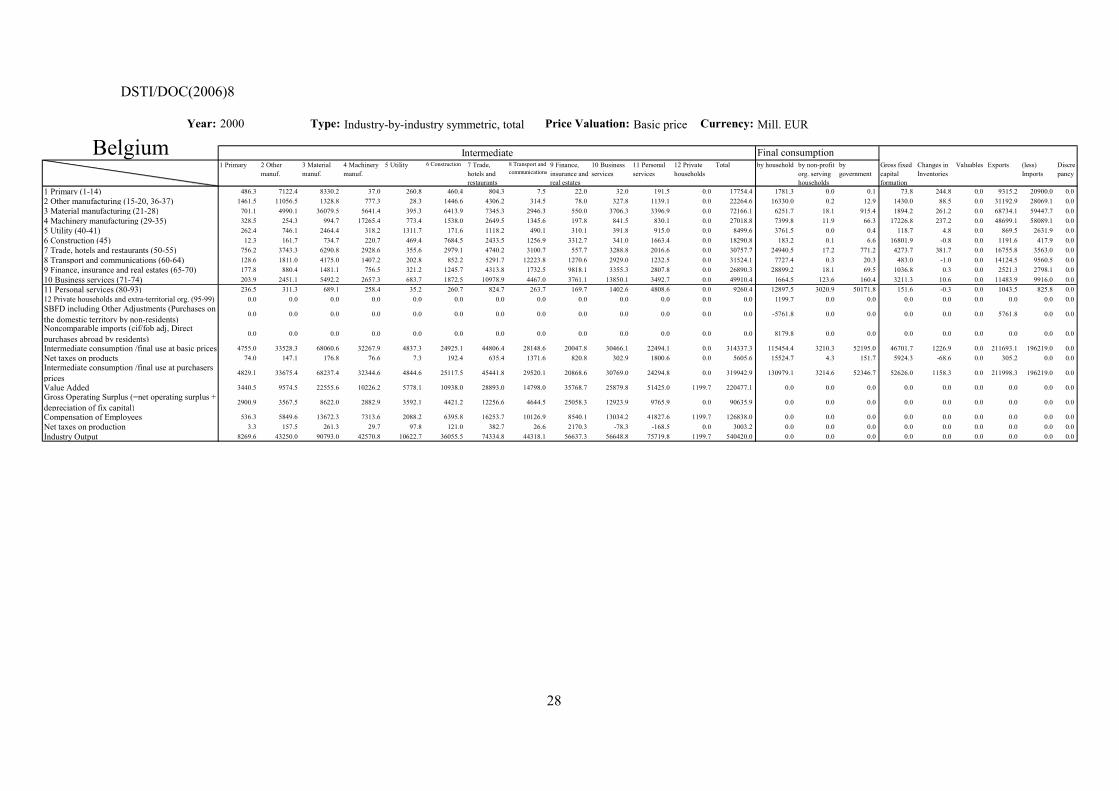
In summary, the 2006 edition of the OECD Input-Output tables follows the format of earlier editions, with the exception that the industry set has expanded since the 2002 edition. Annex II presents total economy (domestic + import) symmetric input-output tables at an aggregate industry level for each country.

DSTI/DOC(2006)8
17
Box 1. Structure of supply, use and symmetric tables
A. Supply table with basic prices conversion
Commodity
0
Taxes less subsidies
Transport m
argin
Total supply, purchaser prices (d)
Industry Output (e)
Industry
Dom
estic O
utput (a)
Imports (b)
Total supply, basic prices
(c)
B. Use at purchasers prices (total) C. Use at basic prices (total)
CommodityTotal use, purchaser prices (d)
Intermediate use Final use
Industry Consum
ption
Gross fixed capital
Exports
Value added (f)Industry Output (e)
Commodity
Value added (f)
Taxes less subsidiesFinal use
Industry Output (e)
Gross fixed capital
Exports
Total use, basic prices
(d)
Intermediate use
Industry Consum
ption
D. Use at basic prices (domestic) E. Symmetric/Use at basic prices (import)
Commodity
Imports
Gross fixed capital
Exports
Total use, basic prices
(a)
Taxes less subsidiesIntermediate use Final use
Industry Consum
ption
Commodity
Total use, basic prices
(b)
Imports
Exports
Commodity Consum
ption
Gross fixed capital
Taxes less subsidies
F. Symmetric (domestic, ind x ind) G. Symmetric (total, ind x ind)
Industry
Industry Ouput (e)
Final use total
Industry Consum
ption
Gross fixed capital
Exports
Value added (f)
Taxes less subsidiesImports
Intermediate use total
Industry
Industry Consum
ption
Intermediate use totalValue added (f)
Industry Ouput (e)
Gross fixed capital
Exports
Imports (b)
Taxes less subsidiesFinal use total
7. Transformation to the harmonised industry-by-industry tables
Table 1 showed that the type of data received from each country varies considerably. Some countries have been able to provide symmetric I-O tables at basic prices at the required 48 industry level, whereas others have only been able to provide supply-use tables at purchaser�s prices for example, using the industrial classification and industry detail usually presented in that country. Naturally this means that for many countries the data provided needs to be transformed or manipulated into the harmonised symmetric 48 industry-by-industry basis.
DSTI/DOC(2006)8
18
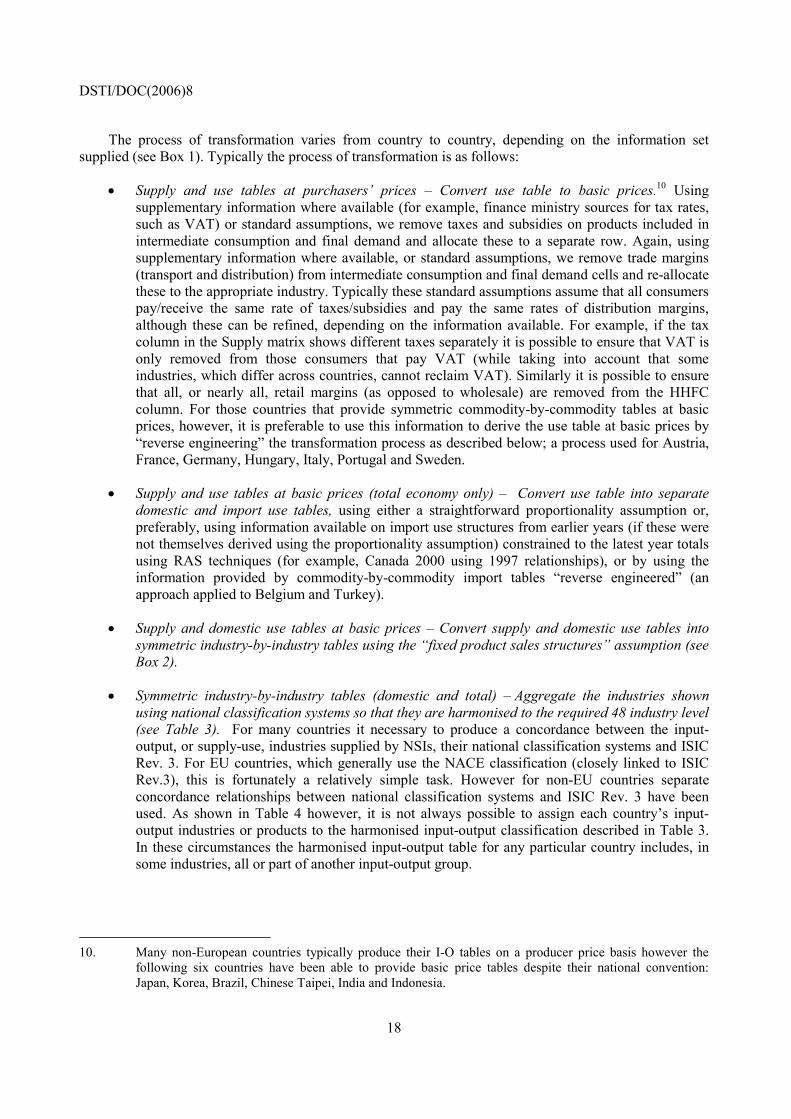
The process of transformation varies from country to country, depending on the information set supplied (see Box 1). Typically the process of transformation is as follows:
• Supply and use tables at purchasers� prices � Convert use table to basic prices.10 Using supplementary information where available (for example, finance ministry sources for tax rates, such as VAT) or standard assumptions, we remove taxes and subsidies on products included in intermediate consumption and final demand and allocate these to a separate row. Again, using supplementary information where available, or standard assumptions, we remove trade margins (transport and distribution) from intermediate consumption and final demand cells and re-allocate these to the appropriate industry. Typically these standard assumptions assume that all consumers pay/receive the same rate of taxes/subsidies and pay the same rates of distribution margins, although these can be refined, depending on the information available. For example, if the tax column in the Supply matrix shows different taxes separately it is possible to ensure that VAT is only removed from those consumers that pay VAT (while taking into account that some industries, which differ across countries, cannot reclaim VAT). Similarly it is possible to ensure that all, or nearly all, retail margins (as opposed to wholesale) are removed from the HHFC column. For those countries that provide symmetric commodity-by-commodity tables at basic prices, however, it is preferable to use this information to derive the use table at basic prices by �reverse engineering� the transformation process as described below; a process used for Austria, France, Germany, Hungary, Italy, Portugal and Sweden.
• Supply and use tables at basic prices (total economy only) � Convert use table into separate domestic and import use tables, using either a straightforward proportionality assumption or, preferably, using information available on import use structures from earlier years (if these were not themselves derived using the proportionality assumption) constrained to the latest year totals using RAS techniques (for example, Canada 2000 using 1997 relationships), or by using the information provided by commodity-by-commodity import tables �reverse engineered� (an approach applied to Belgium and Turkey).
• Supply and domestic use tables at basic prices � Convert supply and domestic use tables into symmetric industry-by-industry tables using the �fixed product sales structures� assumption (see Box 2).
• Symmetric industry-by-industry tables (domestic and total) � Aggregate the industries shown using national classification systems so that they are harmonised to the required 48 industry level (see Table 3). For many countries it necessary to produce a concordance between the input-output, or supply-use, industries supplied by NSIs, their national classification systems and ISIC Rev. 3. For EU countries, which generally use the NACE classification (closely linked to ISIC Rev.3), this is fortunately a relatively simple task. However for non-EU countries separate concordance relationships between national classification systems and ISIC Rev. 3 have been used. As shown in Table 4 however, it is not always possible to assign each country�s input-output industries or products to the harmonised input-output classification described in Table 3. In these circumstances the harmonised input-output table for any particular country includes, in some industries, all or part of another input-output group.
10. Many non-European countries typically produce their I-O tables on a producer price basis however the
following six countries have been able to provide basic price tables despite their national convention: Japan, Korea, Brazil, Chinese Taipei, India and Indonesia.
DSTI/DOC(2006)8
19
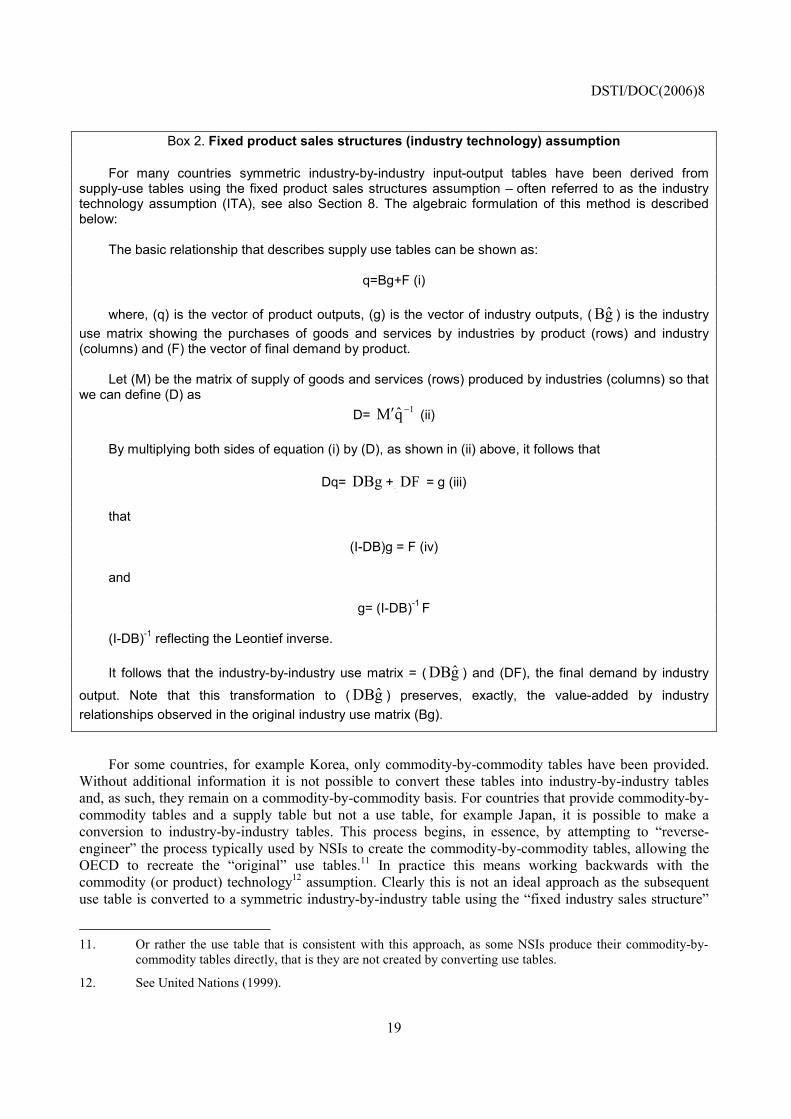
Box 2. Fixed product sales structures (industry technology) assumption For many countries symmetric industry-by-industry input-output tables have been derived from supply-use tables using the fixed product sales structures assumption � often referred to as the industry technology assumption (ITA), see also Section 8. The algebraic formulation of this method is described below: The basic relationship that describes supply use tables can be shown as:
q=Bg+F (i)
where, (q) is the vector of product outputs, (g) is the vector of industry outputs, ( g�B ) is the industry use matrix showing the purchases of goods and services by industries by product (rows) and industry (columns) and (F) the vector of final demand by product. Let (M) be the matrix of supply of goods and services (rows) produced by industries (columns) so that we can define (D) as
D= 1q�M −′ (ii)
By multiplying both sides of equation (i) by (D), as shown in (ii) above, it follows that
Dq= DBg +FDD D
g�DFD
DF = g (iii)
that
(I-DB)g = F (iv)
and
g= (I-DB)-1 F
(I-DB)-1 reflecting the Leontief inverse. It follows that the industry-by-industry use matrix = ( g�DB ) and (DF), the final demand by industry
output. Note that this transformation to ( g�DB ) preserves, exactly, the value-added by industry relationships observed in the original industry use matrix (Bg).
For some countries, for example Korea, only commodity-by-commodity tables have been provided. Without additional information it is not possible to convert these tables into industry-by-industry tables and, as such, they remain on a commodity-by-commodity basis. For countries that provide commodity-by-commodity tables and a supply table but not a use table, for example Japan, it is possible to make a conversion to industry-by-industry tables. This process begins, in essence, by attempting to �reverse-engineer� the process typically used by NSIs to create the commodity-by-commodity tables, allowing the OECD to recreate the �original� use tables.11 In practice this means working backwards with the commodity (or product) technology12 assumption. Clearly this is not an ideal approach as the subsequent use table is converted to a symmetric industry-by-industry table using the �fixed industry sales structure�
11. Or rather the use table that is consistent with this approach, as some NSIs produce their commodity-by-
commodity tables directly, that is they are not created by converting use tables.
12. See United Nations (1999).

DSTI/DOC(2006)8
20
(industry, as opposed to product, technology) assumption. However, in practice, the Leontief coefficients subsequently produced stand up to scrutiny. It might be preferable to reverse-engineer the process using the industry technology (or fixed product sales structures) assumption from the start but in some cases this leads to negative figures in the use table. As such, and partly because the method returns similar results where negatives do not occur, the standard approach is to reverse-engineer commodity-by-commodity tables using the product technology assumption.
Other adjustments are however needed in addition to the transformations referred to above. The following paragraphs describe the main adjustments made by the OECD Secretariat to arrive at harmonised tables.
FISIM adjustment
The allocation of financial intermediation services indirectly measured (FISIM) is treated differently across countries. For their most recent tables Australia, Japan, Canada, China, India, Indonesia, Chinese Taipei and the United States allocate imputed bank service charges directly to purchasing sectors, including, in some cases, households. EU countries have recently begun to adopt this process in their national accounts but the input-output tables received by the OECD do not yet reflect these changes � FISIM is instead shown as a separate column in their national input-output and supply-use tables; or as intermediate consumption of the finance industry (ISIC 65) with a corresponding deduction from gross operating surplus and value-added of the same industry.
For analytical purposes, and harmonisation, FISIM in the OECD database has been allocated separately to consuming industries as intermediate consumption of financial services, on the basis of each industry�s share of total gross value-added for all countries (except those where FISIM has already been allocated), but not including the household and government sector. Value added in each industry is reduced by a corresponding amount. This treatment is consistent with the approach used in the 2002 edition of the I-O Database. SNA93, of course, recommends that FISIM should be allocated to all consumers; including final demand; however the information to do this is not readily available, in any case, doing so would lead to estimates of GDP and gross value-added that differed from those published by NSIs.
Disclosed cells and rounding errors
In some countries some data are suppressed by NSIs to preserve confidentiality. There are also some rounding errors which need to be corrected. Where this occurs, the OECD Secretariat has estimated these missing values and corrected for rounding errors using the bi-proportional algorithm (RAS). The bi-proportional adjustment was performed for example on the supply tables of the United Kingdom and the total, domestic and import tables of New Zealand.
c.i.f/f.o.b adjustments
For some countries specific adjustments are required to deal with valuation differences in imports. In the United States, France and Brazil for example imports of goods are valued at c.i.f prices (i.e. including cost, insurance and freight), as they should be, but with negative adjustments made to the imports of insurance and freight services (water transport only for France and transport more generally for Brazil) to correct for these services provided by resident producers (whose value is reflected in the c.i.f price of the imported product). Applying the proportionality method in this case to derive the import use matrix can lead to negative imports of these services however and so instead these negative values are removed from exports.

DSTI/DOC(2006)8
21
Summary of conversion methods for recent years
The following estimation methodologies have been applied for countries as follows:
• Symmetric industry-by-industry tables have been provided by the following 11 countries in the latest year: Australia, Canada, Denmark, Finland, Mexico, the Netherlands, New Zealand, Norway, Argentina, Brazil and Singapore.
• Supply and use tables have been provided by the following 21 countries, in the latest year, and the symmetric industry-by-industry tables have been estimated by the OECD using the fixed products sales structures assumption: Austria, Belgium, Czech Republic, France, Germany, Greece, Hungary, Ireland, Italy, Poland, Portugal, Slovak Republic, Spain, Sweden, Switzerland, Turkey, United Kingdom, United States (2000), India and Israel.
• Supply tables and symmetric product-by-product tables have been provided in the following two cases and so symmetric industry-by-industry tables have been estimated by reverse engineering the use table, as described above, before applying the industry technology assumption: Japan (2000) and United States (1995).
• Symmetric product-by-product tables, with no other information, have been provided in the latest year, unless otherwise stated, in the following 6 cases: Korea, China, Chinese Taipei, Indonesia, Russia and Japan (1995). These tables have not, therefore, been converted to industry-by-industry tables.
8. Industry-by-industry versus product-by-product tables
Given the widespread presentation of symmetric tables by many countries, especially within the European Union, it is perhaps important to explain why the OECD database is presented on an industry-by-industry format.
The first reason reflects the fact that the OECD Secretariat typically uses the database in conjunction with its many other datasets, for example the Structural Analysis Database, the Structural and Demographic Statistics Database, the International Energy Agencies (Emissions) Database, the Foreign Direct Investment Database, the Labour Force Survey Database, the Analytical Business Enterprise Research and Development Database, to name but a few; all of which are industry (with the exception of LFS data, which is easily convertible) datasets compatible with ISIC Rev. 3.
The second reason reflects a policy focus. Many of these analyses that use the OECD database are fundamentally concerned with the structure of industries and businesses across economies and the questions raised by these analyses can be better answered using industry-by-industry tables.
The third reason reflects statistical quality. In this context it is important to recognise that the data collected in producing supply-use tables, the key source for input-output tables in most countries, is based, with the exception of final demand components, almost entirely on business data (supply and intermediate consumption matrices). Business surveys typically ask for industrial output making little if any distinction between the intermediate inputs used in ancillary, secondary or by-product production. But this information is of course essential in producing commodity-by-commodity tables. Moreover commodity-by-commodity tables implicitly assume that primary products are produced using a homogenous production (technological) process (product technology assumption). Most studies of micro-level data however, whether looking at enterprises or establishments, suggest that this assumption is rarely met in
DSTI/DOC(2006)8
22
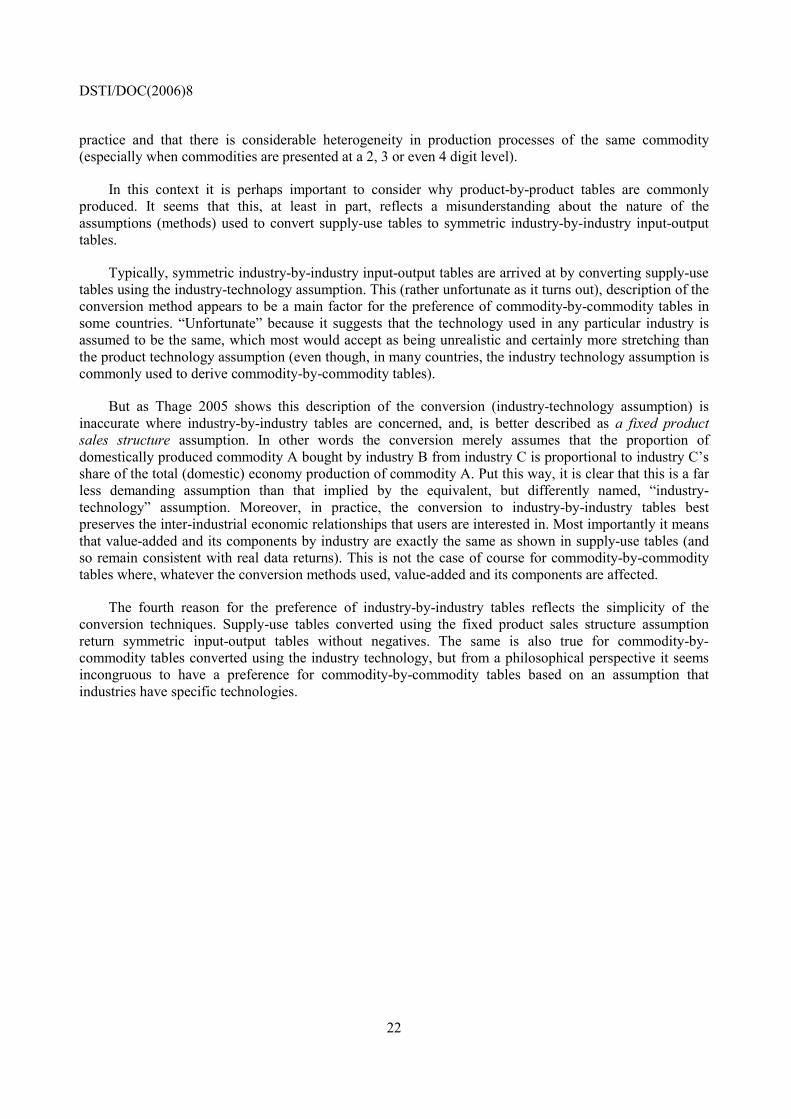
practice and that there is considerable heterogeneity in production processes of the same commodity (especially when commodities are presented at a 2, 3 or even 4 digit level).
In this context it is perhaps important to consider why product-by-product tables are commonly produced. It seems that this, at least in part, reflects a misunderstanding about the nature of the assumptions (methods) used to convert supply-use tables to symmetric industry-by-industry input-output tables.
Typically, symmetric industry-by-industry input-output tables are arrived at by converting supply-use tables using the industry-technology assumption. This (rather unfortunate as it turns out), description of the conversion method appears to be a main factor for the preference of commodity-by-commodity tables in some countries. �Unfortunate� because it suggests that the technology used in any particular industry is assumed to be the same, which most would accept as being unrealistic and certainly more stretching than the product technology assumption (even though, in many countries, the industry technology assumption is commonly used to derive commodity-by-commodity tables).
But as Thage 2005 shows this description of the conversion (industry-technology assumption) is inaccurate where industry-by-industry tables are concerned, and, is better described as a fixed product sales structure assumption. In other words the conversion merely assumes that the proportion of domestically produced commodity A bought by industry B from industry C is proportional to industry C�s share of the total (domestic) economy production of commodity A. Put this way, it is clear that this is a far less demanding assumption than that implied by the equivalent, but differently named, �industry-technology� assumption. Moreover, in practice, the conversion to industry-by-industry tables best preserves the inter-industrial economic relationships that users are interested in. Most importantly it means that value-added and its components by industry are exactly the same as shown in supply-use tables (and so remain consistent with real data returns). This is not the case of course for commodity-by-commodity tables where, whatever the conversion methods used, value-added and its components are affected.
The fourth reason for the preference of industry-by-industry tables reflects the simplicity of the conversion techniques. Supply-use tables converted using the fixed product sales structure assumption return symmetric input-output tables without negatives. The same is also true for commodity-by-commodity tables converted using the industry technology, but from a philosophical perspective it seems incongruous to have a preference for commodity-by-commodity tables based on an assumption that industries have specific technologies.
DSTI/DOC(2006)8
23
REFERENCES
Ahmad, N. (2002), �The OECD Input-Output Database,� paper presented to the 14th International Input-Output Conference, Montreal, 2002.
Ahmad, N. (2003), �Measuring Investment in Software�, STI Working Paper 2003/6: www.olis.oecd.org/olis/2003doc.nsf/linkto/dsti-doc(2003)6, OECD, Paris.
Ahmad, N. and A. Wyckoff (2003), �Carbon Dioxide Emissions Embodied in International Trade of Goods�, STI Working Paper 2003/15: www.olis.oecd.org/olis/2003doc.nsf/linkto/dsti-doc(2003)15, OECD, Paris.
Feenstra, R. C. and G. H. Hanson (1999), �The Impact of Outsourcing and High-Technology Capital on Wages: Estimates for the United States, 1979-1990�, Quarterly Journal of Economics, vol. 114, pp. 907-941.
Papaconstantinou, G., N. Sakurai and A. W. Wyckoff (1996), �Embodied Technology Diffusion�, STI Working Paper 1996/1, OECD, Paris.
Pilat, Dirk, 2006, �The Globalisation of Value Chains: Preliminary Evidence and Potential Implications for Policy�, presented at the OECD�s Committee on Industry and Business Environment, February 2006.
Sakurai, N. (1993), �Structural Change and Employment�, STI Review, vol. 15, OECD, Paris.
Sakurai, N., G. Papaconstantinou and E. Ioannidis (1996), �The impact of R&D and Technology Diffusion on Productivity Growth�, STI Working Paper 1996/2, OECD, Paris.
Thage, B. (2005), �Symmetric Input-Output Tables: Compilation Issues�, presented at the 15th International Input-Output Conference.
United Nations (1999), Handbook of Input-Output Table Compilation and Analysis, Studies in Methods, Series F, No. 74.
Wixted, B., N. Yamano and C. Webb (2006), �Input-Output Analysis in an Increasingly Globalised World: Applications of OECD�s Harmonised International Tables�, STI Working Paper 2006/7, OECD, Paris.
Wyckoff, A.W. (1993), �The Extension of Networks of Production across Boarders�, STI Review No.13, OECD, Paris.

DSTI/DOC(2006)8
24
ANNEX I: SUMMARY STATISTICS
This annex provides a simple example of comparative statistics derived using the latest version of the database: 2006 Edition.
Figure A1: Import structures
Simple ratios showing the shares of imports as a percent of total final demand, and intermediate consumption in particular, provide an indication of the degree of integration/interdependencies of economies in the global supply chain, although some care is needed in interpretation as flows of intermediate consumption of domestically produced goods are measured gross and because comparisons are not made at constant prices. Nevertheless these caveats notwithstanding the tables provide a strong indication that these interdependencies are growing, indeed since the 1990s these ratios have increased in 29 out of 31 countries, with, not surprisingly, a negative correlation between the economic size of a country and these ratios.
mid90s early00s mid90s early00sAustralia 12.5% 13.0% 10.4% 10.9%Austria 25.3% 29.5% 18.1% 21.8%Belgium 30.5% 34.7% 23.4% 27.0%Canada 24.2% 26.4% 18.6% 21.0%Czech Republic 24.3% 32.3% 22.4% 26.9%Denmark 22.3% 23.4% 15.8% 17.0%Finland 20.0% 23.9% 15.7% 17.3%France 15.3% 14.4% 11.8% 10.7%Germany 15.3% 20.0% 11.1% 14.8%Greece 20.2% 21.1% 15.1% 17.3%Hungary 35.5% 45.0% 25.6% 33.0%Ireland - 50.0% - 38.0%Italy 17.1% 19.1% 11.9% 13.8%Japan 6.4% 7.8% 4.7% 5.8%Korea 19.6% 23.5% 14.9% 17.5%Netherlands 28.8% 30.0% 20.3% 21.8%New Zealand 14.7% - 13.0% -Norway 18.6% 22.5% 16.0% 18.4%Poland 13.6% 18.3% 11.2% 16.4%Portugal 20.6% 23.4% 17.4% 19.2%Slovak Republic 27.6% 33.3% 24.1% 30.3%Spain 16.9% 22.5% 11.9% 16.6%Sweden 23.3% 26.7% 17.1% 20.1%Switzerland - 25.3% - 21.5%Turkey 17.0% 18.9% 14.4% 16.3%United Kingdom 17.4% 16.0% 13.8% 14.6%United States 6.7% 7.6% 5.8% 6.7%*Argentina 9.9% - 7.4% -*Brazil 7.3% 9.0% 5.4% 6.6%*China 7.9% 9.6% 6.4% 7.7%*ChineseTaipei 26.2% 27.8% 20.1% 21.4%*India 9.9% 11.7% 6.4% 8.1%*Indonesia 18.3% 21.0% 12.8% 16.7%*Israel 17.4% - 11.7% -*Russia 12.6% 14.3% 11.7% 13.5%*Singapore 54.9% 57.8% 46.1% 47.2%
Intermediate Final demandRatio of Imported and domestic inputs
(Intermediate demand)
0.0% 10.0% 20.0% 30.0% 40.0% 50.0% 60.0%
United States
Japan
*Brazil
*China
*Argentina
*India
Australia
*Russia
France
New Zealand
United Kingdom
*Israel
Poland
Turkey
Italy
Germany
*Indonesia
Greece
Norway
Spain
Denmark
Portugal
Korea
Finland
Switzerland
Canada
Sweden
*Chinese Taipei
Austria
Netherlands
Czech Republic
Slovak Republic
Belgium
Hungary
Ireland
*Singapore
early 2000s
mid 1990s
* Non OECD member. Source: OECD I-O tables.
DSTI/DOC(2006)8
25
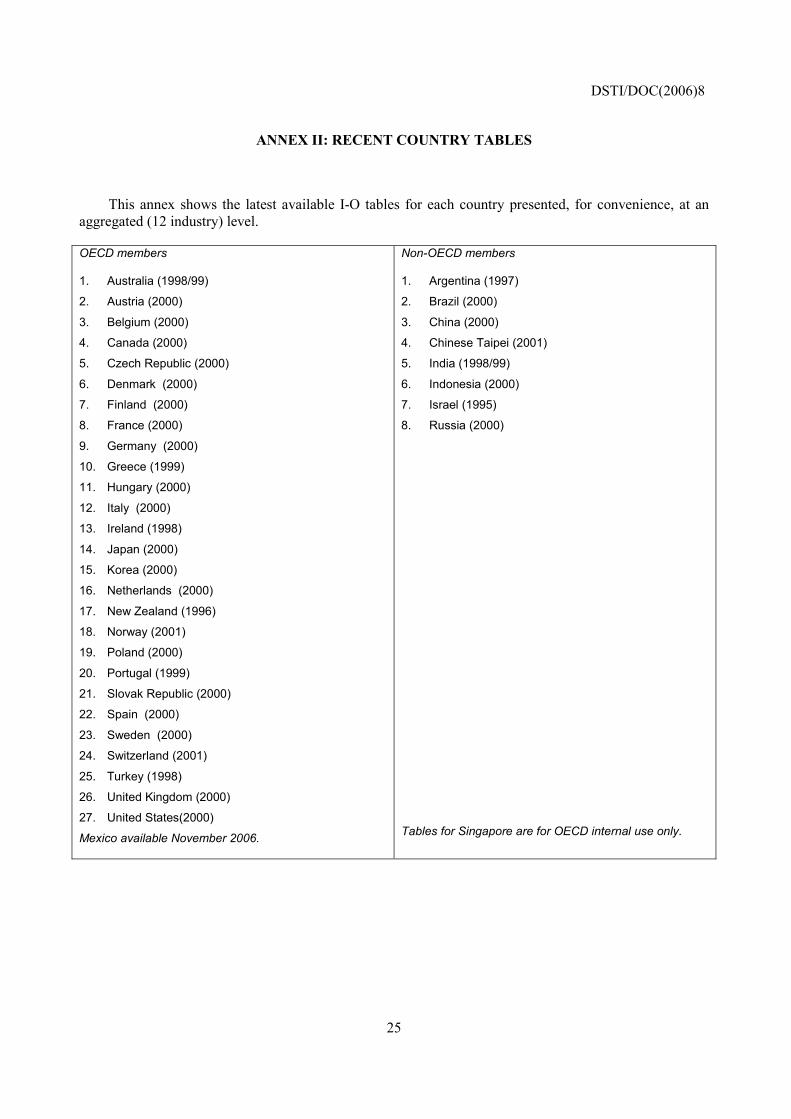
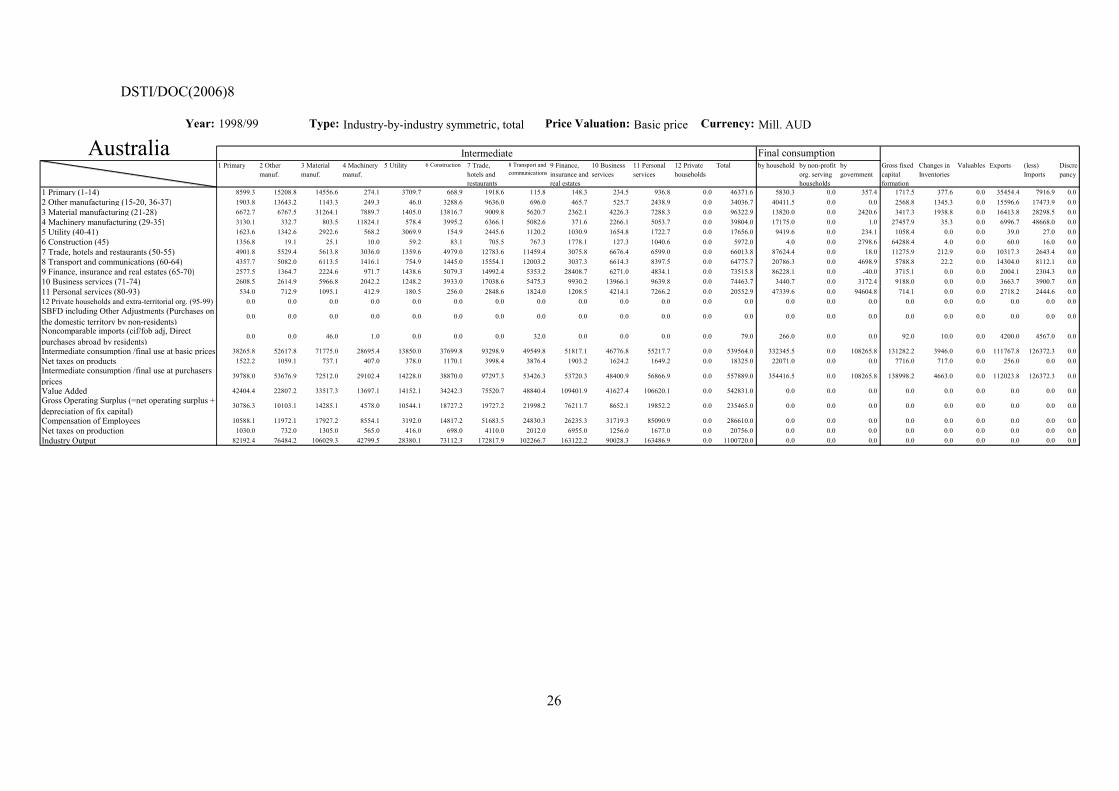
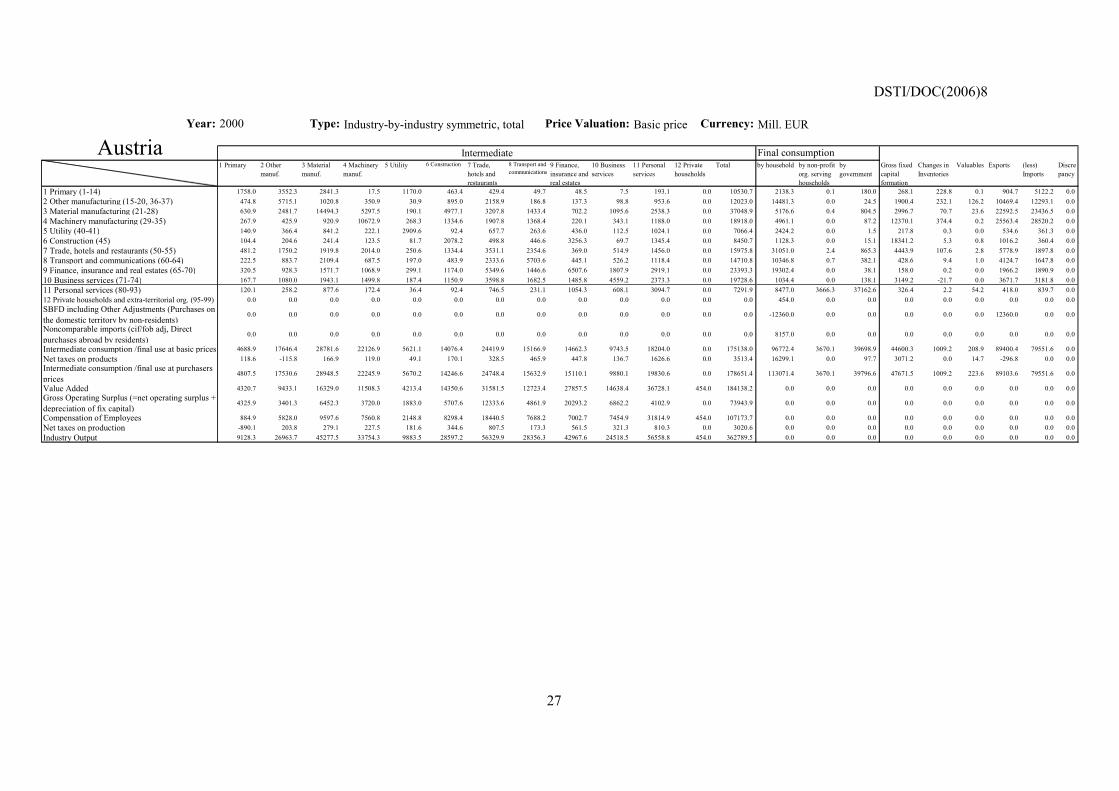
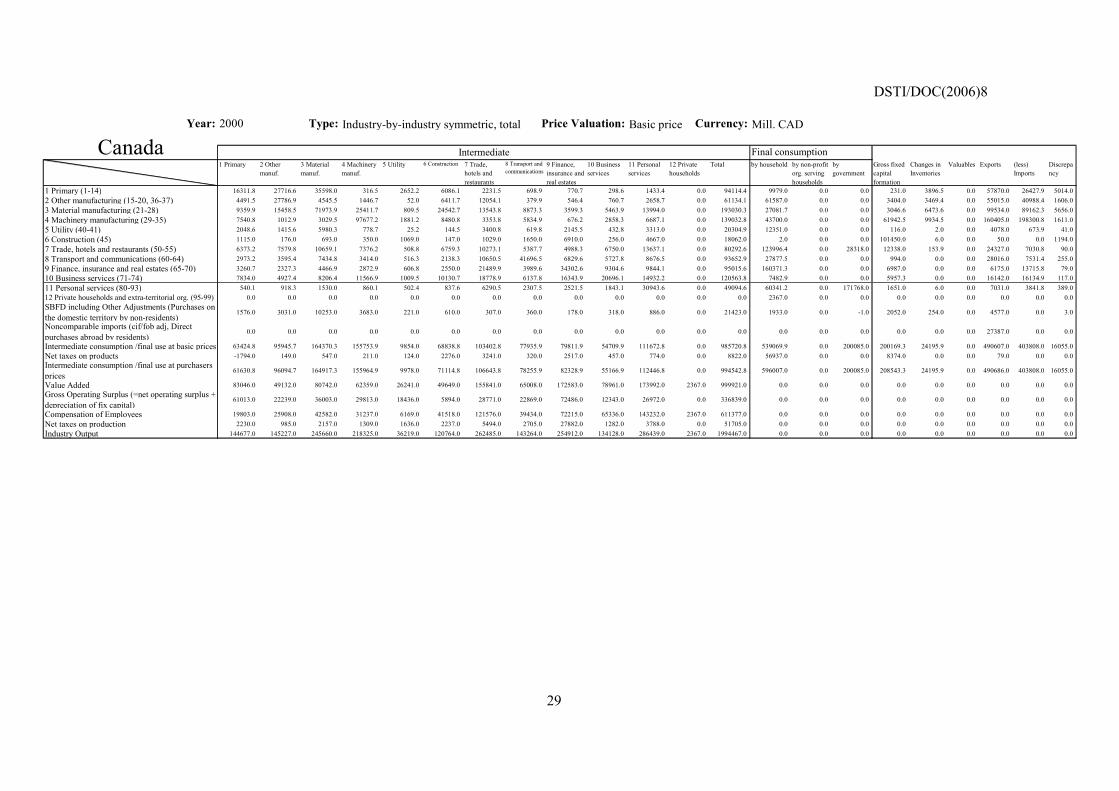
ANNEX II: RECENT COUNTRY TABLES
This annex shows the latest available I-O tables for each country presented, for convenience, at an aggregated (12 industry) level.
OECD members 1. Australia (1998/99)
2. Austria (2000)
3. Belgium (2000)
4. Canada (2000)
5. Czech Republic (2000)
6. Denmark (2000)
7. Finland (2000)
8. France (2000)
9. Germany (2000)
10. Greece (1999)
11. Hungary (2000)
12. Italy (2000)
13. Ireland (1998)
14. Japan (2000)
15. Korea (2000)
16. Netherlands (2000)
17. New Zealand (1996)
18. Norway (2001)
19. Poland (2000)
20. Portugal (1999)
21. Slovak Republic (2000)
22. Spain (2000)
23. Sweden (2000)
24. Switzerland (2001)
25. Turkey (1998)
26. United Kingdom (2000)
27. United States(2000)
Mexico available November 2006.
Non-OECD members 1. Argentina (1997)
2. Brazil (2000)
3. China (2000)
4. Chinese Taipei (2001)
5. India (1998/99)
6. Indonesia (2000)
7. Israel (1995)
8. Russia (2000)
Tables for Singapore are for OECD internal use only.
DSTI/DOC(2006)8
26
Year: 1998/99 Type: Industry-by-industry symmetric, total Price Valuation: Basic price Currency: Mill. AUD
1 Primary 2 Othermanuf.
3 Materialmanuf.
4 Machinerymanuf.
5 Utility 6 Construction 7 Trade,hotels andrestaurants
8 Transport andcommunications
9 Finance,insurance andreal estates
10 Businessservices
11 Personalservices
12 Privatehouseholds
Total by household by non-profitorg. servinghouseholds
bygovernment
Gross fixedcapitalformation
Changes inInventories
Valuables Exports (less)Imports
Discrepancy
1 Primary (1-14) 8599.3 15208.8 14556.6 274.1 3709.7 668.9 1918.6 115.8 148.3 234.5 936.8 0.0 46371.6 5830.3 0.0 357.4 1717.5 377.6 0.0 35454.4 7916.9 0.02 Other manufacturing (15-20, 36-37) 1903.8 13643.2 1143.3 249.3 46.0 3288.6 9636.0 696.0 465.7 525.7 2438.9 0.0 34036.7 40411.5 0.0 0.0 2568.8 1345.3 0.0 15596.6 17473.9 0.03 Material manufacturing (21-28) 6672.7 6767.5 31264.1 7889.7 1405.0 13816.7 9009.8 5620.7 2362.1 4226.3 7288.3 0.0 96322.9 13820.0 0.0 2420.6 3417.3 1938.8 0.0 16413.8 28298.5 0.04 Machinery manufacturing (29-35) 3130.1 332.7 803.5 11824.1 578.4 3995.2 6366.1 5082.6 371.6 2266.1 5053.7 0.0 39804.0 17175.0 0.0 1.0 27457.9 35.3 0.0 6996.7 48668.0 0.05 Utility (40-41) 1623.6 1342.6 2922.6 568.2 3069.9 154.9 2445.6 1120.2 1030.9 1654.8 1722.7 0.0 17656.0 9419.6 0.0 234.1 1058.4 0.0 0.0 39.0 27.0 0.06 Construction (45) 1356.8 19.1 25.1 10.0 59.2 83.1 705.5 767.3 1778.1 127.3 1040.6 0.0 5972.0 4.0 0.0 2798.6 64288.4 4.0 0.0 60.0 16.0 0.07 Trade, hotels and restaurants (50-55) 4901.8 5529.4 5613.8 3036.0 1359.6 4979.0 12783.6 11459.4 3075.8 6676.4 6599.0 0.0 66013.8 87624.4 0.0 18.0 11275.9 212.9 0.0 10317.3 2643.4 0.08 Transport and communications (60-64) 4357.7 5082.0 6113.5 1416.1 754.9 1445.0 15554.1 12003.2 3037.3 6614.3 8397.5 0.0 64775.7 20786.3 0.0 4698.9 5788.8 22.2 0.0 14304.0 8112.1 0.09 Finance, insurance and real estates (65-70) 2577.5 1364.7 2224.6 971.7 1438.6 5079.3 14992.4 5353.2 28408.7 6271.0 4834.1 0.0 73515.8 86228.1 0.0 -40.0 3715.1 0.0 0.0 2004.1 2304.3 0.010 Business services (71-74) 2608.5 2614.9 5966.8 2042.2 1248.2 3933.0 17038.6 5475.3 9930.2 13966.1 9639.8 0.0 74463.7 3440.7 0.0 3172.4 9188.0 0.0 0.0 3663.7 3900.7 0.011 Personal services (80-93) 534.0 712.9 1095.1 412.9 180.5 256.0 2848.6 1824.0 1208.5 4214.1 7266.2 0.0 20552.9 47339.6 0.0 94604.8 714.1 0.0 0.0 2718.2 2444.6 0.012 Private households and extra-territorial org. (95-99) 0.0 0.0 0.0 0.0 0.0 0.0 0.0 0.0 0.0 0.0 0.0 0.0 0.0 0.0 0.0 0.0 0.0 0.0 0.0 0.0 0.0 0.0SBFD including Other Adjustments (Purchases onthe domestic territory by non-residents)
0.0 0.0 0.0 0.0 0.0 0.0 0.0 0.0 0.0 0.0 0.0 0.0 0.0 0.0 0.0 0.0 0.0 0.0 0.0 0.0 0.0 0.0
Noncomparable imports (cif/fob adj, Directpurchases abroad by residents)
0.0 0.0 46.0 1.0 0.0 0.0 0.0 32.0 0.0 0.0 0.0 0.0 79.0 266.0 0.0 0.0 92.0 10.0 0.0 4200.0 4567.0 0.0
Intermediate consumption /final use at basic prices 38265.8 52617.8 71775.0 28695.4 13850.0 37699.8 93298.9 49549.8 51817.1 46776.8 55217.7 0.0 539564.0 332345.5 0.0 108265.8 131282.2 3946.0 0.0 111767.8 126372.3 0.0Net taxes on products 1522.2 1059.1 737.1 407.0 378.0 1170.1 3998.4 3876.4 1903.2 1624.2 1649.2 0.0 18325.0 22071.0 0.0 0.0 7716.0 717.0 0.0 256.0 0.0 0.0Intermediate consumption /final use at purchasersprices
39788.0 53676.9 72512.0 29102.4 14228.0 38870.0 97297.3 53426.3 53720.3 48400.9 56866.9 0.0 557889.0 354416.5 0.0 108265.8 138998.2 4663.0 0.0 112023.8 126372.3 0.0
Value Added 42404.4 22807.2 33517.3 13697.1 14152.1 34242.3 75520.7 48840.4 109401.9 41627.4 106620.1 0.0 542831.0 0.0 0.0 0.0 0.0 0.0 0.0 0.0 0.0 0.0Gross Operating Surplus (=net operating surplus +depreciation of fix capital)
30786.3 10103.1 14285.1 4578.0 10544.1 18727.2 19727.2 21998.2 76211.7 8652.1 19852.2 0.0 235465.0 0.0 0.0 0.0 0.0 0.0 0.0 0.0 0.0 0.0
Compensation of Employees 10588.1 11972.1 17927.2 8554.1 3192.0 14817.2 51683.5 24830.3 26235.3 31719.3 85090.9 0.0 286610.0 0.0 0.0 0.0 0.0 0.0 0.0 0.0 0.0 0.0Net taxes on production 1030.0 732.0 1305.0 565.0 416.0 698.0 4110.0 2012.0 6955.0 1256.0 1677.0 0.0 20756.0 0.0 0.0 0.0 0.0 0.0 0.0 0.0 0.0 0.0Industry Output 82192.4 76484.2 106029.3 42799.5 28380.1 73112.3 172817.9 102266.7 163122.2 90028.3 163486.9 0.0 1100720.0 0.0 0.0 0.0 0.0 0.0 0.0 0.0 0.0 0.0
Australia Final consumptionIntermediate
DSTI/DOC(2006)8
27
Year: 2000 Type: Industry-by-industry symmetric, total Price Valuation: Basic price Currency: Mill. EUR
1 Primary 2 Othermanuf.
3 Materialmanuf.
4 Machinerymanuf.
5 Utility 6 Construction 7 Trade,hotels andrestaurants
8 Transport andcommunications
9 Finance,insurance andreal estates
10 Businessservices
11 Personalservices
12 Privatehouseholds
Total by household by non-profitorg. servinghouseholds
bygovernment
Gross fixedcapitalformation
Changes inInventories
Valuables Exports (less)Imports
Discrepancy
1 Primary (1-14) 1758.0 3552.3 2841.3 17.5 1170.0 463.4 429.4 49.7 48.5 7.5 193.1 0.0 10530.7 2138.3 0.1 180.0 268.1 228.8 0.1 904.7 5122.2 0.02 Other manufacturing (15-20, 36-37) 474.8 5715.1 1020.8 350.9 30.9 895.0 2158.9 186.8 137.3 98.8 953.6 0.0 12023.0 14481.3 0.0 24.5 1900.4 232.1 126.2 10469.4 12293.1 0.03 Material manufacturing (21-28) 630.9 2481.7 14494.3 5297.5 190.1 4977.1 3207.8 1433.4 702.2 1095.6 2538.3 0.0 37048.9 5176.6 0.4 804.5 2996.7 70.7 23.6 22592.5 23436.5 0.04 Machinery manufacturing (29-35) 267.9 425.9 920.9 10672.9 268.3 1334.6 1907.8 1368.4 220.1 343.1 1188.0 0.0 18918.0 4961.1 0.0 87.2 12370.1 374.4 0.2 25563.4 28520.2 0.05 Utility (40-41) 140.9 366.4 841.2 222.1 2909.6 92.4 657.7 263.6 436.0 112.5 1024.1 0.0 7066.4 2424.2 0.0 1.5 217.8 0.3 0.0 534.6 361.3 0.06 Construction (45) 104.4 204.6 241.4 123.5 81.7 2078.2 498.8 446.6 3256.3 69.7 1345.4 0.0 8450.7 1128.3 0.0 15.1 18341.2 5.3 0.8 1016.2 360.4 0.07 Trade, hotels and restaurants (50-55) 481.2 1750.2 1919.8 2014.0 250.6 1334.4 3531.1 2354.6 369.0 514.9 1456.0 0.0 15975.8 31051.0 2.4 865.3 4443.9 107.6 2.8 5778.9 1897.8 0.08 Transport and communications (60-64) 222.5 883.7 2109.4 687.5 197.0 483.9 2333.6 5703.6 445.1 526.2 1118.4 0.0 14710.8 10346.8 0.7 382.1 428.6 9.4 1.0 4124.7 1647.8 0.09 Finance, insurance and real estates (65-70) 320.5 928.3 1571.7 1068.9 299.1 1174.0 5349.6 1446.6 6507.6 1807.9 2919.1 0.0 23393.3 19302.4 0.0 38.1 158.0 0.2 0.0 1966.2 1890.9 0.010 Business services (71-74) 167.7 1080.0 1943.1 1499.8 187.4 1150.9 3598.8 1682.5 1485.8 4559.2 2373.3 0.0 19728.6 1034.4 0.0 138.1 3149.2 -21.7 0.0 3671.7 3181.8 0.011 Personal services (80-93) 120.1 258.2 877.6 172.4 36.4 92.4 746.5 231.1 1054.3 608.1 3094.7 0.0 7291.9 8477.0 3666.3 37162.6 326.4 2.2 54.2 418.0 839.7 0.012 Private households and extra-territorial org. (95-99) 0.0 0.0 0.0 0.0 0.0 0.0 0.0 0.0 0.0 0.0 0.0 0.0 0.0 454.0 0.0 0.0 0.0 0.0 0.0 0.0 0.0 0.0SBFD including Other Adjustments (Purchases onthe domestic territory by non-residents)
0.0 0.0 0.0 0.0 0.0 0.0 0.0 0.0 0.0 0.0 0.0 0.0 0.0 -12360.0 0.0 0.0 0.0 0.0 0.0 12360.0 0.0 0.0
Noncomparable imports (cif/fob adj, Directpurchases abroad by residents)
0.0 0.0 0.0 0.0 0.0 0.0 0.0 0.0 0.0 0.0 0.0 0.0 0.0 8157.0 0.0 0.0 0.0 0.0 0.0 0.0 0.0 0.0
Intermediate consumption /final use at basic prices 4688.9 17646.4 28781.6 22126.9 5621.1 14076.4 24419.9 15166.9 14662.3 9743.5 18204.0 0.0 175138.0 96772.4 3670.1 39698.9 44600.3 1009.2 208.9 89400.4 79551.6 0.0Net taxes on products 118.6 -115.8 166.9 119.0 49.1 170.1 328.5 465.9 447.8 136.7 1626.6 0.0 3513.4 16299.1 0.0 97.7 3071.2 0.0 14.7 -296.8 0.0 0.0Intermediate consumption /final use at purchasersprices
4807.5 17530.6 28948.5 22245.9 5670.2 14246.6 24748.4 15632.9 15110.1 9880.1 19830.6 0.0 178651.4 113071.4 3670.1 39796.6 47671.5 1009.2 223.6 89103.6 79551.6 0.0
Value Added 4320.7 9433.1 16329.0 11508.3 4213.4 14350.6 31581.5 12723.4 27857.5 14638.4 36728.1 454.0 184138.2 0.0 0.0 0.0 0.0 0.0 0.0 0.0 0.0 0.0Gross Operating Surplus (=net operating surplus +depreciation of fix capital)
4325.9 3401.3 6452.3 3720.0 1883.0 5707.6 12333.6 4861.9 20293.2 6862.2 4102.9 0.0 73943.9 0.0 0.0 0.0 0.0 0.0 0.0 0.0 0.0 0.0
Compensation of Employees 884.9 5828.0 9597.6 7560.8 2148.8 8298.4 18440.5 7688.2 7002.7 7454.9 31814.9 454.0 107173.7 0.0 0.0 0.0 0.0 0.0 0.0 0.0 0.0 0.0Net taxes on production -890.1 203.8 279.1 227.5 181.6 344.6 807.5 173.3 561.5 321.3 810.3 0.0 3020.6 0.0 0.0 0.0 0.0 0.0 0.0 0.0 0.0 0.0Industry Output 9128.3 26963.7 45277.5 33754.3 9883.5 28597.2 56329.9 28356.3 42967.6 24518.5 56558.8 454.0 362789.5 0.0 0.0 0.0 0.0 0.0 0.0 0.0 0.0 0.0
Austria Intermediate Final consumption
DSTI/DOC(2006)8
28
Year: 2000 Type: Industry-by-industry symmetric, total Price Valuation: Basic price Currency: Mill. EUR
1 Primary 2 Othermanuf.
3 Materialmanuf.
4 Machinerymanuf.
5 Utility 6 Construction 7 Trade,hotels andrestaurants
8 Transport andcommunications
9 Finance,insurance andreal estates
10 Businessservices
11 Personalservices
12 Privatehouseholds
Total by household by non-profitorg. servinghouseholds
bygovernment
Gross fixedcapitalformation
Changes inInventories
Valuables Exports (less)Imports
Discrepancy
1 Primary (1-14) 486.3 7122.4 8330.2 37.0 260.8 460.4 804.3 7.5 22.0 32.0 191.5 0.0 17754.4 1781.3 0.0 0.1 73.8 244.8 0.0 9315.2 20900.0 0.02 Other manufacturing (15-20, 36-37) 1461.5 11056.5 1328.8 777.3 28.3 1446.6 4306.2 314.5 78.0 327.8 1139.1 0.0 22264.6 16330.0 0.2 12.9 1430.0 88.5 0.0 31192.9 28069.1 0.03 Material manufacturing (21-28) 701.1 4990.1 36079.5 5641.4 395.3 6413.9 7345.3 2946.3 550.0 3706.3 3396.9 0.0 72166.1 6251.7 18.1 915.4 1894.2 261.2 0.0 68734.1 59447.7 0.04 Machinery manufacturing (29-35) 328.5 254.3 994.7 17265.4 773.4 1538.0 2649.5 1345.6 197.8 841.5 830.1 0.0 27018.8 7399.8 11.9 66.3 17226.8 237.2 0.0 48699.1 58089.1 0.05 Utility (40-41) 262.4 746.1 2464.4 318.2 1311.7 171.6 1118.2 490.1 310.1 391.8 915.0 0.0 8499.6 3761.5 0.0 0.4 118.7 4.8 0.0 869.5 2631.9 0.06 Construction (45) 12.3 161.7 734.7 220.7 469.4 7684.5 2433.5 1256.9 3312.7 341.0 1663.4 0.0 18290.8 183.2 0.1 6.6 16801.9 -0.8 0.0 1191.6 417.9 0.07 Trade, hotels and restaurants (50-55) 756.2 3743.3 6290.8 2928.6 355.6 2979.1 4740.2 3100.7 557.7 3288.8 2016.6 0.0 30757.7 24940.5 17.2 771.2 4273.7 381.7 0.0 16755.8 3563.0 0.08 Transport and communications (60-64) 128.6 1811.0 4175.0 1407.2 202.8 852.2 5291.7 12223.8 1270.6 2929.0 1232.5 0.0 31524.1 7727.4 0.3 20.3 483.0 -1.0 0.0 14124.5 9560.5 0.09 Finance, insurance and real estates (65-70) 177.8 880.4 1481.1 756.5 321.2 1245.7 4313.8 1732.5 9818.1 3355.3 2807.8 0.0 26890.3 28899.2 18.1 69.5 1036.8 0.3 0.0 2521.3 2798.1 0.010 Business services (71-74) 203.9 2451.1 5492.2 2657.3 683.7 1872.5 10978.9 4467.0 3761.1 13850.1 3492.7 0.0 49910.4 1664.5 123.6 160.4 3211.3 10.6 0.0 11483.9 9916.0 0.011 Personal services (80-93) 236.5 311.3 689.1 258.4 35.2 260.7 824.7 263.7 169.7 1402.6 4808.6 0.0 9260.4 12897.5 3020.9 50171.8 151.6 -0.3 0.0 1043.5 825.8 0.012 Private households and extra-territorial org. (95-99) 0.0 0.0 0.0 0.0 0.0 0.0 0.0 0.0 0.0 0.0 0.0 0.0 0.0 1199.7 0.0 0.0 0.0 0.0 0.0 0.0 0.0 0.0SBFD including Other Adjustments (Purchases onthe domestic territory by non-residents)
0.0 0.0 0.0 0.0 0.0 0.0 0.0 0.0 0.0 0.0 0.0 0.0 0.0 -5761.8 0.0 0.0 0.0 0.0 0.0 5761.8 0.0 0.0
Noncomparable imports (cif/fob adj, Directpurchases abroad by residents)
0.0 0.0 0.0 0.0 0.0 0.0 0.0 0.0 0.0 0.0 0.0 0.0 0.0 8179.8 0.0 0.0 0.0 0.0 0.0 0.0 0.0 0.0
Intermediate consumption /final use at basic prices 4755.0 33528.3 68060.6 32267.9 4837.3 24925.1 44806.4 28148.6 20047.8 30466.1 22494.1 0.0 314337.3 115454.4 3210.3 52195.0 46701.7 1226.9 0.0 211693.1 196219.0 0.0Net taxes on products 74.0 147.1 176.8 76.6 7.3 192.4 635.4 1371.6 820.8 302.9 1800.6 0.0 5605.6 15524.7 4.3 151.7 5924.3 -68.6 0.0 305.2 0.0 0.0Intermediate consumption /final use at purchasersprices
4829.1 33675.4 68237.4 32344.6 4844.6 25117.5 45441.8 29520.1 20868.6 30769.0 24294.8 0.0 319942.9 130979.1 3214.6 52346.7 52626.0 1158.3 0.0 211998.3 196219.0 0.0
Value Added 3440.5 9574.5 22555.6 10226.2 5778.1 10938.0 28893.0 14798.0 35768.7 25879.8 51425.0 1199.7 220477.1 0.0 0.0 0.0 0.0 0.0 0.0 0.0 0.0 0.0Gross Operating Surplus (=net operating surplus +depreciation of fix capital)
2900.9 3567.5 8622.0 2882.9 3592.1 4421.2 12256.6 4644.5 25058.3 12923.9 9765.9 0.0 90635.9 0.0 0.0 0.0 0.0 0.0 0.0 0.0 0.0 0.0
Compensation of Employees 536.3 5849.6 13672.3 7313.6 2088.2 6395.8 16253.7 10126.9 8540.1 13034.2 41827.6 1199.7 126838.0 0.0 0.0 0.0 0.0 0.0 0.0 0.0 0.0 0.0Net taxes on production 3.3 157.5 261.3 29.7 97.8 121.0 382.7 26.6 2170.3 -78.3 -168.5 0.0 3003.2 0.0 0.0 0.0 0.0 0.0 0.0 0.0 0.0 0.0Industry Output 8269.6 43250.0 90793.0 42570.8 10622.7 36055.5 74334.8 44318.1 56637.3 56648.8 75719.8 1199.7 540420.0 0.0 0.0 0.0 0.0 0.0 0.0 0.0 0.0 0.0
Belgium Intermediate Final consumption
DSTI/DOC(2006)8
29
Year: 2000 Type: Industry-by-industry symmetric, total Price Valuation: Basic price Currency: Mill. CAD
1 Primary 2 Othermanuf.
3 Materialmanuf.
4 Machinerymanuf.
5 Utility 6 Construction 7 Trade,hotels andrestaurants
8 Transport andcommunications
9 Finance,insurance andreal estates
10 Businessservices
11 Personalservices
12 Privatehouseholds
Total by household by non-profitorg. servinghouseholds
bygovernment
Gross fixedcapitalformation
Changes inInventories
Valuables Exports (less)Imports
Discrepancy
1 Primary (1-14) 16311.8 27716.6 35598.0 316.5 2652.2 6086.1 2231.5 698.9 770.7 298.6 1433.4 0.0 94114.4 9979.0 0.0 0.0 231.0 3896.5 0.0 57870.0 26427.9 5014.02 Other manufacturing (15-20, 36-37) 4491.5 27786.9 4545.5 1446.7 52.0 6411.7 12054.1 379.9 546.4 760.7 2658.7 0.0 61134.1 61587.0 0.0 0.0 3404.0 3469.4 0.0 55015.0 40988.4 1606.03 Material manufacturing (21-28) 9359.9 15458.5 71973.9 25411.7 809.5 24542.7 13543.8 8873.3 3599.3 5463.9 13994.0 0.0 193030.3 27081.7 0.0 0.0 3046.6 6473.6 0.0 99534.0 89162.3 5656.04 Machinery manufacturing (29-35) 7540.8 1012.9 3029.5 97677.2 1881.2 8480.8 3353.8 5834.9 676.2 2858.3 6687.1 0.0 139032.8 43700.0 0.0 0.0 61942.5 9934.5 0.0 160405.0 198300.8 1611.05 Utility (40-41) 2048.6 1415.6 5980.3 778.7 25.2 144.5 3400.8 619.8 2145.5 432.8 3313.0 0.0 20304.9 12351.0 0.0 0.0 116.0 2.0 0.0 4078.0 673.9 41.06 Construction (45) 1115.0 176.0 693.0 350.0 1069.0 147.0 1029.0 1650.0 6910.0 256.0 4667.0 0.0 18062.0 2.0 0.0 0.0 101450.0 6.0 0.0 50.0 0.0 1194.07 Trade, hotels and restaurants (50-55) 6373.2 7579.8 10659.1 7376.2 508.8 6759.3 10273.1 5387.7 4988.3 6750.0 13637.1 0.0 80292.6 123996.4 0.0 28318.0 12338.0 153.9 0.0 24327.0 7030.8 90.08 Transport and communications (60-64) 2973.2 3595.4 7434.8 3414.0 516.3 2138.3 10650.5 41696.5 6829.6 5727.8 8676.5 0.0 93652.9 27877.5 0.0 0.0 994.0 0.0 0.0 28016.0 7531.4 255.09 Finance, insurance and real estates (65-70) 3260.7 2327.3 4466.9 2872.9 606.8 2550.0 21489.9 3989.6 34302.6 9304.6 9844.1 0.0 95015.6 160371.3 0.0 0.0 6987.0 0.0 0.0 6175.0 13715.8 79.010 Business services (71-74) 7834.0 4927.4 8206.4 11566.9 1009.5 10130.7 18778.9 6137.8 16343.9 20696.1 14932.2 0.0 120563.8 7482.9 0.0 0.0 5957.3 0.0 0.0 16142.0 16134.9 117.011 Personal services (80-93) 540.1 918.3 1530.0 860.1 502.4 837.6 6290.5 2307.5 2521.5 1843.1 30943.6 0.0 49094.6 60341.2 0.0 171768.0 1651.0 6.0 0.0 7031.0 3841.8 389.012 Private households and extra-territorial org. (95-99) 0.0 0.0 0.0 0.0 0.0 0.0 0.0 0.0 0.0 0.0 0.0 0.0 0.0 2367.0 0.0 0.0 0.0 0.0 0.0 0.0 0.0 0.0SBFD including Other Adjustments (Purchases onthe domestic territory by non-residents)
1576.0 3031.0 10253.0 3683.0 221.0 610.0 307.0 360.0 178.0 318.0 886.0 0.0 21423.0 1933.0 0.0 -1.0 2052.0 254.0 0.0 4577.0 0.0 3.0
Noncomparable imports (cif/fob adj, Directpurchases abroad by residents)
0.0 0.0 0.0 0.0 0.0 0.0 0.0 0.0 0.0 0.0 0.0 0.0 0.0 0.0 0.0 0.0 0.0 0.0 0.0 27387.0 0.0 0.0
Intermediate consumption /final use at basic prices 63424.8 95945.7 164370.3 155753.9 9854.0 68838.8 103402.8 77935.9 79811.9 54709.9 111672.8 0.0 985720.8 539069.9 0.0 200085.0 200169.3 24195.9 0.0 490607.0 403808.0 16055.0Net taxes on products -1794.0 149.0 547.0 211.0 124.0 2276.0 3241.0 320.0 2517.0 457.0 774.0 0.0 8822.0 56937.0 0.0 0.0 8374.0 0.0 0.0 79.0 0.0 0.0Intermediate consumption /final use at purchasersprices
61630.8 96094.7 164917.3 155964.9 9978.0 71114.8 106643.8 78255.9 82328.9 55166.9 112446.8 0.0 994542.8 596007.0 0.0 200085.0 208543.3 24195.9 0.0 490686.0 403808.0 16055.0
Value Added 83046.0 49132.0 80742.0 62359.0 26241.0 49649.0 155841.0 65008.0 172583.0 78961.0 173992.0 2367.0 999921.0 0.0 0.0 0.0 0.0 0.0 0.0 0.0 0.0 0.0Gross Operating Surplus (=net operating surplus +depreciation of fix capital)
61013.0 22239.0 36003.0 29813.0 18436.0 5894.0 28771.0 22869.0 72486.0 12343.0 26972.0 0.0 336839.0 0.0 0.0 0.0 0.0 0.0 0.0 0.0 0.0 0.0
Compensation of Employees 19803.0 25908.0 42582.0 31237.0 6169.0 41518.0 121576.0 39434.0 72215.0 65336.0 143232.0 2367.0 611377.0 0.0 0.0 0.0 0.0 0.0 0.0 0.0 0.0 0.0Net taxes on production 2230.0 985.0 2157.0 1309.0 1636.0 2237.0 5494.0 2705.0 27882.0 1282.0 3788.0 0.0 51705.0 0.0 0.0 0.0 0.0 0.0 0.0 0.0 0.0 0.0Industry Output 144677.0 145227.0 245660.0 218325.0 36219.0 120764.0 262485.0 143264.0 254912.0 134128.0 286439.0 2367.0 1994467.0 0.0 0.0 0.0 0.0 0.0 0.0 0.0 0.0 0.0
Canada Intermediate Final consumption
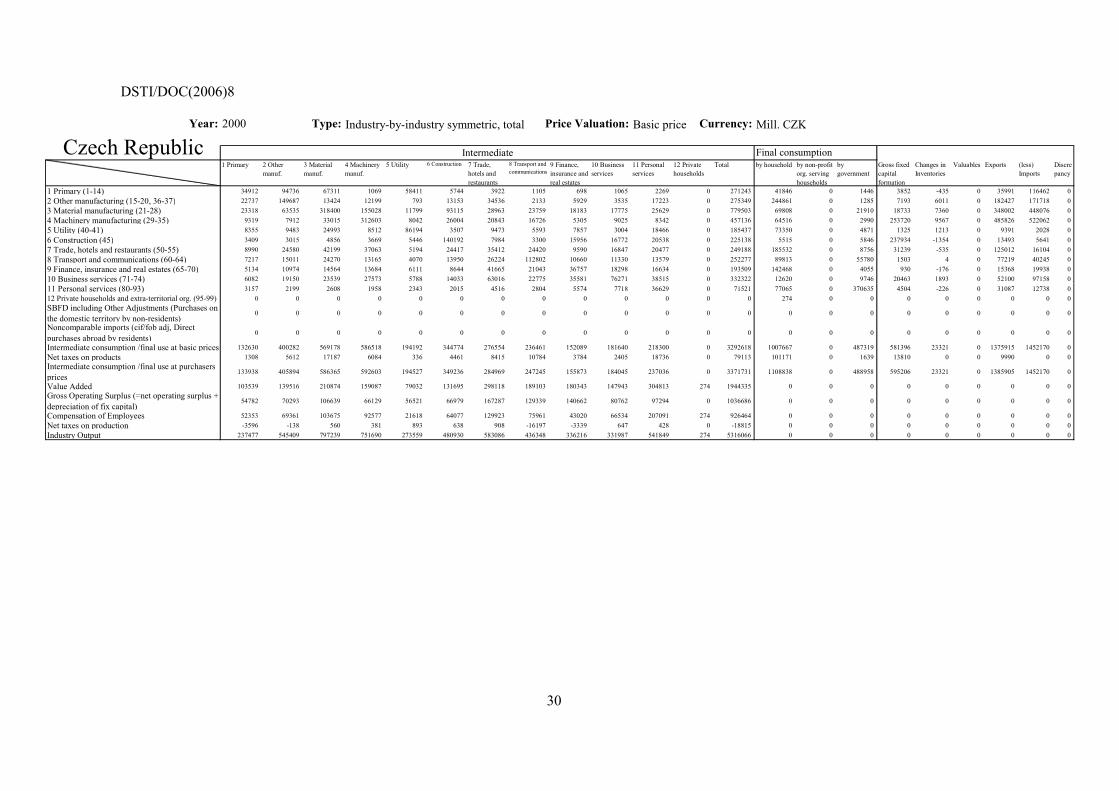
DSTI/DOC(2006)8
30
Year: 2000 Type: Industry-by-industry symmetric, total Price Valuation: Basic price Currency: Mill. CZK
1 Primary 2 Othermanuf.
3 Materialmanuf.
4 Machinerymanuf.
5 Utility 6 Construction 7 Trade,hotels andrestaurants
8 Transport andcommunications
9 Finance,insurance andreal estates
10 Businessservices
11 Personalservices
12 Privatehouseholds
Total by household by non-profitorg. servinghouseholds
bygovernment
Gross fixedcapitalformation
Changes inInventories
Valuables Exports (less)Imports
Discrepancy
1 Primary (1-14) 34912 94736 67311 1069 58411 5744 3922 1105 698 1065 2269 0 271243 41846 0 1446 3852 -435 0 35991 116462 02 Other manufacturing (15-20, 36-37) 22737 149687 13424 12199 793 13153 34536 2133 5929 3535 17223 0 275349 244861 0 1285 7193 6011 0 182427 171718 03 Material manufacturing (21-28) 23318 63535 318400 155028 11799 93115 28963 23759 18183 17775 25629 0 779503 69808 0 21910 18733 7360 0 348002 448076 04 Machinery manufacturing (29-35) 9319 7912 33015 312603 8042 26004 20843 16726 5305 9025 8342 0 457136 64516 0 2990 253720 9567 0 485826 522062 05 Utility (40-41) 8355 9483 24993 8512 86194 3507 9473 5593 7857 3004 18466 0 185437 73350 0 4871 1325 1213 0 9391 2028 06 Construction (45) 3409 3015 4856 3669 5446 140192 7984 3300 15956 16772 20538 0 225138 5515 0 5846 237934 -1354 0 13493 5641 07 Trade, hotels and restaurants (50-55) 8990 24580 42199 37063 5194 24417 35412 24420 9590 16847 20477 0 249188 185532 0 8756 31239 -535 0 125012 16104 08 Transport and communications (60-64) 7217 15011 24270 13165 4070 13950 26224 112802 10660 11330 13579 0 252277 89813 0 55780 1503 4 0 77219 40245 09 Finance, insurance and real estates (65-70) 5134 10974 14564 13684 6111 8644 41665 21043 36757 18298 16634 0 193509 142468 0 4055 930 -176 0 15368 19938 010 Business services (71-74) 6082 19150 23539 27573 5788 14033 63016 22775 35581 76271 38515 0 332322 12620 0 9746 20463 1893 0 52100 97158 011 Personal services (80-93) 3157 2199 2608 1958 2343 2015 4516 2804 5574 7718 36629 0 71521 77065 0 370635 4504 -226 0 31087 12738 012 Private households and extra-territorial org. (95-99) 0 0 0 0 0 0 0 0 0 0 0 0 0 274 0 0 0 0 0 0 0 0SBFD including Other Adjustments (Purchases onthe domestic territory by non-residents)
0 0 0 0 0 0 0 0 0 0 0 0 0 0 0 0 0 0 0 0 0 0
Noncomparable imports (cif/fob adj, Directpurchases abroad by residents)
0 0 0 0 0 0 0 0 0 0 0 0 0 0 0 0 0 0 0 0 0 0
Intermediate consumption /final use at basic prices 132630 400282 569178 586518 194192 344774 276554 236461 152089 181640 218300 0 3292618 1007667 0 487319 581396 23321 0 1375915 1452170 0Net taxes on products 1308 5612 17187 6084 336 4461 8415 10784 3784 2405 18736 0 79113 101171 0 1639 13810 0 0 9990 0 0Intermediate consumption /final use at purchasersprices
133938 405894 586365 592603 194527 349236 284969 247245 155873 184045 237036 0 3371731 1108838 0 488958 595206 23321 0 1385905 1452170 0
Value Added 103539 139516 210874 159087 79032 131695 298118 189103 180343 147943 304813 274 1944335 0 0 0 0 0 0 0 0 0Gross Operating Surplus (=net operating surplus +depreciation of fix capital)
54782 70293 106639 66129 56521 66979 167287 129339 140662 80762 97294 0 1036686 0 0 0 0 0 0 0 0 0
Compensation of Employees 52353 69361 103675 92577 21618 64077 129923 75961 43020 66534 207091 274 926464 0 0 0 0 0 0 0 0 0Net taxes on production -3596 -138 560 381 893 638 908 -16197 -3339 647 428 0 -18815 0 0 0 0 0 0 0 0 0Industry Output 237477 545409 797239 751690 273559 480930 583086 436348 336216 331987 541849 274 5316066 0 0 0 0 0 0 0 0 0
Czech Republic Intermediate Final consumption

DSTI/DOC(2006)8
31
Year: 2000 Type: Industry-by-industry symmetric, total Price Valuation: Basic price Currency: Mill. DKK
1 Primary 2 Othermanuf.
3 Materialmanuf.
4 Machinerymanuf.
5 Utility 6 Construction 7 Trade,hotels andrestaurants
8 Transport andcommunications
9 Finance,insurance andreal estates
10 Businessservices
11 Personalservices
12 Privatehouseholds
Total by household by non-profitorg. servinghouseholds
bygovernment
Gross fixedcapitalformation
Changes inInventories
Valuables Exports (less)Imports
Discrepancy
1 Primary (1-14) 13306.0 42066.0 17378.2 32.9 6857.8 1681.7 1055.9 21.9 18.4 68.4 1246.6 0.0 83733.7 6379.7 0.0 846.2 761.7 743.5 0.0 34909.6 19770.5 0.02 Other manufacturing (15-20, 36-37) 6306.5 33704.7 5340.8 2052.8 50.8 8550.4 9974.6 607.9 211.6 1170.9 4743.5 0.0 72714.6 60371.8 0.0 129.4 8695.3 2380.5 0.0 97334.4 67787.7 0.03 Material manufacturing (21-28) 7130.3 15438.1 56740.7 23420.8 516.8 26932.3 12479.9 6935.0 2112.7 13391.2 10254.6 0.0 175352.4 22151.1 0.0 2795.7 9613.3 3613.5 0.0 80493.1 93578.4 0.04 Machinery manufacturing (29-35) 700.1 3092.5 7292.7 39775.8 478.6 9408.8 5985.2 6361.7 472.3 2735.1 5623.4 0.0 81926.2 19866.6 0.0 834.1 62093.5 3848.6 0.0 82794.7 110284.1 0.05 Utility (40-41) 1039.4 2066.7 2933.2 863.8 2656.7 104.2 2947.1 814.3 449.1 657.7 3582.8 0.0 18114.9 17934.7 0.0 0.0 96.4 24.2 0.0 3671.0 480.4 0.06 Construction (45) 1135.7 711.9 837.2 504.3 2186.7 966.2 1520.5 5166.0 19668.7 603.0 5546.6 0.0 38846.9 3051.4 0.0 6206.5 105063.3 0.0 0.0 18.9 12.2 0.07 Trade, hotels and restaurants (50-55) 5088.4 10241.7 10504.3 9953.5 307.6 16807.0 17225.4 7036.3 1517.6 3865.9 7770.7 0.0 90318.2 122971.2 0.0 1947.1 20058.3 153.9 0.0 55027.7 7965.9 0.08 Transport and communications (60-64) 1663.6 5187.2 7518.6 2285.3 360.1 3846.8 28870.5 29572.4 3404.7 12322.9 16078.2 0.0 111110.3 30056.0 0.0 427.8 1639.7 0.8 0.0 118964.1 13343.2 0.09 Finance, insurance and real estates (65-70) 3790.1 2502.9 3002.3 2091.2 729.9 1549.9 18208.1 3947.4 28157.4 6996.7 9028.9 0.0 80004.8 150836.0 0.0 130.6 5685.4 0.0 0.0 9474.6 7775.1 0.010 Business services (71-74) 3487.7 6692.3 8302.7 4632.5 1320.6 19858.5 21344.0 11183.8 9855.2 24461.5 22824.4 0.0 133963.2 5228.2 0.0 4285.7 17360.8 67.3 0.0 19683.8 17489.8 0.011 Personal services (80-93) 1177.8 1448.2 2402.0 900.5 360.1 818.1 4479.5 2839.5 1377.9 7273.6 21379.3 0.0 44456.4 66553.6 0.0 305925.4 3094.5 1.0 0.0 2277.9 2070.5 0.012 Private households and extra-territorial org. (95-99) 0.0 0.0 0.0 0.0 0.0 0.0 0.0 0.0 0.0 0.0 0.0 0.0 0.0 1237.4 0.0 0.0 0.0 0.0 0.0 0.0 0.0 0.0SBFD including Other Adjustments (Purchases onthe domestic territory by non-residents)
0.0 0.0 0.0 0.0 0.0 0.0 0.0 0.0 0.0 0.0 0.0 0.0 0.0 0.0 0.0 0.0 0.0 0.0 0.0 0.0 0.0 0.0
Noncomparable imports (cif/fob adj, Directpurchases abroad by residents)
365.2 296.5 426.4 476.3 15.4 382.9 1748.5 79266.9 85.4 729.1 745.1 0.0 84537.6 -1330.4 0.0 0.0 32.5 807.0 0.0 31089.9 0.0 0.0
Intermediate consumption /final use at basic prices 45190.7 123448.6 122679.0 86989.6 15841.0 90906.7 125839.2 153753.1 67331.0 74276.0 108824.2 0.0 1015079.0 505307.4 0.0 323528.4 234194.6 11640.3 0.0 535739.8 340557.8 0.0Net taxes on products -132.3 632.7 1065.6 694.1 124.8 1229.9 4952.2 4429.0 9376.0 2296.1 19149.5 0.0 43817.7 111374.8 0.0 1570.5 28684.9 -435.9 0.0 -4335.3 0.0 0.0Intermediate consumption /final use at purchasersprices
45058.5 124081.2 123744.7 87683.6 15965.9 92136.6 130791.4 158182.2 76707.0 76572.1 127973.7 0.0 1058897.0 616682.2 0.0 325098.9 262879.5 11204.5 0.0 531404.6 340557.8 0.0
Value Added 62545.5 49757.0 76696.0 53396.0 23395.1 61038.1 151719.1 90673.4 161649.4 86527.1 292264.6 1237.4 1110898.0 0.0 0.0 0.0 0.0 0.0 0.0 0.0 0.0 0.0Gross Operating Surplus (=net operating surplus +depreciation of fix capital)
54153.5 15426.6 28222.3 16256.2 18222.9 16147.9 45181.8 41894.3 118567.9 25776.6 50023.0 0.0 429873.0 0.0 0.0 0.0 0.0 0.0 0.0 0.0 0.0 0.0
Compensation of Employees 8995.6 34651.0 48705.5 37944.5 5109.3 44952.1 106811.8 49678.8 36834.1 61603.4 245031.8 1237.4 681555.2 0.0 0.0 0.0 0.0 0.0 0.0 0.0 0.0 0.0Net taxes on production -603.6 -320.6 -231.8 -804.7 62.8 -61.9 -274.6 -899.7 6247.4 -853.0 -2790.2 0.0 -529.8 0.0 0.0 0.0 0.0 0.0 0.0 0.0 0.0 0.0Industry Output 107604.0 173838.2 200440.7 141079.6 39360.9 153174.7 282510.5 248855.5 238356.3 163099.1 420238.4 1237.4 2169795.0 0.0 0.0 0.0 0.0 0.0 0.0 0.0 0.0 0.0
Denmark Intermediate Final consumption
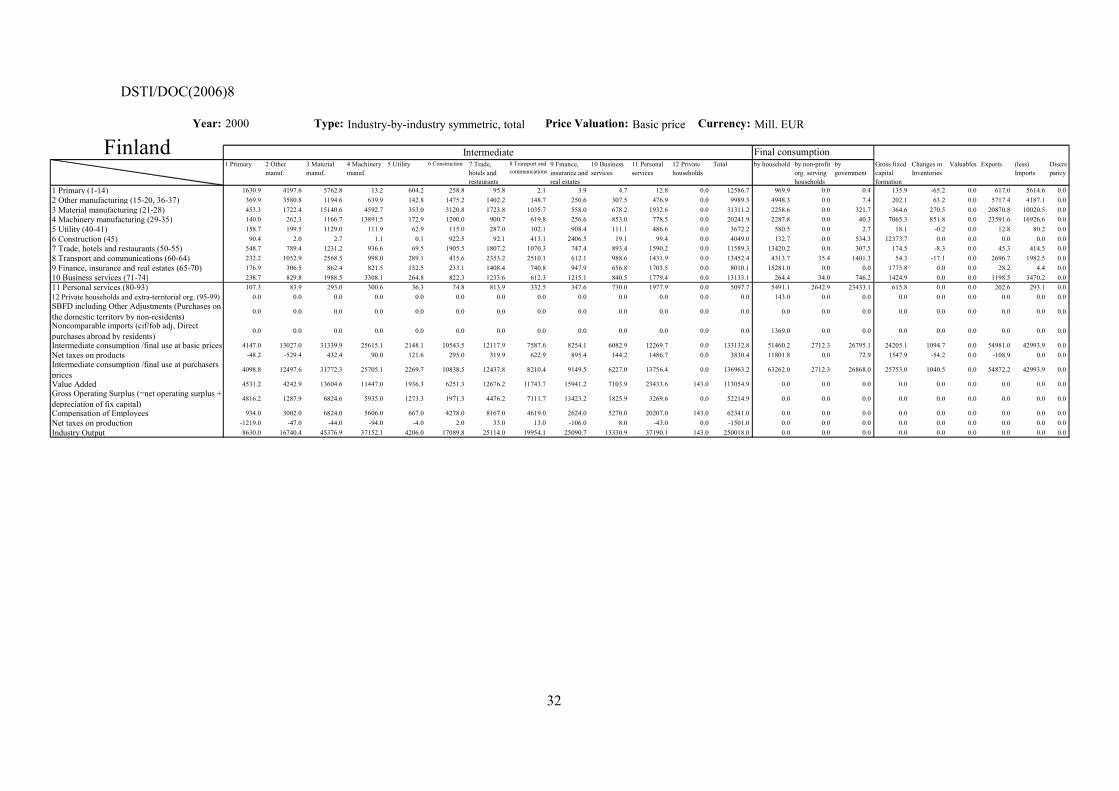
DSTI/DOC(2006)8
32
Year: 2000 Type: Industry-by-industry symmetric, total Price Valuation: Basic price Currency: Mill. EUR
1 Primary 2 Othermanuf.
3 Materialmanuf.
4 Machinerymanuf.
5 Utility 6 Construction 7 Trade,hotels andrestaurants
8 Transport andcommunications
9 Finance,insurance andreal estates
10 Businessservices
11 Personalservices
12 Privatehouseholds
Total by household by non-profitorg. servinghouseholds
bygovernment
Gross fixedcapitalformation
Changes inInventories
Valuables Exports (less)Imports
Discrepancy
1 Primary (1-14) 1630.9 4197.6 5762.8 13.2 604.2 258.8 95.8 2.1 3.9 4.7 12.8 0.0 12586.7 969.9 0.0 0.4 135.9 -65.2 0.0 617.0 5614.6 0.02 Other manufacturing (15-20, 36-37) 369.9 3580.8 1194.6 639.9 142.8 1475.2 1402.2 148.7 250.6 307.5 476.9 0.0 9989.3 4948.3 0.0 7.4 202.1 63.2 0.0 5717.4 4187.1 0.03 Material manufacturing (21-28) 453.3 1722.4 15140.6 4592.7 353.0 3120.8 1723.8 1035.7 558.0 678.2 1932.6 0.0 31311.2 2258.6 0.0 321.7 364.6 270.5 0.0 20870.8 10020.5 0.04 Machinery manufacturing (29-35) 140.0 262.3 1166.7 13891.5 172.9 1200.0 900.7 619.8 256.6 853.0 778.5 0.0 20241.9 2287.8 0.0 40.3 7065.3 851.8 0.0 23591.6 16926.6 0.05 Utility (40-41) 158.7 199.5 1129.0 111.9 62.9 115.0 287.0 102.1 908.4 111.1 486.6 0.0 3672.2 580.5 0.0 2.7 18.1 -0.2 0.0 12.8 80.2 0.06 Construction (45) 90.4 2.0 2.7 1.1 0.1 922.5 92.1 413.1 2406.5 19.1 99.4 0.0 4049.0 132.7 0.0 534.3 12373.7 0.0 0.0 0.0 0.0 0.07 Trade, hotels and restaurants (50-55) 548.7 789.4 1231.2 936.6 69.5 1905.5 1807.2 1070.3 747.4 893.4 1590.2 0.0 11589.3 13420.2 0.0 307.5 174.5 -8.3 0.0 45.3 414.5 0.08 Transport and communications (60-64) 232.2 1052.9 2568.5 998.0 289.1 415.6 2353.2 2510.1 612.1 988.6 1431.9 0.0 13452.4 4313.7 35.4 1401.3 54.3 -17.1 0.0 2696.7 1982.5 0.09 Finance, insurance and real estates (65-70) 176.9 306.5 862.4 821.5 152.5 233.1 1408.4 740.8 947.9 656.8 1703.5 0.0 8010.1 15281.0 0.0 0.0 1775.8 0.0 0.0 28.2 4.4 0.010 Business services (71-74) 238.7 829.8 1988.5 3308.1 264.8 822.3 1233.6 612.3 1215.1 840.5 1779.4 0.0 13133.1 264.4 34.0 746.2 1424.9 0.0 0.0 1198.5 3470.2 0.011 Personal services (80-93) 107.3 83.9 293.0 300.6 36.3 74.8 813.9 332.5 347.6 730.0 1977.9 0.0 5097.7 5491.1 2642.9 23433.1 615.8 0.0 0.0 202.6 293.1 0.012 Private households and extra-territorial org. (95-99) 0.0 0.0 0.0 0.0 0.0 0.0 0.0 0.0 0.0 0.0 0.0 0.0 0.0 143.0 0.0 0.0 0.0 0.0 0.0 0.0 0.0 0.0SBFD including Other Adjustments (Purchases onthe domestic territory by non-residents)
0.0 0.0 0.0 0.0 0.0 0.0 0.0 0.0 0.0 0.0 0.0 0.0 0.0 0.0 0.0 0.0 0.0 0.0 0.0 0.0 0.0 0.0
Noncomparable imports (cif/fob adj, Directpurchases abroad by residents)
0.0 0.0 0.0 0.0 0.0 0.0 0.0 0.0 0.0 0.0 0.0 0.0 0.0 1369.0 0.0 0.0 0.0 0.0 0.0 0.0 0.0 0.0
Intermediate consumption /final use at basic prices 4147.0 13027.0 31339.9 25615.1 2148.1 10543.5 12117.9 7587.6 8254.1 6082.9 12269.7 0.0 133132.8 51460.2 2712.3 26795.1 24205.1 1094.7 0.0 54981.0 42993.9 0.0Net taxes on products -48.2 -529.4 432.4 90.0 121.6 295.0 319.9 622.9 895.4 144.2 1486.7 0.0 3830.4 11801.8 0.0 72.9 1547.9 -54.2 0.0 -108.9 0.0 0.0Intermediate consumption /final use at purchasersprices
4098.8 12497.6 31772.3 25705.1 2269.7 10838.5 12437.8 8210.4 9149.5 6227.0 13756.4 0.0 136963.2 63262.0 2712.3 26868.0 25753.0 1040.5 0.0 54872.2 42993.9 0.0
Value Added 4531.2 4242.9 13604.6 11447.0 1936.3 6251.3 12676.2 11743.7 15941.2 7103.9 23433.6 143.0 113054.9 0.0 0.0 0.0 0.0 0.0 0.0 0.0 0.0 0.0Gross Operating Surplus (=net operating surplus +depreciation of fix capital)
4816.2 1287.9 6824.6 5935.0 1273.3 1971.3 4476.2 7111.7 13423.2 1825.9 3269.6 0.0 52214.9 0.0 0.0 0.0 0.0 0.0 0.0 0.0 0.0 0.0
Compensation of Employees 934.0 3002.0 6824.0 5606.0 667.0 4278.0 8167.0 4619.0 2624.0 5270.0 20207.0 143.0 62341.0 0.0 0.0 0.0 0.0 0.0 0.0 0.0 0.0 0.0Net taxes on production -1219.0 -47.0 -44.0 -94.0 -4.0 2.0 33.0 13.0 -106.0 8.0 -43.0 0.0 -1501.0 0.0 0.0 0.0 0.0 0.0 0.0 0.0 0.0 0.0Industry Output 8630.0 16740.4 45376.9 37152.1 4206.0 17089.8 25114.0 19954.1 25090.7 13330.9 37190.1 143.0 250018.0 0.0 0.0 0.0 0.0 0.0 0.0 0.0 0.0 0.0
Finland Intermediate Final consumption
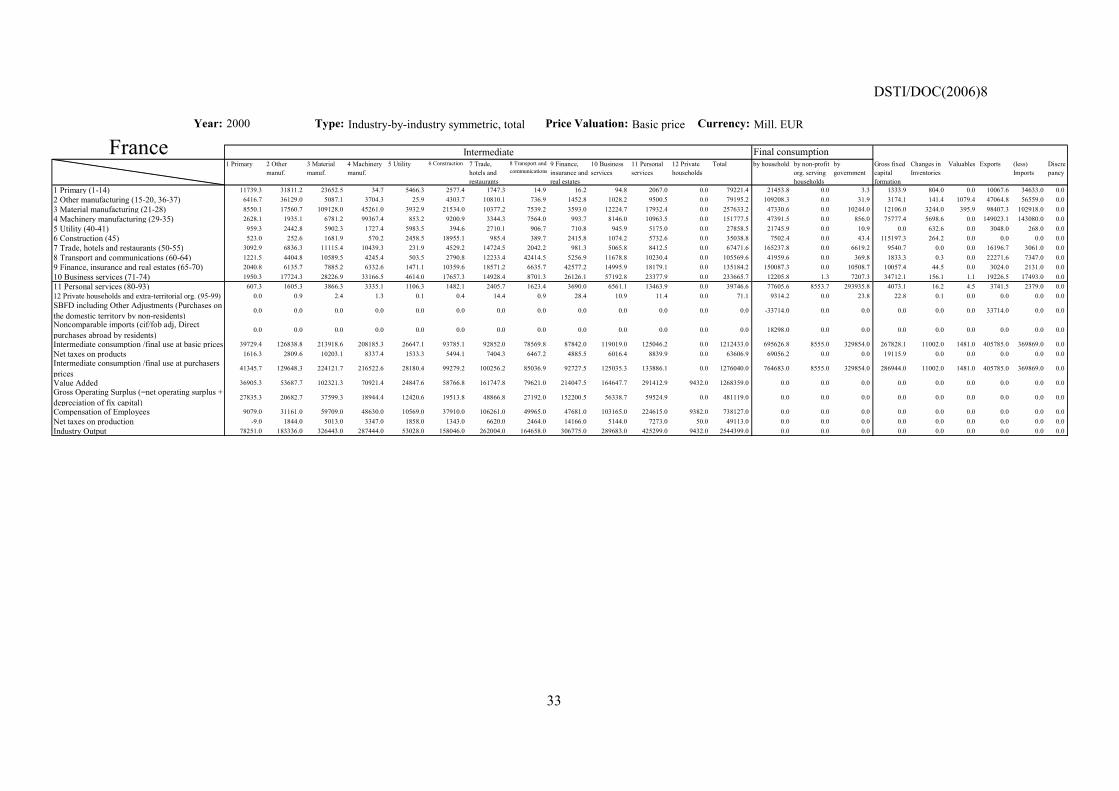
DSTI/DOC(2006)8
33
Year: 2000 Type: Industry-by-industry symmetric, total Price Valuation: Basic price Currency: Mill. EUR
1 Primary 2 Othermanuf.
3 Materialmanuf.
4 Machinerymanuf.
5 Utility 6 Construction 7 Trade,hotels andrestaurants
8 Transport andcommunications
9 Finance,insurance andreal estates
10 Businessservices
11 Personalservices
12 Privatehouseholds
Total by household by non-profitorg. servinghouseholds
bygovernment
Gross fixedcapitalformation
Changes inInventories
Valuables Exports (less)Imports
Discrepancy
1 Primary (1-14) 11739.3 31811.2 23652.5 34.7 5466.3 2577.4 1747.3 14.9 16.2 94.8 2067.0 0.0 79221.4 21453.8 0.0 3.3 1333.9 804.0 0.0 10067.6 34633.0 0.02 Other manufacturing (15-20, 36-37) 6416.7 36129.0 5087.1 3704.3 25.9 4303.7 10810.1 736.9 1452.8 1028.2 9500.5 0.0 79195.2 109208.3 0.0 31.9 3174.1 141.4 1079.4 47064.8 56559.0 0.03 Material manufacturing (21-28) 8550.1 17560.7 109128.0 45261.0 3932.9 21534.0 10377.2 7539.2 3593.0 12224.7 17932.4 0.0 257633.2 47330.6 0.0 10244.0 12106.0 3244.0 395.9 98407.3 102918.0 0.04 Machinery manufacturing (29-35) 2628.1 1935.1 6781.2 99367.4 853.2 9200.9 3344.3 7564.0 993.7 8146.0 10963.5 0.0 151777.5 47391.5 0.0 856.0 75777.4 5698.6 0.0 149023.1 143080.0 0.05 Utility (40-41) 959.3 2442.8 5902.3 1727.4 5983.5 394.6 2710.1 906.7 710.8 945.9 5175.0 0.0 27858.5 21745.9 0.0 10.9 0.0 632.6 0.0 3048.0 268.0 0.06 Construction (45) 523.0 252.6 1681.9 570.2 2458.5 18955.1 985.4 389.7 2415.8 1074.2 5732.6 0.0 35038.8 7502.4 0.0 43.4 115197.3 264.2 0.0 0.0 0.0 0.07 Trade, hotels and restaurants (50-55) 3092.9 6836.3 11115.4 10439.3 231.9 4529.2 14724.5 2042.2 981.3 5065.8 8412.5 0.0 67471.6 165237.8 0.0 6619.2 9540.7 0.0 0.0 16196.7 3061.0 0.08 Transport and communications (60-64) 1221.5 4404.8 10589.5 4245.4 503.5 2790.8 12233.4 42414.5 5256.9 11678.8 10230.4 0.0 105569.6 41959.6 0.0 369.8 1833.3 0.3 0.0 22271.6 7347.0 0.09 Finance, insurance and real estates (65-70) 2040.8 6135.7 7885.2 6332.6 1471.1 10359.6 18571.2 6635.7 42577.2 14995.9 18179.1 0.0 135184.2 150087.3 0.0 10508.7 10057.4 44.5 0.0 3024.0 2131.0 0.010 Business services (71-74) 1950.3 17724.3 28226.9 33166.5 4614.0 17657.3 14928.4 8701.3 26126.1 57192.8 23377.9 0.0 233665.7 12205.8 1.3 7207.3 34712.1 156.1 1.1 19226.5 17493.0 0.011 Personal services (80-93) 607.3 1605.3 3866.3 3335.1 1106.3 1482.1 2405.7 1623.4 3690.0 6561.1 13463.9 0.0 39746.6 77605.6 8553.7 293935.8 4073.1 16.2 4.5 3741.5 2379.0 0.012 Private households and extra-territorial org. (95-99) 0.0 0.9 2.4 1.3 0.1 0.4 14.4 0.9 28.4 10.9 11.4 0.0 71.1 9314.2 0.0 23.8 22.8 0.1 0.0 0.0 0.0 0.0SBFD including Other Adjustments (Purchases onthe domestic territory by non-residents)
0.0 0.0 0.0 0.0 0.0 0.0 0.0 0.0 0.0 0.0 0.0 0.0 0.0 -33714.0 0.0 0.0 0.0 0.0 0.0 33714.0 0.0 0.0
Noncomparable imports (cif/fob adj, Directpurchases abroad by residents)
0.0 0.0 0.0 0.0 0.0 0.0 0.0 0.0 0.0 0.0 0.0 0.0 0.0 18298.0 0.0 0.0 0.0 0.0 0.0 0.0 0.0 0.0
Intermediate consumption /final use at basic prices 39729.4 126838.8 213918.6 208185.3 26647.1 93785.1 92852.0 78569.8 87842.0 119019.0 125046.2 0.0 1212433.0 695626.8 8555.0 329854.0 267828.1 11002.0 1481.0 405785.0 369869.0 0.0Net taxes on products 1616.3 2809.6 10203.1 8337.4 1533.3 5494.1 7404.3 6467.2 4885.5 6016.4 8839.9 0.0 63606.9 69056.2 0.0 0.0 19115.9 0.0 0.0 0.0 0.0 0.0Intermediate consumption /final use at purchasersprices
41345.7 129648.3 224121.7 216522.6 28180.4 99279.2 100256.2 85036.9 92727.5 125035.3 133886.1 0.0 1276040.0 764683.0 8555.0 329854.0 286944.0 11002.0 1481.0 405785.0 369869.0 0.0
Value Added 36905.3 53687.7 102321.3 70921.4 24847.6 58766.8 161747.8 79621.0 214047.5 164647.7 291412.9 9432.0 1268359.0 0.0 0.0 0.0 0.0 0.0 0.0 0.0 0.0 0.0Gross Operating Surplus (=net operating surplus +depreciation of fix capital)
27835.3 20682.7 37599.3 18944.4 12420.6 19513.8 48866.8 27192.0 152200.5 56338.7 59524.9 0.0 481119.0 0.0 0.0 0.0 0.0 0.0 0.0 0.0 0.0 0.0
Compensation of Employees 9079.0 31161.0 59709.0 48630.0 10569.0 37910.0 106261.0 49965.0 47681.0 103165.0 224615.0 9382.0 738127.0 0.0 0.0 0.0 0.0 0.0 0.0 0.0 0.0 0.0Net taxes on production -9.0 1844.0 5013.0 3347.0 1858.0 1343.0 6620.0 2464.0 14166.0 5144.0 7273.0 50.0 49113.0 0.0 0.0 0.0 0.0 0.0 0.0 0.0 0.0 0.0Industry Output 78251.0 183336.0 326443.0 287444.0 53028.0 158046.0 262004.0 164658.0 306775.0 289683.0 425299.0 9432.0 2544399.0 0.0 0.0 0.0 0.0 0.0 0.0 0.0 0.0 0.0
France Intermediate Final consumption

DSTI/DOC(2006)8
34
Year: 2000 Type: Industry-by-industry symmetric, total Price Valuation: Basic price Currency: Mill. EUR
1 Primary 2 Othermanuf.
3 Materialmanuf.
4 Machinerymanuf.
5 Utility 6 Construction 7 Trade,hotels andrestaurants
8 Transport andcommunications
9 Finance,insurance andreal estates
10 Businessservices
11 Personalservices
12 Privatehouseholds
Total by household by non-profitorg. servinghouseholds
bygovernment
Gross fixedcapitalformation
Changes inInventories
Valuables Exports (less)Imports
Discrepancy
1 Primary (1-14) 2718.1 35960.4 31325.2 799.3 4974.1 2283.4 1716.7 378.5 890.7 393.9 2288.8 0.0 83729.1 20689.8 24.7 127.5 3156.4 161.1 0.0 5703.4 52917.0 0.02 Other manufacturing (15-20, 36-37) 4374.5 43347.5 7289.5 6715.9 108.1 8584.3 14610.0 527.9 634.5 610.4 8478.4 0.0 95280.9 145897.3 3.2 1269.1 10494.8 -1107.6 0.0 43103.3 73441.0 0.03 Material manufacturing (21-28) 6260.9 20203.8 155823.3 91274.0 3237.5 46371.2 18008.7 9427.8 3133.3 7826.5 16544.4 0.0 378111.2 69363.1 93.3 8462.6 19558.2 -3500.1 0.0 164653.7 149952.0 0.04 Machinery manufacturing (29-35) 2271.3 3544.6 13458.2 176105.1 4017.7 13667.8 9070.7 7065.4 1448.6 3512.2 12941.5 0.0 247103.1 74824.5 395.3 4033.4 144911.1 6412.6 0.0 260310.9 176171.0 0.05 Utility (40-41) 1641.1 3455.4 11377.5 4565.4 3089.4 508.9 5024.7 2326.9 1815.6 1488.3 5449.0 0.0 40742.2 24719.9 20.9 334.0 2916.2 0.6 0.0 1476.3 670.0 0.06 Construction (45) 1072.9 1139.7 3630.7 3079.8 1845.4 5559.5 3073.3 2332.6 18183.7 2258.5 7886.5 0.0 50062.4 4607.3 0.0 816.1 169157.6 13.1 0.0 2081.5 3578.0 0.07 Trade, hotels and restaurants (50-55) 3111.4 12413.8 16180.3 21302.4 1431.0 9775.9 23608.0 7293.6 1336.1 4076.9 11410.7 0.0 111940.1 225536.8 17.2 11369.9 14396.2 -71.2 0.0 34403.0 9782.0 0.08 Transport and communications (60-64) 1331.4 7203.2 15179.5 16333.3 1412.5 3693.1 12044.7 64052.3 4671.5 4622.0 12161.1 0.0 142704.5 69690.3 0.0 2966.3 5892.8 6.6 0.0 33646.4 23867.0 0.09 Finance, insurance and real estates (65-70) 1906.4 6504.7 14552.1 14897.2 3048.8 22751.9 40786.6 9386.1 79173.5 21704.9 22605.1 0.0 237317.3 241370.6 0.0 3591.9 3829.5 0.0 0.0 2972.6 13912.0 0.010 Business services (71-74) 5722.1 18510.2 41950.8 44075.8 6833.9 12964.0 29433.6 13544.0 50591.3 53838.3 29701.8 0.0 307165.8 12590.5 2107.0 5696.7 30206.8 67.3 0.0 19254.8 19169.0 0.011 Personal services (80-93) 2164.1 2402.1 8576.9 2544.1 4634.9 1500.3 9268.4 2316.4 4841.8 14094.1 34440.9 0.0 86784.0 107424.9 37068.4 342682.5 5480.4 -2.4 0.0 2826.2 9834.0 0.012 Private households and extra-territorial org. (95-99) 0.0 0.0 0.0 0.0 0.0 0.0 0.0 0.0 0.0 0.0 0.0 0.0 0.0 2610.0 0.0 0.0 0.0 0.0 0.0 0.0 0.0 0.0SBFD including Other Adjustments (Purchases onthe domestic territory by non-residents)
0.0 0.0 0.0 0.0 0.0 0.0 0.0 0.0 0.0 0.0 0.0 0.0 0.0 -21650.0 0.0 0.0 0.0 0.0 0.0 21650.0 0.0 0.0
Noncomparable imports (cif/fob adj, Directpurchases abroad by residents)
0.0 0.0 0.0 0.0 0.0 0.0 0.0 0.0 0.0 0.0 0.0 0.0 0.0 51830.0 0.0 0.0 0.0 -1280.0 0.0 2990.0 0.0 0.0
Intermediate consumption /final use at basic prices 32574.3 154685.5 319344.0 381692.3 34633.2 127660.3 166645.1 118651.5 166720.5 114426.1 163908.2 0.0 1780941.0 1029500.0 39730.0 381350.0 410000.0 700.0 0.0 595072.0 533293.0 0.0Net taxes on products 1316.8 866.0 2622.9 2489.3 822.7 1662.5 3748.9 5292.1 8959.8 1865.9 16352.1 0.0 45999.0 126990.0 0.0 4220.0 29990.0 0.0 0.0 -719.0 0.0 0.0Intermediate consumption /final use at purchasersprices
33891.1 155551.5 321966.9 384181.6 35456.0 129322.8 170394.0 123943.6 175680.3 116292.0 180260.3 0.0 1826940.0 1156490.0 39730.0 385570.0 439990.0 700.0 0.0 594353.0 533293.0 0.0
Value Added 26778.9 65948.5 164823.1 177638.4 34084.0 93837.2 217416.0 107096.4 299489.7 241628.0 392169.6 2610.0 1823520.0 0.0 0.0 0.0 0.0 0.0 0.0 0.0 0.0 0.0Gross Operating Surplus (=net operating surplus +depreciation of fix capital)
17208.9 20978.5 47323.1 23148.4 16614.0 27837.2 51196.0 46146.4 227049.7 139478.0 96229.7 0.0 713210.0 0.0 0.0 0.0 0.0 0.0 0.0 0.0 0.0 0.0
Compensation of Employees 15870.0 43810.0 114080.0 152750.0 15780.0 65210.0 158090.0 61370.0 64650.0 101660.0 304080.0 2610.0 1099960.0 0.0 0.0 0.0 0.0 0.0 0.0 0.0 0.0 0.0Net taxes on production -6300.0 1160.0 3420.0 1740.0 1690.0 790.0 8130.0 -420.0 7790.0 490.0 -8140.0 0.0 10350.0 0.0 0.0 0.0 0.0 0.0 0.0 0.0 0.0 0.0Industry Output 60670.0 221500.0 486790.0 561820.0 69540.0 223160.0 387810.0 231040.0 475170.0 357920.0 572430.0 2610.0 3650460.0 0.0 0.0 0.0 0.0 0.0 0.0 0.0 0.0 0.0
Germany Intermediate Final consumption

DSTI/DOC(2006)8
35
Year: 1999 Type: Industry-by-industry symmetric, total Price Valuation: Basic price Currency: Mill. EUR
1 Primary 2 Othermanuf.
3 Materialmanuf.
4 Machinerymanuf.
5 Utility 6 Construction 7 Trade,hotels andrestaurants
8 Transport andcommunications
9 Finance,insurance andreal estates
10 Businessservices
11 Personalservices
12 Privatehouseholds
Total by household by non-profitorg. servinghouseholds
bygovernment
Gross fixedcapitalformation
Changes inInventories
Valuables Exports (less)Imports
Discrepancy
1 Primary (1-14) 1547.3 5317.4 2094.3 2.0 318.5 181.9 635.9 5.3 2.9 0.6 112.1 0.0 10218.0 3855.0 0.0 0.0 68.8 219.2 0.0 1042.9 2802.4 0.02 Other manufacturing (15-20, 36-37) 323.4 2674.8 157.9 62.2 2.2 681.4 1953.5 34.6 32.0 54.5 319.2 0.0 6295.8 15529.8 0.0 0.0 184.0 -126.0 0.0 2776.3 5711.3 0.03 Material manufacturing (21-28) 768.0 1095.1 3368.4 417.1 229.3 3870.4 1185.2 537.6 276.9 91.8 942.3 0.0 12782.1 5010.0 0.0 0.0 93.6 -111.5 0.0 2311.6 7293.4 0.04 Machinery manufacturing (29-35) 105.1 47.4 119.5 552.5 44.8 843.1 507.3 237.3 5.0 39.2 1097.4 0.0 3598.7 1788.7 0.0 0.0 5806.6 -202.9 0.0 846.8 8949.8 0.05 Utility (40-41) 171.6 220.4 425.7 43.4 187.3 21.8 341.8 207.8 57.3 17.2 295.5 0.0 1989.8 1386.9 0.0 0.0 8.5 0.0 0.0 1.1 7.3 0.06 Construction (45) 38.8 4.0 6.0 1.2 18.8 71.8 161.5 46.2 912.4 10.5 308.0 0.0 1579.2 462.8 0.0 0.0 14029.0 0.0 0.0 287.7 578.7 0.07 Trade, hotels and restaurants (50-55) 566.2 2029.7 886.5 183.8 148.6 1042.6 1438.8 693.3 108.3 192.1 717.8 0.0 8007.5 19135.4 0.0 0.0 1232.9 0.0 0.0 8561.5 2157.4 0.08 Transport and communications (60-64) 68.3 168.1 97.4 27.1 12.0 24.9 2112.2 837.0 251.4 103.0 550.1 0.0 4251.5 4114.5 0.0 1.9 552.9 0.3 0.0 3237.9 964.1 0.09 Finance, insurance and real estates (65-70) 402.1 674.5 508.4 137.0 117.7 663.3 3601.6 509.4 1084.4 451.9 1620.8 0.0 9771.1 12593.7 0.0 0.0 89.5 0.0 0.0 137.1 302.5 0.010 Business services (71-74) 46.1 729.9 429.4 60.7 14.0 272.7 609.2 247.0 630.1 152.0 462.7 0.0 3653.7 294.7 0.0 73.9 997.9 0.0 0.0 1207.8 1271.2 0.011 Personal services (80-93) 4.9 33.2 35.5 5.5 3.9 5.9 524.0 204.4 75.5 207.2 777.6 0.0 1877.5 8746.1 321.2 17258.4 122.9 -1.6 0.0 178.6 799.0 0.012 Private households and extra-territorial org. (95-99) 0.0 0.0 0.0 0.0 0.0 0.0 0.0 0.0 0.0 0.0 0.0 0.0 0.0 364.4 0.0 0.0 0.0 0.0 0.0 0.0 0.0 0.0SBFD including Other Adjustments (Purchases onthe domestic territory by non-residents)
0.0 0.0 0.0 0.0 0.0 0.0 0.0 0.0 0.0 0.0 0.0 0.0 0.0 0.0 0.0 0.0 0.0 0.0 0.0 0.0 0.0 0.0
Noncomparable imports (cif/fob adj, Directpurchases abroad by residents)
0.0 0.0 0.0 0.0 0.0 0.0 0.0 0.0 0.0 0.0 0.0 0.0 0.0 0.0 0.0 0.0 0.0 0.0 0.0 0.0 0.0 0.0
Intermediate consumption /final use at basic prices 4041.8 12994.4 8129.0 1492.5 1096.9 7679.7 13070.9 3559.9 3436.2 1320.0 7203.5 0.0 64024.8 73282.1 321.2 17334.2 23186.5 -222.4 0.0 20589.3 30837.0 0.0Net taxes on products 143.7 3.8 659.2 134.9 225.3 944.4 816.0 613.3 401.4 141.3 599.6 0.0 4683.0 6153.0 0.0 0.0 1298.3 -150.1 0.0 1875.4 0.0 0.0Intermediate consumption /final use at purchasersprices
4185.5 12998.3 8788.2 1627.4 1322.2 8624.1 13886.8 4173.3 3837.7 1461.3 7803.1 0.0 68707.8 79435.1 321.2 17334.2 24484.8 -372.5 0.0 22464.7 30837.0 0.0
Value Added 8416.0 5950.3 4004.2 1260.8 2056.8 7156.0 20893.0 7021.7 18451.3 3495.7 19900.9 364.4 98971.1 0.0 0.0 0.0 0.0 0.0 0.0 0.0 0.0 0.0Gross Operating Surplus (=net operating surplus +depreciation of fix capital)
7626.8 2916.4 1513.7 305.8 946.5 4878.2 16764.2 3551.5 16008.4 2222.0 4131.6 0.0 60864.9 0.0 0.0 0.0 0.0 0.0 0.0 0.0 0.0 0.0
Compensation of Employees 1021.4 2943.1 2432.3 941.6 1095.5 2212.0 3965.1 3382.5 2313.5 1257.5 15685.4 364.4 37614.4 0.0 0.0 0.0 0.0 0.0 0.0 0.0 0.0 0.0Net taxes on production -232.2 90.7 58.3 13.3 14.8 65.7 163.8 87.8 129.5 16.1 84.0 0.0 491.7 0.0 0.0 0.0 0.0 0.0 0.0 0.0 0.0 0.0Industry Output 12601.4 18948.6 12792.4 2888.2 3379.0 15780.0 34779.9 11195.0 22289.0 4957.0 27704.0 364.4 167678.8 0.0 0.0 0.0 0.0 0.0 0.0 0.0 0.0 0.0
Greece Intermediate Final consumption
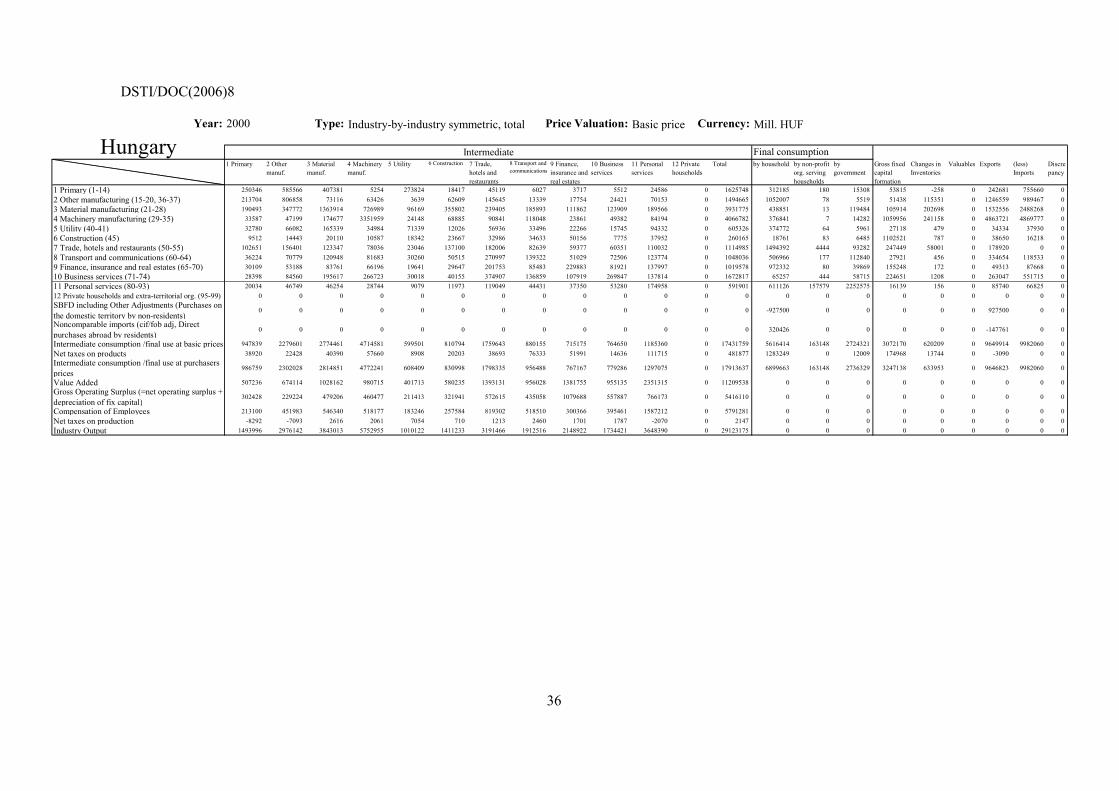
DSTI/DOC(2006)8
36
Year: 2000 Type: Industry-by-industry symmetric, total Price Valuation: Basic price Currency: Mill. HUF
1 Primary 2 Othermanuf.
3 Materialmanuf.
4 Machinerymanuf.
5 Utility 6 Construction 7 Trade,hotels andrestaurants
8 Transport andcommunications
9 Finance,insurance andreal estates
10 Businessservices
11 Personalservices
12 Privatehouseholds
Total by household by non-profitorg. servinghouseholds
bygovernment
Gross fixedcapitalformation
Changes inInventories
Valuables Exports (less)Imports
Discrepancy
1 Primary (1-14) 250346 585566 407381 5254 273824 18417 45119 6027 3717 5512 24586 0 1625748 312185 180 15308 53815 -258 0 242681 755660 02 Other manufacturing (15-20, 36-37) 213704 806858 73116 63426 3639 62609 145645 13339 17754 24421 70153 0 1494665 1052007 78 5519 51438 115351 0 1246559 989467 03 Material manufacturing (21-28) 190493 347772 1363914 726989 96169 355802 239405 185893 111862 123909 189566 0 3931775 438851 13 119484 105914 202698 0 1532556 2488268 04 Machinery manufacturing (29-35) 33587 47199 174677 3351959 24148 68885 90841 118048 23861 49382 84194 0 4066782 376841 7 14282 1059956 241158 0 4863721 4869777 05 Utility (40-41) 32780 66082 165339 34984 71339 12026 56936 33496 22266 15745 94332 0 605326 374772 64 5961 27118 479 0 34334 37930 06 Construction (45) 9512 14443 20110 10587 18342 23667 32986 34633 50156 7775 37952 0 260165 18761 83 6485 1102521 787 0 38650 16218 07 Trade, hotels and restaurants (50-55) 102651 156401 123347 78036 23046 137100 182006 82639 59377 60351 110032 0 1114985 1494392 4444 93282 247449 58001 0 178920 0 08 Transport and communications (60-64) 36224 70779 120948 81683 30260 50515 270997 139322 51029 72506 123774 0 1048036 506966 177 112840 27921 456 0 334654 118533 09 Finance, insurance and real estates (65-70) 30109 53188 83761 66196 19641 29647 201753 85483 229883 81921 137997 0 1019578 972332 80 39869 155248 172 0 49313 87668 010 Business services (71-74) 28398 84560 195617 266723 30018 40155 374907 136859 107919 269847 137814 0 1672817 65257 444 58715 224651 1208 0 263047 551715 011 Personal services (80-93) 20034 46749 46254 28744 9079 11973 119049 44431 37350 53280 174958 0 591901 611126 157579 2252575 16139 156 0 85740 66825 012 Private households and extra-territorial org. (95-99) 0 0 0 0 0 0 0 0 0 0 0 0 0 0 0 0 0 0 0 0 0 0SBFD including Other Adjustments (Purchases onthe domestic territory by non-residents)
0 0 0 0 0 0 0 0 0 0 0 0 0 -927500 0 0 0 0 0 927500 0 0
Noncomparable imports (cif/fob adj, Directpurchases abroad by residents)
0 0 0 0 0 0 0 0 0 0 0 0 0 320426 0 0 0 0 0 -147761 0 0
Intermediate consumption /final use at basic prices 947839 2279601 2774461 4714581 599501 810794 1759643 880155 715175 764650 1185360 0 17431759 5616414 163148 2724321 3072170 620209 0 9649914 9982060 0Net taxes on products 38920 22428 40390 57660 8908 20203 38693 76333 51991 14636 111715 0 481877 1283249 0 12009 174968 13744 0 -3090 0 0Intermediate consumption /final use at purchasersprices
986759 2302028 2814851 4772241 608409 830998 1798335 956488 767167 779286 1297075 0 17913637 6899663 163148 2736329 3247138 633953 0 9646823 9982060 0
Value Added 507236 674114 1028162 980715 401713 580235 1393131 956028 1381755 955135 2351315 0 11209538 0 0 0 0 0 0 0 0 0Gross Operating Surplus (=net operating surplus +depreciation of fix capital)
302428 229224 479206 460477 211413 321941 572615 435058 1079688 557887 766173 0 5416110 0 0 0 0 0 0 0 0 0
Compensation of Employees 213100 451983 546340 518177 183246 257584 819302 518510 300366 395461 1587212 0 5791281 0 0 0 0 0 0 0 0 0Net taxes on production -8292 -7093 2616 2061 7054 710 1213 2460 1701 1787 -2070 0 2147 0 0 0 0 0 0 0 0 0Industry Output 1493996 2976142 3843013 5752955 1010122 1411233 3191466 1912516 2148922 1734421 3648390 0 29123175 0 0 0 0 0 0 0 0 0
Hungary Intermediate Final consumption
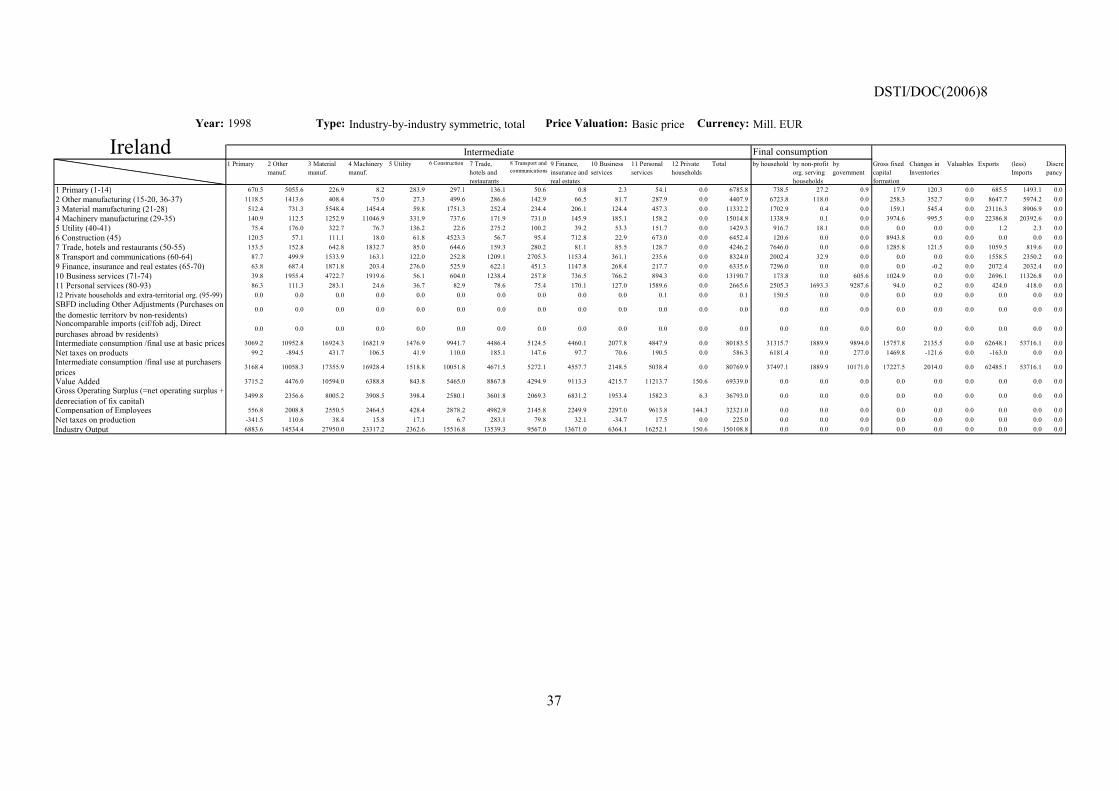
DSTI/DOC(2006)8
37
Year: 1998 Type: Industry-by-industry symmetric, total Price Valuation: Basic price Currency: Mill. EUR
1 Primary 2 Othermanuf.
3 Materialmanuf.
4 Machinerymanuf.
5 Utility 6 Construction 7 Trade,hotels andrestaurants
8 Transport andcommunications
9 Finance,insurance andreal estates
10 Businessservices
11 Personalservices
12 Privatehouseholds
Total by household by non-profitorg. servinghouseholds
bygovernment
Gross fixedcapitalformation
Changes inInventories
Valuables Exports (less)Imports
Discrepancy
1 Primary (1-14) 670.5 5055.6 226.9 8.2 283.9 297.1 136.1 50.6 0.8 2.3 54.1 0.0 6785.8 738.5 27.2 0.9 17.9 120.3 0.0 685.5 1493.1 0.02 Other manufacturing (15-20, 36-37) 1118.5 1413.6 408.4 75.0 27.3 499.6 286.6 142.9 66.5 81.7 287.9 0.0 4407.9 6723.8 118.0 0.0 258.3 352.7 0.0 8647.7 5974.2 0.03 Material manufacturing (21-28) 512.4 731.3 5548.4 1454.4 59.8 1751.3 252.4 234.4 206.1 124.4 457.3 0.0 11332.2 1702.9 0.4 0.0 159.1 545.4 0.0 23116.3 8906.9 0.04 Machinery manufacturing (29-35) 140.9 112.5 1252.9 11046.9 331.9 737.6 171.9 731.0 145.9 185.1 158.2 0.0 15014.8 1338.9 0.1 0.0 3974.6 995.5 0.0 22386.8 20392.6 0.05 Utility (40-41) 75.4 176.0 322.7 76.7 136.2 22.6 275.2 100.2 39.2 53.3 151.7 0.0 1429.3 916.7 18.1 0.0 0.0 0.0 0.0 1.2 2.3 0.06 Construction (45) 120.5 57.1 111.1 18.0 61.8 4523.3 56.7 95.4 712.8 22.9 673.0 0.0 6452.4 120.6 0.0 0.0 8943.8 0.0 0.0 0.0 0.0 0.07 Trade, hotels and restaurants (50-55) 153.5 152.8 642.8 1832.7 85.0 644.6 159.3 280.2 81.1 85.5 128.7 0.0 4246.2 7646.0 0.0 0.0 1285.8 121.5 0.0 1059.5 819.6 0.08 Transport and communications (60-64) 87.7 499.9 1533.9 163.1 122.0 252.8 1209.1 2705.3 1153.4 361.1 235.6 0.0 8324.0 2002.4 32.9 0.0 0.0 0.0 0.0 1558.5 2350.2 0.09 Finance, insurance and real estates (65-70) 63.8 687.4 1871.8 203.4 276.0 525.9 622.1 451.3 1147.8 268.4 217.7 0.0 6335.6 7296.0 0.0 0.0 0.0 -0.2 0.0 2072.4 2032.4 0.010 Business services (71-74) 39.8 1955.4 4722.7 1919.6 56.1 604.0 1238.4 257.8 736.5 766.2 894.3 0.0 13190.7 173.8 0.0 605.6 1024.9 0.0 0.0 2696.1 11326.8 0.011 Personal services (80-93) 86.3 111.3 283.1 24.6 36.7 82.9 78.6 75.4 170.1 127.0 1589.6 0.0 2665.6 2505.3 1693.3 9287.6 94.0 0.2 0.0 424.0 418.0 0.012 Private households and extra-territorial org. (95-99) 0.0 0.0 0.0 0.0 0.0 0.0 0.0 0.0 0.0 0.0 0.1 0.0 0.1 150.5 0.0 0.0 0.0 0.0 0.0 0.0 0.0 0.0SBFD including Other Adjustments (Purchases onthe domestic territory by non-residents)
0.0 0.0 0.0 0.0 0.0 0.0 0.0 0.0 0.0 0.0 0.0 0.0 0.0 0.0 0.0 0.0 0.0 0.0 0.0 0.0 0.0 0.0
Noncomparable imports (cif/fob adj, Directpurchases abroad by residents)
0.0 0.0 0.0 0.0 0.0 0.0 0.0 0.0 0.0 0.0 0.0 0.0 0.0 0.0 0.0 0.0 0.0 0.0 0.0 0.0 0.0 0.0
Intermediate consumption /final use at basic prices 3069.2 10952.8 16924.3 16821.9 1476.9 9941.7 4486.4 5124.5 4460.1 2077.8 4847.9 0.0 80183.5 31315.7 1889.9 9894.0 15757.8 2135.5 0.0 62648.1 53716.1 0.0Net taxes on products 99.2 -894.5 431.7 106.5 41.9 110.0 185.1 147.6 97.7 70.6 190.5 0.0 586.3 6181.4 0.0 277.0 1469.8 -121.6 0.0 -163.0 0.0 0.0Intermediate consumption /final use at purchasersprices
3168.4 10058.3 17355.9 16928.4 1518.8 10051.8 4671.5 5272.1 4557.7 2148.5 5038.4 0.0 80769.9 37497.1 1889.9 10171.0 17227.5 2014.0 0.0 62485.1 53716.1 0.0
Value Added 3715.2 4476.0 10594.0 6388.8 843.8 5465.0 8867.8 4294.9 9113.3 4215.7 11213.7 150.6 69339.0 0.0 0.0 0.0 0.0 0.0 0.0 0.0 0.0 0.0Gross Operating Surplus (=net operating surplus +depreciation of fix capital)
3499.8 2356.6 8005.2 3908.5 398.4 2580.1 3601.8 2069.3 6831.2 1953.4 1582.3 6.3 36793.0 0.0 0.0 0.0 0.0 0.0 0.0 0.0 0.0 0.0
Compensation of Employees 556.8 2008.8 2550.5 2464.5 428.4 2878.2 4982.9 2145.8 2249.9 2297.0 9613.8 144.3 32321.0 0.0 0.0 0.0 0.0 0.0 0.0 0.0 0.0 0.0Net taxes on production -341.5 110.6 38.4 15.8 17.1 6.7 283.1 79.8 32.1 -34.7 17.5 0.0 225.0 0.0 0.0 0.0 0.0 0.0 0.0 0.0 0.0 0.0Industry Output 6883.6 14534.4 27950.0 23317.2 2362.6 15516.8 13539.3 9567.0 13671.0 6364.1 16252.1 150.6 150108.8 0.0 0.0 0.0 0.0 0.0 0.0 0.0 0.0 0.0
Ireland Intermediate Final consumption
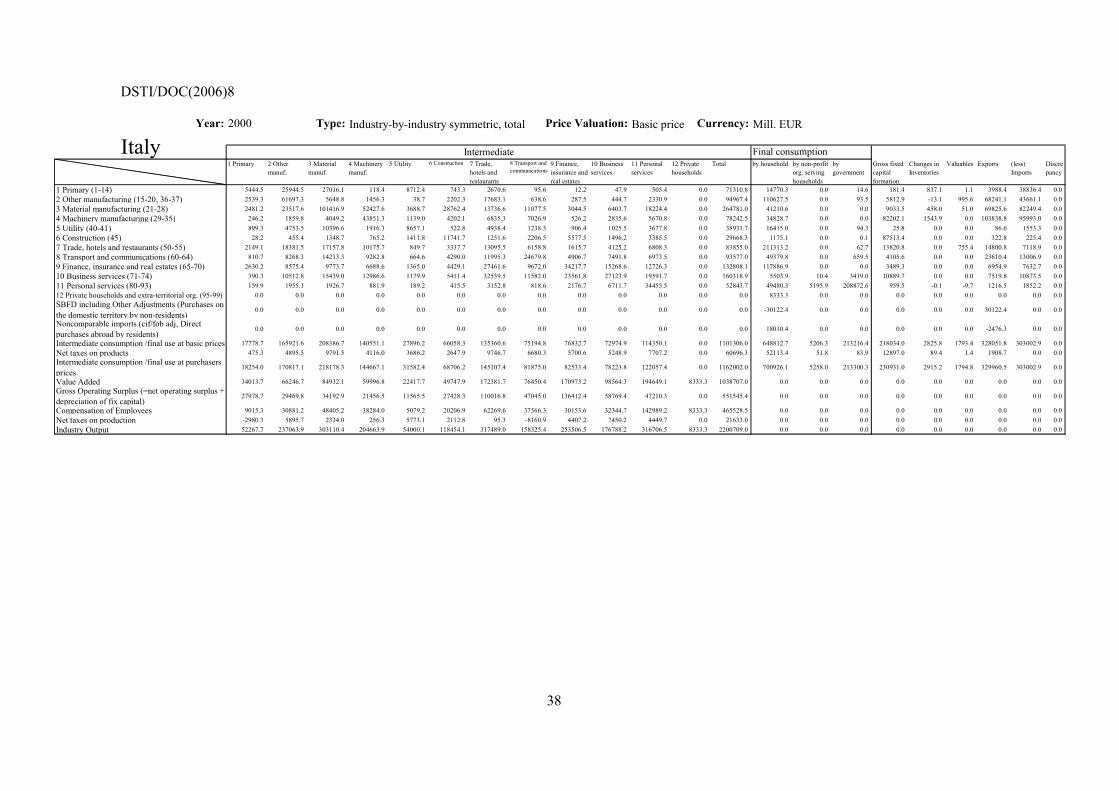
DSTI/DOC(2006)8
38
Year: 2000 Type: Industry-by-industry symmetric, total Price Valuation: Basic price Currency: Mill. EUR
1 Primary 2 Othermanuf.
3 Materialmanuf.
4 Machinerymanuf.
5 Utility 6 Construction 7 Trade,hotels andrestaurants
8 Transport andcommunications
9 Finance,insurance andreal estates
10 Businessservices
11 Personalservices
12 Privatehouseholds
Total by household by non-profitorg. servinghouseholds
bygovernment
Gross fixedcapitalformation
Changes inInventories
Valuables Exports (less)Imports
Discrepancy
1 Primary (1-14) 5444.5 25944.5 27016.1 118.4 8712.4 743.3 2670.6 95.6 12.2 47.9 505.4 0.0 71310.8 14770.3 0.0 14.6 181.4 837.1 1.1 3988.4 38836.4 0.02 Other manufacturing (15-20, 36-37) 2539.3 61697.3 5648.8 1456.3 38.7 2202.3 17683.1 638.6 287.5 444.7 2330.9 0.0 94967.4 110627.5 0.0 93.5 5812.9 -13.1 995.6 68241.1 43661.1 0.03 Material manufacturing (21-28) 2481.2 23517.6 101416.9 52427.6 3688.7 28762.4 13736.6 11077.5 3044.5 6403.7 18224.4 0.0 264781.0 41210.6 0.0 0.0 9033.5 458.0 51.0 69825.6 82249.4 0.04 Machinery manufacturing (29-35) 246.2 1859.8 4049.2 43851.3 1139.0 4202.1 6835.3 7026.9 526.2 2835.6 5670.8 0.0 78242.5 34828.7 0.0 0.0 82202.1 1543.9 0.0 103838.8 95993.0 0.05 Utility (40-41) 899.3 4753.5 10396.6 1916.3 8657.1 522.8 4938.4 1238.3 906.4 1025.5 3677.8 0.0 38931.7 16415.0 0.0 94.3 25.8 0.0 0.0 86.6 1553.3 0.06 Construction (45) 28.2 455.4 1348.7 765.2 1411.8 11741.7 1251.6 2206.5 5577.5 1496.2 3385.5 0.0 29668.3 1175.1 0.0 0.1 87513.4 0.0 0.0 322.8 225.4 0.07 Trade, hotels and restaurants (50-55) 2149.1 18381.5 17157.8 10175.7 849.7 3337.7 13095.5 6158.8 1615.7 4125.2 6808.3 0.0 83855.0 211313.2 0.0 62.7 13820.8 0.0 755.4 14800.8 7118.9 0.08 Transport and communications (60-64) 810.7 8268.3 14213.3 9282.8 664.6 4290.0 11995.3 24679.8 4906.7 7491.8 6973.5 0.0 93577.0 49379.8 0.0 659.5 4105.6 0.0 0.0 23610.4 13006.9 0.09 Finance, insurance and real estates (65-70) 2630.2 8575.4 9773.7 6688.6 1365.0 4429.1 27461.6 9672.0 34217.7 15268.6 12726.3 0.0 132808.1 117886.9 0.0 0.0 3489.3 0.0 0.0 6954.9 7632.7 0.010 Business services (71-74) 390.3 10512.8 15439.0 12986.6 1179.9 5411.4 32539.5 11582.0 23561.8 27123.9 19591.7 0.0 160318.9 5503.9 10.4 3419.0 10889.7 0.0 0.0 7519.8 10873.5 0.011 Personal services (80-93) 159.9 1955.1 1926.7 881.9 189.2 415.5 3152.8 818.6 2176.7 6711.7 34455.5 0.0 52843.7 49480.3 5195.9 208872.6 959.5 -0.1 -9.7 1216.5 1852.2 0.012 Private households and extra-territorial org. (95-99) 0.0 0.0 0.0 0.0 0.0 0.0 0.0 0.0 0.0 0.0 0.0 0.0 0.0 8333.3 0.0 0.0 0.0 0.0 0.0 0.0 0.0 0.0SBFD including Other Adjustments (Purchases onthe domestic territory by non-residents)
0.0 0.0 0.0 0.0 0.0 0.0 0.0 0.0 0.0 0.0 0.0 0.0 0.0 -30122.4 0.0 0.0 0.0 0.0 0.0 30122.4 0.0 0.0
Noncomparable imports (cif/fob adj, Directpurchases abroad by residents)
0.0 0.0 0.0 0.0 0.0 0.0 0.0 0.0 0.0 0.0 0.0 0.0 0.0 18010.4 0.0 0.0 0.0 0.0 0.0 -2476.3 0.0 0.0
Intermediate consumption /final use at basic prices 17778.7 165921.6 208386.7 140551.1 27896.2 66058.3 135360.6 75194.8 76832.7 72974.9 114350.1 0.0 1101306.0 648812.7 5206.3 213216.4 218034.0 2825.8 1793.4 328051.8 303002.9 0.0Net taxes on products 475.3 4895.5 9791.5 4116.0 3686.2 2647.9 9746.7 6680.3 5700.6 5248.9 7707.2 0.0 60696.3 52113.4 51.8 83.9 12897.0 89.4 1.4 1908.7 0.0 0.0Intermediate consumption /final use at purchasersprices
18254.0 170817.1 218178.3 144667.1 31582.4 68706.2 145107.4 81875.0 82533.4 78223.8 122057.4 0.0 1162002.0 700926.1 5258.0 213300.3 230931.0 2915.2 1794.8 329960.5 303002.9 0.0
Value Added 34013.7 66246.7 84932.1 59996.8 22417.7 49747.9 172381.7 76450.4 170973.2 98564.3 194649.1 8333.3 1038707.0 0.0 0.0 0.0 0.0 0.0 0.0 0.0 0.0 0.0Gross Operating Surplus (=net operating surplus +depreciation of fix capital)
27978.7 29469.8 34192.9 21456.5 11565.5 27428.3 110016.8 47045.0 136412.4 58769.4 47210.3 0.0 551545.4 0.0 0.0 0.0 0.0 0.0 0.0 0.0 0.0 0.0
Compensation of Employees 9015.3 30881.2 48405.2 38284.0 5079.2 20206.9 62269.6 37566.3 30153.6 32344.7 142989.2 8333.3 465528.5 0.0 0.0 0.0 0.0 0.0 0.0 0.0 0.0 0.0Net taxes on production -2980.3 5895.7 2334.0 256.3 5773.1 2112.8 95.3 -8160.9 4407.2 7450.2 4449.7 0.0 21633.0 0.0 0.0 0.0 0.0 0.0 0.0 0.0 0.0 0.0Industry Output 52267.7 237063.9 303110.4 204663.9 54000.1 118454.1 317489.0 158325.4 253506.5 176788.2 316706.5 8333.3 2200709.0 0.0 0.0 0.0 0.0 0.0 0.0 0.0 0.0 0.0
Italy Intermediate Final consumption
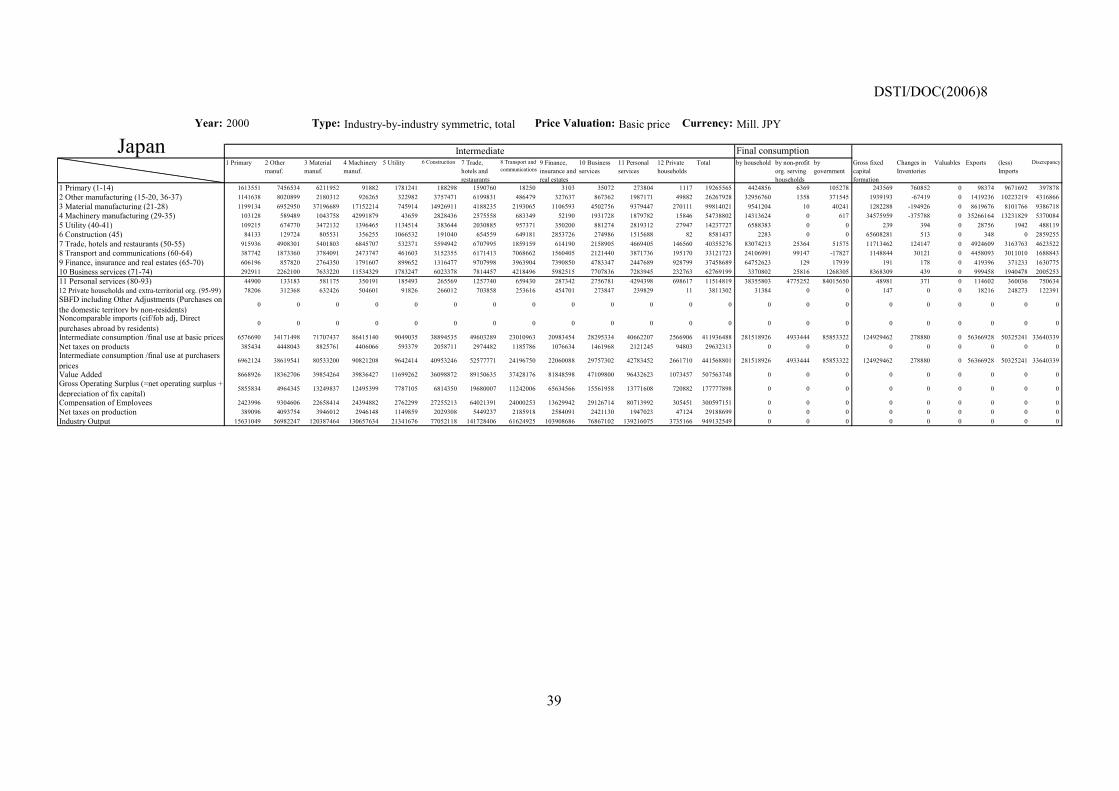
DSTI/DOC(2006)8
39
Year: 2000 Type: Industry-by-industry symmetric, total Price Valuation: Basic price Currency: Mill. JPY
1 Primary 2 Othermanuf.
3 Materialmanuf.
4 Machinerymanuf.
5 Utility 6 Construction 7 Trade,hotels andrestaurants
8 Transport andcommunications
9 Finance,insurance andreal estates
10 Businessservices
11 Personalservices
12 Privatehouseholds
Total by household by non-profitorg. servinghouseholds
bygovernment
Gross fixedcapitalformation
Changes inInventories
Valuables Exports (less)Imports
Discrepancy
1 Primary (1-14) 1613551 7456534 6211952 91882 1781241 188298 1590760 18250 3103 35072 273804 1117 19265565 4424856 6369 105278 243569 760852 0 98374 9671692 3978782 Other manufacturing (15-20, 36-37) 1141638 8020899 2180312 926265 322982 3757471 6199831 486479 327637 867362 1987171 49882 26267928 32956760 1358 371545 1939193 -67419 0 1419236 10223219 43168663 Material manufacturing (21-28) 1199134 6952950 37196689 17152214 745914 14926911 4188235 2193065 1106593 4502756 9379447 270111 99814021 9541204 10 40241 1282288 -194926 0 8619676 8101766 93867184 Machinery manufacturing (29-35) 103128 589489 1043758 42991879 43659 2828436 2575558 683349 52190 1931728 1879782 15846 54738802 14313624 0 617 34575959 -375788 0 35266164 13231829 53700845 Utility (40-41) 109215 674770 3472132 1396465 1134514 383644 2030885 957371 350200 881274 2819312 27947 14237727 6588383 0 0 239 394 0 28756 1942 4881196 Construction (45) 84133 129724 805531 356255 1066532 191040 654559 649181 2853726 274986 1515688 82 8581437 2283 0 0 65608281 513 0 348 0 28592557 Trade, hotels and restaurants (50-55) 915936 4908301 5401803 6845707 532371 5594942 6707995 1859159 614190 2158905 4669405 146560 40355276 83074213 25364 51575 11713462 124147 0 4924609 3163763 46235228 Transport and communications (60-64) 387742 1873360 3784091 2473747 461603 3152355 6171413 7068662 1560405 2121440 3871736 195170 33121723 24106991 99147 -17827 1148844 30121 0 4458093 3011010 16888439 Finance, insurance and real estates (65-70) 606196 857820 2764350 1791607 899652 1316477 9707998 3963904 7390850 4783347 2447689 928799 37458689 64752623 129 17939 191 178 0 419396 371233 163077510 Business services (71-74) 292911 2262100 7633220 11534329 1783247 6023378 7814457 4218496 5982515 7707836 7283945 232763 62769199 3370802 25816 1268305 8368309 439 0 999458 1940478 200525311 Personal services (80-93) 44900 133183 581175 350191 185493 265569 1257740 659430 287342 2756781 4294398 698617 11514819 38355803 4775252 84015650 48981 371 0 114602 360036 75063412 Private households and extra-territorial org. (95-99) 78206 312368 632426 504601 91826 266012 703858 253616 454701 273847 239829 11 3811302 31384 0 0 147 0 0 18216 248273 122391SBFD including Other Adjustments (Purchases onthe domestic territory by non-residents)
0 0 0 0 0 0 0 0 0 0 0 0 0 0 0 0 0 0 0 0 0 0
Noncomparable imports (cif/fob adj, Directpurchases abroad by residents)
0 0 0 0 0 0 0 0 0 0 0 0 0 0 0 0 0 0 0 0 0 0
Intermediate consumption /final use at basic prices 6576690 34171498 71707437 86415140 9049035 38894535 49603289 23010963 20983454 28295334 40662207 2566906 411936488 281518926 4933444 85853322 124929462 278880 0 56366928 50325241 33640339Net taxes on products 385434 4448043 8825761 4406066 593379 2058711 2974482 1185786 1076634 1461968 2121245 94803 29632313 0 0 0 0 0 0 0 0 0Intermediate consumption /final use at purchasersprices
6962124 38619541 80533200 90821208 9642414 40953246 52577771 24196750 22060088 29757302 42783452 2661710 441568801 281518926 4933444 85853322 124929462 278880 0 56366928 50325241 33640339
Value Added 8668926 18362706 39854264 39836427 11699262 36098872 89150635 37428176 81848598 47109800 96432623 1073457 507563748 0 0 0 0 0 0 0 0 0Gross Operating Surplus (=net operating surplus +depreciation of fix capital)
5855834 4964345 13249837 12495399 7787105 6814350 19680007 11242006 65634566 15561958 13771608 720882 177777898 0 0 0 0 0 0 0 0 0
Compensation of Employees 2423996 9304606 22658414 24394882 2762299 27255213 64021391 24000253 13629942 29126714 80713992 305451 300597151 0 0 0 0 0 0 0 0 0Net taxes on production 389096 4093754 3946012 2946148 1149859 2029308 5449237 2185918 2584091 2421130 1947023 47124 29188699 0 0 0 0 0 0 0 0 0Industry Output 15631049 56982247 120387464 130657634 21341676 77052118 141728406 61624925 103908686 76867102 139216075 3735166 949132549 0 0 0 0 0 0 0 0 0
Japan Intermediate Final consumption
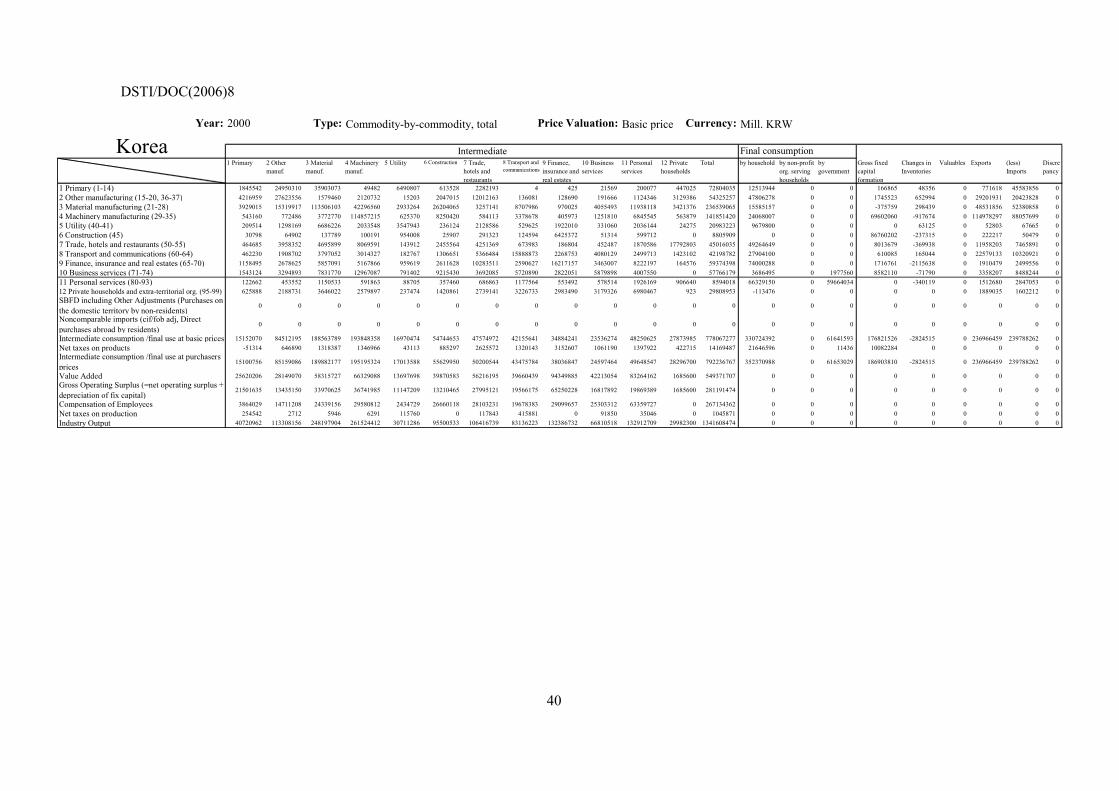
DSTI/DOC(2006)8
40
Year: 2000 Type: Commodity-by-commodity, total Price Valuation: Basic price Currency: Mill. KRW
1 Primary 2 Othermanuf.
3 Materialmanuf.
4 Machinerymanuf.
5 Utility 6 Construction 7 Trade,hotels andrestaurants
8 Transport andcommunications
9 Finance,insurance andreal estates
10 Businessservices
11 Personalservices
12 Privatehouseholds
Total by household by non-profitorg. servinghouseholds
bygovernment
Gross fixedcapitalformation
Changes inInventories
Valuables Exports (less)Imports
Discrepancy
1 Primary (1-14) 1845542 24950310 35903073 49482 6490807 613528 2282193 4 425 21569 200077 447025 72804035 12513944 0 0 166865 48356 0 771618 45583856 02 Other manufacturing (15-20, 36-37) 4216959 27623556 1579460 2120732 15203 2047015 12012163 136081 128690 191666 1124346 3129386 54325257 47806278 0 0 1745523 652994 0 29201931 20423828 03 Material manufacturing (21-28) 3929015 15319917 113506103 42296560 2933264 26204065 3257141 8707986 970025 4055493 11938118 3421376 236539065 15585157 0 0 -375759 298439 0 48531856 52380858 04 Machinery manufacturing (29-35) 543160 772486 3772770 114857215 625370 8250420 584113 3378678 405973 1251810 6845545 563879 141851420 24068007 0 0 69602060 -917674 0 114978297 88057699 05 Utility (40-41) 209514 1298169 6686226 2033548 3547943 236124 2128586 529625 1922010 331060 2036144 24275 20983223 9679800 0 0 0 63125 0 52803 67665 06 Construction (45) 30798 64902 137789 100191 954008 25907 291323 124594 6425372 51314 599712 0 8805909 0 0 0 86760202 -237315 0 222217 50479 07 Trade, hotels and restaurants (50-55) 464685 3958352 4695899 8069591 143912 2455564 4251369 673983 186804 452487 1870586 17792803 45016035 49264649 0 0 8013679 -369938 0 11958203 7465891 08 Transport and communications (60-64) 462230 1908702 3797052 3014327 182767 1306651 5366484 15888873 2268753 4080129 2499713 1423102 42198782 27904100 0 0 610085 165044 0 22579133 10320921 09 Finance, insurance and real estates (65-70) 1158495 2678625 5857091 5167866 959619 2611628 10283511 2590627 16217157 3463007 8222197 164576 59374398 74000288 0 0 1716761 -2115638 0 1910479 2499556 010 Business services (71-74) 1543124 3294893 7831770 12967087 791402 9215430 3692085 5720890 2822051 5879898 4007550 0 57766179 3686495 0 1977560 8582110 -71790 0 3358207 8488244 011 Personal services (80-93) 122662 453552 1150533 591863 88705 357460 686863 1177564 553492 578514 1926169 906640 8594018 66329150 0 59664034 0 -340119 0 1512680 2847053 012 Private households and extra-territorial org. (95-99) 625888 2188731 3646022 2579897 237474 1420861 2739141 3226733 2983490 3179326 6980467 923 29808953 -113476 0 0 0 0 0 1889035 1602212 0SBFD including Other Adjustments (Purchases onthe domestic territory by non-residents)
0 0 0 0 0 0 0 0 0 0 0 0 0 0 0 0 0 0 0 0 0 0
Noncomparable imports (cif/fob adj, Directpurchases abroad by residents)
0 0 0 0 0 0 0 0 0 0 0 0 0 0 0 0 0 0 0 0 0 0
Intermediate consumption /final use at basic prices 15152070 84512195 188563789 193848358 16970474 54744653 47574972 42155641 34884241 23536274 48250625 27873985 778067277 330724392 0 61641593 176821526 -2824515 0 236966459 239788262 0Net taxes on products -51314 646890 1318387 1346966 43113 885297 2625572 1320143 3152607 1061190 1397922 422715 14169487 21646596 0 11436 10082284 0 0 0 0 0Intermediate consumption /final use at purchasersprices
15100756 85159086 189882177 195195324 17013588 55629950 50200544 43475784 38036847 24597464 49648547 28296700 792236767 352370988 0 61653029 186903810 -2824515 0 236966459 239788262 0
Value Added 25620206 28149070 58315727 66329088 13697698 39870583 56216195 39660439 94349885 42213054 83264162 1685600 549371707 0 0 0 0 0 0 0 0 0Gross Operating Surplus (=net operating surplus +depreciation of fix capital)
21501635 13435150 33970625 36741985 11147209 13210465 27995121 19566175 65250228 16817892 19869389 1685600 281191474 0 0 0 0 0 0 0 0 0
Compensation of Employees 3864029 14711208 24339156 29580812 2434729 26660118 28103231 19678383 29099657 25303312 63359727 0 267134362 0 0 0 0 0 0 0 0 0Net taxes on production 254542 2712 5946 6291 115760 0 117843 415881 0 91850 35046 0 1045871 0 0 0 0 0 0 0 0 0Industry Output 40720962 113308156 248197904 261524412 30711286 95500533 106416739 83136223 132386732 66810518 132912709 29982300 1341608474 0 0 0 0 0 0 0 0 0
Korea Intermediate Final consumption
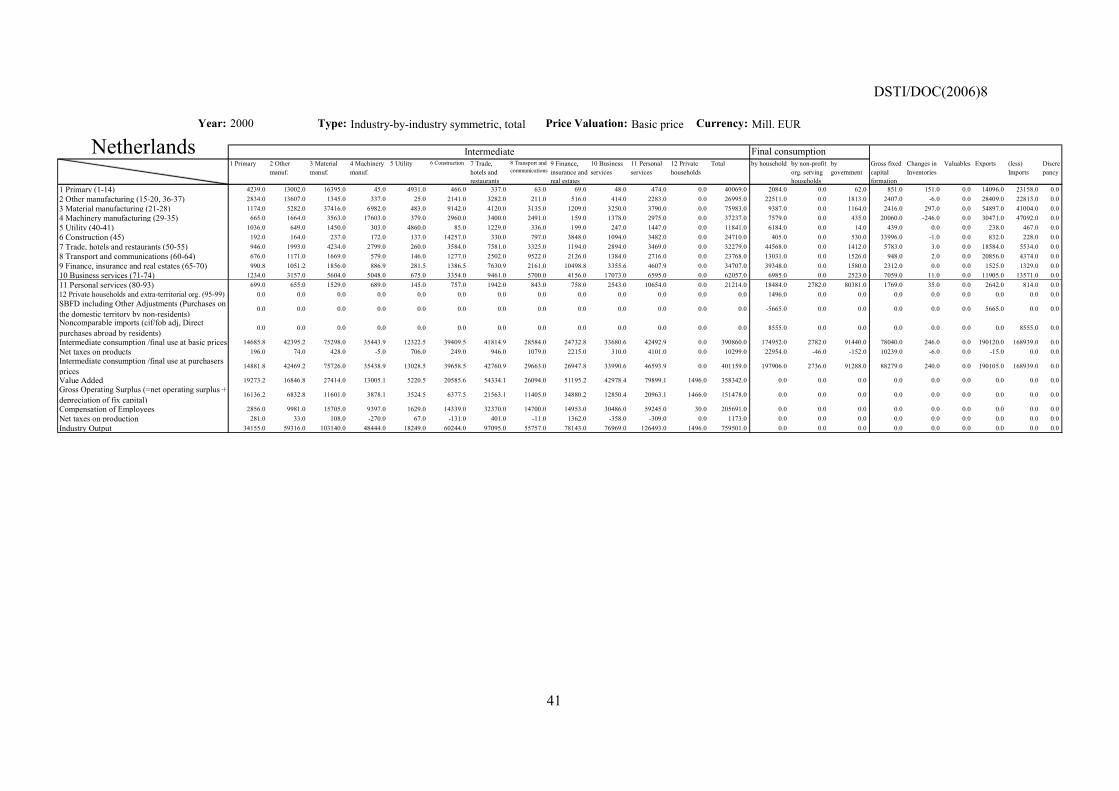
DSTI/DOC(2006)8
41
Year: 2000 Type: Industry-by-industry symmetric, total Price Valuation: Basic price Currency: Mill. EUR
1 Primary 2 Othermanuf.
3 Materialmanuf.
4 Machinerymanuf.
5 Utility 6 Construction 7 Trade,hotels andrestaurants
8 Transport andcommunications
9 Finance,insurance andreal estates
10 Businessservices
11 Personalservices
12 Privatehouseholds
Total by household by non-profitorg. servinghouseholds
bygovernment
Gross fixedcapitalformation
Changes inInventories
Valuables Exports (less)Imports
Discrepancy
1 Primary (1-14) 4239.0 13002.0 16395.0 45.0 4931.0 466.0 337.0 63.0 69.0 48.0 474.0 0.0 40069.0 2084.0 0.0 62.0 851.0 151.0 0.0 14096.0 23158.0 0.02 Other manufacturing (15-20, 36-37) 2834.0 13607.0 1345.0 337.0 25.0 2141.0 3282.0 211.0 516.0 414.0 2283.0 0.0 26995.0 22511.0 0.0 1813.0 2407.0 -6.0 0.0 28409.0 22813.0 0.03 Material manufacturing (21-28) 1174.0 5282.0 37416.0 6982.0 483.0 9142.0 4120.0 3135.0 1209.0 3250.0 3790.0 0.0 75983.0 9387.0 0.0 1164.0 2416.0 297.0 0.0 54897.0 41004.0 0.04 Machinery manufacturing (29-35) 665.0 1664.0 3563.0 17603.0 379.0 2960.0 3400.0 2491.0 159.0 1378.0 2975.0 0.0 37237.0 7579.0 0.0 435.0 20060.0 -246.0 0.0 30471.0 47092.0 0.05 Utility (40-41) 1036.0 649.0 1450.0 303.0 4860.0 85.0 1229.0 336.0 199.0 247.0 1447.0 0.0 11841.0 6184.0 0.0 14.0 439.0 0.0 0.0 238.0 467.0 0.06 Construction (45) 192.0 164.0 237.0 172.0 137.0 14257.0 330.0 797.0 3848.0 1094.0 3482.0 0.0 24710.0 405.0 0.0 530.0 33996.0 -1.0 0.0 832.0 228.0 0.07 Trade, hotels and restaurants (50-55) 946.0 1993.0 4234.0 2799.0 260.0 3584.0 7581.0 3325.0 1194.0 2894.0 3469.0 0.0 32279.0 44568.0 0.0 1412.0 5783.0 3.0 0.0 18584.0 5534.0 0.08 Transport and communications (60-64) 676.0 1171.0 1669.0 579.0 146.0 1277.0 2502.0 9522.0 2126.0 1384.0 2716.0 0.0 23768.0 13031.0 0.0 1526.0 948.0 2.0 0.0 20856.0 4374.0 0.09 Finance, insurance and real estates (65-70) 990.8 1051.2 1856.0 886.9 281.5 1386.5 7630.9 2161.0 10498.8 3355.6 4607.9 0.0 34707.0 39348.0 0.0 1580.0 2312.0 0.0 0.0 1525.0 1329.0 0.010 Business services (71-74) 1234.0 3157.0 5604.0 5048.0 675.0 3354.0 9461.0 5700.0 4156.0 17073.0 6595.0 0.0 62057.0 6985.0 0.0 2523.0 7059.0 11.0 0.0 11905.0 13571.0 0.011 Personal services (80-93) 699.0 655.0 1529.0 689.0 145.0 757.0 1942.0 843.0 758.0 2543.0 10654.0 0.0 21214.0 18484.0 2782.0 80381.0 1769.0 35.0 0.0 2642.0 814.0 0.012 Private households and extra-territorial org. (95-99) 0.0 0.0 0.0 0.0 0.0 0.0 0.0 0.0 0.0 0.0 0.0 0.0 0.0 1496.0 0.0 0.0 0.0 0.0 0.0 0.0 0.0 0.0SBFD including Other Adjustments (Purchases onthe domestic territory by non-residents)
0.0 0.0 0.0 0.0 0.0 0.0 0.0 0.0 0.0 0.0 0.0 0.0 0.0 -5665.0 0.0 0.0 0.0 0.0 0.0 5665.0 0.0 0.0
Noncomparable imports (cif/fob adj, Directpurchases abroad by residents)
0.0 0.0 0.0 0.0 0.0 0.0 0.0 0.0 0.0 0.0 0.0 0.0 0.0 8555.0 0.0 0.0 0.0 0.0 0.0 0.0 8555.0 0.0
Intermediate consumption /final use at basic prices 14685.8 42395.2 75298.0 35443.9 12322.5 39409.5 41814.9 28584.0 24732.8 33680.6 42492.9 0.0 390860.0 174952.0 2782.0 91440.0 78040.0 246.0 0.0 190120.0 168939.0 0.0Net taxes on products 196.0 74.0 428.0 -5.0 706.0 249.0 946.0 1079.0 2215.0 310.0 4101.0 0.0 10299.0 22954.0 -46.0 -152.0 10239.0 -6.0 0.0 -15.0 0.0 0.0Intermediate consumption /final use at purchasersprices
14881.8 42469.2 75726.0 35438.9 13028.5 39658.5 42760.9 29663.0 26947.8 33990.6 46593.9 0.0 401159.0 197906.0 2736.0 91288.0 88279.0 240.0 0.0 190105.0 168939.0 0.0
Value Added 19273.2 16846.8 27414.0 13005.1 5220.5 20585.6 54334.1 26094.0 51195.2 42978.4 79899.1 1496.0 358342.0 0.0 0.0 0.0 0.0 0.0 0.0 0.0 0.0 0.0Gross Operating Surplus (=net operating surplus +depreciation of fix capital)
16136.2 6832.8 11601.0 3878.1 3524.5 6377.5 21563.1 11405.0 34880.2 12850.4 20963.1 1466.0 151478.0 0.0 0.0 0.0 0.0 0.0 0.0 0.0 0.0 0.0
Compensation of Employees 2856.0 9981.0 15705.0 9397.0 1629.0 14339.0 32370.0 14700.0 14953.0 30486.0 59245.0 30.0 205691.0 0.0 0.0 0.0 0.0 0.0 0.0 0.0 0.0 0.0Net taxes on production 281.0 33.0 108.0 -270.0 67.0 -131.0 401.0 -11.0 1362.0 -358.0 -309.0 0.0 1173.0 0.0 0.0 0.0 0.0 0.0 0.0 0.0 0.0 0.0Industry Output 34155.0 59316.0 103140.0 48444.0 18249.0 60244.0 97095.0 55757.0 78143.0 76969.0 126493.0 1496.0 759501.0 0.0 0.0 0.0 0.0 0.0 0.0 0.0 0.0 0.0
Netherlands Intermediate Final consumption

DSTI/DOC(2006)8
42
Year: 1995/96 Type: Industry-by-industry symmetric, total Price Valuation: Basic price Currency: Mill. NZD
1 Primary 2 Othermanuf.
3 Materialmanuf.
4 Machinerymanuf.
5 Utility 6 Construction 7 Trade,hotels andrestaurants
8 Transport andcommunications
9 Finance,insurance andreal estates
10 Businessservices
11 Personalservices
12 Privatehouseholds
Total by household by non-profitorg. servinghouseholds
bygovernment
Gross fixedcapitalformation
Changes inInventories
Valuables Exports (less)Imports
Discrepancy
1 Primary (1-14) 2742.4 7770.3 1602.7 9.4 202.0 111.1 945.7 40.3 51.8 159.3 109.3 0.0 13744.1 567.2 0.0 0.0 187.1 355.2 0.0 2531.7 1732.8 0.02 Other manufacturing (15-20, 36-37) 274.6 3431.5 367.1 181.8 3.1 1322.3 2610.7 12.5 261.3 57.4 285.7 0.0 8808.1 7226.0 0.0 5.0 466.1 526.9 0.0 10012.9 3201.6 0.03 Material manufacturing (21-28) 1446.9 2109.3 5864.5 1625.6 92.4 2157.9 2403.6 841.3 610.2 888.9 896.3 0.0 18936.1 2484.8 0.0 281.0 418.1 187.6 0.0 3622.6 7158.3 0.04 Machinery manufacturing (29-35) 219.8 202.0 262.1 1284.2 68.0 927.0 774.9 674.1 60.5 350.0 519.8 0.0 5342.0 2487.0 0.0 9.0 6328.7 174.0 0.0 1275.9 8788.6 0.05 Utility (40-41) 164.9 316.1 592.3 40.3 2055.6 14.9 287.1 40.1 188.7 57.4 256.4 0.0 4014.0 1354.0 0.0 0.0 9.0 2.0 0.0 79.0 5.0 0.06 Construction (45) 222.9 14.3 32.5 63.5 56.2 2419.4 38.5 64.4 822.7 10.3 889.4 0.0 4634.0 87.0 0.0 0.0 8103.5 -6.0 0.0 63.0 13.0 0.07 Trade, hotels and restaurants (50-55) 1032.6 1394.5 1321.7 662.6 59.4 968.5 1834.2 748.5 494.7 623.3 1007.0 0.0 10147.1 12501.7 0.0 319.1 1874.6 -86.3 0.0 4230.5 114.0 0.08 Transport and communications (60-64) 713.0 1029.2 789.4 182.7 25.2 216.0 1659.1 2894.5 333.4 573.9 844.9 0.0 9261.1 3142.7 0.0 25.0 183.1 24.1 0.0 3067.7 1313.9 0.09 Finance, insurance and real estates (65-70) 716.7 369.5 374.8 114.3 128.6 206.9 1707.3 400.2 3795.1 652.8 1197.9 0.0 9664.1 13397.7 0.0 5.0 658.2 0.0 0.0 183.0 294.0 0.010 Business services (71-74) 619.4 764.0 716.2 294.5 414.4 515.9 2315.6 1081.7 1177.4 1657.2 2228.8 0.0 11785.1 323.0 5.0 307.1 744.2 3.0 0.0 542.9 1382.9 0.011 Personal services (80-93) 194.5 250.0 135.2 38.9 36.1 99.1 452.7 138.8 200.0 555.9 1910.8 0.0 4012.0 3667.0 1117.0 15173.7 148.0 1.0 0.0 889.9 115.0 0.012 Private households and extra-territorial org. (95-99) 0.0 0.0 0.0 0.0 0.0 0.0 0.0 0.0 0.0 0.0 0.0 0.0 0.0 0.0 0.0 0.0 0.0 0.0 0.0 0.0 0.0 0.0SBFD including Other Adjustments (Purchases onthe domestic territory by non-residents)
0.0 0.0 0.0 0.0 0.0 0.0 0.0 0.0 0.0 0.0 0.0 0.0 0.0 0.0 0.0 0.0 0.0 0.0 0.0 0.0 0.0 0.0
Noncomparable imports (cif/fob adj, Directpurchases abroad by residents)
19.2 28.2 27.3 9.1 0.0 48.1 213.4 110.6 22.2 66.6 159.5 0.0 704.0 1315.0 0.0 0.0 0.0 0.0 0.0 0.0 2019.0 0.0
Intermediate consumption /final use at basic prices 8367.0 17679.0 12086.0 4507.0 3141.0 9007.0 15243.0 7047.0 8018.0 5653.0 10306.0 0.0 101054.0 48553.0 1122.0 16125.0 19122.0 1182.0 0.0 26499.1 26138.0 0.0Net taxes on products 184.3 170.3 236.4 69.1 47.1 201.3 380.6 157.3 746.3 37.1 116.2 0.0 2346.0 5867.0 0.0 298.0 768.0 0.0 0.0 348.0 0.0 0.0Intermediate consumption /final use at purchasersprices
8551.3 17849.3 12322.4 4576.1 3188.1 9208.3 15623.6 7204.3 8764.3 5690.1 10422.2 0.0 103400.0 54420.0 1122.0 16423.0 19891.0 1182.0 0.0 26847.1 26138.0 0.0
Value Added 7096.2 5992.3 6450.3 2243.1 2269.0 3663.1 13253.7 7184.2 14853.0 6643.2 14471.9 0.0 84120.0 0.0 0.0 0.0 0.0 0.0 0.0 0.0 0.0 0.0Gross Operating Surplus (=net operating surplus +depreciation of fix capital)
5102.9 2337.9 3036.9 842.0 1785.0 1842.0 5906.9 3947.9 10862.7 3126.9 3236.9 0.0 42028.0 0.0 0.0 0.0 0.0 0.0 0.0 0.0 0.0 0.0
Compensation of Employees 1673.1 3557.3 3308.3 1386.1 463.0 1763.1 6987.5 3199.2 2588.2 3448.3 11075.8 0.0 39450.0 0.0 0.0 0.0 0.0 0.0 0.0 0.0 0.0 0.0Net taxes on production 320.2 97.1 105.1 15.0 21.0 58.0 359.3 37.0 1402.1 68.1 159.1 0.0 2642.0 0.0 0.0 0.0 0.0 0.0 0.0 0.0 0.0 0.0Industry Output 15647.6 23841.6 18772.7 6819.2 5457.1 12871.5 28877.3 14388.4 23617.3 12333.3 24894.1 0.0 187520.0 0.0 0.0 0.0 0.0 0.0 0.0 0.0 0.0 0.0
New Zealand Intermediate Final consumption
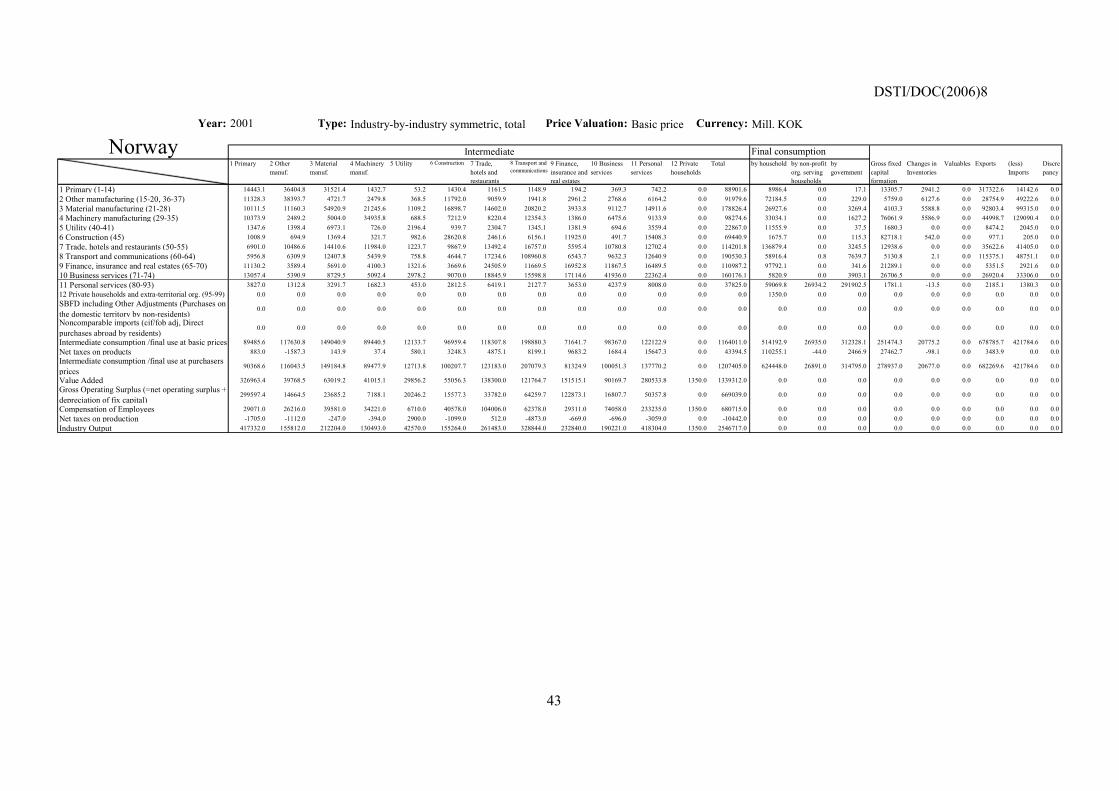
DSTI/DOC(2006)8
43
Year: 2001 Type: Industry-by-industry symmetric, total Price Valuation: Basic price Currency: Mill. KOK
1 Primary 2 Othermanuf.
3 Materialmanuf.
4 Machinerymanuf.
5 Utility 6 Construction 7 Trade,hotels andrestaurants
8 Transport andcommunications
9 Finance,insurance andreal estates
10 Businessservices
11 Personalservices
12 Privatehouseholds
Total by household by non-profitorg. servinghouseholds
bygovernment
Gross fixedcapitalformation
Changes inInventories
Valuables Exports (less)Imports
Discrepancy
1 Primary (1-14) 14443.1 36404.8 31521.4 1432.7 53.2 1430.4 1161.5 1148.9 194.2 369.3 742.2 0.0 88901.6 8986.4 0.0 17.1 13305.7 2941.2 0.0 317322.6 14142.6 0.02 Other manufacturing (15-20, 36-37) 11328.3 38393.7 4721.7 2479.8 368.5 11792.0 9059.9 1941.8 2961.2 2768.6 6164.2 0.0 91979.6 72184.5 0.0 229.0 5759.0 6127.6 0.0 28754.9 49222.6 0.03 Material manufacturing (21-28) 10111.5 11160.3 54920.9 21245.6 1109.2 16898.7 14602.0 20820.2 3933.8 9112.7 14911.6 0.0 178826.4 26927.6 0.0 3269.4 4103.3 5588.8 0.0 92803.4 99315.0 0.04 Machinery manufacturing (29-35) 10373.9 2489.2 5004.0 34935.8 688.5 7212.9 8220.4 12354.3 1386.0 6475.6 9133.9 0.0 98274.6 33034.1 0.0 1627.2 76061.9 5586.9 0.0 44998.7 129090.4 0.05 Utility (40-41) 1347.6 1398.4 6973.1 726.0 2196.4 939.7 2304.7 1345.1 1381.9 694.6 3559.4 0.0 22867.0 11555.9 0.0 37.5 1680.3 0.0 0.0 8474.2 2045.0 0.06 Construction (45) 1008.9 694.9 1369.4 321.7 982.6 28620.8 2461.6 6156.1 11925.0 491.7 15408.3 0.0 69440.9 1675.7 0.0 115.3 82718.1 542.0 0.0 977.1 205.0 0.07 Trade, hotels and restaurants (50-55) 6901.0 10486.6 14410.6 11984.0 1223.7 9867.9 13492.4 16757.0 5595.4 10780.8 12702.4 0.0 114201.8 136879.4 0.0 3245.5 12938.6 0.0 0.0 35622.6 41405.0 0.08 Transport and communications (60-64) 5956.8 6309.9 12407.8 5439.9 758.8 4644.7 17234.6 108960.8 6543.7 9632.3 12640.9 0.0 190530.3 58916.4 0.8 7639.7 5130.8 2.1 0.0 115375.1 48751.1 0.09 Finance, insurance and real estates (65-70) 11130.2 3589.4 5691.0 4100.3 1321.6 3669.6 24505.9 11669.5 16952.8 11867.5 16489.5 0.0 110987.2 97792.1 0.0 341.6 21289.1 0.0 0.0 5351.5 2921.6 0.010 Business services (71-74) 13057.4 5390.9 8729.5 5092.4 2978.2 9070.0 18845.9 15598.8 17114.6 41936.0 22362.4 0.0 160176.1 5820.9 0.0 3903.1 26706.5 0.0 0.0 26920.4 33306.0 0.011 Personal services (80-93) 3827.0 1312.8 3291.7 1682.3 453.0 2812.5 6419.1 2127.7 3653.0 4237.9 8008.0 0.0 37825.0 59069.8 26934.2 291902.5 1781.1 -13.5 0.0 2185.1 1380.3 0.012 Private households and extra-territorial org. (95-99) 0.0 0.0 0.0 0.0 0.0 0.0 0.0 0.0 0.0 0.0 0.0 0.0 0.0 1350.0 0.0 0.0 0.0 0.0 0.0 0.0 0.0 0.0SBFD including Other Adjustments (Purchases onthe domestic territory by non-residents)
0.0 0.0 0.0 0.0 0.0 0.0 0.0 0.0 0.0 0.0 0.0 0.0 0.0 0.0 0.0 0.0 0.0 0.0 0.0 0.0 0.0 0.0
Noncomparable imports (cif/fob adj, Directpurchases abroad by residents)
0.0 0.0 0.0 0.0 0.0 0.0 0.0 0.0 0.0 0.0 0.0 0.0 0.0 0.0 0.0 0.0 0.0 0.0 0.0 0.0 0.0 0.0
Intermediate consumption /final use at basic prices 89485.6 117630.8 149040.9 89440.5 12133.7 96959.4 118307.8 198880.3 71641.7 98367.0 122122.9 0.0 1164011.0 514192.9 26935.0 312328.1 251474.3 20775.2 0.0 678785.7 421784.6 0.0Net taxes on products 883.0 -1587.3 143.9 37.4 580.1 3248.3 4875.1 8199.1 9683.2 1684.4 15647.3 0.0 43394.5 110255.1 -44.0 2466.9 27462.7 -98.1 0.0 3483.9 0.0 0.0Intermediate consumption /final use at purchasersprices
90368.6 116043.5 149184.8 89477.9 12713.8 100207.7 123183.0 207079.3 81324.9 100051.3 137770.2 0.0 1207405.0 624448.0 26891.0 314795.0 278937.0 20677.0 0.0 682269.6 421784.6 0.0
Value Added 326963.4 39768.5 63019.2 41015.1 29856.2 55056.3 138300.0 121764.7 151515.1 90169.7 280533.8 1350.0 1339312.0 0.0 0.0 0.0 0.0 0.0 0.0 0.0 0.0 0.0Gross Operating Surplus (=net operating surplus +depreciation of fix capital)
299597.4 14664.5 23685.2 7188.1 20246.2 15577.3 33782.0 64259.7 122873.1 16807.7 50357.8 0.0 669039.0 0.0 0.0 0.0 0.0 0.0 0.0 0.0 0.0 0.0
Compensation of Employees 29071.0 26216.0 39581.0 34221.0 6710.0 40578.0 104006.0 62378.0 29311.0 74058.0 233235.0 1350.0 680715.0 0.0 0.0 0.0 0.0 0.0 0.0 0.0 0.0 0.0Net taxes on production -1705.0 -1112.0 -247.0 -394.0 2900.0 -1099.0 512.0 -4873.0 -669.0 -696.0 -3059.0 0.0 -10442.0 0.0 0.0 0.0 0.0 0.0 0.0 0.0 0.0 0.0Industry Output 417332.0 155812.0 212204.0 130493.0 42570.0 155264.0 261483.0 328844.0 232840.0 190221.0 418304.0 1350.0 2546717.0 0.0 0.0 0.0 0.0 0.0 0.0 0.0 0.0 0.0
Norway Intermediate Final consumption
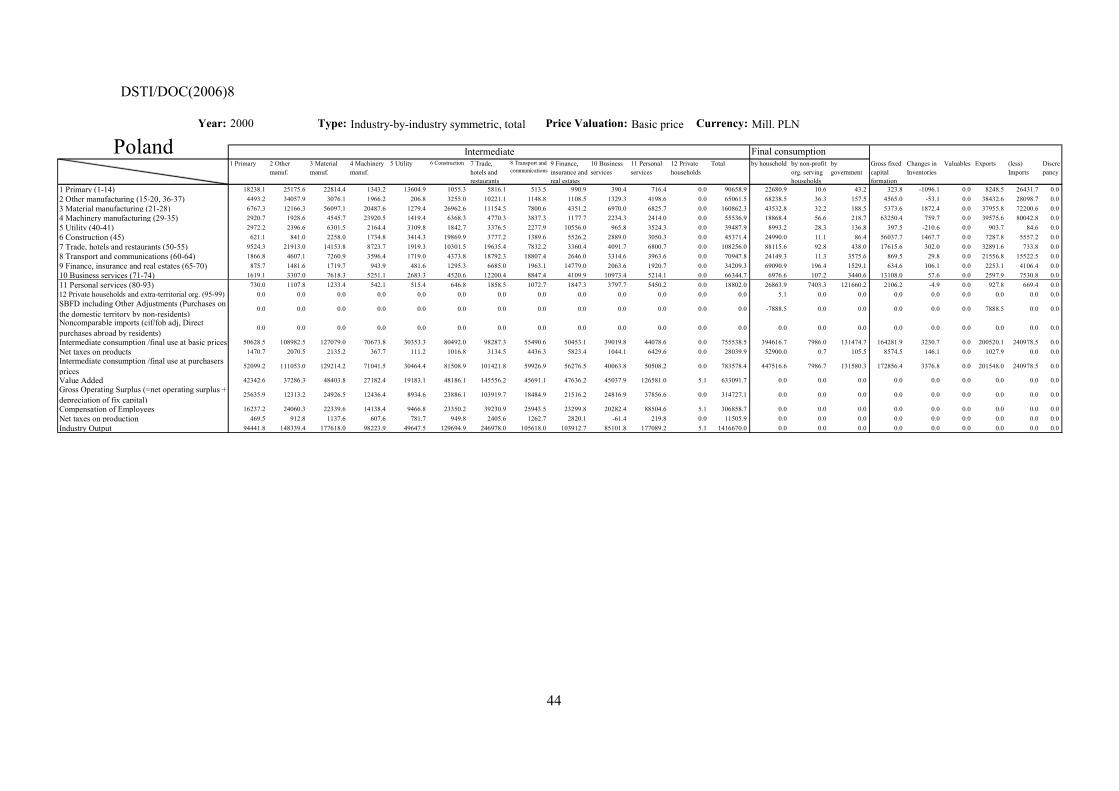
DSTI/DOC(2006)8
44
Year: 2000 Type: Industry-by-industry symmetric, total Price Valuation: Basic price Currency: Mill. PLN
1 Primary 2 Othermanuf.
3 Materialmanuf.
4 Machinerymanuf.
5 Utility 6 Construction 7 Trade,hotels andrestaurants
8 Transport andcommunications
9 Finance,insurance andreal estates
10 Businessservices
11 Personalservices
12 Privatehouseholds
Total by household by non-profitorg. servinghouseholds
bygovernment
Gross fixedcapitalformation
Changes inInventories
Valuables Exports (less)Imports
Discrepancy
1 Primary (1-14) 18238.1 25175.6 22814.4 1343.2 13604.9 1055.3 5816.1 513.5 990.9 390.4 716.4 0.0 90658.9 22680.9 10.6 43.2 323.8 -1096.1 0.0 8248.5 26431.7 0.02 Other manufacturing (15-20, 36-37) 4493.2 34057.9 3076.1 1966.2 206.8 3255.0 10221.1 1148.8 1108.5 1329.3 4198.6 0.0 65061.5 68238.5 36.3 157.5 4565.0 -53.1 0.0 38432.6 28098.7 0.03 Material manufacturing (21-28) 6767.3 12166.3 56097.1 20487.6 1279.4 26962.6 11154.5 7800.6 4351.2 6970.0 6825.7 0.0 160862.3 43532.8 32.2 188.5 5373.6 1872.4 0.0 37955.8 72200.6 0.04 Machinery manufacturing (29-35) 2920.7 1928.6 4545.7 23920.5 1419.4 6368.3 4770.3 3837.3 1177.7 2234.3 2414.0 0.0 55536.9 18868.4 56.6 218.7 63250.4 759.7 0.0 39575.6 80042.8 0.05 Utility (40-41) 2972.2 2396.6 6301.5 2164.4 3109.8 1842.7 3376.5 2277.9 10556.0 965.8 3524.3 0.0 39487.9 8993.2 28.3 136.8 397.5 -210.6 0.0 903.7 84.6 0.06 Construction (45) 621.1 841.0 2258.0 1734.8 3414.3 19869.9 3777.2 1389.6 5526.2 2889.0 3050.3 0.0 45371.4 24990.0 11.1 86.4 56037.7 1467.7 0.0 7287.8 5557.2 0.07 Trade, hotels and restaurants (50-55) 9524.3 21913.0 14153.8 8723.7 1919.3 10301.5 19635.4 7832.2 3360.4 4091.7 6800.7 0.0 108256.0 88115.6 92.8 438.0 17615.6 302.0 0.0 32891.6 733.8 0.08 Transport and communications (60-64) 1866.8 4607.1 7260.9 3596.4 1719.0 4373.8 18792.3 18807.4 2646.0 3314.6 3963.6 0.0 70947.8 24149.3 11.3 3575.6 869.5 29.8 0.0 21556.8 15522.5 0.09 Finance, insurance and real estates (65-70) 875.7 1481.6 1719.7 943.9 481.6 1295.3 6685.0 1963.1 14779.0 2063.6 1920.7 0.0 34209.3 69090.9 196.4 1529.1 634.6 106.1 0.0 2253.1 4106.4 0.010 Business services (71-74) 1619.1 3307.0 7618.3 5251.1 2683.3 4520.6 12200.4 8847.4 4109.9 10973.4 5214.1 0.0 66344.7 6976.6 107.2 3440.6 13108.0 57.6 0.0 2597.9 7530.8 0.011 Personal services (80-93) 730.0 1107.8 1233.4 542.1 515.4 646.8 1858.5 1072.7 1847.3 3797.7 5450.2 0.0 18802.0 26863.9 7403.3 121660.2 2106.2 -4.9 0.0 927.8 669.4 0.012 Private households and extra-territorial org. (95-99) 0.0 0.0 0.0 0.0 0.0 0.0 0.0 0.0 0.0 0.0 0.0 0.0 0.0 5.1 0.0 0.0 0.0 0.0 0.0 0.0 0.0 0.0SBFD including Other Adjustments (Purchases onthe domestic territory by non-residents)
0.0 0.0 0.0 0.0 0.0 0.0 0.0 0.0 0.0 0.0 0.0 0.0 0.0 -7888.5 0.0 0.0 0.0 0.0 0.0 7888.5 0.0 0.0
Noncomparable imports (cif/fob adj, Directpurchases abroad by residents)
0.0 0.0 0.0 0.0 0.0 0.0 0.0 0.0 0.0 0.0 0.0 0.0 0.0 0.0 0.0 0.0 0.0 0.0 0.0 0.0 0.0 0.0
Intermediate consumption /final use at basic prices 50628.5 108982.5 127079.0 70673.8 30353.3 80492.0 98287.3 55490.6 50453.1 39019.8 44078.6 0.0 755538.5 394616.7 7986.0 131474.7 164281.9 3230.7 0.0 200520.1 240978.5 0.0Net taxes on products 1470.7 2070.5 2135.2 367.7 111.2 1016.8 3134.5 4436.3 5823.4 1044.1 6429.6 0.0 28039.9 52900.0 0.7 105.5 8574.5 146.1 0.0 1027.9 0.0 0.0Intermediate consumption /final use at purchasersprices
52099.2 111053.0 129214.2 71041.5 30464.4 81508.9 101421.8 59926.9 56276.5 40063.8 50508.2 0.0 783578.4 447516.6 7986.7 131580.3 172856.4 3376.8 0.0 201548.0 240978.5 0.0
Value Added 42342.6 37286.3 48403.8 27182.4 19183.1 48186.1 145556.2 45691.1 47636.2 45037.9 126581.0 5.1 633091.7 0.0 0.0 0.0 0.0 0.0 0.0 0.0 0.0 0.0Gross Operating Surplus (=net operating surplus +depreciation of fix capital)
25635.9 12313.2 24926.5 12436.4 8934.6 23886.1 103919.7 18484.9 21516.2 24816.9 37856.6 0.0 314727.1 0.0 0.0 0.0 0.0 0.0 0.0 0.0 0.0 0.0
Compensation of Employees 16237.2 24060.3 22339.6 14138.4 9466.8 23350.2 39230.9 25943.5 23299.8 20282.4 88504.6 5.1 306858.7 0.0 0.0 0.0 0.0 0.0 0.0 0.0 0.0 0.0Net taxes on production 469.5 912.8 1137.6 607.6 781.7 949.8 2405.6 1262.7 2820.1 -61.4 219.8 0.0 11505.9 0.0 0.0 0.0 0.0 0.0 0.0 0.0 0.0 0.0Industry Output 94441.8 148339.4 177618.0 98223.9 49647.5 129694.9 246978.0 105618.0 103912.7 85101.8 177089.2 5.1 1416670.0 0.0 0.0 0.0 0.0 0.0 0.0 0.0 0.0 0.0
Poland Intermediate Final consumption
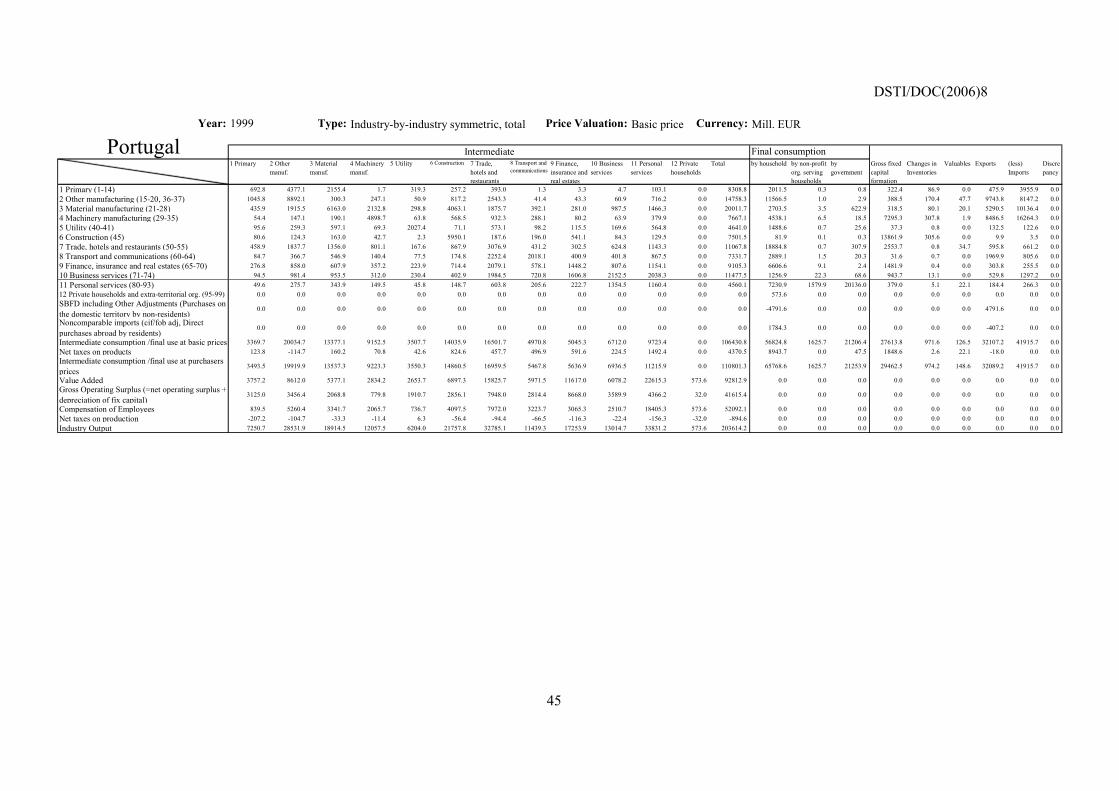
DSTI/DOC(2006)8
45
Year: 1999 Type: Industry-by-industry symmetric, total Price Valuation: Basic price Currency: Mill. EUR
1 Primary 2 Othermanuf.
3 Materialmanuf.
4 Machinerymanuf.
5 Utility 6 Construction 7 Trade,hotels andrestaurants
8 Transport andcommunications
9 Finance,insurance andreal estates
10 Businessservices
11 Personalservices
12 Privatehouseholds
Total by household by non-profitorg. servinghouseholds
bygovernment
Gross fixedcapitalformation
Changes inInventories
Valuables Exports (less)Imports
Discrepancy
1 Primary (1-14) 692.8 4377.1 2155.4 1.7 319.3 257.2 393.0 1.3 3.3 4.7 103.1 0.0 8308.8 2011.5 0.3 0.8 322.4 86.9 0.0 475.9 3955.9 0.02 Other manufacturing (15-20, 36-37) 1045.8 8892.1 300.3 247.1 50.9 817.2 2543.3 41.4 43.3 60.9 716.2 0.0 14758.3 11566.5 1.0 2.9 388.5 170.4 47.7 9743.8 8147.2 0.03 Material manufacturing (21-28) 435.9 1915.5 6163.0 2132.8 298.8 4063.1 1875.7 392.1 281.0 987.5 1466.3 0.0 20011.7 2703.5 3.5 622.9 318.5 80.1 20.1 5290.5 10136.4 0.04 Machinery manufacturing (29-35) 54.4 147.1 190.1 4898.7 63.8 568.5 932.3 288.1 80.2 63.9 379.9 0.0 7667.1 4538.1 6.5 18.5 7295.3 307.8 1.9 8486.5 16264.3 0.05 Utility (40-41) 95.6 259.3 597.1 69.3 2027.4 71.1 573.1 98.2 115.5 169.6 564.8 0.0 4641.0 1488.6 0.7 25.6 37.3 0.8 0.0 132.5 122.6 0.06 Construction (45) 80.6 124.3 163.0 42.7 2.3 5950.1 187.6 196.0 541.1 84.3 129.5 0.0 7501.5 81.9 0.1 0.3 13861.9 305.6 0.0 9.9 3.5 0.07 Trade, hotels and restaurants (50-55) 458.9 1837.7 1356.0 801.1 167.6 867.9 3076.9 431.2 302.5 624.8 1143.3 0.0 11067.8 18884.8 0.7 307.9 2553.7 0.8 34.7 595.8 661.2 0.08 Transport and communications (60-64) 84.7 366.7 546.9 140.4 77.5 174.8 2252.4 2018.1 400.9 401.8 867.5 0.0 7331.7 2889.1 1.5 20.3 31.6 0.7 0.0 1969.9 805.6 0.09 Finance, insurance and real estates (65-70) 276.8 858.0 607.9 357.2 223.9 714.4 2079.1 578.1 1448.2 807.6 1154.1 0.0 9105.3 6606.6 9.1 2.4 1481.9 0.4 0.0 303.8 255.5 0.010 Business services (71-74) 94.5 981.4 953.5 312.0 230.4 402.9 1984.5 720.8 1606.8 2152.5 2038.3 0.0 11477.5 1256.9 22.3 68.6 943.7 13.1 0.0 529.8 1297.2 0.011 Personal services (80-93) 49.6 275.7 343.9 149.5 45.8 148.7 603.8 205.6 222.7 1354.5 1160.4 0.0 4560.1 7230.9 1579.9 20136.0 379.0 5.1 22.1 184.4 266.3 0.012 Private households and extra-territorial org. (95-99) 0.0 0.0 0.0 0.0 0.0 0.0 0.0 0.0 0.0 0.0 0.0 0.0 0.0 573.6 0.0 0.0 0.0 0.0 0.0 0.0 0.0 0.0SBFD including Other Adjustments (Purchases onthe domestic territory by non-residents)
0.0 0.0 0.0 0.0 0.0 0.0 0.0 0.0 0.0 0.0 0.0 0.0 0.0 -4791.6 0.0 0.0 0.0 0.0 0.0 4791.6 0.0 0.0
Noncomparable imports (cif/fob adj, Directpurchases abroad by residents)
0.0 0.0 0.0 0.0 0.0 0.0 0.0 0.0 0.0 0.0 0.0 0.0 0.0 1784.3 0.0 0.0 0.0 0.0 0.0 -407.2 0.0 0.0
Intermediate consumption /final use at basic prices 3369.7 20034.7 13377.1 9152.5 3507.7 14035.9 16501.7 4970.8 5045.3 6712.0 9723.4 0.0 106430.8 56824.8 1625.7 21206.4 27613.8 971.6 126.5 32107.2 41915.7 0.0Net taxes on products 123.8 -114.7 160.2 70.8 42.6 824.6 457.7 496.9 591.6 224.5 1492.4 0.0 4370.5 8943.7 0.0 47.5 1848.6 2.6 22.1 -18.0 0.0 0.0Intermediate consumption /final use at purchasersprices
3493.5 19919.9 13537.3 9223.3 3550.3 14860.5 16959.5 5467.8 5636.9 6936.5 11215.9 0.0 110801.3 65768.6 1625.7 21253.9 29462.5 974.2 148.6 32089.2 41915.7 0.0
Value Added 3757.2 8612.0 5377.1 2834.2 2653.7 6897.3 15825.7 5971.5 11617.0 6078.2 22615.3 573.6 92812.9 0.0 0.0 0.0 0.0 0.0 0.0 0.0 0.0 0.0Gross Operating Surplus (=net operating surplus +depreciation of fix capital)
3125.0 3456.4 2068.8 779.8 1910.7 2856.1 7948.0 2814.4 8668.0 3589.9 4366.2 32.0 41615.4 0.0 0.0 0.0 0.0 0.0 0.0 0.0 0.0 0.0
Compensation of Employees 839.5 5260.4 3341.7 2065.7 736.7 4097.5 7972.0 3223.7 3065.3 2510.7 18405.3 573.6 52092.1 0.0 0.0 0.0 0.0 0.0 0.0 0.0 0.0 0.0Net taxes on production -207.2 -104.7 -33.3 -11.4 6.3 -56.4 -94.4 -66.5 -116.3 -22.4 -156.3 -32.0 -894.6 0.0 0.0 0.0 0.0 0.0 0.0 0.0 0.0 0.0Industry Output 7250.7 28531.9 18914.5 12057.5 6204.0 21757.8 32785.1 11439.3 17253.9 13014.7 33831.2 573.6 203614.2 0.0 0.0 0.0 0.0 0.0 0.0 0.0 0.0 0.0
Portugal Intermediate Final consumption

DSTI/DOC(2006)8
46
Year: 2000 Type: Industry-by-industry symmetric, total Price Valuation: Basic price Currency: Mill. SKK
1 Primary 2 Othermanuf.
3 Materialmanuf.
4 Machinerymanuf.
5 Utility 6 Construction 7 Trade,hotels andrestaurants
8 Transport andcommunications
9 Finance,insurance andreal estates
10 Businessservices
11 Personalservices
12 Privatehouseholds
Total by household by non-profitorg. servinghouseholds
bygovernment
Gross fixedcapitalformation
Changes inInventories
Valuables Exports (less)Imports
Discrepancy
1 Primary (1-14) 27092.3 26731.9 68058.8 524.7 4526.0 2368.1 2578.3 40427.8 189.4 2961.5 4293.3 0.0 179752.0 35365.2 164.5 60.8 2902.2 1703.9 0.0 10474.6 120451.8 0.02 Other manufacturing (15-20, 36-37) 5637.3 34033.2 4347.4 1455.4 388.6 3568.5 11948.5 768.7 825.7 1602.8 6812.5 0.0 71388.5 125508.7 13.0 88.1 3297.3 364.8 0.0 67007.1 92049.4 0.03 Material manufacturing (21-28) 10108.1 16142.2 122963.4 30006.6 4802.0 29680.7 19757.7 13765.0 2486.4 6924.6 13896.5 0.0 270533.1 53505.6 11.8 13732.7 6384.0 6561.2 0.0 200387.2 171866.1 0.04 Machinery manufacturing (29-35) 2029.6 1842.8 5408.9 93391.1 2436.3 6728.9 7160.1 10084.2 459.5 3702.9 2939.9 0.0 136184.1 28943.8 7.3 1197.7 99619.0 -4915.5 0.0 182199.3 223035.5 0.05 Utility (40-41) 2816.2 3697.6 14166.1 2490.5 60432.9 1752.3 4383.5 3666.9 2579.3 1401.4 5994.9 0.0 103381.6 32259.9 73.4 169.3 1805.3 -2431.9 0.0 2966.7 1656.7 0.06 Construction (45) 814.3 1760.3 3568.5 2809.7 3718.9 34952.1 6054.3 1937.6 2954.5 2735.9 2716.8 0.0 64022.9 4844.5 21.0 90.8 94649.3 547.7 0.0 7222.1 3592.0 0.07 Trade, hotels and restaurants (50-55) 7000.4 15822.9 22058.9 13928.8 1824.4 8822.5 26898.5 12011.5 2957.7 7186.7 10457.0 0.0 128969.5 78527.1 166.6 1199.3 17783.5 -283.5 0.0 80417.8 13788.8 0.08 Transport and communications (60-64) 3354.7 7145.8 14887.4 7733.0 19331.3 5019.0 37420.8 38279.2 3952.2 4538.8 8769.0 0.0 150431.3 35831.8 13.5 2754.8 2690.8 -684.6 0.0 48368.2 16097.9 0.09 Finance, insurance and real estates (65-70) 2399.5 4089.0 7174.0 3308.2 3418.5 6489.6 18452.2 7039.8 20596.9 6927.5 6971.6 0.0 86867.0 59390.8 687.7 1581.6 638.0 -30.3 0.0 3213.2 4462.2 0.010 Business services (71-74) 1402.1 4990.1 11155.0 7036.5 2356.5 6497.9 28183.2 7247.1 9855.4 26742.4 8798.9 0.0 114265.2 6388.4 121.3 2884.5 5283.7 -212.7 0.0 19757.4 31285.8 0.011 Personal services (80-93) 1277.8 1871.3 2092.6 1021.5 817.6 967.8 2452.2 1500.9 1115.1 2070.5 14386.1 0.0 29573.3 29060.5 7156.8 161036.2 482.3 690.5 0.0 10846.5 6116.0 0.012 Private households and extra-territorial org. (95-99) 0.0 0.0 0.0 0.0 0.0 0.0 0.0 0.0 0.0 0.0 0.0 0.0 0.0 0.0 0.0 0.0 0.0 0.0 0.0 0.0 0.0 0.0SBFD including Other Adjustments (Purchases onthe domestic territory by non-residents)
0.0 0.0 0.0 0.0 0.0 0.0 0.0 0.0 0.0 0.0 0.0 0.0 0.0 0.0 0.0 0.0 0.0 0.0 0.0 0.0 0.0 0.0
Noncomparable imports (cif/fob adj, Directpurchases abroad by residents)
0.0 0.0 0.0 0.0 0.0 0.0 0.0 0.0 0.0 0.0 0.0 0.0 0.0 0.0 0.0 0.0 0.0 0.0 0.0 0.0 0.0 0.0
Intermediate consumption /final use at basic prices 63932.4 118127.2 275881.0 163704.9 104052.6 106847.2 165289.4 136728.8 47972.2 66795.2 86036.4 0.0 1335367.0 489626.1 8437.0 184796.0 235535.4 1309.6 0.0 632860.0 684402.0 0.0Net taxes on products 2571.4 4975.7 7300.2 4374.4 2165.9 3078.4 5120.6 4242.1 972.4 2021.7 3191.8 0.0 40014.6 29970.1 0.0 0.0 6741.4 554.8 0.0 28651.0 0.0 0.0Intermediate consumption /final use at purchasersprices
66503.8 123102.9 283181.2 168079.3 106218.5 109925.5 170410.0 140971.0 48944.6 68816.9 89228.3 0.0 1375382.0 519596.1 8437.0 184796.0 242276.9 1864.4 0.0 661511.0 684402.0 0.0
Value Added 43467.4 52515.2 96068.1 52120.4 30349.2 57880.9 122581.4 82337.2 98941.3 48385.0 143501.8 0.0 828147.6 0.0 0.0 0.0 0.0 0.0 0.0 0.0 0.0 0.0Gross Operating Surplus (=net operating surplus +depreciation of fix capital)
33027.6 23180.1 55694.2 22379.6 19064.0 36980.8 60845.0 50415.3 82314.8 18790.7 45339.3 0.0 448031.5 0.0 0.0 0.0 0.0 0.0 0.0 0.0 0.0 0.0
Compensation of Employees 20497.2 28803.4 39052.2 29098.6 11122.5 20708.4 61086.3 32965.0 17160.7 29309.0 98497.7 0.0 388301.1 0.0 0.0 0.0 0.0 0.0 0.0 0.0 0.0 0.0Net taxes on production -10057.5 531.6 1321.6 642.1 162.7 191.6 650.1 -1043.2 -534.2 285.2 -335.2 0.0 -8185.1 0.0 0.0 0.0 0.0 0.0 0.0 0.0 0.0 0.0Industry Output 109971.1 175618.0 379249.3 220199.7 136567.7 167806.4 292991.5 223308.1 147885.9 117201.8 232730.1 0.0 2203530.0 0.0 0.0 0.0 0.0 0.0 0.0 0.0 0.0 0.0
Slovak Republic Intermediate Final consumption

DSTI/DOC(2006)8
47
Year: 2000 Type: Industry-by-industry symmetric, total Price Valuation: Basic price Currency: Mill. EUR
1 Primary 2 Othermanuf.
3 Materialmanuf.
4 Machinerymanuf.
5 Utility 6 Construction 7 Trade,hotels andrestaurants
8 Transport andcommunications
9 Finance,insurance andreal estates
10 Businessservices
11 Personalservices
12 Privatehouseholds
Total by household by non-profitorg. servinghouseholds
bygovernment
Gross fixedcapitalformation
Changes inInventories
Valuables Exports (less)Imports
Discrepancy
1 Primary (1-14) 3368.4 22010.2 16903.0 24.9 4683.8 1134.3 2151.3 16.4 30.0 17.6 437.3 0.0 50777.3 6642.0 0.0 8.0 608.5 151.4 0.0 8306.8 24209.0 0.02 Other manufacturing (15-20, 36-37) 5564.2 29048.4 2383.3 1227.3 34.8 2638.6 16069.4 509.8 82.7 1002.7 2042.4 0.0 60603.7 51587.4 0.0 41.5 3458.1 15.7 0.0 20048.9 25116.3 0.03 Material manufacturing (21-28) 4438.6 11549.2 50776.0 23064.5 2520.0 23922.5 4247.5 5055.0 1016.2 4131.4 6813.4 0.0 137534.2 18682.4 0.0 4291.4 3931.6 1231.3 0.0 39514.6 47800.6 0.04 Machinery manufacturing (29-35) 783.9 1276.3 6277.7 34162.1 498.9 4698.6 4681.0 2802.7 127.6 1170.9 3756.3 0.0 60235.8 20947.3 0.0 149.7 34794.7 748.4 0.0 52322.1 73123.9 0.05 Utility (40-41) 861.0 1396.8 4769.8 855.0 2325.3 392.9 2820.7 585.4 344.4 723.5 2166.6 0.0 17241.2 6602.9 0.0 5.9 312.7 88.5 0.0 208.0 118.2 0.06 Construction (45) 274.0 269.3 747.2 243.4 269.1 16078.9 1832.3 583.8 9412.6 587.9 2083.5 0.0 32382.0 3271.7 0.0 7.4 76976.3 0.7 0.0 293.9 9.0 0.07 Trade, hotels and restaurants (50-55) 1626.4 4774.8 6037.4 2146.3 192.0 5667.3 6769.7 5153.2 516.6 1513.7 2608.7 0.0 37006.1 124237.0 0.0 2397.2 2517.5 23.3 0.0 7827.9 1087.0 0.08 Transport and communications (60-64) 1846.2 6611.6 10309.6 3032.7 349.1 2978.0 6427.1 13619.7 1860.2 2721.6 3875.0 0.0 53630.8 20328.0 0.0 710.0 1462.0 5.5 0.0 11138.7 5013.0 0.09 Finance, insurance and real estates (65-70) 1126.0 2177.6 3154.1 1570.8 791.7 2841.8 11555.7 2765.9 10262.0 4234.1 5781.3 238.7 46499.8 46279.1 0.0 0.6 8162.7 0.0 0.0 1972.8 1305.0 0.010 Business services (71-74) 404.1 4487.4 7330.3 3935.9 776.6 5222.7 5884.0 3752.3 2683.9 7925.0 6356.1 0.0 48758.5 8274.0 0.0 83.1 10314.2 2.5 0.0 8630.6 13112.0 0.011 Personal services (80-93) 446.2 1071.0 1661.9 525.8 164.4 581.0 1753.9 762.9 504.2 1715.0 6129.3 0.0 15315.4 31397.3 4300.0 99780.2 875.6 4.7 0.0 1393.7 2050.0 0.012 Private households and extra-territorial org. (95-99) 0.0 0.0 0.0 0.0 0.0 0.0 0.0 0.0 0.0 0.0 0.0 0.0 0.0 6307.0 0.0 0.0 0.0 0.0 0.0 0.0 0.0 0.0SBFD including Other Adjustments (Purchases onthe domestic territory by non-residents)
0.0 0.0 0.0 0.0 0.0 0.0 0.0 0.0 0.0 0.0 0.0 0.0 0.0 -33993.0 0.0 0.0 0.0 0.0 0.0 33993.0 0.0 0.0
Noncomparable imports (cif/fob adj, Directpurchases abroad by residents)
0.0 0.0 0.0 0.0 0.0 0.0 0.0 0.0 0.0 0.0 0.0 0.0 0.0 5961.0 0.0 0.0 0.0 0.0 0.0 -1656.0 0.0 0.0
Intermediate consumption /final use at basic prices 20738.9 84672.6 110350.1 70788.8 12605.7 66156.7 64192.4 35607.1 26840.5 25743.4 42049.9 238.7 559984.9 316524.2 4300.0 107475.0 143413.9 2272.0 0.0 183995.0 192944.0 0.0Net taxes on products -307.2 -2495.9 1072.1 346.3 -298.3 621.7 1924.4 2098.8 1762.3 519.0 4051.9 0.0 9295.1 38804.8 0.0 305.0 10927.1 0.0 0.0 -227.0 13055.2 0.0Intermediate consumption /final use at purchasersprices
20431.7 82176.7 111422.2 71135.1 12307.4 66778.4 66116.8 37705.9 28602.8 26262.4 46101.8 238.7 569280.0 355329.0 4300.0 107780.0 154341.0 2272.0 0.0 183768.0 205999.2 0.0
Value Added 21853.3 28462.3 45962.8 24938.9 12033.6 46144.6 106805.2 44556.1 73007.2 36688.6 104915.2 6068.3 551436.0 0.0 0.0 0.0 0.0 0.0 0.0 0.0 0.0 0.0Gross Operating Surplus (=net operating surplus +depreciation of fix capital)
17626.3 9132.3 16914.8 6364.9 8813.6 14597.6 63417.2 23003.1 51897.2 12054.6 18119.2 -238.7 241702.0 0.0 0.0 0.0 0.0 0.0 0.0 0.0 0.0 0.0
Compensation of Employees 5190.0 19533.0 29216.0 18782.0 2978.0 30908.0 42831.0 21519.0 17757.0 24634.0 86529.0 6307.0 306184.0 0.0 0.0 0.0 0.0 0.0 0.0 0.0 0.0 0.0Net taxes on production -963.0 -203.0 -168.0 -208.0 242.0 639.0 557.0 34.0 3353.0 0.0 267.0 0.0 3550.0 0.0 0.0 0.0 0.0 0.0 0.0 0.0 0.0 0.0Industry Output 42285.0 110639.0 157385.0 96074.0 24341.0 112923.0 172922.0 82262.0 101610.0 62951.0 151017.0 6307.0 1120716.0 0.0 0.0 0.0 0.0 0.0 0.0 0.0 0.0 0.0
Spain Intermediate Final consumption

DSTI/DOC(2006)8
48
Year: 2000 Type: Industry-by-industry symmetric, total Price Valuation: Basic price Currency: Mill. SEK
1 Primary 2 Othermanuf.
3 Materialmanuf.
4 Machinerymanuf.
5 Utility 6 Construction 7 Trade,hotels andrestaurants
8 Transport andcommunications
9 Finance,insurance andreal estates
10 Businessservices
11 Personalservices
12 Privatehouseholds
Total by household by non-profitorg. servinghouseholds
bygovernment
Gross fixedcapitalformation
Changes inInventories
Valuables Exports (less)Imports
Discrepancy
1 Primary (1-14) 4655.7 39625.5 54201.9 765.5 1899.0 2290.7 2246.7 860.4 1003.0 1180.0 1488.0 0.0 110216.5 11994.6 0.0 30.8 1632.9 6126.8 0.1 10739.2 62119.0 0.02 Other manufacturing (15-20, 36-37) 5411.9 43295.3 14089.3 9935.7 1777.6 11085.8 15445.2 3386.8 3315.9 3943.4 11741.0 0.0 123428.0 117927.3 0.0 429.3 6896.2 -93.2 0.0 71171.0 85464.0 0.03 Material manufacturing (21-28) 5744.9 25451.4 149099.7 84927.3 5200.0 24656.0 16990.2 20621.6 9908.4 33431.8 24759.4 0.0 400790.8 45631.4 0.0 11751.5 16068.5 1092.6 0.0 272819.3 184395.0 0.04 Machinery manufacturing (29-35) 4802.4 5781.4 18230.5 177063.5 1883.1 11227.5 20397.6 14595.7 4657.1 19268.6 24926.1 0.0 302833.5 72075.8 0.0 5391.1 142631.8 8522.5 0.0 406797.9 321085.0 0.05 Utility (40-41) 1151.1 2463.8 10511.6 3377.0 4097.5 529.6 2278.0 2170.1 9825.2 1337.5 7651.5 0.0 45393.0 27227.4 0.0 0.7 900.5 0.3 0.0 405.0 1788.0 0.06 Construction (45) 1634.1 1419.1 3680.4 2828.5 2865.8 2366.1 2085.0 4949.0 31661.2 2652.5 12112.1 0.0 68253.8 2327.9 0.0 28.8 88340.5 17.3 0.0 1329.9 0.0 0.07 Trade, hotels and restaurants (50-55) 3374.4 7516.7 20465.9 31230.6 957.7 6369.8 8877.2 13672.1 6133.9 17310.3 18672.0 0.0 134580.6 158323.9 0.0 4712.2 26475.1 25.3 0.7 62871.2 5105.0 0.08 Transport and communications (60-64) 2789.5 18903.6 35210.0 26182.9 878.8 5320.1 19693.8 78125.5 9113.7 21032.0 28054.1 0.0 245304.0 76372.3 0.0 26699.1 1512.3 9.2 0.0 53776.0 31976.0 0.09 Finance, insurance and real estates (65-70) 1916.2 5070.4 12826.8 14385.2 2347.3 3288.4 18177.2 20017.9 40883.9 21602.7 61272.9 0.0 201788.9 248026.8 0.0 0.8 2518.6 0.6 0.0 11171.5 8547.0 0.010 Business services (71-74) 2333.0 13452.9 39626.9 84734.3 2429.7 11502.1 30727.9 28320.4 19778.4 78356.3 38524.7 0.0 349786.5 15987.6 0.0 11151.1 68472.3 303.6 0.0 64397.0 92869.0 0.011 Personal services (80-93) 927.6 3211.6 10081.0 8967.1 728.6 1943.3 5989.1 9516.1 12737.4 19536.6 41168.0 0.0 114806.3 100628.1 35348.0 522014.5 3487.3 47.0 406.2 5852.9 2158.0 0.012 Private households and extra-territorial org. (95-99) 0.0 0.0 0.0 0.0 0.0 0.0 0.0 0.0 0.0 0.0 0.0 0.0 0.0 271.0 0.0 0.0 0.0 0.0 0.0 0.0 0.0 0.0SBFD including Other Adjustments (Purchases onthe domestic territory by non-residents)
0.0 0.0 0.0 0.0 0.0 0.0 0.0 0.0 0.0 0.0 0.0 0.0 0.0 -38534.0 0.0 0.0 0.0 0.0 0.0 38534.0 0.0 0.0
Noncomparable imports (cif/fob adj, Directpurchases abroad by residents)
122.0 670.0 2423.0 5700.0 94.0 451.0 902.0 8560.0 328.0 4275.0 1117.0 0.0 24642.0 49837.0 0.0 0.0 0.0 0.0 0.0 -2306.0 0.0 0.0
Intermediate consumption /final use at basic prices 34862.7 166861.9 370447.4 450097.5 25159.2 81030.4 143809.8 204796.4 149346.1 223926.6 271486.6 0.0 2121824.0 888097.0 35348.0 582210.0 358936.0 16052.0 407.0 997559.0 795506.0 0.0Net taxes on products 2649.0 -375.3 2519.3 2132.8 1851.0 2223.3 5051.1 8170.6 23331.5 2785.7 38285.8 0.0 88625.0 105079.0 0.0 1227.0 30075.0 8.0 0.0 -2189.0 0.0 0.0Intermediate consumption /final use at purchasersprices
37511.8 166486.6 372966.7 452230.4 27010.2 83253.7 148860.9 212967.0 172677.5 226712.2 309772.4 0.0 2210449.0 993176.0 35348.0 583437.0 389011.0 16060.0 407.0 995370.0 795506.0 0.0
Value Added 41109.5 67808.4 190792.4 164937.6 45128.8 77044.3 233023.1 158730.5 282282.5 190517.3 470659.6 271.0 1922305.0 0.0 0.0 0.0 0.0 0.0 0.0 0.0 0.0 0.0Gross Operating Surplus (=net operating surplus +depreciation of fix capital)
30144.5 22368.4 83526.4 47525.6 31281.8 7710.3 60299.1 59061.5 201949.5 39443.2 55803.6 57.0 639171.0 0.0 0.0 0.0 0.0 0.0 0.0 0.0 0.0 0.0
Compensation of Employees 12992.0 47577.0 103928.0 111986.0 11581.0 66643.0 164363.0 95488.0 57391.0 146953.0 404424.0 203.0 1223529.0 0.0 0.0 0.0 0.0 0.0 0.0 0.0 0.0 0.0Net taxes on production -2027.0 -2137.0 3338.0 5426.0 2266.0 2691.0 8361.0 4181.0 22942.0 4121.0 10432.0 11.0 59605.0 0.0 0.0 0.0 0.0 0.0 0.0 0.0 0.0 0.0Industry Output 78621.3 234295.0 563759.1 617168.0 72139.0 160298.0 381884.0 371697.5 454960.0 417229.5 780432.0 271.0 4132754.0 0.0 0.0 0.0 0.0 0.0 0.0 0.0 0.0 0.0
Sweden Intermediate Final consumption

DSTI/DOC(2006)8
49
Year: 2001 Type: Industry-by-industry symmetric, total Price Valuation: Basic price Currency: Mill. CHF
1 Primary 2 Othermanuf.
3 Materialmanuf.
4 Machinerymanuf.
5 Utility 6 Construction 7 Trade,hotels andrestaurants
8 Transport andcommunications
9 Finance,insurance andreal estates
10 Businessservices
11 Personalservices
12 Privatehouseholds
Total by household by non-profitorg. servinghouseholds
bygovernment
Gross fixedcapitalformation
Changes inInventories
Valuables Exports (less)Imports
Discrepancy
1 Primary (1-14) 2530.7 7750.2 2946.8 29.7 967.0 1331.3 774.6 30.6 137.5 1.3 401.0 2.1 16902.9 3904.2 0.0 0.0 302.2 78.9 0.0 1027.2 7652.3 0.02 Other manufacturing (15-20, 36-37) 1014.4 10342.3 2553.1 807.0 13.0 2600.4 4585.5 159.5 156.2 355.4 2367.4 33.1 24987.5 29653.9 0.0 55.0 59.3 818.6 3027.3 14259.0 27183.3 0.03 Material manufacturing (21-28) 1055.4 3301.0 31152.9 18627.3 403.7 8016.0 5712.2 2143.8 1011.5 4723.2 4338.9 185.0 80670.8 10579.7 2.1 2.0 94.2 1707.1 448.1 57129.7 56429.4 0.04 Machinery manufacturing (29-35) 356.1 520.9 1139.3 20169.8 228.3 2233.3 2375.3 2949.4 268.1 848.6 3085.7 38.8 34213.6 9829.2 0.0 34.5 36343.3 -1616.5 0.0 55894.6 48950.8 0.05 Utility (40-41) 211.6 755.0 2541.0 611.0 10643.8 117.6 1284.6 644.8 396.7 394.5 1914.6 58.0 19573.2 4478.8 0.0 0.0 77.6 0.0 0.0 2827.6 1897.2 0.06 Construction (45) 234.5 120.8 278.9 223.1 238.8 1882.8 706.9 679.6 2919.4 125.8 1764.9 21.3 9196.8 1382.4 0.0 326.2 33805.9 0.0 0.0 290.1 93.7 0.07 Trade, hotels and restaurants (50-55) 945.9 3350.1 4751.9 5302.0 189.9 2228.2 5950.8 3320.9 654.9 1791.7 3001.3 79.1 31566.8 52871.3 10.7 308.8 9318.5 3.2 3.4 15146.5 5878.7 0.08 Transport and communications (60-64) 315.9 1818.0 4237.6 2940.7 319.0 1530.8 5171.4 10892.1 1998.9 1801.4 2338.6 48.2 33412.6 15521.4 0.0 115.9 360.5 0.0 0.0 8962.3 7285.7 0.09 Finance, insurance and real estates (65-70) 761.3 3011.6 6210.4 5682.8 1250.9 2074.2 6889.2 3424.9 24441.9 4708.8 5139.2 176.4 63771.6 60913.9 0.0 0.4 410.2 0.0 0.0 20162.1 7562.0 0.010 Business services (71-74) 430.2 1329.9 5626.8 4306.2 268.4 1452.7 5103.3 2442.2 13506.0 11863.6 5441.0 157.5 51927.8 3129.5 0.0 1672.6 10316.0 -0.3 0.0 1593.6 159.3 0.011 Personal services (80-93) 337.7 461.7 1773.9 668.5 689.6 144.8 1092.1 502.9 1209.7 1982.0 7613.9 40.1 16517.0 40293.7 7628.8 45692.3 134.3 20.4 1260.7 4634.4 2657.5 0.012 Private households and extra-territorial org. (95-99) 5.7 9.4 5.7 16.1 0.5 1.2 149.9 80.0 133.5 12.7 365.3 85.4 865.3 3329.2 0.0 0.0 0.0 0.0 0.0 28.3 1.2 0.0SBFD including Other Adjustments (Purchases onthe domestic territory by non-residents)
0.0 0.0 0.0 0.0 0.0 0.0 0.0 0.0 0.0 0.0 0.0 0.0 0.0 0.0 0.0 0.0 0.0 0.0 0.0 0.0 0.0 0.0
Noncomparable imports (cif/fob adj, Directpurchases abroad by residents)
229.1 279.6 257.5 116.0 76.7 402.5 478.8 646.9 41.9 217.2 411.9 17.4 3175.5 2325.6 0.0 0.4 123.3 0.0 2.5 674.2 0.0 0.0
Intermediate consumption /final use at basic prices 8428.7 33050.7 63476.3 59500.3 15289.4 24015.8 40274.0 27917.5 46876.2 28826.0 38184.3 942.4 386781.4 238212.8 7641.6 48208.0 91345.4 1011.3 4741.9 182629.7 165751.1 0.0Net taxes on products 203.1 -433.0 -145.4 -143.6 -25.1 -117.6 -222.1 115.2 4002.9 206.3 1263.2 4.3 4708.2 4.3 0.0 788.8 2408.3 0.0 320.8 1545.9 0.0 0.0Intermediate consumption /final use at purchasersprices
8631.7 32617.6 63331.0 59356.7 15264.3 23898.2 40051.9 28032.7 50879.0 29032.3 39447.5 946.7 391489.5 238217.0 7641.6 48996.8 93753.7 1011.3 5062.7 184175.6 165751.1 0.0
Value Added 5931.3 13059.5 30873.6 26391.0 9795.7 21009.5 63298.5 23054.3 86817.2 39447.6 74078.2 3274.9 397031.4 0.0 0.0 0.0 0.0 0.0 0.0 0.0 0.0 0.0Gross Operating Surplus (=net operating surplus +depreciation of fix capital)
3370.9 3143.5 7637.9 4612.1 7376.8 2799.7 18602.6 7160.0 48032.8 8204.4 18391.9 1055.7 130388.3 0.0 0.0 0.0 0.0 0.0 0.0 0.0 0.0 0.0
Compensation of Employees 2560.4 9916.1 23235.7 21778.9 2418.9 18209.9 44695.9 15894.4 38784.3 31243.2 55684.7 2219.1 266641.5 0.0 0.0 0.0 0.0 0.0 0.0 0.0 0.0 0.0Net taxes on production 0.0 0.0 0.0 0.0 0.0 0.0 0.0 0.0 0.0 0.0 0.0 0.0 0.0 0.0 0.0 0.0 0.0 0.0 0.0 0.0 0.0 0.0Industry Output 14563.0 45677.3 94204.5 85747.8 25060.0 44907.8 103350.5 51087.0 137696.2 68479.9 113524.1 4221.5 788519.5 0.0 0.0 0.0 0.0 0.0 0.0 0.0 0.0 0.0
Switzerland Intermediate Final consumption
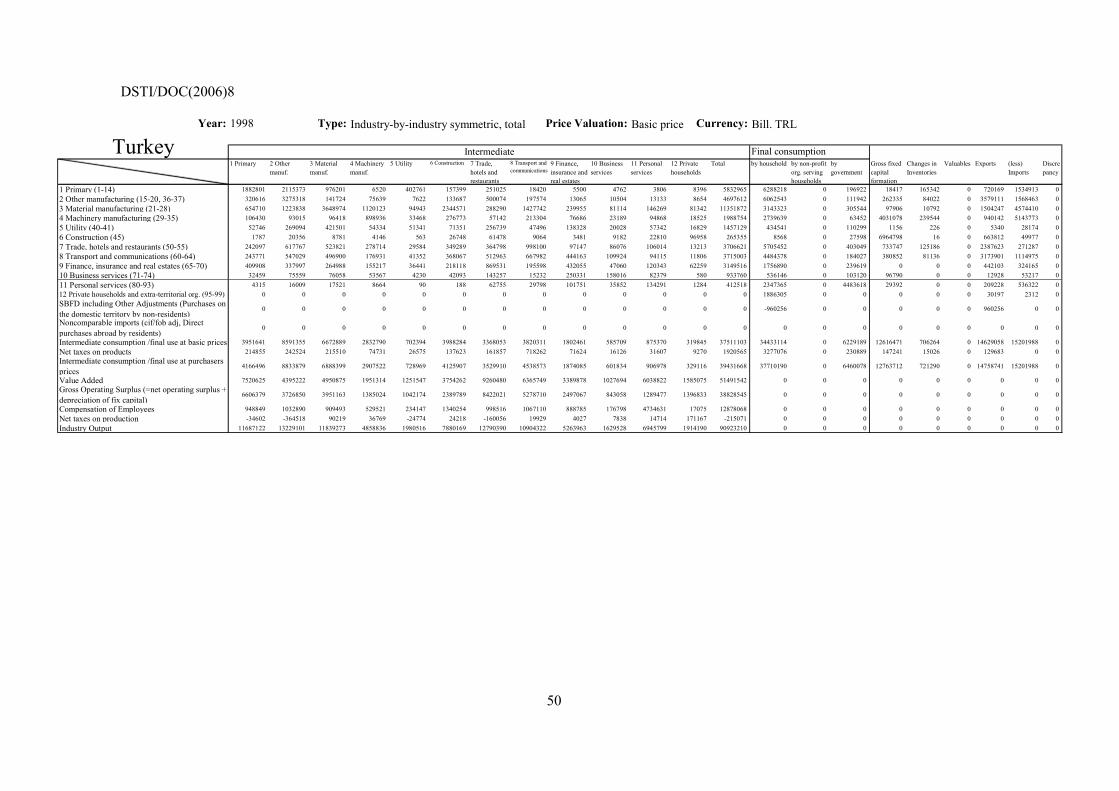
DSTI/DOC(2006)8
50
Year: 1998 Type: Industry-by-industry symmetric, total Price Valuation: Basic price Currency: Bill. TRL
1 Primary 2 Othermanuf.
3 Materialmanuf.
4 Machinerymanuf.
5 Utility 6 Construction 7 Trade,hotels andrestaurants
8 Transport andcommunications
9 Finance,insurance andreal estates
10 Businessservices
11 Personalservices
12 Privatehouseholds
Total by household by non-profitorg. servinghouseholds
bygovernment
Gross fixedcapitalformation
Changes inInventories
Valuables Exports (less)Imports
Discrepancy
1 Primary (1-14) 1882801 2115373 976201 6520 402761 157399 251025 18420 5500 4762 3806 8396 5832965 6288218 0 196922 18417 165342 0 720169 1534913 02 Other manufacturing (15-20, 36-37) 320616 3275318 141724 75639 7622 133687 500074 197574 13065 10504 13133 8654 4697612 6062543 0 111942 262335 84022 0 3579111 1568463 03 Material manufacturing (21-28) 654710 1223838 3648974 1120123 94943 2344571 288290 1427742 239955 81114 146269 81342 11351872 3143323 0 305544 97906 10792 0 1504247 4574410 04 Machinery manufacturing (29-35) 106430 93015 96418 898936 33468 276773 57142 213304 76686 23189 94868 18525 1988754 2739639 0 63452 4031078 239544 0 940142 5143773 05 Utility (40-41) 52746 269094 421501 54334 51341 71351 256739 47496 138328 20028 57342 16829 1457129 434541 0 110299 1156 226 0 5340 28174 06 Construction (45) 1787 20356 8781 4146 563 26748 61478 9064 3481 9182 22810 96958 265355 8568 0 27598 6964798 16 0 663812 49977 07 Trade, hotels and restaurants (50-55) 242097 617767 523821 278714 29584 349289 364798 998100 97147 86076 106014 13213 3706621 5705452 0 403049 733747 125186 0 2387623 271287 08 Transport and communications (60-64) 243771 547029 496900 176931 41352 368067 512963 667982 444163 109924 94115 11806 3715003 4484378 0 184027 380852 81136 0 3173901 1114975 09 Finance, insurance and real estates (65-70) 409908 337997 264988 155217 36441 218118 869531 195598 432055 47060 120343 62259 3149516 1756890 0 239619 0 0 0 442103 324165 010 Business services (71-74) 32459 75559 76058 53567 4230 42093 143257 15232 250331 158016 82379 580 933760 536146 0 103120 96790 0 0 12928 53217 011 Personal services (80-93) 4315 16009 17521 8664 90 188 62755 29798 101751 35852 134291 1284 412518 2347365 0 4483618 29392 0 0 209228 536322 012 Private households and extra-territorial org. (95-99) 0 0 0 0 0 0 0 0 0 0 0 0 0 1886305 0 0 0 0 0 30197 2312 0SBFD including Other Adjustments (Purchases onthe domestic territory by non-residents)
0 0 0 0 0 0 0 0 0 0 0 0 0 -960256 0 0 0 0 0 960256 0 0
Noncomparable imports (cif/fob adj, Directpurchases abroad by residents)
0 0 0 0 0 0 0 0 0 0 0 0 0 0 0 0 0 0 0 0 0 0
Intermediate consumption /final use at basic prices 3951641 8591355 6672889 2832790 702394 3988284 3368053 3820311 1802461 585709 875370 319845 37511103 34433114 0 6229189 12616471 706264 0 14629058 15201988 0Net taxes on products 214855 242524 215510 74731 26575 137623 161857 718262 71624 16126 31607 9270 1920565 3277076 0 230889 147241 15026 0 129683 0 0Intermediate consumption /final use at purchasersprices
4166496 8833879 6888399 2907522 728969 4125907 3529910 4538573 1874085 601834 906978 329116 39431668 37710190 0 6460078 12763712 721290 0 14758741 15201988 0
Value Added 7520625 4395222 4950875 1951314 1251547 3754262 9260480 6365749 3389878 1027694 6038822 1585075 51491542 0 0 0 0 0 0 0 0 0Gross Operating Surplus (=net operating surplus +depreciation of fix capital)
6606379 3726850 3951163 1385024 1042174 2389789 8422021 5278710 2497067 843058 1289477 1396833 38828545 0 0 0 0 0 0 0 0 0
Compensation of Employees 948849 1032890 909493 529521 234147 1340254 998516 1067110 888785 176798 4734631 17075 12878068 0 0 0 0 0 0 0 0 0Net taxes on production -34602 -364518 90219 36769 -24774 24218 -160056 19929 4027 7838 14714 171167 -215071 0 0 0 0 0 0 0 0 0Industry Output 11687122 13229101 11839273 4858836 1980516 7880169 12790390 10904322 5263963 1629528 6945799 1914190 90923210 0 0 0 0 0 0 0 0 0
Turkey Intermediate Final consumption

DSTI/DOC(2006)8
51
Year: 2000 Type: Industry-by-industry symmetric, total Price Valuation: Basic price Currency: Mill. GBP
1 Primary 2 Othermanuf.
3 Materialmanuf.
4 Machinerymanuf.
5 Utility 6 Construction 7 Trade,hotels andrestaurants
8 Transport andcommunications
9 Finance,insurance andreal estates
10 Businessservices
11 Personalservices
12 Privatehouseholds
Total by household by non-profitorg. servinghouseholds
bygovernment
Gross fixedcapitalformation
Changes inInventories
Valuables Exports (less)Imports
Discrepancy
1 Primary (1-14) 4893.7 8983.9 13549.3 50.6 8679.1 2318.6 1825.5 242.8 152.0 239.6 600.5 0.0 41535.5 11331.5 15.5 24.2 935.5 951.4 0.0 16693.9 16279.7 0.02 Other manufacturing (15-20, 36-37) 1508.9 14435.3 3259.5 1479.4 80.4 2550.0 14752.7 885.6 706.6 1133.4 4387.7 0.0 45179.6 77289.8 0.4 0.0 3848.3 181.8 37.6 11334.7 40869.6 0.03 Material manufacturing (21-28) 2966.2 10251.1 42358.8 22719.2 1209.6 12526.1 9282.0 6567.4 5536.8 5386.7 14438.8 0.0 133242.7 43779.7 48.0 0.0 6676.8 1691.7 -0.7 41235.0 53157.2 0.04 Machinery manufacturing (29-35) 1015.3 2178.3 4501.9 38746.6 984.9 3303.4 6359.7 8106.0 1463.1 2863.2 15695.5 0.0 85218.0 47147.7 13.5 0.0 46568.1 1754.1 -342.0 77901.9 113677.0 0.05 Utility (40-41) 704.0 1484.5 3938.3 1641.0 16800.7 393.0 2026.5 940.8 903.9 1205.9 2738.8 0.0 32777.4 16039.6 3.4 0.0 339.1 237.8 0.0 209.7 397.0 0.06 Construction (45) 824.6 279.8 622.4 412.0 568.9 27618.5 1639.9 1564.1 9889.3 840.7 4585.0 0.0 48845.2 4090.4 1.2 0.0 64349.1 -581.6 0.5 223.7 62.5 0.07 Trade, hotels and restaurants (50-55) 2659.1 9933.1 13218.1 13114.5 703.3 4892.2 14014.6 5125.6 3613.0 4119.9 10919.6 0.0 82312.8 135832.8 16.1 18.0 12202.6 5.8 307.5 32350.9 3058.7 0.08 Transport and communications (60-64) 1361.9 3545.1 6804.7 3192.3 365.0 1726.7 29330.9 30060.7 18767.2 8462.2 9602.6 0.0 113219.3 36309.3 6.8 1.5 1711.7 52.3 0.0 12646.6 12855.4 0.09 Finance, insurance and real estates (65-70) 2778.5 3759.8 7284.9 5698.9 1379.8 5869.3 21927.0 6678.0 20525.8 8163.7 11585.7 0.0 95651.5 108174.8 151.3 0.0 2786.1 116.7 0.0 14541.0 3137.7 0.010 Business services (71-74) 2027.8 4857.5 7318.3 6500.6 1373.8 7813.2 22711.4 14638.9 28626.6 48561.9 24121.4 0.0 168551.4 10431.5 650.0 144.7 10360.9 665.9 0.0 24661.6 17087.0 0.011 Personal services (80-93) 613.7 951.5 2859.6 1356.0 314.2 664.5 2985.9 3037.9 4987.3 7110.9 38217.8 0.0 63099.2 55079.2 22281.9 176901.6 3148.0 95.4 0.0 6607.8 4317.4 0.012 Private households and extra-territorial org. (95-99) 0.4 0.5 1.0 0.6 0.1 2.3 1.2 1.8 0.6 0.8 1.3 0.0 10.5 3987.1 0.0 0.0 0.1 0.0 0.0 0.0 3.8 0.0SBFD including Other Adjustments (Purchases onthe domestic territory by non-residents)
0.0 0.0 0.0 0.0 0.0 0.0 0.0 0.0 0.0 0.0 0.0 0.0 0.0 -14713.0 0.0 0.0 0.0 0.0 0.0 14713.0 0.0 0.0
Noncomparable imports (cif/fob adj, Directpurchases abroad by residents)
0.0 0.0 0.0 0.0 0.0 0.0 0.0 0.0 0.0 0.0 0.0 0.0 0.0 21654.0 0.0 0.0 0.0 0.0 0.0 0.0 0.0 0.0
Intermediate consumption /final use at basic prices 21354.2 60660.5 105716.7 94911.6 32459.7 69677.7 126857.3 77849.6 95172.2 88089.0 136894.8 0.0 909643.1 556434.5 23188.0 177090.0 152926.2 5171.5 3.0 253119.9 264903.0 0.0Net taxes on products 1074.3 1858.1 3391.5 2625.8 1296.1 3570.9 6992.8 6047.6 5475.0 3655.0 6876.2 0.0 42863.2 46914.4 0.0 0.0 8283.8 99.6 0.0 13910.0 0.0 0.0Intermediate consumption /final use at purchasersprices
22428.4 62518.6 109108.1 97537.4 33755.8 73248.6 133850.1 83897.2 100647.2 91743.9 143771.0 0.0 952506.3 603349.0 23188.0 177090.0 161210.0 5271.0 3.0 267029.9 264903.0 0.0
Value Added 32759.6 34479.4 64392.1 47063.7 15454.2 43617.4 126137.9 67194.8 117636.8 106635.1 179125.0 3994.0 838490.0 0.0 0.0 0.0 0.0 0.0 0.0 0.0 0.0 0.0Gross Operating Surplus (=net operating surplus +depreciation of fix capital)
26536.6 9910.4 13109.1 9825.7 9345.2 19347.4 37195.9 20479.8 79836.8 34277.1 29884.0 334.0 290082.0 0.0 0.0 0.0 0.0 0.0 0.0 0.0 0.0 0.0
Compensation of Employees 6207.0 23942.0 50056.0 36519.0 4850.0 23637.0 82230.0 45321.0 37008.0 70597.0 148291.0 3660.0 532318.0 0.0 0.0 0.0 0.0 0.0 0.0 0.0 0.0 0.0Net taxes on production 16.0 627.0 1227.0 719.0 1259.0 633.0 6712.0 1394.0 792.0 1761.0 950.0 0.0 16090.0 0.0 0.0 0.0 0.0 0.0 0.0 0.0 0.0 0.0Industry Output 55188.0 96998.0 173500.3 144601.1 49210.0 116866.0 259987.9 151092.0 218284.0 198379.0 322896.0 3994.0 1790996.0 0.0 0.0 0.0 0.0 0.0 0.0 0.0 0.0 0.0
United Kingdom Intermediate Final consumption

DSTI/DOC(2006)8
52
Year: 2000 Type: Industry-by-industry symmetric, total Price valuation: Producers� price Currency: Mill. USD
1 Primary 2 Othermanuf.
3 Materialmanuf.
4 Machinerymanuf.
5 Utility 6 Construction 7 Trade,hotels andrestaurants
8 Transport andcommunications
9 Finance,insurance andreal estates
10 Businessservices
11 Personalservices
12 Privatehouseholds
Total by household by non-profitorg. servinghouseholds
bygovernment
Gross fixedcapitalformation
Changes inInventories
Valuables Exports (less)Imports
Discrepancy
1 Primary (1-14) 86417.8 136524.9 168695.3 1270.2 65638.9 6179.6 11810.1 4864.0 3247.1 4171.0 13615.4 0.0 502434.4 46345.6 0.0 -435.1 27809.8 6189.6 0.0 25991 130861 0.02 Other manufacturing (15-20, 36-37) 14757.1 153239.7 21585.4 17001.5 778.6 38430.2 89977.5 3811.1 23287.6 7885.4 49264.6 0.0 420018.8 640767.1 0.0 6759.6 45726.6 10913.0 0.0 59596 245083 0.03 Material manufacturing (21-28) 38290.3 105576.8 481911.2 235879.4 10156.7 129726.3 101545.1 72226.5 57251.9 85019.6 192326.7 0.0 1509910.6 342184.1 0.0 3798.5 -3537.6 21551.6 0.0 145185 228170 0.04 Machinery manufacturing (29-35) 9679.2 14031.0 42212.5 443159.8 4067.5 48028.3 71109.1 43429.5 15736.3 36026.1 95239.4 0.0 822718.8 315480.7 0.0 70603.6 588599.2 22090.1 0.0 369984 572578 0.05 Utility (40-41) 6662.3 11562.0 30707.6 8460.5 2245.1 2616.4 27275.7 5665.9 24536.4 11509.7 46724.0 0.0 177965.6 135337.2 0.0 3793.6 13389.8 -105.7 0.0 792 2588 0.06 Construction (45) 915.2 1784.7 3696.2 2542.4 4090.0 859.0 9367.9 3693.5 26081.9 8147.2 44901.0 0.0 106078.9 0.0 0.0 167544.5 583038.5 35.3 0.0 103 0 0.07 Trade, hotels and restaurants (50-55) 19231.1 75363.0 117624.9 131097.8 4484.8 90955.3 104254.9 50096.0 47570.9 66708.2 117164.3 0.0 824551.1 1551364.4 0.0 9525.8 120715.6 -6553.6 0.0 66770 1697 0.08 Transport and communications (60-64) 12643.1 35146.6 71494.0 39669.7 22039.0 23720.7 82980.0 173817.3 46980.4 84206.7 125468.6 0.0 718166.2 321618.5 0.0 3678.3 30657.6 1154.7 0.0 113647 47757 0.09 Finance, insurance and real estates (65-70) 43527.8 25836.6 50154.4 45340.7 9095.2 19926.0 160017.3 45321.1 550069.4 119910.3 224207.8 0.0 1293406.6 1530541.6 0.0 12532.4 103411.1 -0.1 0.0 68409 10016 0.010 Business services (71-74) 23310.7 78729.7 135548.8 136560.6 10373.7 81742.8 238190.3 89554.7 206304.6 266344.0 312066.1 0.0 1578726.1 186113.5 0.0 20424.9 184285.7 73.4 0.0 58527 9021 0.011 Personal services (80-93) 6746.1 9962.1 19924.8 12967.6 1824.9 8234.0 44869.0 23489.9 40014.9 45382.0 163811.4 0.0 377226.8 1699270.1 0.0 1424709.6 -16489.9 2438.2 0.0 20811 1737 0.012 Private households and extra-territorial org. (95-99) 0.0 0.0 0.0 0.0 0.0 0.0 0.0 0.0 0.0 0.0 0.0 0.0 0.0 14220.9 0.0 0.0 0.0 0.0 0.0 0 0 0.0SBFD including Other Adjustments (Purchases onthe domestic territory by non-residents)
0.0 0.0 0.0 0.0 0.0 0.0 0.0 0.0 0.0 0.0 0.0 0.0 0.0 -102023.2 0.0 -1333.5 0.0 0.0 0.0 103357 0 0.0
Noncomparable imports (cif/fob adj, Directpurchases abroad by residents)
3094.7 4592.9 13838.0 19005.7 114.5 522.0 -9340.7 33578.8 17406.0 8050.9 14042.9 0.0 104905.7 58153.8 0.0 0.0 1640.0 0.0 0.0 0 164437 0.0
Intermediate consumption /final use at basic prices 265275.5 652349.9 1157393.2 1092955.8 134908.9 450940.5 932056.2 549548.4 1058487.4 743361.4 1398832.2 0.0 8436110.0 6739375.0 0.0 1721602.0 1678978.0 57786.4 0.0 1033173 1413944 0.0Net taxes on products 0.0 0.0 0.0 0.0 0.0 0.0 0.0 0.0 0.0 0.0 0.0 0.0 0.0 0.0 0.0 0.0 0.0 0.0 0.0 0 0 0.0Intermediate consumption /final use at purchasersprices
265275.5 652349.9 1157393.2 1092955.8 134908.9 450940.5 932056.2 549548.4 1058487.4 743361.4 1398832.2 0.0 8436110.0 6739375.0 0.0 1721602.0 1678978.0 57786.4 0.0 1033173 1413944 0.0
Value Added 212199.6 286348.7 633526.2 523941.2 193674.2 405859.9 1632620.3 591615.5 1939798.6 1275769.5 2107397.1 14220.9 9816972.0 0.0 0.0 0.0 0.0 0.0 0.0 0 0 0.0Gross Operating Surplus (=net operating surplus +depreciation of fix capital)
145217.9 104944.0 246233.3 141224.1 130256.5 113299.1 341691.5 207008.7 1230092.7 290702.5 433762.9 0.0 3384433.0 0.0 0.0 0.0 0.0 0.0 0.0 0 0 0.0
Compensation of Employees 70011.9 162862.3 373174.3 406298.4 43036.4 287870.1 957693.6 338923.7 526686.1 960635.7 1633087.1 14220.9 5774500.0 0.0 0.0 0.0 0.0 0.0 0.0 0 0 0.0Net taxes on production -3030.2 18542.4 14118.5 -23581.2 20381.3 4690.7 333235.3 45683.1 183019.5 24431.4 40547.3 0.0 658038.1 0.0 0.0 0.0 0.0 0.0 0.0 0 0 0.0Industry Output 477475.1 938698.6 1790919.4 1616897.3 328583.1 856800.4 2564676.9 1141163.7 2998286.0 2019130.5 3506228.8 14220.9 18253081.0 0.0 0.0 0.0 0.0 0.0 0.0 0 0 0.0
USA Intermediate Final consumption

DSTI/DOC(2006)8
53
Year: 1997 Type: Industry-by-industry symmetric, total Price Valuation: Basic price Currency: Mill. ARS
1 Primary 2 Othermanuf.
3 Materialmanuf.
4 Machinerymanuf.
5 Utility 6 Construction 7 Trade,hotels andrestaurants
8 Transport andcommunications
9 Finance,insurance andreal estates
10 Businessservices
11 Personalservices
12 Privatehouseholds
Total by household by non-profitorg. servinghouseholds
bygovernment
Gross fixedcapitalformation
Changes inInventories
Valuables Exports (less)Imports
Discrepancy
1 Primary (1-14) 5211.0 14249.0 4263.9 9.8 1307.9 862.8 230.9 9.4 0.1 0.3 136.3 0.0 26281.3 1839.8 0.0 0.0 1402.7 208.5 0.0 5976.6 1365.3 0.02 Other manufacturing (15-20, 36-37) 578.0 11097.2 490.4 425.4 4.4 1668.0 3356.0 18.5 30.4 323.9 901.5 0.0 18893.5 32283.7 0.0 0.0 1030.3 824.3 0.0 10220.5 3166.3 0.03 Material manufacturing (21-28) 2966.2 5390.4 16092.4 4336.1 184.0 6148.5 1890.6 2067.0 379.4 1216.4 2895.9 0.0 43566.8 10057.6 0.0 0.0 699.2 1319.4 0.0 4645.0 9937.1 0.04 Machinery manufacturing (29-35) 691.1 349.6 477.9 6105.3 153.5 1994.7 542.8 1312.9 22.3 228.8 1449.2 0.0 13328.0 5766.2 0.0 0.0 13737.8 76.5 0.0 4042.8 15810.8 0.05 Utility (40-41) 251.7 746.6 1085.9 149.5 2195.4 169.2 742.7 264.9 118.1 208.1 949.1 0.0 6881.1 3670.8 0.0 0.0 0.0 -0.2 0.0 11.3 170.0 0.06 Construction (45) 391.7 104.3 116.3 28.1 3.6 0.2 430.0 67.7 1503.3 113.5 522.9 0.0 3281.6 0.0 0.0 0.0 27399.9 0.0 0.0 7.9 400.3 0.07 Trade, hotels and restaurants (50-55) 733.9 3262.3 2564.2 1030.9 61.6 2038.3 637.0 443.1 123.1 467.8 1064.3 0.0 12426.7 37849.1 0.0 0.0 3250.1 0.0 0.0 791.9 25.8 0.08 Transport and communications (60-64) 704.3 3168.1 2314.3 715.7 698.0 589.5 1570.1 2904.5 802.6 944.0 2423.7 0.0 16834.7 15725.5 0.0 0.0 628.4 -1.3 0.0 1902.9 1504.0 0.09 Finance, insurance and real estates (65-70) 460.1 764.4 672.6 251.3 197.0 407.7 5090.8 1709.3 2882.8 721.9 3155.4 0.0 16313.5 33242.5 0.0 0.0 1891.1 0.0 0.0 78.8 447.3 0.010 Business services (71-74) 411.7 1803.8 2357.6 526.6 367.8 1016.2 2574.3 1914.1 2004.5 771.0 3541.2 0.0 17288.8 756.6 0.0 370.5 0.0 0.0 0.0 24.0 391.5 0.011 Personal services (80-93) 896.3 639.2 1033.4 82.2 312.3 87.9 612.8 1555.6 328.5 1243.7 4351.1 0.0 11143.1 23753.1 3821.3 36675.5 392.6 0.0 0.0 90.9 146.4 0.012 Private households and extra-territorial org. (95-99) 0.0 0.0 0.0 0.0 0.0 0.0 0.0 0.0 0.0 0.0 0.0 0.0 0.0 4530.4 0.0 0.0 0.0 0.0 0.0 0.0 0.0 0.0SBFD including Other Adjustments (Purchases onthe domestic territory by non-residents)
0.0 0.0 0.0 0.0 0.0 0.0 0.0 0.0 0.0 0.0 0.0 0.0 0.0 -2929.5 0.0 0.0 0.0 0.0 0.0 2929.5 0.0 0.0
Noncomparable imports (cif/fob adj, Directpurchases abroad by residents)
0.0 0.0 0.0 0.0 0.0 0.0 0.0 -222.3 -151.2 0.0 0.0 0.0 -373.5 4122.7 0.0 0.0 0.0 0.0 0.0 0.0 0.0 0.0
Intermediate consumption /final use at basic prices 13296.0 41574.9 31468.8 13661.0 5485.5 14983.0 17678.0 12044.5 8044.0 6239.4 21390.6 0.0 185865.6 170668.6 3821.3 37046.0 50432.1 2427.3 0.0 30722.1 33364.8 0.0Net taxes on products 663.3 777.7 1120.6 613.3 121.4 489.4 518.3 1605.4 935.7 232.5 2850.6 0.0 9928.1 22703.4 0.0 0.0 3414.2 -0.9 0.0 227.0 4196.6 0.0Intermediate consumption /final use at purchasersprices
13959.3 42352.6 32589.3 14274.2 5606.9 15472.4 18196.3 13649.9 8979.6 6471.9 24241.1 0.0 195793.7 193372.0 3821.3 37046.0 53846.3 2426.4 0.0 30949.1 37561.4 0.0
Value Added 20384.2 17733.4 17761.7 6866.4 4786.1 14816.6 36095.7 19936.4 42098.9 11576.5 51489.0 4530.4 248075.3 0.0 0.0 0.0 0.0 0.0 0.0 0.0 0.0 0.0Gross Operating Surplus (=net operating surplus +depreciation of fix capital)
0.0 0.0 0.0 0.0 0.0 0.0 0.0 0.0 0.0 0.0 0.0 0.0 0.0 0.0 0.0 0.0 0.0 0.0 0.0 0.0 0.0 0.0
Compensation of Employees 0.0 0.0 0.0 0.0 0.0 0.0 0.0 0.0 0.0 0.0 0.0 0.0 0.0 0.0 0.0 0.0 0.0 0.0 0.0 0.0 0.0 0.0Net taxes on production 0.0 0.0 0.0 0.0 0.0 0.0 0.0 0.0 0.0 0.0 0.0 0.0 0.0 0.0 0.0 0.0 0.0 0.0 0.0 0.0 0.0 0.0Industry Output 34343.5 60086.0 50351.0 21140.6 10393.0 30289.1 54292.0 33586.3 51078.5 18048.4 75730.1 4530.4 443869.0 0.0 0.0 0.0 0.0 0.0 0.0 0.0 0.0 0.0
Argentina Intermediate Final consumption

DSTI/DOC(2006)8
54
Year: 2000 Type: Industry-by-industry symmetric, total Price Valuation: Basic price Currency: Mill. BRL
1 Primary 2 Othermanuf.
3 Materialmanuf.
4 Machinerymanuf.
5 Utility 6 Construction 7 Trade,hotels andrestaurants
8 Transport andcommunications
9 Finance,insurance andreal estates
10 Businessservices
11 Personalservices
12 Privatehouseholds
Total by household by non-profitorg. servinghouseholds
bygovernment
Gross fixedcapitalformation
Changes inInventories
Valuables Exports (less)Imports
Discrepancy
1 Primary (1-14) 23.2 61.5 39.4 0.2 0.1 0.4 2.1 0.0 0.0 0.0 3.0 0.1 130.0 36.3 0.0 0.0 3.3 10.4 0.0 10.6 11.9 0.02 Other manufacturing (15-20, 36-37) 6.8 48.7 4.1 1.2 0.2 3.2 15.5 1.2 0.2 0.4 6.9 0.2 88.6 120.9 0.0 0.0 2.4 4.9 0.0 25.2 8.6 0.03 Material manufacturing (21-28) 22.4 20.6 135.2 31.6 1.7 34.6 33.7 19.8 0.7 5.1 12.5 0.1 318.1 37.3 0.0 0.0 2.3 3.5 0.0 25.0 40.6 0.04 Machinery manufacturing (29-35) 1.9 2.7 7.7 26.1 2.2 6.0 5.7 7.7 0.8 1.3 4.0 0.0 66.1 45.4 0.0 0.0 47.4 3.4 0.0 23.6 47.1 0.05 Utility (40-41) 1.8 3.7 8.2 1.6 17.1 0.3 3.6 0.8 0.8 0.5 5.6 0.1 44.1 17.6 0.0 0.0 0.0 0.0 0.0 0.1 1.8 0.06 Construction (45) 0.2 0.3 0.5 0.2 0.3 5.8 0.5 0.7 4.7 0.1 1.6 0.0 15.0 0.0 0.0 0.0 141.9 0.0 0.0 0.2 0.0 0.07 Trade, hotels and restaurants (50-55) 6.5 13.8 12.8 7.7 1.0 5.1 6.3 5.5 4.1 1.5 17.4 0.1 81.7 103.8 0.0 0.0 5.1 1.2 0.0 11.9 9.1 0.08 Transport and communications (60-64) 3.5 6.2 9.8 3.6 0.3 2.3 9.6 13.0 3.0 2.1 5.5 0.1 59.0 51.8 0.0 0.0 0.6 0.4 0.0 4.1 0.4 0.09 Finance, insurance and real estates (65-70) 6.6 5.4 9.3 4.6 2.9 4.9 12.8 6.1 16.1 2.5 6.0 0.1 77.3 135.4 0.0 0.0 0.0 0.0 0.0 0.6 1.1 0.010 Business services (71-74) 2.5 3.0 3.0 2.2 0.7 1.9 8.4 3.9 7.3 2.3 14.4 0.0 49.8 2.1 0.0 0.0 1.3 0.0 0.0 7.4 10.4 0.011 Personal services (80-93) 1.5 1.7 2.8 1.1 0.3 0.7 3.5 1.5 2.8 1.3 10.6 0.0 27.9 66.3 0.0 210.0 1.0 0.0 0.0 1.4 3.4 0.012 Private households and extra-territorial org. (95-99) 0.0 0.0 0.0 0.0 0.0 0.0 0.0 0.0 0.0 0.0 0.0 0.0 0.0 10.7 0.0 0.0 0.0 0.0 0.0 0.0 0.0 0.0SBFD including Other Adjustments (Purchases onthe domestic territory by non-residents)
0.0 0.0 0.0 0.0 0.0 0.0 0.0 0.0 0.0 0.0 0.0 0.0 0.0 0.0 0.0 0.0 0.0 0.0 0.0 0.0 0.0 0.0
Noncomparable imports (cif/fob adj, Directpurchases abroad by residents)
0.0 0.0 0.0 0.0 0.0 0.0 0.0 0.0 0.0 0.0 0.0 0.0 0.0 0.0 0.0 0.0 0.0 0.0 0.0 0.0 0.0 0.0
Intermediate consumption /final use at basic prices 76.8 167.8 233.0 80.1 26.7 65.3 101.8 60.3 40.6 17.2 87.4 0.8 957.6 627.5 0.0 210.0 205.4 23.8 0.0 110.1 134.3 0.0Net taxes on products 3.3 8.9 10.7 7.4 2.7 7.1 6.1 4.4 1.6 1.4 7.2 0.1 60.6 43.2 0.0 0.0 7.0 1.1 0.0 7.5 0.0 0.0Intermediate consumption /final use at purchasersprices
80.1 176.7 243.7 87.5 29.3 72.3 107.9 64.7 42.1 18.5 94.5 0.9 1018.2 670.7 0.0 210.0 212.4 24.9 0.0 117.7 134.3 0.0
Value Added 98.7 56.8 101.9 51.3 30.7 84.8 86.6 50.8 170.1 31.6 208.8 9.8 981.9 0.0 0.0 0.0 0.0 0.0 0.0 0.0 0.0 0.0Gross Operating Surplus (=net operating surplus +depreciation of fix capital)
83.7 27.0 60.9 28.7 19.3 68.8 34.5 25.8 130.6 9.0 17.6 0.0 506.1 0.0 0.0 0.0 0.0 0.0 0.0 0.0 0.0 0.0
Compensation of Employees 14.5 20.4 26.2 17.1 8.7 11.5 45.3 21.3 34.2 20.9 187.2 9.7 417.1 0.0 0.0 0.0 0.0 0.0 0.0 0.0 0.0 0.0Net taxes on production 0.5 9.4 14.8 5.5 2.7 4.5 6.8 3.7 5.4 1.6 3.9 0.1 58.7 0.0 0.0 0.0 0.0 0.0 0.0 0.0 0.0 0.0Industry Output 178.8 233.5 345.5 138.8 60.0 157.1 194.5 115.6 212.2 50.1 303.3 10.7 2000.0 670.7 0.0 210.0 212.4 24.9 0.0 117.4 0.0 0.0
Brazil Intermediate Final consumption

DSTI/DOC(2006)8
55
Year: 2000 Type: Commodity-by-commodity symmetric, total Price Valuation: Producers� price Currency: 10000 CNY
1 Primary 2 Othermanuf.
3 Materialmanuf.
4 Machinerymanuf.
5 Utility 6 Construction 7 Trade,hotels andrestaurants
8 Transport andcommunications
9 Finance,insurance andreal estates
10 Businessservices
11 Personalservices
12 Privatehouseholds
Total by household by non-profitorg. servinghouseholds
bygovernment
Gross fixedcapitalformation
Changes inInventories
Valuables Exports (less)Imports
Discrepancy
1 Primary (1-14) 421347 778588 762791 18982 123896 30065 92801 4088 1439 21989 6416 5 2262408 1080907 0 0 72241 69496 0 82574 227075 383022 Other manufacturing (15-20, 36-37) 196816 980848 164229 47411 7154 51639 169026 16214 9547 53796 25122 19 1721819 1355723 0 0 21779 -196943 0 794896 204062 1191043 Material manufacturing (21-28) 387581 366794 2076599 1066770 115187 884932 135336 148661 24475 117783 165248 709 5490076 305040 0 0 21418 -62995 0 448905 625619 296874 Machinery manufacturing (29-35) 104725 42659 188279 1530860 102774 228029 159864 156936 26919 125636 65662 176 2732520 346294 0 0 859047 102593 0 728271 802952 2027055 Utility (40-41) 87645 53555 385887 79233 91708 38021 37482 32524 8011 19736 38374 1086 873263 106402 0 0 0 -4876 0 4876 797 -189426 Construction (45) 6313 2271 4857 4430 2785 1326 10124 22358 25738 19216 36774 61 136254 0 0 0 2168771 0 0 2492 4115 -876987 Trade, hotels and restaurants (50-55) 65104 179892 245170 153155 49882 133377 157475 26892 21767 59119 88673 50 1180556 369950 0 0 37216 3967 0 166568 20261 678428 Transport and communications (60-64) 55123 61733 181476 91540 33470 132685 59091 42312 24206 68898 98948 60 849543 165196 0 0 7718 -130 0 75756 15758 -296489 Finance, insurance and real estates (65-70) 25533 33180 91337 56047 22577 20502 96017 19345 70739 23122 26867 49 485314 301620 0 0 50437 0 0 1564 20456 -574410 Business services (71-74) 62865 37143 61420 50191 16172 83819 73175 34005 32008 75357 31758 188 558101 184621 0 264609 0 70768 0 594 1 -5972411 Personal services (80-93) 3849 2104 7414 7622 1934 5098 4842 3371 1624 7038 8391 26 53313 201536 0 905921 0 9843 0 4555 2785 -5351912 Private households and extra-territorial org. (95-99) 150 32 2961 98 320 236 68 227 11 61 27 17 4208 72 0 0 0 -894 0 1246 2231 2001SBFD including Other Adjustments (Purchases onthe domestic territory by non-residents)
0 0 0 0 0 0 0 0 0 0 0 0 0 0 0 0 0 0 0 0 0 0
Noncomparable imports (cif/fob adj, Directpurchases abroad by residents)
5407 32377 43465 58602 3203 11666 5264 3068 1049 6441 2664 7 173214 19794 0 0 23752 4368 0 0 0 0
Intermediate consumption /final use at basic prices 1422457 2571177 4215885 3164941 571063 1621398 1000565 510003 247533 598192 594922 2454 16520591 4437155 0 1170530 3262380 -4803 0 2312298 1926111 204368Net taxes on products 0 0 0 0 0 0 0 0 0 0 0 0 0 0 0 0 0 0 0 0 0 0Intermediate consumption /final use at purchasersprices
1422457 2571177 4215885 3164941 571063 1621398 1000565 510003 247533 598192 594922 2454 16520591 4437155 0 1170530 3262380 -4803 0 2312298 1926111 204368
Value Added 1956397 1041139 1390629 1003537 388863 594306 805274 542676 565203 420777 523941 1947 9234688 0 0 0 0 0 0 0 0 0Gross Operating Surplus (=net operating surplus +depreciation of fix capital)
370289 364668 529479 394184 206165 149060 182911 283773 242167 108576 68972 1241 2901486 0 0 0 0 0 0 0 0 0
Compensation of Employees 1479499 457136 554206 446964 102260 390532 426021 225244 186744 270504 452300 550 4991959 0 0 0 0 0 0 0 0 0Net taxes on production 106609 219334 306944 162389 80438 54714 196342 33659 136292 41697 2669 156 1341243 0 0 0 0 0 0 0 0 0Industry Output 3378854 3612316 5606514 4168478 959926 2215705 1805839 1052679 812736 1018969 1118863 4401 25755278 0 0 0 0 0 0 0 0 0
China Intermediate Final consumption

DSTI/DOC(2006)8
56
Year: 2001 Type: Commodity-by-industry symmetric, total Price Valuation: Basic price Currency: Mill. TWD
1 Primary 2 Othermanuf.
3 Materialmanuf.
4 Machinerymanuf.
5 Utility 6 Construction 7 Trade,hotels andrestaurants
8 Transport andcommunications
9 Finance,insurance andreal estates
10 Businessservices
11 Personalservices
12 Privatehouseholds
Total by household by non-profitorg. servinghouseholds
bygovernment
Gross fixedcapitalformation
Changes inInventories
Valuables Exports (less)Imports
Discrepancy
1 Primary (1-14) 86909 207876 313806 1664 68085 37197 733 37 0 267 1052 0 717624 189753 0 0 6209 -10565 0 47596 436734 02 Other manufacturing (15-20, 36-37) 66292 338253 96278 58357 1531 28777 26531 6861 2010 25377 112317 0 762585 693679 0 0 7134 -21699 0 564196 393804 03 Material manufacturing (21-28) 41062 242163 1528133 615951 62380 292767 103795 113066 18791 100963 89774 0 3208844 272809 0 0 5198 -21200 0 829208 953203 04 Machinery manufacturing (29-35) 8851 18549 39006 1565754 15400 89771 37185 42820 5030 52469 47757 0 1922592 416210 0 0 918321 -42772 0 2341800 1791964 05 Utility (40-41) 5694 29930 106883 35200 49004 3011 47523 12443 3920 6721 34546 0 334875 107426 0 0 0 0 0 489 1297 06 Construction (45) 1164 2040 4937 5066 5894 634 6673 14952 90844 964 8953 0 142120 0 0 0 801427 0 0 3237 7939 07 Trade, hotels and restaurants (50-55) 16805 72562 164625 183676 3889 61731 64204 59867 6372 33768 44176 0 711675 1271288 0 0 130699 419 0 456042 144688 08 Transport and communications (60-64) 7224 28422 55541 56475 2772 38487 88943 129794 19512 34360 67214 0 528742 423931 0 0 8626 -1219 0 320920 136858 09 Finance, insurance and real estates (65-70) 24699 132781 99184 99357 12869 16505 195320 51775 362911 34575 47021 0 1076998 1345456 0 104 32789 0 0 20506 33847 010 Business services (71-74) 3376 48825 72383 153298 8532 51464 135790 83887 102781 47639 58558 0 766533 48465 0 29344 387 1554 0 135670 180852 011 Personal services (80-93) 1069 45328 11802 17640 391 7960 40057 5539 23858 45378 46808 0 245830 968101 0 1211677 0 0 0 14359 51576 012 Private households and extra-territorial org. (95-99) 0 0 0 0 0 0 0 0 0 0 0 0 0 74223 0 0 0 0 0 300 451 0SBFD including Other Adjustments (Purchases onthe domestic territory by non-residents)
0 0 0 0 0 0 0 0 0 0 0 0 0 0 0 0 0 0 0 0 0 0
Noncomparable imports (cif/fob adj, Directpurchases abroad by residents)
0 0 0 0 0 0 0 0 0 0 0 0 0 0 0 0 0 0 0 0 0 0
Intermediate consumption /final use at basic prices 263146 1166729 2492578 2792438 230746 628303 746754 521041 636029 382479 558175 0 10418417 5811342 0 1241125 1910788 -95482 0 4734322 4133212 0Net taxes on products 5722 24738 52799 54922 5079 11023 11402 11780 15308 6715 21439 0 220926 209883 0 0 81766 -3557 0 9204 0 0Intermediate consumption /final use at purchasersprices
268868 1191467 2545377 2847361 235825 639326 758155 532821 651337 389194 579613 0 10639344 6021225 0 1241125 1992554 -99039 0 4743526 4133212 0
Value Added 245014 420624 796279 916825 205668 299520 1667278 611322 1790669 411908 1808778 74072 9247957 0 0 0 0 0 0 0 0 0Gross Operating Surplus (=net operating surplus +depreciation of fix capital)
83766 231723 270902 363386 145456 62659 465430 239585 1301554 112374 287061 0 3563895 0 0 0 0 0 0 0 0 0
Compensation of Employees 165917 239971 450846 509908 53052 243635 1174268 357191 449851 300055 1539130 75008 5558832 0 0 0 0 0 0 0 0 0Net taxes on production -4669 -51069 74531 43532 7160 -6774 27581 14546 39264 -522 -17413 -936 125231 0 0 0 0 0 0 0 0 0Industry Output 513882 1612091 3341656 3764186 441493 938846 2425433 1144143 2442006 801102 2388391 74072 19887301 0 0 0 0 0 0 0 0 0
Chinese Taipei Intermediate Final consumption
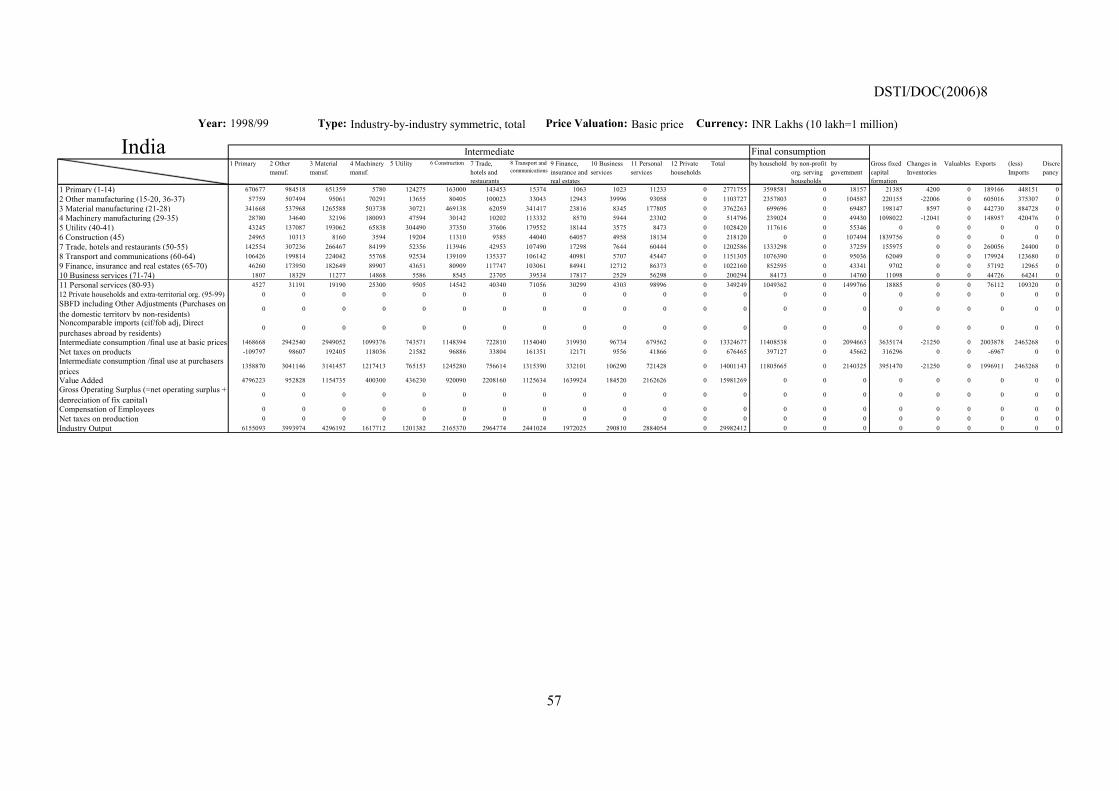
DSTI/DOC(2006)8
57
Year: 1998/99 Type: Industry-by-industry symmetric, total Price Valuation: Basic price Currency: INR Lakhs (10 lakh=1 million)
1 Primary 2 Othermanuf.
3 Materialmanuf.
4 Machinerymanuf.
5 Utility 6 Construction 7 Trade,hotels andrestaurants
8 Transport andcommunications
9 Finance,insurance andreal estates
10 Businessservices
11 Personalservices
12 Privatehouseholds
Total by household by non-profitorg. servinghouseholds
bygovernment
Gross fixedcapitalformation
Changes inInventories
Valuables Exports (less)Imports
Discrepancy
1 Primary (1-14) 670677 984518 651359 5780 124275 163000 143453 15374 1063 1023 11233 0 2771755 3598581 0 18157 21385 4200 0 189166 448151 02 Other manufacturing (15-20, 36-37) 57759 507494 95061 70291 13655 80405 100023 33043 12943 39996 93058 0 1103727 2357803 0 104587 220155 -22006 0 605016 375307 03 Material manufacturing (21-28) 341668 537968 1265588 503738 30721 469138 62059 341417 23816 8345 177805 0 3762263 699696 0 69487 198147 8597 0 442730 884728 04 Machinery manufacturing (29-35) 28780 34640 32196 180093 47594 30142 10202 113332 8570 5944 23302 0 514796 239024 0 49430 1098022 -12041 0 148957 420476 05 Utility (40-41) 43245 137087 193062 65838 304490 37350 37606 179552 18144 3575 8473 0 1028420 117616 0 55346 0 0 0 0 0 06 Construction (45) 24965 10313 8160 3594 19204 11310 9385 44040 64057 4958 18134 0 218120 0 0 107494 1839756 0 0 0 0 07 Trade, hotels and restaurants (50-55) 142554 307236 266467 84199 52356 113946 42953 107490 17298 7644 60444 0 1202586 1333298 0 37259 155975 0 0 260056 24400 08 Transport and communications (60-64) 106426 199814 224042 55768 92534 139109 135337 106142 40981 5707 45447 0 1151305 1076390 0 95036 62049 0 0 179924 123680 09 Finance, insurance and real estates (65-70) 46260 173950 182649 89907 43651 80909 117747 103061 84941 12712 86373 0 1022160 852595 0 43341 9702 0 0 57192 12965 010 Business services (71-74) 1807 18329 11277 14868 5586 8545 23705 39534 17817 2529 56298 0 200294 84173 0 14760 11098 0 0 44726 64241 011 Personal services (80-93) 4527 31191 19190 25300 9505 14542 40340 71056 30299 4303 98996 0 349249 1049362 0 1499766 18885 0 0 76112 109320 012 Private households and extra-territorial org. (95-99) 0 0 0 0 0 0 0 0 0 0 0 0 0 0 0 0 0 0 0 0 0 0SBFD including Other Adjustments (Purchases onthe domestic territory by non-residents)
0 0 0 0 0 0 0 0 0 0 0 0 0 0 0 0 0 0 0 0 0 0
Noncomparable imports (cif/fob adj, Directpurchases abroad by residents)
0 0 0 0 0 0 0 0 0 0 0 0 0 0 0 0 0 0 0 0 0 0
Intermediate consumption /final use at basic prices 1468668 2942540 2949052 1099376 743571 1148394 722810 1154040 319930 96734 679562 0 13324677 11408538 0 2094663 3635174 -21250 0 2003878 2463268 0Net taxes on products -109797 98607 192405 118036 21582 96886 33804 161351 12171 9556 41866 0 676465 397127 0 45662 316296 0 0 -6967 0 0Intermediate consumption /final use at purchasersprices
1358870 3041146 3141457 1217413 765153 1245280 756614 1315390 332101 106290 721428 0 14001143 11805665 0 2140325 3951470 -21250 0 1996911 2463268 0
Value Added 4796223 952828 1154735 400300 436230 920090 2208160 1125634 1639924 184520 2162626 0 15981269 0 0 0 0 0 0 0 0 0Gross Operating Surplus (=net operating surplus +depreciation of fix capital)
0 0 0 0 0 0 0 0 0 0 0 0 0 0 0 0 0 0 0 0 0 0
Compensation of Employees 0 0 0 0 0 0 0 0 0 0 0 0 0 0 0 0 0 0 0 0 0 0Net taxes on production 0 0 0 0 0 0 0 0 0 0 0 0 0 0 0 0 0 0 0 0 0 0Industry Output 6155093 3993974 4296192 1617712 1201382 2165370 2964774 2441024 1972025 290810 2884054 0 29982412 0 0 0 0 0 0 0 0 0
India Intermediate Final consumption

DSTI/DOC(2006)8
58
Year: 2000 Type: Commodity-by-commodity symmetric, total Price valuation: Basic price Currency: Billion IDR
1 Primary 2 Othermanuf.
3 Materialmanuf.
4 Machinerymanuf.
5 Utility 6 Construction 7 Trade,hotels andrestaurants
8 Transport andcommunications
9 Finance,insurance andreal estates
10 Businessservices
11 Personalservices
12 Privatehouseholds
Total by household by non-profitorg. servinghouseholds
bygovernment
Gross fixedcapitalformation
Changes inInventories
Valuables Exports (less)Imports
Discrepancy
1 Primary (1-14) 59311.8 129857.9 81404.4 143.9 14113.8 18607.5 11418.5 401.9 1.7 43.4 2830.6 126.3 318261.9 110891.4 0.0 0.0 187.4 9040.4 0.0 135549.7 44060.9 0.02 Other manufacturing (15-20, 36-37) 19477.7 98973.4 2952.7 704.9 3.2 7313.9 23367.1 3572.4 124.2 191.8 6463.6 100.7 163245.7 256700.3 0.0 0.0 1502.4 1393.9 0.0 146743.9 43888.2 0.03 Material manufacturing (21-28) 11610.6 31188.3 84339.1 23332.8 2748.6 71533.4 18246.3 17831.0 1320.7 1875.3 15793.7 265.1 280084.9 61515.7 0.0 430.6 873.0 6390.0 0.0 103928.7 140587.8 0.04 Machinery manufacturing (29-35) 2700.2 971.6 774.6 39847.0 347.4 8749.6 14435.6 13517.2 76.3 2051.5 1664.4 7.2 85142.6 42168.9 0.0 0.0 43362.9 262.0 0.0 78497.6 94203.8 0.05 Utility (40-41) 155.8 3633.1 4073.5 1616.1 2337.3 160.5 6214.4 726.3 464.7 468.4 1756.3 58.8 21665.2 11900.2 0.0 0.0 0.0 0.0 0.0 0.0 0.0 0.06 Construction (45) 4257.5 220.0 251.5 200.8 270.9 172.1 3060.4 3141.1 3082.5 639.0 3712.2 7.8 19015.7 0.0 0.0 0.0 207304.5 0.0 0.0 0.0 0.0 0.07 Trade, hotels and restaurants (50-55) 10112.8 57774.7 11961.9 17896.5 977.7 20465.4 37096.8 16732.0 2821.4 4594.6 17409.1 223.1 198066.0 147059.8 0.0 0.0 9101.3 1193.7 0.0 57294.4 18622.6 0.08 Transport and communications (60-64) 4373.5 13124.4 11084.6 7116.7 392.3 7429.8 15963.8 16709.9 2871.5 2658.1 6227.4 68.1 88019.9 66046.0 0.0 0.0 2193.6 468.2 0.0 26099.0 31697.5 0.09 Finance, insurance and real estates (65-70) 2020.5 6462.0 4172.2 3848.8 164.2 5902.6 27108.5 5503.3 9190.0 5364.5 2961.9 44.9 72743.5 46647.4 0.0 0.0 0.0 0.0 0.0 10904.1 9223.1 0.010 Business services (71-74) 1855.3 2336.6 1903.9 4310.6 645.0 9567.6 11435.2 6731.0 4724.1 1544.2 3876.7 105.3 49035.5 11524.1 0.0 6397.3 224.5 6.3 0.0 1816.0 23120.0 0.011 Personal services (80-93) 167.8 789.8 370.4 99.8 27.4 774.8 1188.5 1472.9 1103.3 2461.6 4403.4 53.8 12913.5 73923.5 0.0 83951.7 428.4 27.8 0.0 8562.2 13236.3 0.012 Private households and extra-territorial org. (95-99) 17.7 263.8 1035.2 24.5 0.0 37.3 574.8 34.8 2.6 70.1 27.2 10.2 2098.2 941.7 0.0 0.0 0.0 0.5 0.0 94.5 78.6 0.0SBFD including Other Adjustments (Purchases onthe domestic territory by non-residents)
0.0 0.0 0.0 0.0 0.0 0.0 0.0 0.0 0.0 0.0 0.0 0.0 0.0 0.0 0.0 0.0 0.0 0.0 0.0 0.0 0.0 0.0
Noncomparable imports (cif/fob adj, Directpurchases abroad by residents)
0.0 0.0 0.0 0.0 0.0 0.0 0.0 0.0 0.0 0.0 0.0 0.0 0.0 0.0 0.0 0.0 0.0 0.0 0.0 0.0 0.0 0.0
Intermediate consumption /final use at basic prices 116061.2 345595.5 204324.1 99142.5 22027.8 150714.4 170109.8 86373.9 25783.1 21962.5 67126.6 1071.1 1310292.6 829319.1 0.0 90779.6 265177.9 18782.8 0.0 569490.2 418718.9 0.0Net taxes on products 1898.0 3750.0 4729.3 10810.1 216.1 389.3 609.9 366.3 442.0 119.0 937.9 17.9 24286.0 0.0 0.0 0.0 0.0 0.0 0.0 0.0 0.0 0.0Intermediate consumption /final use at purchasersprices
117959.2 349345.5 209053.4 109952.6 22244.0 151103.7 170719.7 86740.2 26225.1 22081.5 68064.6 1089.0 1334578.6 829319.1 0.0 90779.6 265177.9 18782.8 0.0 569490.2 418718.9 0.0
Value Added 413518.6 178374.6 107192.3 49094.3 8177.6 76184.1 225132.3 64898.5 95130.6 23965.0 98568.2 1978.2 1342214.3 0.0 0.0 0.0 0.0 0.0 0.0 0.0 0.0 0.0Gross Operating Surplus (=net operating surplus +depreciation of fix capital)
328883.4 105522.7 70055.3 36448.2 8747.6 35951.4 149175.4 45963.1 79555.9 11328.8 18897.2 1189.4 891718.6 0.0 0.0 0.0 0.0 0.0 0.0 0.0 0.0 0.0
Compensation of Employees 76852.3 54019.8 35004.5 18576.7 2279.4 37132.5 61099.4 17023.5 13724.0 11886.1 79823.8 759.8 408181.8 0.0 0.0 0.0 0.0 0.0 0.0 0.0 0.0 0.0Net taxes on production 7782.9 18832.1 2132.5 -5930.6 -2849.4 3100.2 14857.5 1911.8 1850.7 750.2 -152.9 29.0 42313.9 0.0 0.0 0.0 0.0 0.0 0.0 0.0 0.0 0.0Industry Output 529869.8 525698.0 312635.1 155230.1 33565.4 226320.2 394092.6 151129.1 121071.9 45883.8 166570.9 3056.3 2665123.1 0.0 0.0 0.0 0.0 0.0 0.0 0.0 0.0 0.0
Indonesia Intermediate Final consumption
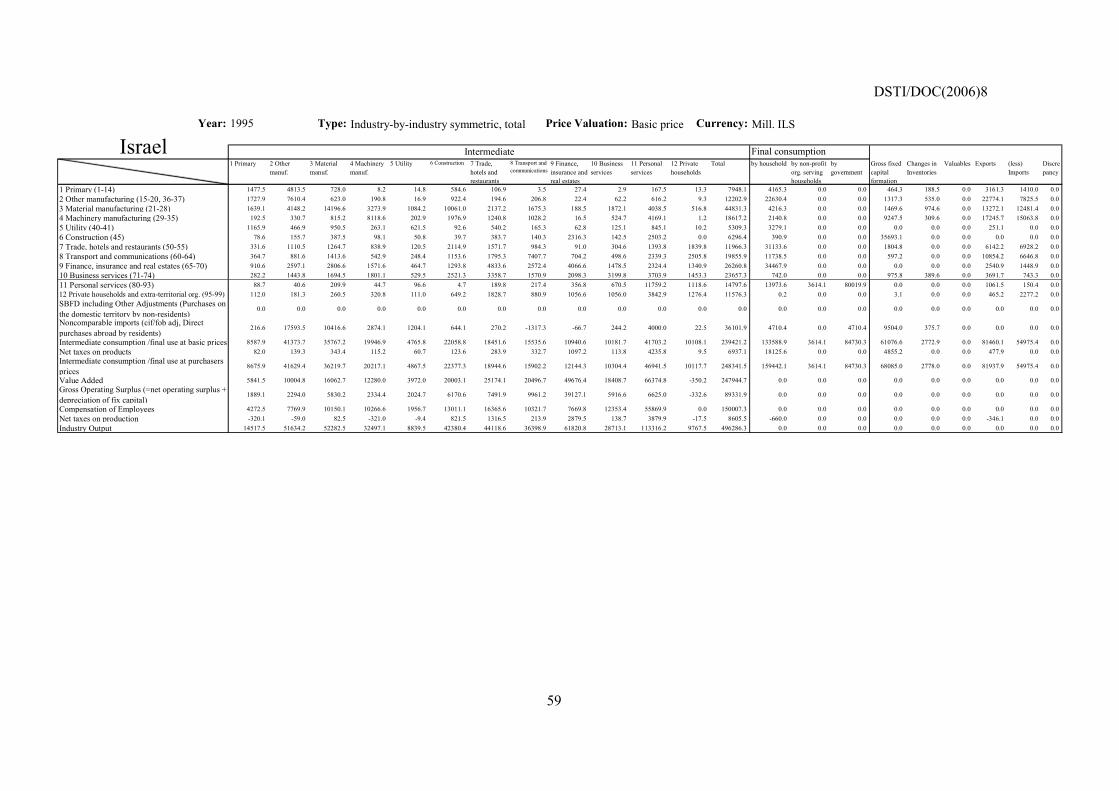
DSTI/DOC(2006)8
59
Year: 1995 Type: Industry-by-industry symmetric, total Price Valuation: Basic price Currency: Mill. ILS
1 Primary 2 Othermanuf.
3 Materialmanuf.
4 Machinerymanuf.
5 Utility 6 Construction 7 Trade,hotels andrestaurants
8 Transport andcommunications
9 Finance,insurance andreal estates
10 Businessservices
11 Personalservices
12 Privatehouseholds
Total by household by non-profitorg. servinghouseholds
bygovernment
Gross fixedcapitalformation
Changes inInventories
Valuables Exports (less)Imports
Discrepancy
1 Primary (1-14) 1477.5 4813.5 728.0 8.2 14.8 584.6 106.9 3.5 27.4 2.9 167.5 13.3 7948.1 4165.3 0.0 0.0 464.3 188.5 0.0 3161.3 1410.0 0.02 Other manufacturing (15-20, 36-37) 1727.9 7610.4 623.0 190.8 16.9 922.4 194.6 206.8 22.4 62.2 616.2 9.3 12202.9 22630.4 0.0 0.0 1317.3 535.0 0.0 22774.1 7825.5 0.03 Material manufacturing (21-28) 1639.1 4148.2 14196.6 3273.9 1084.2 10061.0 2137.2 1675.3 188.5 1872.1 4038.5 516.8 44831.3 4216.3 0.0 0.0 1469.6 974.6 0.0 13272.1 12481.4 0.04 Machinery manufacturing (29-35) 192.5 330.7 815.2 8118.6 202.9 1976.9 1240.8 1028.2 16.5 524.7 4169.1 1.2 18617.2 2140.8 0.0 0.0 9247.5 309.6 0.0 17245.7 15063.8 0.05 Utility (40-41) 1165.9 466.9 950.5 263.1 621.5 92.6 540.2 165.3 62.8 125.1 845.1 10.2 5309.3 3279.1 0.0 0.0 0.0 0.0 0.0 251.1 0.0 0.06 Construction (45) 78.6 155.7 387.5 98.1 50.8 39.7 383.7 140.3 2316.3 142.5 2503.2 0.0 6296.4 390.9 0.0 0.0 35693.1 0.0 0.0 0.0 0.0 0.07 Trade, hotels and restaurants (50-55) 331.6 1110.5 1264.7 838.9 120.5 2114.9 1571.7 984.3 91.0 304.6 1393.8 1839.8 11966.3 31133.6 0.0 0.0 1804.8 0.0 0.0 6142.2 6928.2 0.08 Transport and communications (60-64) 364.7 881.6 1413.6 542.9 248.4 1153.6 1795.3 7407.7 704.2 498.6 2339.3 2505.8 19855.9 11738.5 0.0 0.0 597.2 0.0 0.0 10854.2 6646.8 0.09 Finance, insurance and real estates (65-70) 910.6 2597.1 2806.6 1571.6 464.7 1293.8 4833.6 2572.4 4066.6 1478.5 2324.4 1340.9 26260.8 34467.9 0.0 0.0 0.0 0.0 0.0 2540.9 1448.9 0.010 Business services (71-74) 282.2 1443.8 1694.5 1801.1 529.5 2521.3 3358.7 1570.9 2098.3 3199.8 3703.9 1453.3 23657.3 742.0 0.0 0.0 975.8 389.6 0.0 3691.7 743.3 0.011 Personal services (80-93) 88.7 40.6 209.9 44.7 96.6 4.7 189.8 217.4 356.8 670.5 11759.2 1118.6 14797.6 13973.6 3614.1 80019.9 0.0 0.0 0.0 1061.5 150.4 0.012 Private households and extra-territorial org. (95-99) 112.0 181.3 260.5 320.8 111.0 649.2 1828.7 880.9 1056.6 1056.0 3842.9 1276.4 11576.3 0.2 0.0 0.0 3.1 0.0 0.0 465.2 2277.2 0.0SBFD including Other Adjustments (Purchases onthe domestic territory by non-residents)
0.0 0.0 0.0 0.0 0.0 0.0 0.0 0.0 0.0 0.0 0.0 0.0 0.0 0.0 0.0 0.0 0.0 0.0 0.0 0.0 0.0 0.0
Noncomparable imports (cif/fob adj, Directpurchases abroad by residents)
216.6 17593.5 10416.6 2874.1 1204.1 644.1 270.2 -1317.3 -66.7 244.2 4000.0 22.5 36101.9 4710.4 0.0 4710.4 9504.0 375.7 0.0 0.0 0.0 0.0
Intermediate consumption /final use at basic prices 8587.9 41373.7 35767.2 19946.9 4765.8 22058.8 18451.6 15535.6 10940.6 10181.7 41703.2 10108.1 239421.2 133588.9 3614.1 84730.3 61076.6 2772.9 0.0 81460.1 54975.4 0.0Net taxes on products 82.0 139.3 343.4 115.2 60.7 123.6 283.9 332.7 1097.2 113.8 4235.8 9.5 6937.1 18125.6 0.0 0.0 4855.2 0.0 0.0 477.9 0.0 0.0Intermediate consumption /final use at purchasersprices
8675.9 41629.4 36219.7 20217.1 4867.5 22377.3 18944.6 15902.2 12144.3 10304.4 46941.5 10117.7 248341.5 159442.1 3614.1 84730.3 68085.0 2778.0 0.0 81937.9 54975.4 0.0
Value Added 5841.5 10004.8 16062.7 12280.0 3972.0 20003.1 25174.1 20496.7 49676.4 18408.7 66374.8 -350.2 247944.7 0.0 0.0 0.0 0.0 0.0 0.0 0.0 0.0 0.0Gross Operating Surplus (=net operating surplus +depreciation of fix capital)
1889.1 2294.0 5830.2 2334.4 2024.7 6170.6 7491.9 9961.2 39127.1 5916.6 6625.0 -332.6 89331.9 0.0 0.0 0.0 0.0 0.0 0.0 0.0 0.0 0.0
Compensation of Employees 4272.5 7769.9 10150.1 10266.6 1956.7 13011.1 16365.6 10321.7 7669.8 12353.4 55869.9 0.0 150007.3 0.0 0.0 0.0 0.0 0.0 0.0 0.0 0.0 0.0Net taxes on production -320.1 -59.0 82.5 -321.0 -9.4 821.5 1316.5 213.9 2879.5 138.7 3879.9 -17.5 8605.5 -660.0 0.0 0.0 0.0 0.0 0.0 -346.1 0.0 0.0Industry Output 14517.5 51634.2 52282.5 32497.1 8839.5 42380.4 44118.6 36398.9 61820.8 28713.1 113316.2 9767.5 496286.3 0.0 0.0 0.0 0.0 0.0 0.0 0.0 0.0 0.0
Israel Intermediate Final consumption
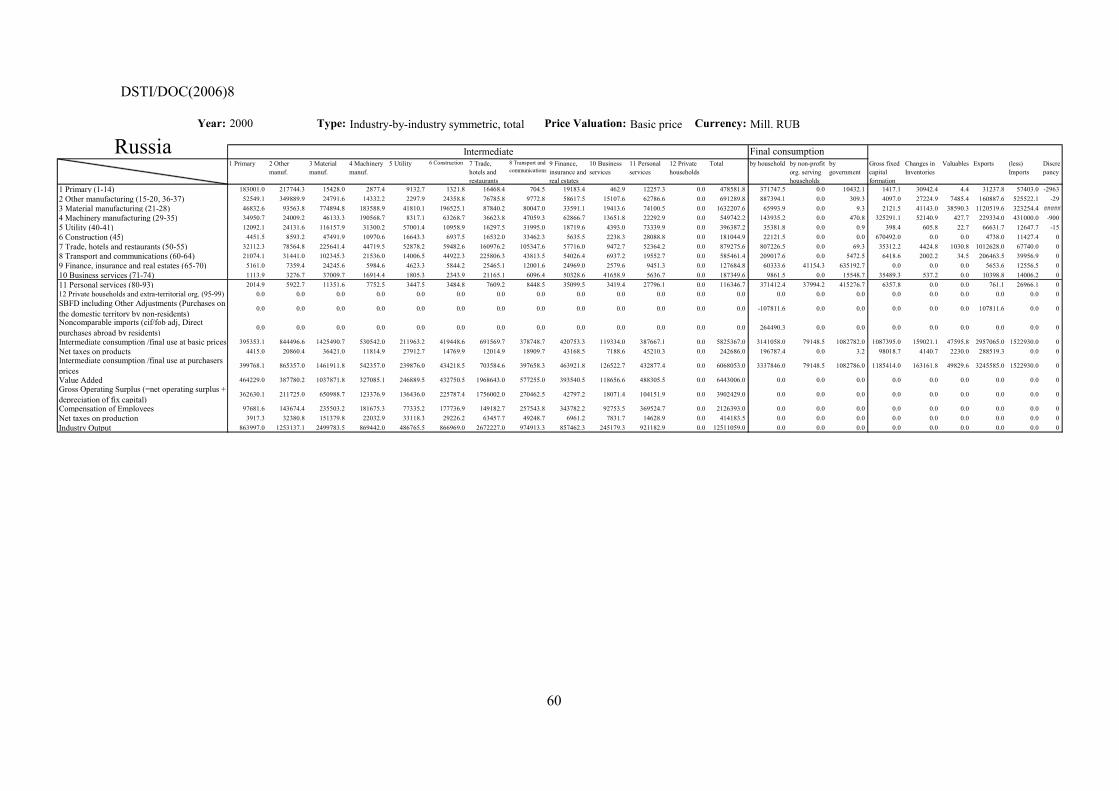
DSTI/DOC(2006)8
60
Year: 2000 Type: Industry-by-industry symmetric, total Price Valuation: Basic price Currency: Mill. RUB
1 Primary 2 Othermanuf.
3 Materialmanuf.
4 Machinerymanuf.
5 Utility 6 Construction 7 Trade,hotels andrestaurants
8 Transport andcommunications
9 Finance,insurance andreal estates
10 Businessservices
11 Personalservices
12 Privatehouseholds
Total by household by non-profitorg. servinghouseholds
bygovernment
Gross fixedcapitalformation
Changes inInventories
Valuables Exports (less)Imports
Discrepancy
1 Primary (1-14) 183001.0 217744.3 15428.0 2877.4 9132.7 1321.8 16468.4 704.5 19183.4 462.9 12257.3 0.0 478581.8 371747.5 0.0 10432.1 1417.1 30942.4 4.4 31237.8 57403.0 -29632 Other manufacturing (15-20, 36-37) 52549.1 349889.9 24791.6 14332.2 2297.9 24358.8 76785.8 9772.8 58617.5 15107.6 62786.6 0.0 691289.8 887394.1 0.0 309.3 4097.0 27224.9 7485.4 160887.6 525522.1 -293 Material manufacturing (21-28) 46832.6 93563.8 774894.8 183588.9 41810.1 196525.1 87840.2 80047.0 33591.1 19413.6 74100.5 0.0 1632207.6 65993.9 0.0 9.3 2121.5 41143.0 38590.3 1120519.6 323254.4 #####4 Machinery manufacturing (29-35) 34950.7 24009.2 46133.3 190568.7 8317.1 63268.7 36623.8 47059.3 62866.7 13651.8 22292.9 0.0 549742.2 143935.2 0.0 470.8 325291.1 52140.9 427.7 229334.0 431000.0 -9005 Utility (40-41) 12092.1 24131.6 116157.9 31300.2 57001.4 10958.9 16297.5 31995.0 18719.6 4393.0 73339.9 0.0 396387.2 35381.8 0.0 0.9 398.4 605.8 22.7 66631.7 12647.7 -156 Construction (45) 4451.5 8593.2 47491.9 10970.6 16643.3 6937.5 16532.0 33462.3 5635.5 2238.3 28088.8 0.0 181044.9 22121.5 0.0 0.0 670492.0 0.0 0.0 4738.0 11427.4 07 Trade, hotels and restaurants (50-55) 32112.3 78564.8 225641.4 44719.5 52878.2 59482.6 160976.2 105347.6 57716.0 9472.7 52364.2 0.0 879275.6 807226.5 0.0 69.3 35312.2 4424.8 1030.8 1012628.0 67740.0 08 Transport and communications (60-64) 21074.1 31441.0 102345.3 21536.0 14006.5 44922.3 225806.3 43813.5 54026.4 6937.2 19552.7 0.0 585461.4 209017.6 0.0 5472.5 6418.6 2002.2 34.5 206463.5 39956.9 09 Finance, insurance and real estates (65-70) 5161.0 7359.4 24245.6 5984.6 4623.3 5844.2 25465.1 12001.6 24969.0 2579.6 9451.3 0.0 127684.8 60333.6 41154.3 635192.7 0.0 0.0 0.0 5653.6 12556.5 010 Business services (71-74) 1113.9 3276.7 37009.7 16914.4 1805.3 2343.9 21165.1 6096.4 50328.6 41658.9 5636.7 0.0 187349.6 9861.5 0.0 15548.7 35489.3 537.2 0.0 10398.8 14006.2 011 Personal services (80-93) 2014.9 5922.7 11351.6 7752.5 3447.5 3484.8 7609.2 8448.5 35099.5 3419.4 27796.1 0.0 116346.7 371412.4 37994.2 415276.7 6357.8 0.0 0.0 761.1 26966.1 012 Private households and extra-territorial org. (95-99) 0.0 0.0 0.0 0.0 0.0 0.0 0.0 0.0 0.0 0.0 0.0 0.0 0.0 0.0 0.0 0.0 0.0 0.0 0.0 0.0 0.0 0SBFD including Other Adjustments (Purchases onthe domestic territory by non-residents)
0.0 0.0 0.0 0.0 0.0 0.0 0.0 0.0 0.0 0.0 0.0 0.0 0.0 -107811.6 0.0 0.0 0.0 0.0 0.0 107811.6 0.0 0
Noncomparable imports (cif/fob adj, Directpurchases abroad by residents)
0.0 0.0 0.0 0.0 0.0 0.0 0.0 0.0 0.0 0.0 0.0 0.0 0.0 264490.3 0.0 0.0 0.0 0.0 0.0 0.0 0.0 0
Intermediate consumption /final use at basic prices 395353.1 844496.6 1425490.7 530542.0 211963.2 419448.6 691569.7 378748.7 420753.3 119334.0 387667.1 0.0 5825367.0 3141058.0 79148.5 1082782.0 1087395.0 159021.1 47595.8 2957065.0 1522930.0 0Net taxes on products 4415.0 20860.4 36421.0 11814.9 27912.7 14769.9 12014.9 18909.7 43168.5 7188.6 45210.3 0.0 242686.0 196787.4 0.0 3.2 98018.7 4140.7 2230.0 288519.3 0.0 0Intermediate consumption /final use at purchasersprices
399768.1 865357.0 1461911.8 542357.0 239876.0 434218.5 703584.6 397658.3 463921.8 126522.7 432877.4 0.0 6068053.0 3337846.0 79148.5 1082786.0 1185414.0 163161.8 49829.6 3245585.0 1522930.0 0
Value Added 464229.0 387780.2 1037871.8 327085.1 246889.5 432750.5 1968643.0 577255.0 393540.5 118656.6 488305.5 0.0 6443006.0 0.0 0.0 0.0 0.0 0.0 0.0 0.0 0.0 0Gross Operating Surplus (=net operating surplus +depreciation of fix capital)
362630.1 211725.0 650988.7 123376.9 136436.0 225787.4 1756002.0 270462.5 42797.2 18071.4 104151.9 0.0 3902429.0 0.0 0.0 0.0 0.0 0.0 0.0 0.0 0.0 0
Compensation of Employees 97681.6 143674.4 235503.2 181675.3 77335.2 177736.9 149182.7 257543.8 343782.2 92753.5 369524.7 0.0 2126393.0 0.0 0.0 0.0 0.0 0.0 0.0 0.0 0.0 0Net taxes on production 3917.3 32380.8 151379.8 22032.9 33118.3 29226.2 63457.7 49248.7 6961.2 7831.7 14628.9 0.0 414183.5 0.0 0.0 0.0 0.0 0.0 0.0 0.0 0.0 0Industry Output 863997.0 1253137.1 2499783.5 869442.0 486765.5 866969.0 2672227.0 974913.3 857462.3 245179.3 921182.9 0.0 12511059.0 0.0 0.0 0.0 0.0 0.0 0.0 0.0 0.0 0
Russia Intermediate Final consumption