data warehousing and data mining - … · data warehousing and data mining a case study on building...
TRANSCRIPT
DATA WAREHOUSING AND DATA MINING
A CASE STUDY ON BUILDING A DATA WAREHOUSE
Prepared for:
Dr. Mohammad A. Rob
Professor, Management Information Science
University of Houston Clear Lake
Prepared by:
Mohammed Abdullah Ghori
Abhinav Santi
Shaik Naseer Baba
Charanya Palanisamy
University of Houston Clear Lake
7 December, 2015
2
Samsung Inc.: A Case Study on Building a Data Warehouse
Contents
Abstract ......................................................................................................................................................... 3
Introduction .................................................................................................................................................. 3
1. Business Scenario ..................................................................................................................................... 4
2. Why Data Warehousing? .......................................................................................................................... 5
3. Methodology ............................................................................................................................................. 5
4. Dimensional Modeling .............................................................................................................................. 6
5. Defining Data format ................................................................................................................................ 8
6. Data Cleansing........................................................................................................................................... 8
7. Implementation in SQL Server Analysis .................................................................................................... 9
8. Browsing the Cube .................................................................................................................................. 11
9. Report Generation .................................................................................................................................. 12
I. Sales Report with respect to Age Group ........................................................................................ 12
II. Sales Report with respect to Gender ............................................................................................. 13
III. Half-Yearly Sales Report ................................................................................................................. 14
IV. Quarterly Sales report .................................................................................................................... 15
V. Region-wise Report ........................................................................................................................ 16
10. Conclusion ............................................................................................................................................. 16
11. References ............................................................................................................................................ 17
3
Samsung Inc.: A Case Study on Building a Data Warehouse
Samsung: A Case Study on Building a Data Warehouse
Abstract
This paper discusses concepts of data warehousing, its usage in our (Samsung) case study, the business
scenarios of our case, the impacts of data warehousing on Samsung’s strategic decisions, and the
approaches we used to create our cube analysis.
Introduction
Samsung is a South Korean multinational electronics company headquartered in Suwon, South Korea.
Samsung has long been a major manufacturer of electronic components such as lithium-ion batteries,
semiconductors, chips, flash memory and hard drive devices.
In recent years, the company has diversified into consumer electronics. It is the world's largest
manufacturer of mobile phones and smartphones fueled by the popularity of its Samsung Galaxy line of
devices. The company is also a major vendor of tablet computers, particularly its Android-powered
Samsung Galaxy Tab collection, and is generally regarded as pioneering the phablet market through the
Samsung Galaxy Note family of devices. Overall, the company sold 280 million mobile phones in 2010,
corresponding to a market share of 20.2 percent. Partially owing to strong sales of the Samsung Galaxy
range of smartphones, the company overtook Apple in worldwide smartphone sales during the third
quarter 2011, with a total market share of 23.8 percent, compared to Apple's 14.6 percent share.
Data warehousing is a central repository of information which stores current and historical data collected
from multiple sources. These data are to be collected continuously, transformed to the same format and
cleaned so it could be properly implanted.
4
Samsung Inc.: A Case Study on Building a Data Warehouse
1. Business Scenario
Samsung is the largest information technology company and measured by revenue and fourth in the
market value. It is the world’s largest manufacturer of smart phones and largest vendor of tablet
computers.
On top of its 1400 retail setups in the US the company has its presence across the globe.
In order to manage the overwhelming data from all over USA, Samsung has to set up Data Warehouse. It
is crucial that all the stores are interconnected with each other and are performing on a centralized
transactional system.
Let us explore some of the business needs of Samsung.
Provide strategic and tactical support to the sales and finance department of the company
Identify products of Sales and demand.
What region has the highest/lowest sales revenue?
Furthermore, which state is doing well compared to others?
Which city in those states has highest/lowest sales?
What kind of customers are we focusing on?
Males or Females?
What age group?
Data origins:
Samsung will collect the data from all over the stores in U.S. (For our class project, we created our own
database).
Expected value:
Sales of different products are compared based on country demography and region, customers’ age
group, gender, time intervals in year, month and quarter.
5
Samsung Inc.: A Case Study on Building a Data Warehouse
2. Why Data Warehousing?
Even though companies have been using computers to analyze their business processes, it is not
producing satisfactory results. These processes were focused mainly on day to day operation of a business
which was working adequately for small businesses.
Strategic information is helpful for analysis, discerning trends and monitoring performance. This is where
data warehousing plays a significant role. Data warehousing is an environment where Samsung can look
up historical data, observe current data and compare them to come up with the strategic solutions.
OLAP Cube Analysis
OLAP stands for Online Analytical Processing and Cube stands for multi-dimensional set of data. In general,
OLAP cube is a mechanism that enables user to query data in organized, dimensional structures (using
dimensions and measures) for analysis and hence support business decision-making. Based on the special
functionalities of the OLAP cube, we decided to use it as our main method in analyzing our data and
implement the experiment with Samsung.
3. Methodology
Step 1: Determine Business Objectives
Identify impacts of data warehousing on Samsung’s strategic business decisions.
Step 2: Collect and Analyze Information
To identify impacts of data warehousing on Samsung’s strategic business decisions what kind of
information do we need? What data are significant and reliable? How do we collect that information?
Step 3: Identify Core Business Processes
We need to identify the entities that interrelate to create the key performance indicators.
Step 4: Construct a Conceptual Data Model
Here, we determine the fact tables, identify the dimensions that will be used which is related to
the facts.
Step 5: Locate Data Sources and Plan Data Transformations
After we have the Data Model, it is time we identify the critical information and how to move it
into the data warehouse structure.
6
Samsung Inc.: A Case Study on Building a Data Warehouse
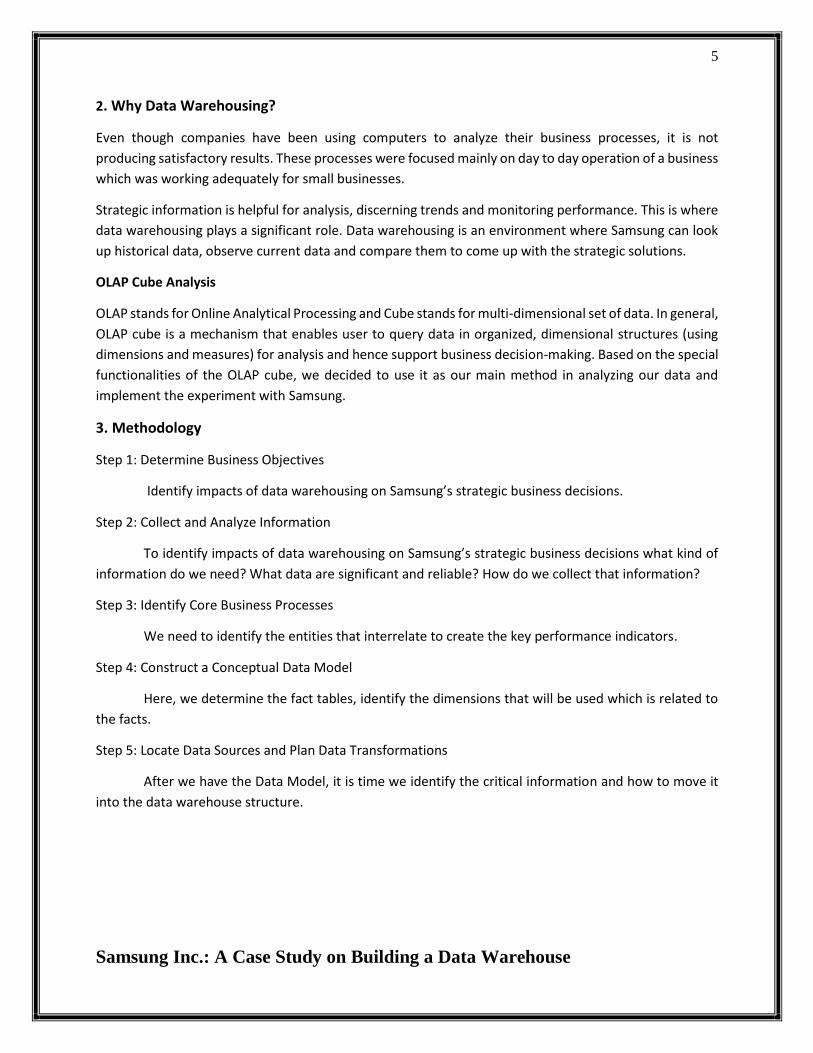
Step 6: Implement the Process
As all the steps are completed, we implement the process.
Fig 3.1 Summary of Data Warehousing
4. Dimensional Modeling
Dimensional Modeling is a set of techniques and concepts which are used in data ware design. It is based
on dimensions, facts, cubes and schemas such as star or snowflake. There are Fact Table and Dimension
Table in this model.
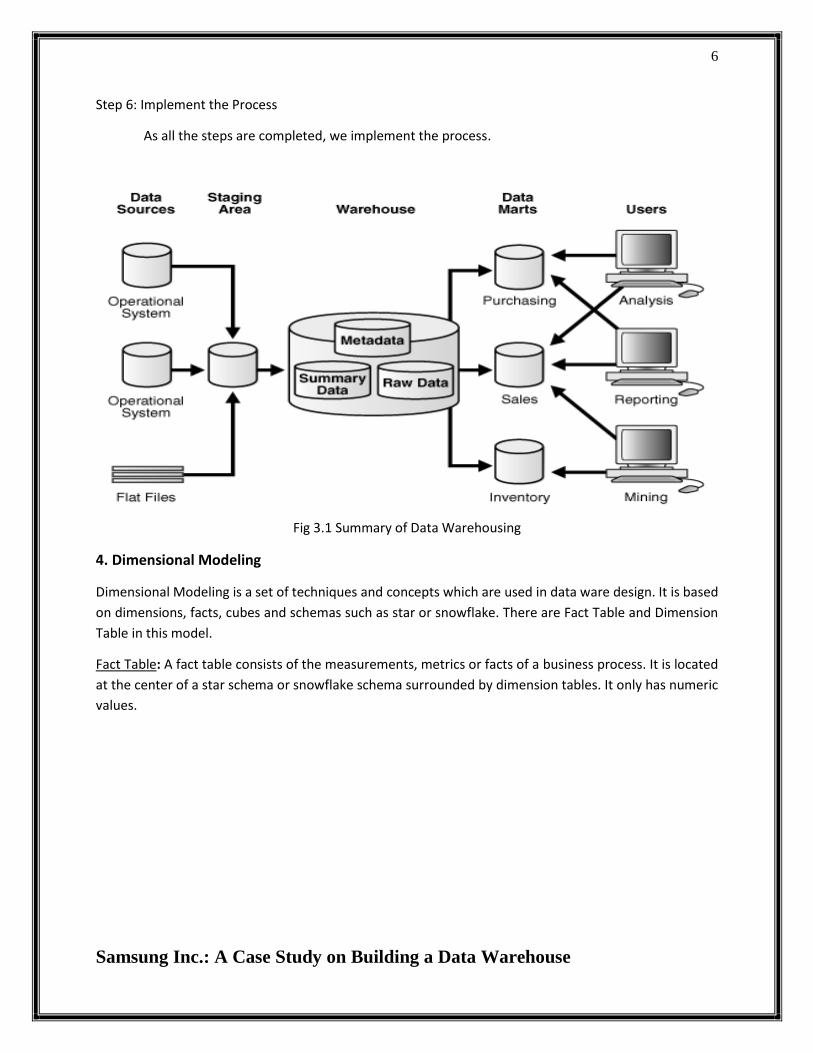
Fact Table: A fact table consists of the measurements, metrics or facts of a business process. It is located
at the center of a star schema or snowflake schema surrounded by dimension tables. It only has numeric
values.
7
Samsung Inc.: A Case Study on Building a Data Warehouse
Figure 4.1. Fact Table
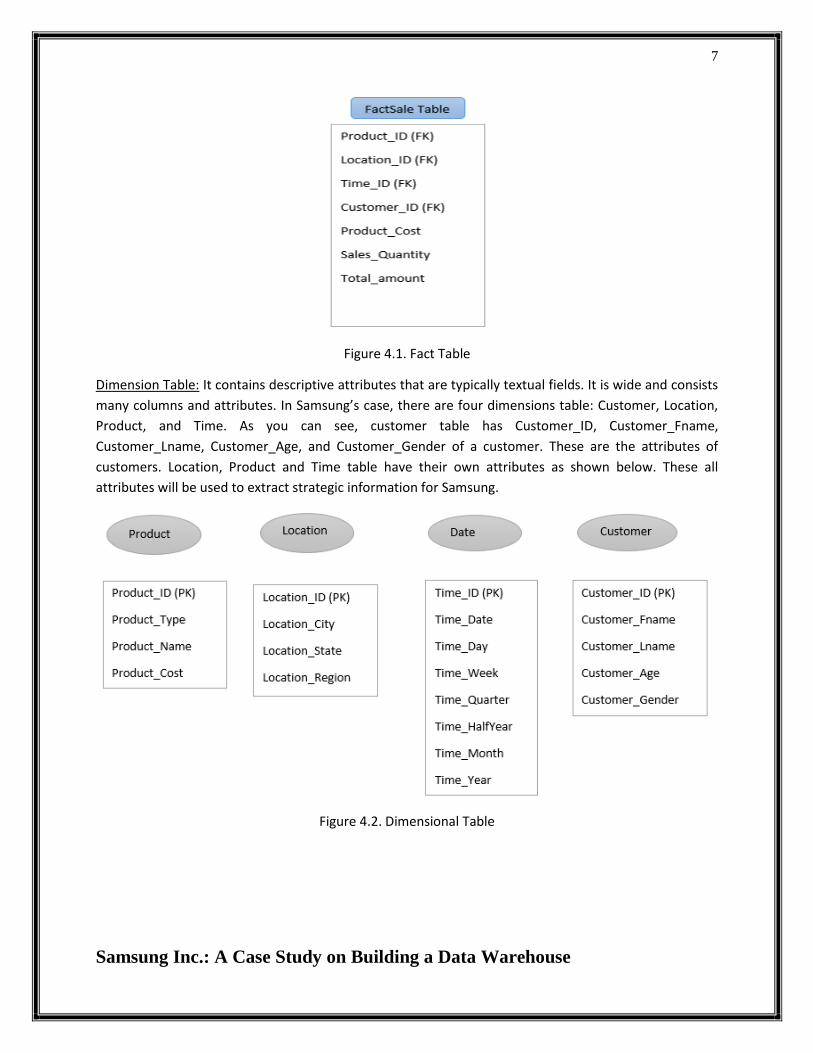
Dimension Table: It contains descriptive attributes that are typically textual fields. It is wide and consists
many columns and attributes. In Samsung’s case, there are four dimensions table: Customer, Location,
Product, and Time. As you can see, customer table has Customer_ID, Customer_Fname,
Customer_Lname, Customer_Age, and Customer_Gender of a customer. These are the attributes of
customers. Location, Product and Time table have their own attributes as shown below. These all
attributes will be used to extract strategic information for Samsung.
Figure 4.2. Dimensional Table
8
Samsung Inc.: A Case Study on Building a Data Warehouse
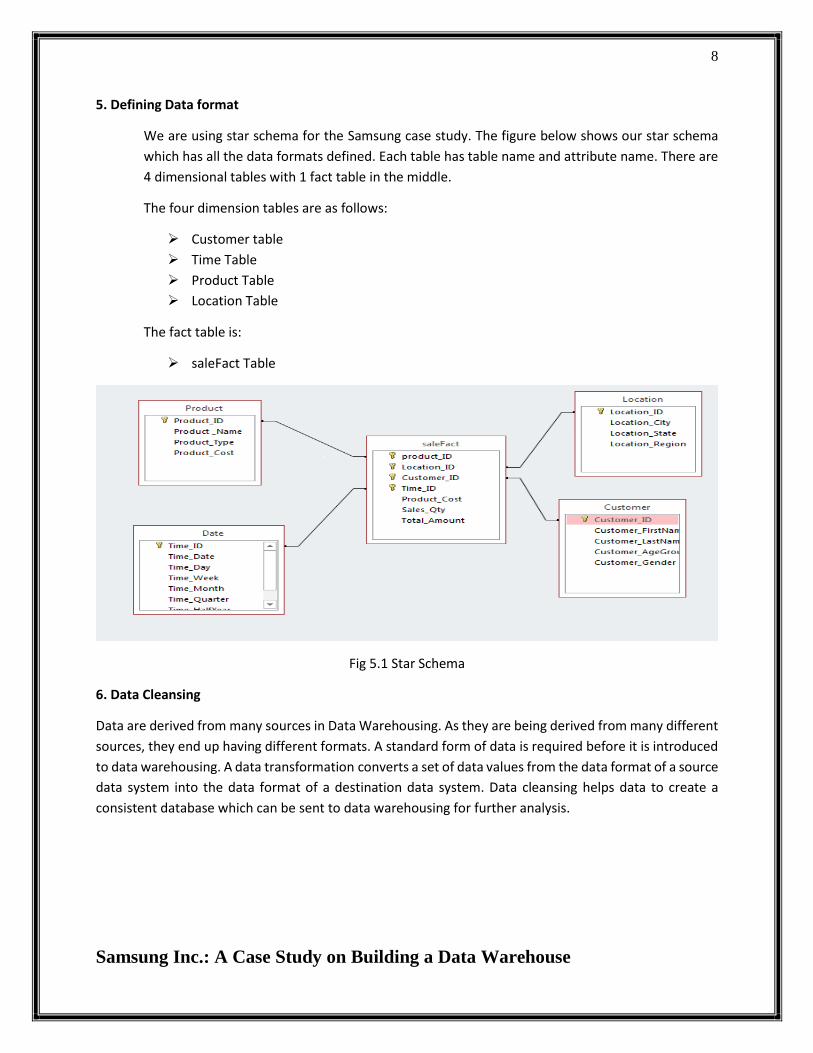
5. Defining Data format
We are using star schema for the Samsung case study. The figure below shows our star schema
which has all the data formats defined. Each table has table name and attribute name. There are
4 dimensional tables with 1 fact table in the middle.
The four dimension tables are as follows:
Customer table
Time Table
Product Table
Location Table
The fact table is:
saleFact Table
Fig 5.1 Star Schema
6. Data Cleansing
Data are derived from many sources in Data Warehousing. As they are being derived from many different
sources, they end up having different formats. A standard form of data is required before it is introduced
to data warehousing. A data transformation converts a set of data values from the data format of a source
data system into the data format of a destination data system. Data cleansing helps data to create a
consistent database which can be sent to data warehousing for further analysis.
9
Samsung Inc.: A Case Study on Building a Data Warehouse
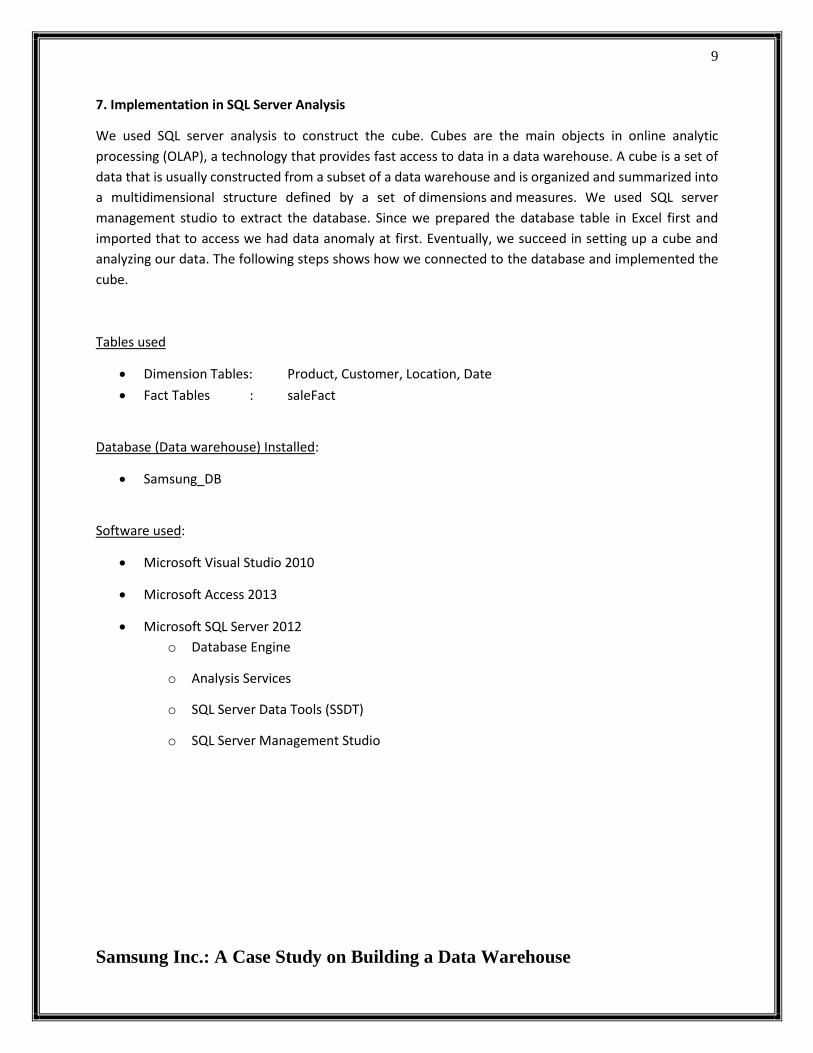
7. Implementation in SQL Server Analysis
We used SQL server analysis to construct the cube. Cubes are the main objects in online analytic
processing (OLAP), a technology that provides fast access to data in a data warehouse. A cube is a set of
data that is usually constructed from a subset of a data warehouse and is organized and summarized into
a multidimensional structure defined by a set of dimensions and measures. We used SQL server
management studio to extract the database. Since we prepared the database table in Excel first and
imported that to access we had data anomaly at first. Eventually, we succeed in setting up a cube and
analyzing our data. The following steps shows how we connected to the database and implemented the
cube.
Tables used
Dimension Tables: Product, Customer, Location, Date
Fact Tables : saleFact
Database (Data warehouse) Installed:
Samsung_DB
Software used:
Microsoft Visual Studio 2010
Microsoft Access 2013
Microsoft SQL Server 2012
o Database Engine
o Analysis Services
o SQL Server Data Tools (SSDT)
o SQL Server Management Studio
10
Samsung Inc.: A Case Study on Building a Data Warehouse
Fig.6.1 Connecting to database server
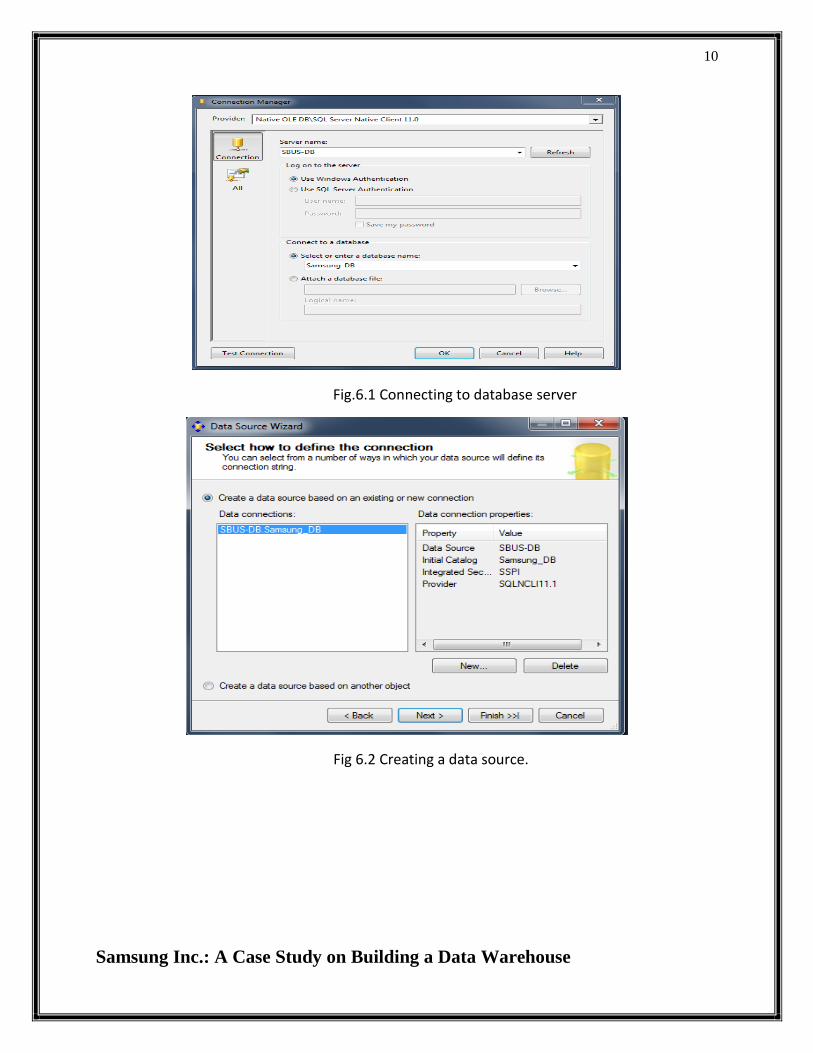
Fig 6.2 Creating a data source.
11
Samsung Inc.: A Case Study on Building a Data Warehouse
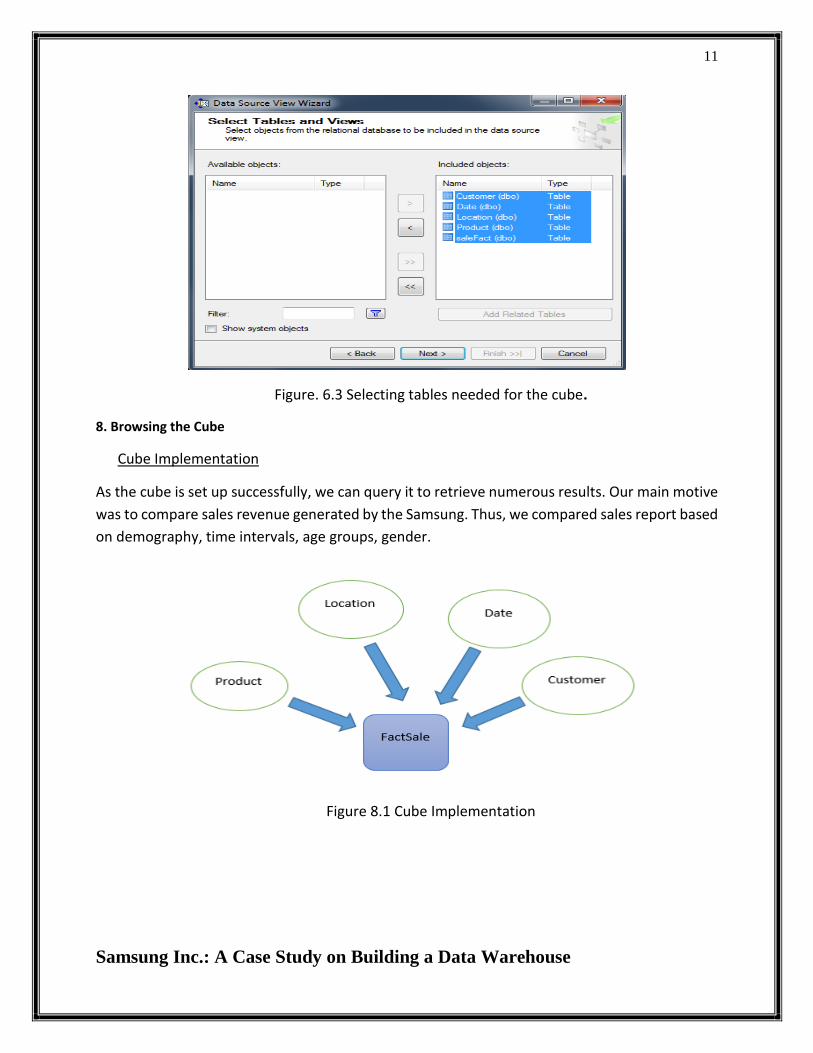
Figure. 6.3 Selecting tables needed for the cube.
8. Browsing the Cube
Cube Implementation
As the cube is set up successfully, we can query it to retrieve numerous results. Our main motive
was to compare sales revenue generated by the Samsung. Thus, we compared sales report based
on demography, time intervals, age groups, gender.
Figure 8.1 Cube Implementation
12
Samsung Inc.: A Case Study on Building a Data Warehouse
9. Report Generation
After creating the cube the main aim is to get the data in a readable format i.e., reports. These reports
are easily readable and understood by higher management for decision making purpose. The reports we
have generated are:
Monthly, Quarterly and Yearly sales reports of product.
Sales report of product type with respect to gender.
Sales report of product type with respect to age group.
Sales Report of a product with respect to State & Region.
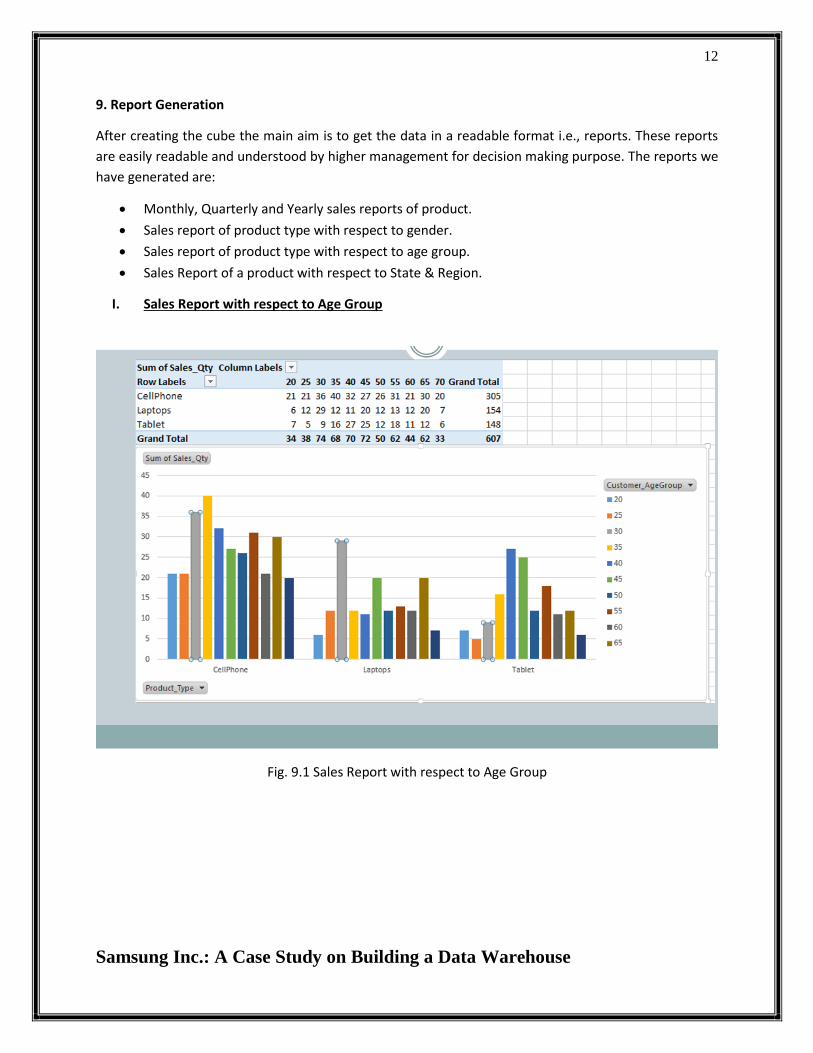
I. Sales Report with respect to Age Group
Fig. 9.1 Sales Report with respect to Age Group
13
Samsung Inc.: A Case Study on Building a Data Warehouse
The above screenshot shows the sales of the products (cellphones, Laptops and tablets) for a year for
different age groups. Here we have grouped 11-15 age customers as 15, 16-20 as 20 so on. In the report
we can see that age group 35 i.e. customers in age 30 -35 have brought more number of cell phones than
the other age groups. Sales of computers for the age group 30 i.e. 25-30 is more than the others. Sales of
Tablets for the age group 40 is more.
II. Sales Report with respect to Gender
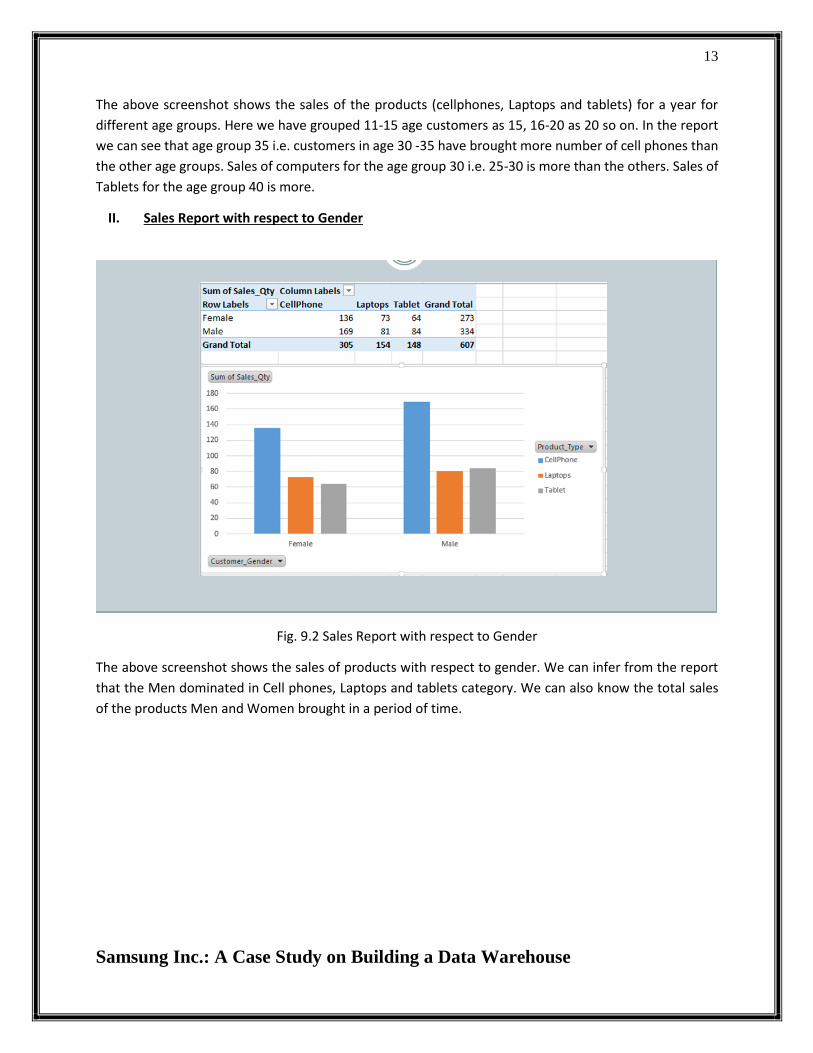
Fig. 9.2 Sales Report with respect to Gender
The above screenshot shows the sales of products with respect to gender. We can infer from the report
that the Men dominated in Cell phones, Laptops and tablets category. We can also know the total sales
of the products Men and Women brought in a period of time.
14
Samsung Inc.: A Case Study on Building a Data Warehouse
III. Half-Yearly Sales Report
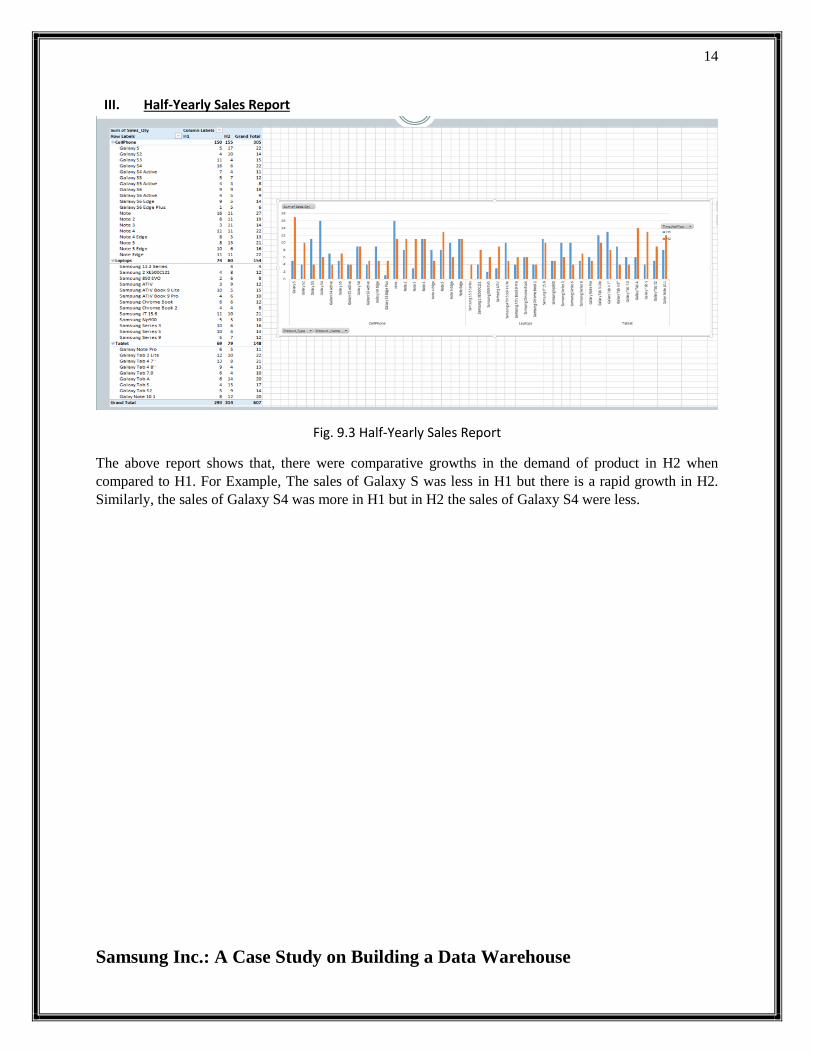
Fig. 9.3 Half-Yearly Sales Report
The above report shows that, there were comparative growths in the demand of product in H2 when
compared to H1. For Example, The sales of Galaxy S was less in H1 but there is a rapid growth in H2.
Similarly, the sales of Galaxy S4 was more in H1 but in H2 the sales of Galaxy S4 were less.
15
Samsung Inc.: A Case Study on Building a Data Warehouse
IV. Quarterly Sales report
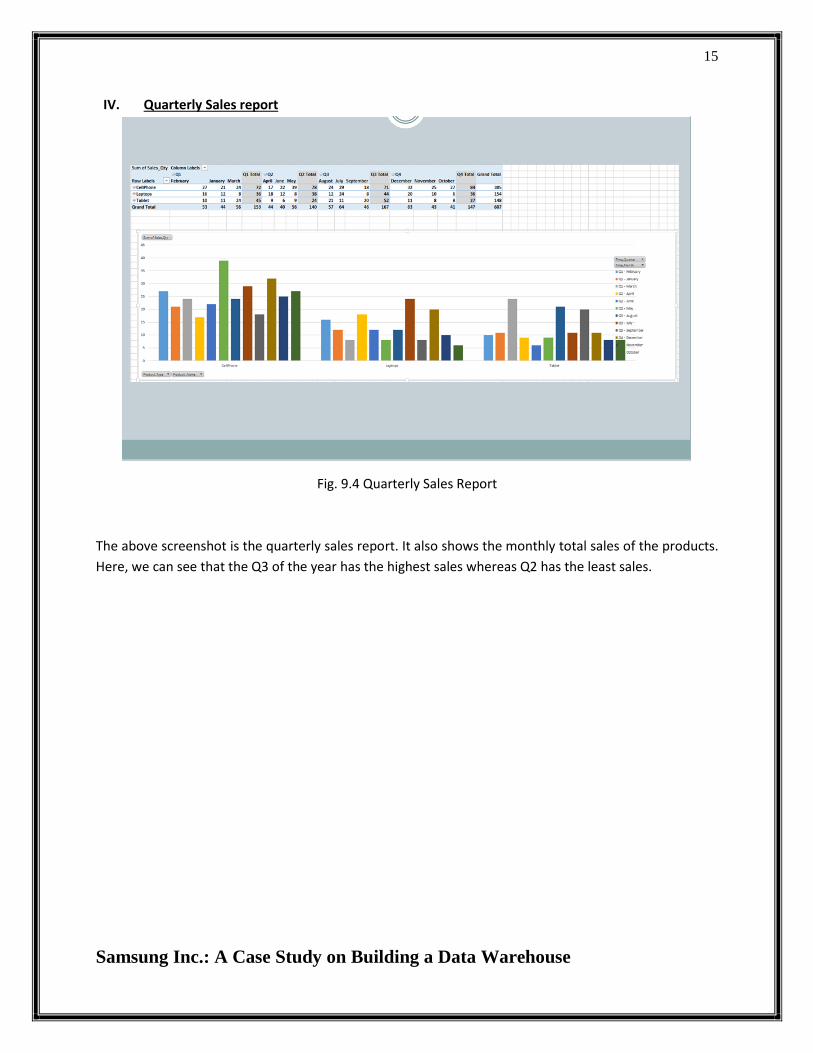
Fig. 9.4 Quarterly Sales Report
The above screenshot is the quarterly sales report. It also shows the monthly total sales of the products.
Here, we can see that the Q3 of the year has the highest sales whereas Q2 has the least sales.
16
Samsung Inc.: A Case Study on Building a Data Warehouse
V. Region-wise Report
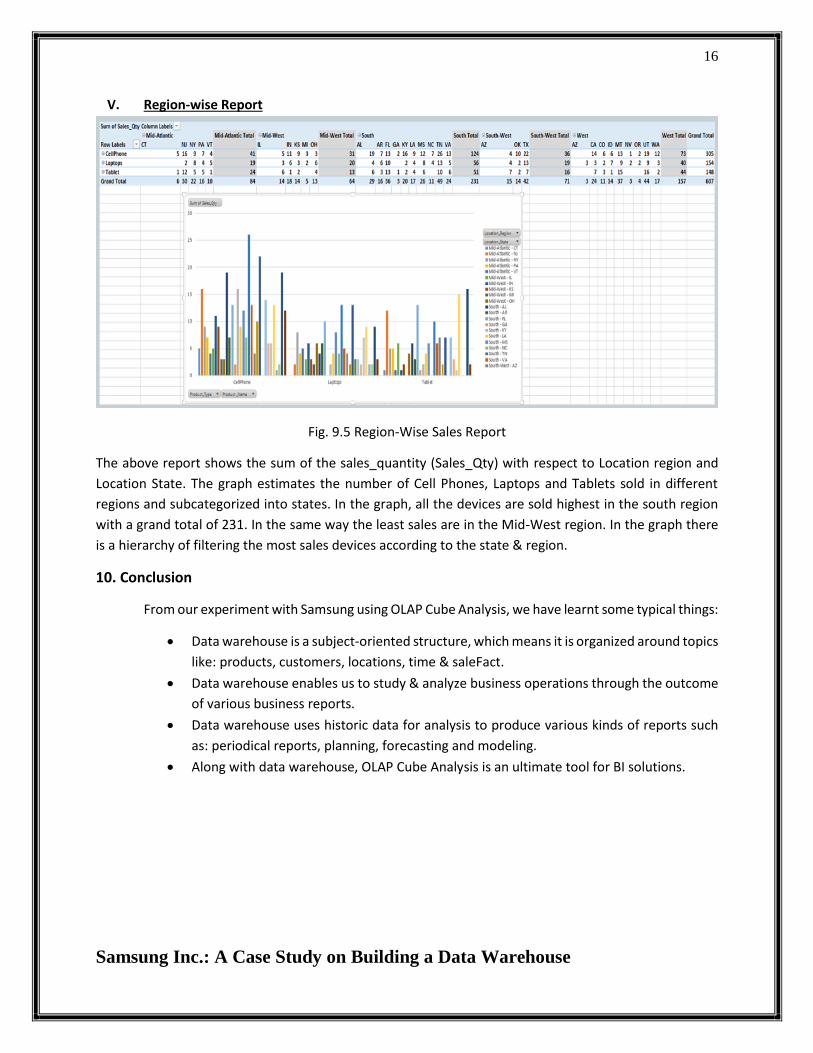
Fig. 9.5 Region-Wise Sales Report
The above report shows the sum of the sales_quantity (Sales_Qty) with respect to Location region and
Location State. The graph estimates the number of Cell Phones, Laptops and Tablets sold in different
regions and subcategorized into states. In the graph, all the devices are sold highest in the south region
with a grand total of 231. In the same way the least sales are in the Mid-West region. In the graph there
is a hierarchy of filtering the most sales devices according to the state & region.
10. Conclusion
From our experiment with Samsung using OLAP Cube Analysis, we have learnt some typical things:
Data warehouse is a subject-oriented structure, which means it is organized around topics
like: products, customers, locations, time & saleFact.
Data warehouse enables us to study & analyze business operations through the outcome
of various business reports.
Data warehouse uses historic data for analysis to produce various kinds of reports such
as: periodical reports, planning, forecasting and modeling.
Along with data warehouse, OLAP Cube Analysis is an ultimate tool for BI solutions.
17
Samsung Inc.: A Case Study on Building a Data Warehouse
11. References
Ponniah, Paulraj. (2001) Data WarehousingFundamentals: A Comprehensive Guide for
IT Professionals. New York, New York: John Wiley & Sons Wikipedia.org