data mining dr. mohsen kahani email: [email protected]@um.ac.ir kahani
Post on 21-Dec-2015
236 views
TRANSCRIPT


Overview
IntroductionData Mining Functions and ModelsData Mining MethodologiesData Mining Case StudiesFinal Remarks

Motivation: “Necessity is the Mother of Invention”
Data explosion problem: Automated data collection tools and
mature database technology lead to tremendous amounts of data stored in databases, data warehouses and other information repositories
We are drowning in data, but starving for knowledge!

Data pyramid
Data
Information
Knowledge
Wisdom
Data + context
Information + rules
Knowledge + experience

Related Fields
Statistics
MachineLearning
Databases
Visualization
Data Mining and Knowledge Discovery

______
______
______
Transformed Data
Patternsand
Rules
Target Data
RawData
KnowledgeData MiningTransformation
Interpretation& Evaluation
Selection& Cleaning
Integration
Un
de
rsta
nd
ing
Knowledge Discovery Process
DATAWarehouse
Knowledge

Data Mining and Business Intelligence
Increasing potentialto supportbusiness decisions End User
Business Analyst
DataAnalyst
DBA
MakingDecisions
Data Presentation
Visualization Techniques
Data MiningInformation Discovery
Data Exploration
OLAP, MDA
Statistical Analysis, Querying and Reporting
Data Warehouses / Data Marts
Data SourcesPaper, Files, Information Providers, Database Systems, OLTP

Definition of Data Mining
“…The non-trivial process of identifying valid, novel, potentially useful, and ultimately understandable patterns in data…”
Fayyad, Piatetsky-Shapiro, Smyth [1996]

The Evolution of Data AnalysisEvolutionary Step
Business Question
Enabling Technologies
Product Providers
Characteristics
Data Collection (1960s)
"What was my total revenue in the last five years?"
Computers, tapes, disks
IBM, CDC
Retrospective, static data delivery
Data Access (1980s)
"What were unit sales in New England last March?"
Relational databases (RDBMS), Structured Query Language (SQL), ODBC
Oracle, Sybase, Informix, IBM, Microsoft
Retrospective, dynamic data delivery at record level
Data Warehousing & Decision Support (1990s)
"What were unit sales in New England last March? Drill down to Boston."
On-line analytic processing (OLAP), multidimensional databases, data warehouses
SPSS, Comshare, Arbor, Cognos, Microstrategy,NCR
Retrospective, dynamic data delivery at multiple levels
Data Mining (Emerging Today)
"What’s likely to happen to Boston unit sales next month? Why?"
Advanced algorithms, multiprocessor computers, massive databases
SPSS/Clementine, Lockheed, IBM, SGI, SAS, NCR, Oracle, numerous startups
Prospective, proactive information delivery

Need for Data Mining
Data accumulate and double every 9 months There is a big gap from stored data to
knowledge; and the transition won’t occur automatically.
Manual data analysis is not new but a bottleneck Fast developing Computer Science and
Engineering generates new demands Seeking knowledge from massive data
Any personal experience?

When is DM useful
Data rich worldLarge data (dimensionality and size)
Image data (size) Gene chip data (dimensionality)
Little knowledge about data (exploratory data analysis) What if we have some knowledge?

Challenges
Increasing data dimensionality and data size
Various data forms New data types
Streaming data, multimedia data
Efficient search and access to data/knowledge
Intelligent update and integration

Data Mining Survey Industry Pioneers 23% Manufacturing 19% Financial Serv. 17% Tele/Data communication 13% Media 12% Retail/Wholesaler
Objectives 21.4% Understanding Customer Segments and
Preferences, 19,5% Identifying Profitable Customers and Acquiring
New ones, 14,1% Increasing Revenue From Customers. World Data Mining Survey, 6 August, 2002.

Results of Data Mining Include:Forecasting what may happen in the
futureClassifying people or things into
groups by recognizing patternsClustering people or things into
groups based on their attributesAssociating what events are likely to
occur togetherSequencing what events are likely to
lead to later events

Data Mining versus OLAP
OLAP - On-line Analytical Processing
Provides you with a very good view of what is happening, but can not predict what will happen in the future or why it is happening

Data Mining Versus Statistical Analysis
Data Analysis Tests for statistical
correctness of models Are statistical assumptions
of models correct?• Eg Is the R-Square good?
Hypothesis testing Is the relationship
significant?• Use a t-test to validate
significance Tends to rely on sampling Techniques are not
optimised for large amounts of data
Requires strong statistical skills
Data Mining Originally developed to
act as expert systems to solve problems
Less interested in the mechanics of the technique
If it makes sense then let’s use it
Does not require assumptions to be made about data
Can find patterns in very large amounts of data
Requires understanding of data and business problem

Data Mining Taxonomy
Predictive Method - …predict the value of a particular
attribute…
Descriptive Method- …foundation of human-interpretable
patterns that describe the data…

Data Mining Tasks...
Classification [Predictive]
Clustering [Descriptive]
Association Rule Discovery [Descriptive]
Sequential Pattern Discovery [Descriptive]
Deviation Detection [Predictive]
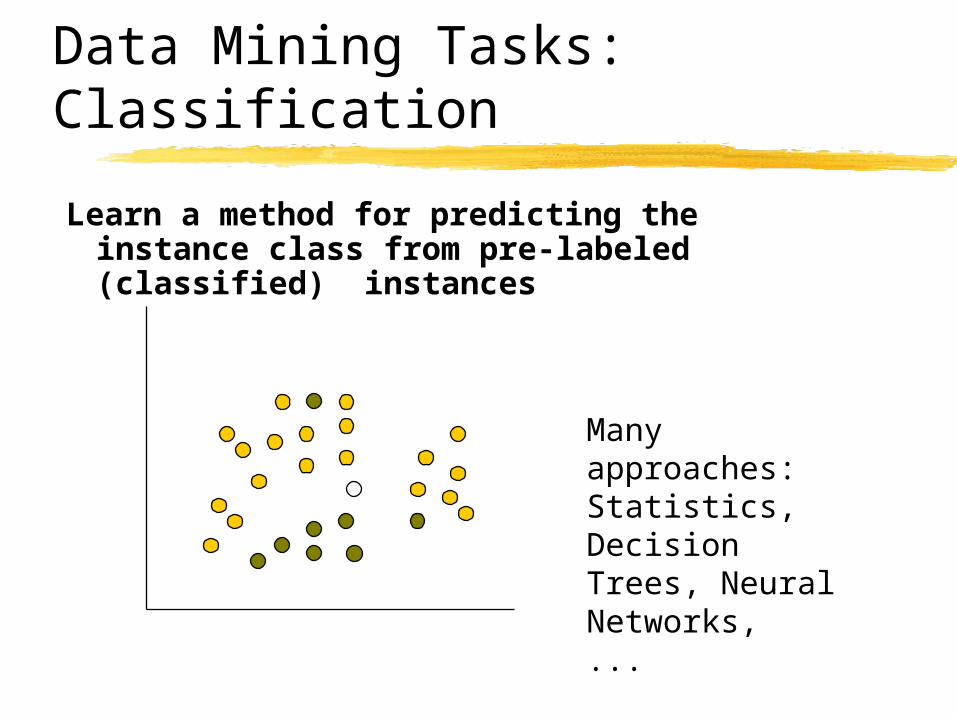
Data Mining Tasks: Classification
Learn a method for predicting the instance class from pre-labeled (classified) instances
Many approaches: Statistics, Decision Trees, Neural Networks, ...

Classification: Linear Regression
Linear Regressionw0 + w1 x + w2 y >= 0
Regression computes wi from data to minimize squared error to ‘fit’ the data
Not flexible enough

Classification: Decision Trees
X
Y
if X > 5 then blueelse if Y > 3 then blueelse if X > 2 then greenelse blue
52
3

Decision Trees
-a way of representing a series of rules that lead to a class or value;
-basic components of a decision tree: decision node, branches and leaves;
Income>40,000
Job>5 High Debt
Low Risk High Risk High Risk Low Risk
No Yes
Yes No Yes No

Decision Trees (cont.)
- handle very well non-numeric data;- work best when the predictor
variables are categorical;

Example Decision Tree
Tid Refund MaritalStatus
TaxableIncome Cheat
1 Yes Single 125K No
2 No Married 100K No
3 No Single 70K No
4 Yes Married 120K No
5 No Divorced 95K Yes
6 No Married 60K No
7 Yes Divorced 220K No
8 No Single 85K Yes
9 No Married 75K No
10 No Single 90K Yes10
categoric
al
categoric
al
continuous
class
Refund
MarSt
TaxInc
YESNO
NO
NO
Yes No
Married Single, Divorced
< 80K > 80K
Splitting Attributes
The splitting attribute at a node is
determined based on the Gini index.

Classification: Neural Networks
- efficiently model large and complex problems;
- may be used in classification problems or for regressions;
- Starts with input layer => hidden layer => output layer
1
2
3
4
5
6
Inputs Output
Hidden Layer

Neural Networks (cont.)
- can be easily implemented to run on massively parallel computers;
- can not be easily interpret;- require an extensive amount of
training time;- require a lot of data preparation
(involve very careful data cleansing, selection, preparation, and pre-processing);
- require sufficiently large data set and high signal-to noise ratio.

Kohonen NetworkDescriptionunsupervisedseeks to
describe dataset in terms of natural clusters of cases

Classification Example
Tid Refund MaritalStatus
TaxableIncome Cheat
1 Yes Single 125K No
2 No Married 100K No
3 No Single 70K No
4 Yes Married 120K No
5 No Divorced 95K Yes
6 No Married 60K No
7 Yes Divorced 220K No
8 No Single 85K Yes
9 No Married 75K No
10 No Single 90K Yes10
categoric
al
categoric
al
continuous
class
Refund MaritalStatus
TaxableIncome Cheat
No Single 75K ?
Yes Married 50K ?
No Married 150K ?
Yes Divorced 90K ?
No Single 40K ?
No Married 80K ?10
TestSet
Training Set
ModelLearn
Classifier

Classification Application
Direct Marketing
Fraud Detection
Customer Attrition/Churn
Sky Survey Cataloging

Data Mining Tasks: Clustering
Goal is to identify categories
Natural grouping of customers by processing all the available data about them.
Other applications market segmentation,
discovering affinity groups, and defect analysis

Data Mining Tasks: Association Rule Discovery
Given a set of records each of which contain some number of items from a given collection; Produce dependency rules which will predict
occurrence of an item based on occurrences of other items.TID Items
1 Bread, Coke, Milk
2 Beer, Bread
3 Beer, Coke, Diaper, Milk
4 Beer, Bread, Diaper, Milk
5 Coke, Diaper, Milk
Rules Discovered: {Milk} --> {Coke} {Diaper, Milk} --> {Beer}
Rules Discovered: {Milk} --> {Coke} {Diaper, Milk} --> {Beer}

Association Rule Discovery Application
Marketing and Sales Promotion
Supermarket Shelf Management
Inventory Management

Deviation Detection & Pattern Discovery
Deviation Detection:…discovering most significant changes in
data from previously measured or normative values…
V. Kumar, M. Joshi, Tutorial on High Performance Data Mining.
Sequential Pattern Discovery:…process of looking for patterns and rules
that predict strong sequential dependencies among different events…
V. Kumar, M. Joshi, Tutorial on High Performance Data Mining.

Sequential Patterns
Identify frequently occurring sequences from given records
40 percent of female customers buy a gray skirt six months after buying a red jacket

Data Mining Methodology: SAS
Sample Extract a portion of the dataset for data mining
Explore Modify
create, select and transform variables with the intention of building a model
Model Specify a relationship of variables that reliably
predicts a desired goal
Assess Evaluate the practical value of the findings and the
model resulting from the data mining effort

Data Mining Methodology: CRISP-DM
Data understandingData preparationModelingEvaluationDeployment
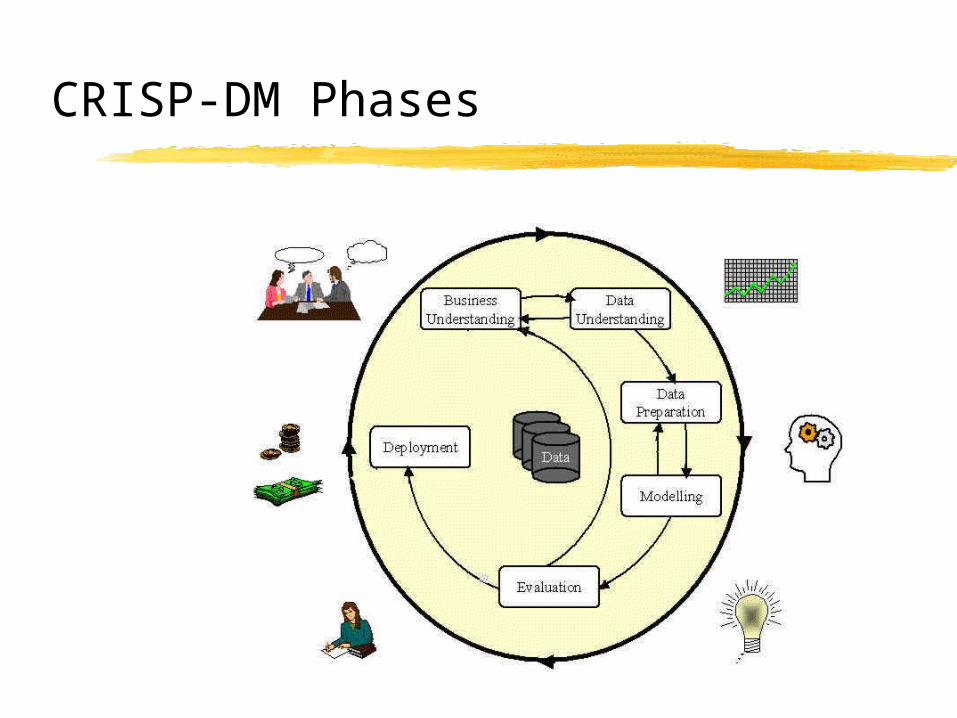
CRISP-DM Phases

BusinessUnderstanding
DataUnderstanding
EvaluationDataPreparation
Modeling
Determine Business ObjectivesBackgroundBusiness ObjectivesBusiness Success Criteria
Situation AssessmentInventory of ResourcesRequirements, Assumptions, and ConstraintsRisks and ContingenciesTerminologyCosts and Benefits
Determine Data Mining GoalData Mining GoalsData Mining Success Criteria
Produce Project PlanProject PlanInitial Asessment of Tools and Techniques
Collect Initial DataInitial Data Collection Report
Describe DataData Description Report
Explore DataData Exploration Report
Verify Data Quality Data Quality Report
Data SetData Set Description
Select Data Rationale for Inclusion / Exclusion
Clean Data Data Cleaning Report
Construct DataDerived AttributesGenerated Records
Integrate DataMerged Data
Format DataReformatted Data
Select Modeling TechniqueModeling TechniqueModeling Assumptions
Generate Test DesignTest Design
Build ModelParameter SettingsModelsModel Description
Assess ModelModel AssessmentRevised Parameter Settings
Evaluate ResultsAssessment of Data Mining Results w.r.t. Business Success CriteriaApproved Models
Review ProcessReview of Process
Determine Next StepsList of Possible ActionsDecision
Plan DeploymentDeployment Plan
Plan Monitoring and MaintenanceMonitoring and Maintenance Plan
Produce Final ReportFinal ReportFinal Presentation
Review ProjectExperience Documentation
Deployment
Phases and Tasks

Major Application Areas for Data Mining SolutionsFraud/Non-Compliance Anomaly detection
Isolate the factors that lead to fraud, waste and abuse
Target auditing and investigative efforts more effectively
Credit/Risk ScoringIntrusion detection Parts failure prediction
Recruiting/Attracting customers Maximizing profitability (cross selling, identifying profitable customers) Service Delivery and Customer Retention
Build profiles of customers likely to use which services
Web MiningHealth Care

Case Study: Search Engines
Early search engines used mainly keywords on a page – were subject to manipulation
Google success is due to its algorithm which uses mainly links to the page
Google founders Sergey Brin and Larry Page were students in Stanford doing research in databases and data mining in 1998 which led to Google

Case Study:Direct Marketing and CRM
Most major direct marketing companies are using modeling and data mining
Most financial companies are using customer modeling
Modeling is easier than changing customer behaviour
Some successes Verizon Wireless reduced churn rate from 2%
to 1.5%

Biology: Molecular Diagnostics Leukemia: Acute Lymphoblastic (ALL) vs Acute Myeloid (AML) 72 samples, about 7,000 genes
ALL AML
Results: 33 correct (97% accuracy),1 error (sample suspected
mislabelled)
Outcome predictions?

Case Study:Security and Fraud DetectionCredit Card Fraud DetectionMoney laundering
FAIS (US Treasury)Securities Fraud
NASDAQ Sonar systemPhone fraud
AT&T, Bell Atlantic, British Telecom/MCI
Bio-terrorism detection at Salt Lake Olympics 2002

3D example by MineSet

Data Mining and Privacy
Data Mining looks for patterns, not people!Technical solutions can limit privacy invasion Replacing sensitive personal data with anon. ID Give randomized outputs Multi-party computation – distributed data …

19901998 2000 2002
Expectations
Performance
The Hype Curve for Data Mining and Knowledge Discovery
Over-inflated expectations
Disappointment
Growing acceptance
and mainstreaming
rising expectations
Final Remarks
Data Mining can be utilized for any field that needs to find patterns or relationships in their data.

Questions?

Special Data Types
Spatial DataStreamed DataMultimedia data

Spatial Mining
Spatial Data and StructuresImagesSpatial Mining Algorithms

Definitions
Spatial data is about instances located in a physical space
Spatial data has location or geo-referenced features
Some of these features are: Address, latitude/longitude (explicit) Location-based partitions in databases
(implicit)
Applications and Problems
Geographic information systems (GIS) store information related to geographic locations on Earth Weather, community infrastructure needs,
disaster management, and hazardous waste
Homeland security issues such as prediction of unexpected events and planning of evacuation
Remote sensing and image classificationBiomedical applications include medical
imaging and illness diagnosis

Use of Spatial Data Map overlay – merging disparate data
Different views of the same area: (Level 1) streets, power lines, phone lines, sewer lines, (Level 2) actual elevations, building locations, and rivers
Spatial selection – find all houses near WSUSpatial join – nearest for points, intersection for
areasOther basic spatial operations
Region/range query for objects intersecting a region Nearest neighbor query for objects closest to a given
place Distance scan asking for objects within a certain radius

Spatial Data Structures
Minimum bounding rectangles (MBR)
Different tree structures Quad tree R-Tree kd-Tree
Image databases

MBR
Representing a spatial object by the smallest rectangle [(x1,y1), (x2,y2)] or rectangles
(x1,y1)
(x2,y2)

R-Tree
Indexing MBRs in a tree An R-tree of order m has at most m entries in one node An example (order of 3)
R8
R1
R2R3
R6
R5R4
R7
R8
R7R6
R3R2R1 R5R4

Common Tasks dealing with Spatial Data
Data focusing Spatial queries Identifying interesting parts in spatial data Progress refinement can be applied in a tree
structureFeature extraction
Extracting important/relevant features for an application
Classification or others Using training data to create classifiers Many mining algorithms can be used
Classification, clustering, associations

Spatial Mining Tasks
Spatial classificationSpatial clusteringSpatial association rules

Spatial Classification
Use spatial information at different (coarse/fine) levels (different indexing trees) for data focusing
Determine relevant spatial or non-spatial features
Perform normal supervised learning algorithms e.g., Decision trees,

Spatial Clustering
Use tree structures to index spatial data
DBSCAN: R-treeCLIQUE: Grid or Quad treeClustering with spatial constraints
(obstacles need to adjust notion of distance)

Spatial Association Rules
Spatial objects are of major interest, not transactions
A B A, B can be either spatial or non-spatial
(3 combinations) What is the fourth combination?
Association rules can be found w.r.t. the 3 types

Summary
Spatial data can contain both spatial and non-spatial features.
When spatial information becomes dominant interest, spatial data mining should be applied.
Spatial data structures can facilitate spatial mining.
Standard data mining algorithms can be modified for spatial data mining, with a substantial part of preprocessing to take into account of spatial information.

Characteristics of Data Streams
Data Streams Data streams—continuous, ordered, changing, fast, huge
amount
Traditional DBMS—data stored in finite, persistent data setsdata sets
Characteristics Huge volumes of continuous data, possibly infinite Fast changing and requires fast, real-time response Data stream captures nicely our data processing needs of today Random access is expensive—single linear scan algorithm (can
only have one look) Store only the summary of the data seen thus far Most stream data are at pretty low-level or multi-dimensional in
nature, needs multi-level and multi-dimensional processing

Stream Data Applications
Telecommunication calling recordsBusiness: credit card transaction flowsNetwork monitoring and traffic engineeringFinancial market: stock exchangeEngineering & industrial processes: power supply
& manufacturingSensor, monitoring & surveillance: video streamsSecurity monitoringWeb logs and Web page click streamsMassive data sets (even saved but random access
is too expensive)

Architecture: Stream Query Processing
Scratch SpaceScratch Space(Main memory and/or Disk)(Main memory and/or Disk)
User/ApplicationUser/ApplicationUser/ApplicationUser/Application
Continuous QueryContinuous Query
Stream QueryStream QueryProcessorProcessor
ResultsResults
Multiple streamsMultiple streams
SDMS (Stream Data Management System)

Challenges of Stream Data Processing
Multiple, continuous, rapid, time-varying, ordered streamsMain memory computationsQueries are often continuous
Evaluated continuously as stream data arrives Answer updated over time
Queries are often complex Beyond element-at-a-time processing Beyond stream-at-a-time processing Beyond relational queries (scientific, data mining, OLAP)
Multi-level/multi-dimensional processing and data mining Most stream data are at pretty low-level or multi-dimensional in
nature

Processing Stream Queries
Query types One-time query vs. continuous query (being evaluated
continuously as stream continues to arrive) Predefined query vs. ad-hoc query (issued on-line)
Unbounded memory requirements For real-time response, main memory algorithm should be used Memory requirement is unbounded if one will join future tuples
Approximate query answering With bounded memory, it is not always possible to produce exact
answers High-quality approximate answers are desired Data reduction and synopsis construction methods
Sketches, random sampling, histograms, wavelets, etc.

Stream Data Mining vs. Stream Querying
Stream mining—A more challenging task It shares most of the difficulties with stream querying Patterns are hidden and more general than querying It may require exploratory analysis
Not necessarily continuous queries
Stream data mining tasks Multi-dimensional on-line analysis of streams Mining outliers and unusual patterns in stream data Clustering data streams Classification of stream data

Stream Data Mining Tasks
Multi-dimensional (on-line) analysis of streamsClustering data streams Classification of data streamsMining frequent patterns in data streams Mining sequential patterns in data streamsMining partial periodicity in data streamsMining notable gradients in data streamsMining outliers and unusual patterns in data streams……, more?

Challenges for Mining Dynamics in Data Streams
Most stream data are at pretty low-level or multi-
dimensional in nature: needs ML/MD processing
Analysis requirements
Multi-dimensional trends and unusual patterns
Capturing important changes at multi-dimensions/levels
Fast, real-time detection and response
Comparing with data cube: Similarity and differences
Stream (data) cube or stream OLAP: Is this feasible?
Can we implement it efficiently?

Multi-Dimensional Stream Analysis: Examples
Analysis of Web click streams Raw data at low levels: seconds, web page addresses, user IP
addresses, … Analysts want: changes, trends, unusual patterns, at
reasonable levels of details E.g., Average clicking traffic in North America on sports in the
last 15 minutes is 40% higher than that in the last 24 hours.”
Analysis of power consumption streams Raw data: power consumption flow for every household,
every minute Patterns one may find: average hourly power consumption
surges up 30% for manufacturing companies in Chicago in the last 2 hours today than that of the same day a week ago

A Key Step—Stream Data Reduction
Challenges of OLAPing stream data Raw data cannot be stored
Simple aggregates are not powerful enough
History shape and patterns at different levels are desirable: multi-dimensional regression analysis
Proposal A scalable multi-dimensional stream “data cube” that can aggregate
regression model of stream data efficiently without accessing the raw data
Stream data compression Compress the stream data to support memory- and time-efficient
multi-dimensional regression analysis

Data Warehouse

Data Warehouse Architecture

Data Warehouse Options