das auto der zukunft dr. axel friedrich umweltbundesamt ... · pdf filedr. axel friedrich...
TRANSCRIPT
Air Pollution Emission Controls inEurope
Dr. Axel FriedrichUmweltbundesamt (UBA)
Germany
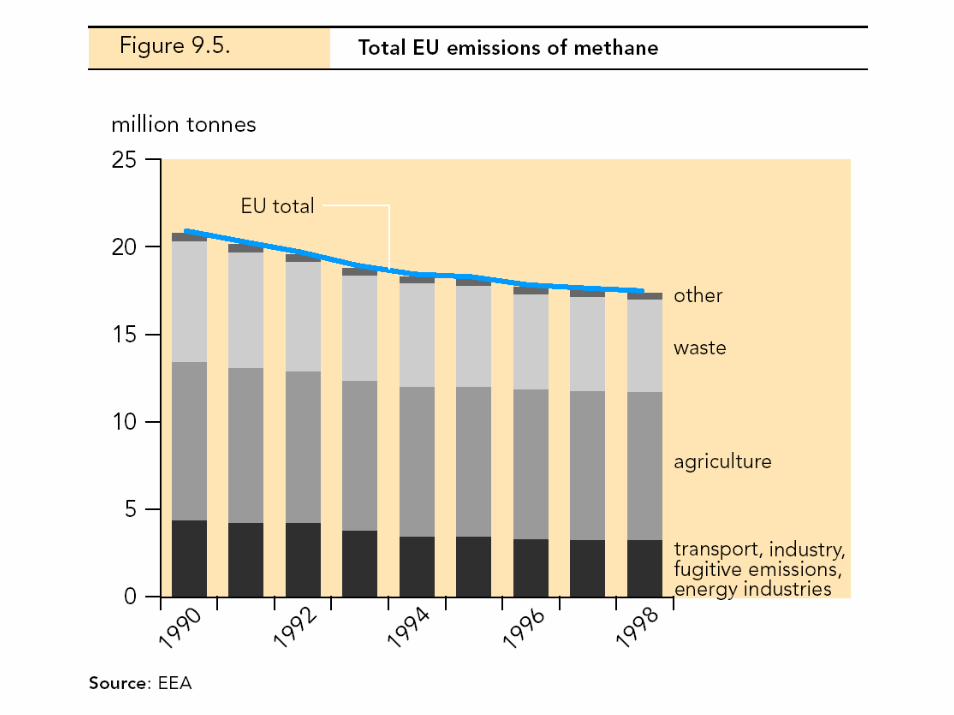
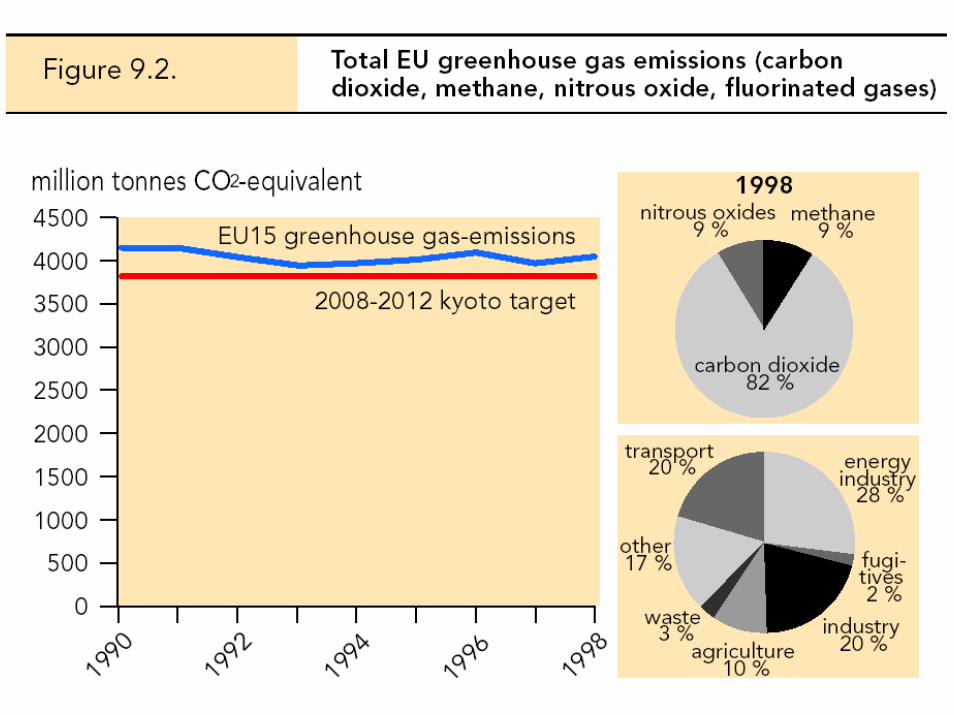
Greenhouse Gases
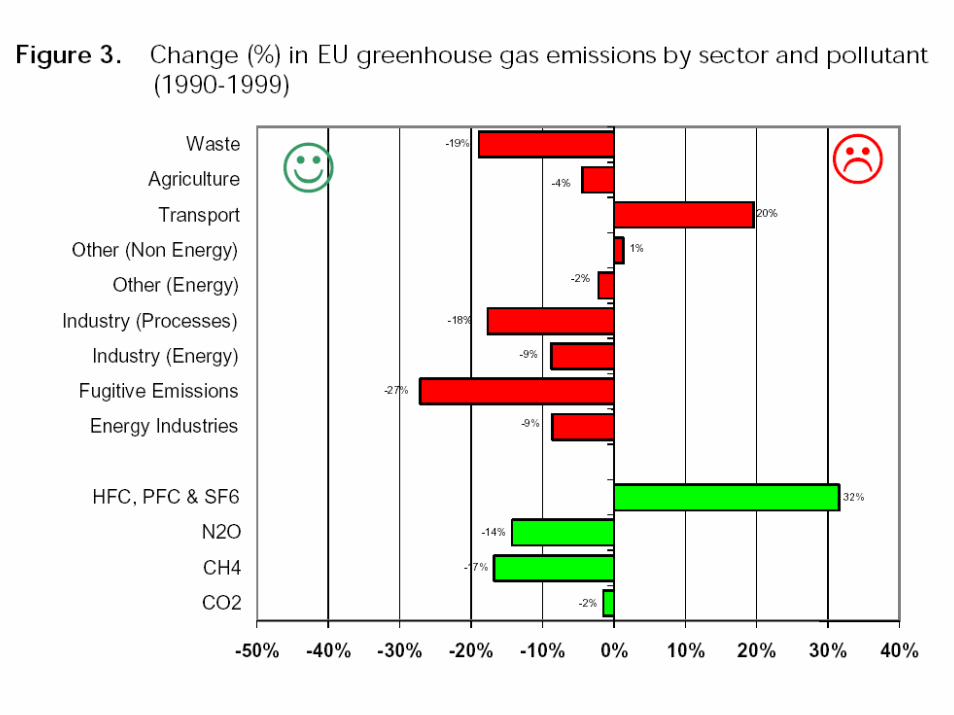
Source: BTM March 2001, DEWI 2002; Germany 2001 actual, not estimate
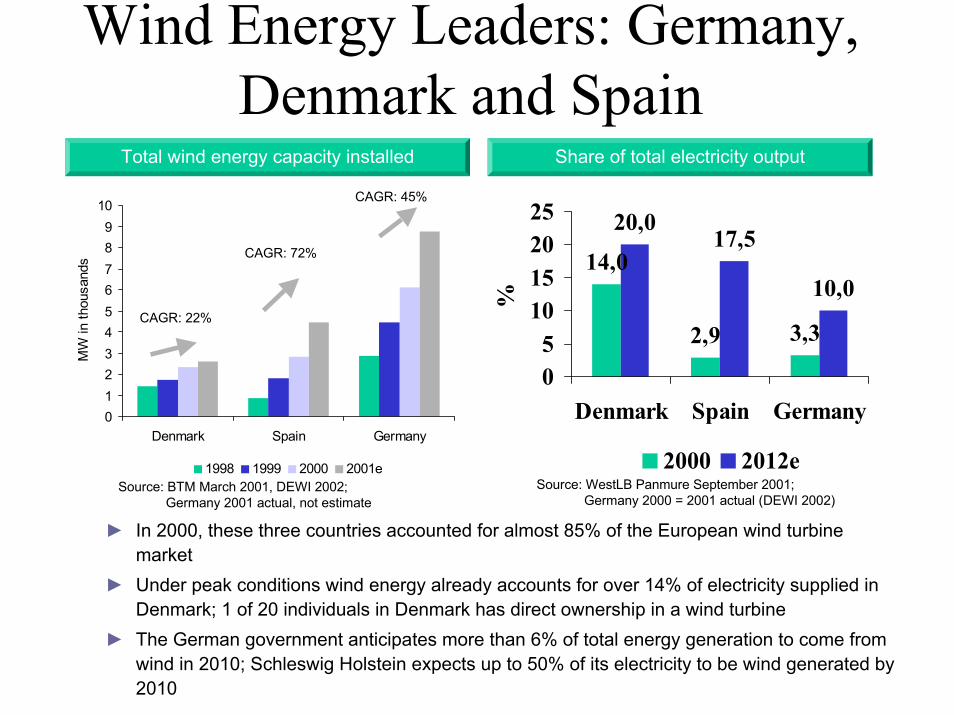
Wind Energy Leaders: Germany,Denmark and Spain
► In 2000, these three countries accounted for almost 85% of the European wind turbinemarket
► Under peak conditions wind energy already accounts for over 14% of electricity supplied inDenmark; 1 of 20 individuals in Denmark has direct ownership in a wind turbine
► The German government anticipates more than 6% of total energy generation to come fromwind in 2010; Schleswig Holstein expects up to 50% of its electricity to be wind generated by2010
Share of total electricity outputTotal wind energy capacity installed
0123456789
10
Denmark Spain Germany
MW
in th
ousa
nds
1998 1999 2000 2001e
CAGR: 22%
CAGR: 45%
CAGR: 72% 14,0
2,9 3,3
20,017,5
10,0
05
10152025
Denmark Spain Germany
%
2000 2012eSource: WestLB Panmure September 2001; Germany 2000 = 2001 actual (DEWI 2002)
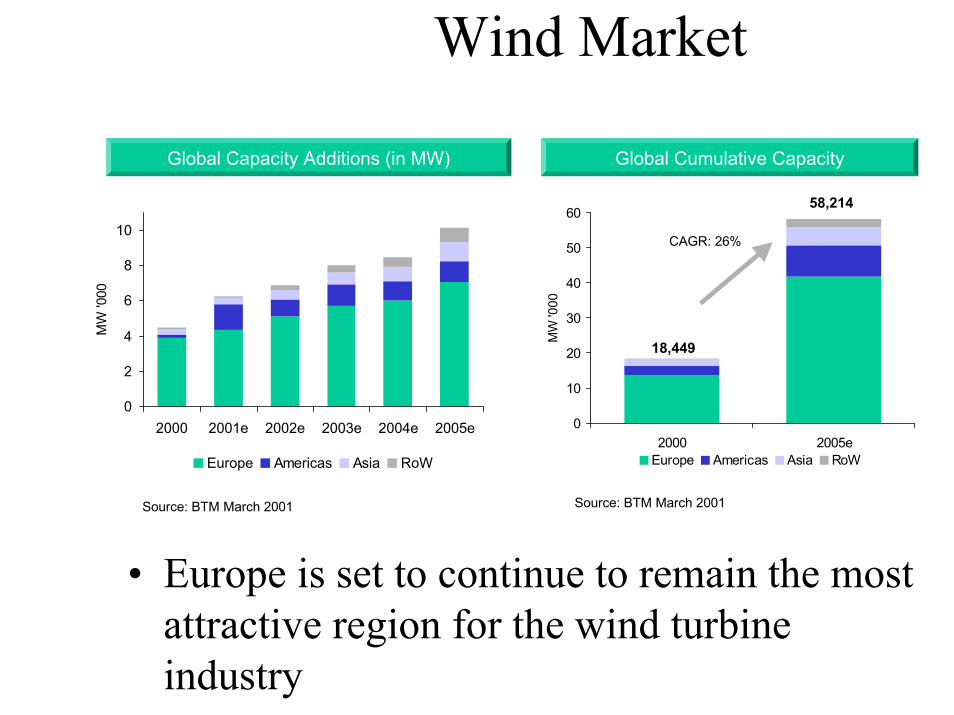
Wind Market
0
2
4
6
8
10
2000 2001e 2002e 2003e 2004e 2005e
MW
'000
Europe Americas Asia RoW
Global Capacity Additions (in MW)
Source: BTM March 2001 Source: BTM March 2001
Global Cumulative Capacity
58,214
18,449
0
10
20
30
40
50
60
2000 2005e
MW
'000
Europe Americas Asia RoW
CAGR: 26%
• Europe is set to continue to remain the mostattractive region for the wind turbineindustry
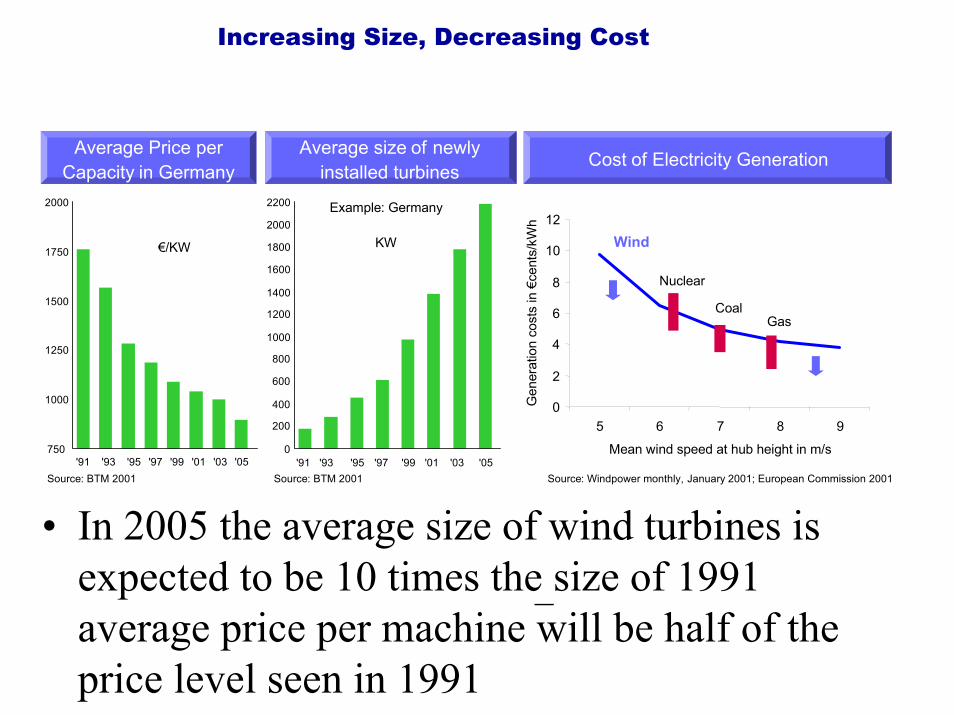
Increasing Size, Decreasing Cost
• In 2005 the average size of wind turbines is expected to be 10 times the size of 1991average price per machine will be half of the price level seen in 1991
750
1000
1250
1500
1750
2000
'91 '93 '95 '97 '99 '01 '03 '05Source: BTM 2001
€/KW
Average Price perCapacity in Germany
–
Cost of Electricity Generation
Example: Germany
KW
Source: BTM 2001
Average size of newly installed turbines
0
200
400
600
800
1000
1200
1400
1600
1800
2000
2200
'91 '93 '95 '97 '99 '01 '03 '05
0
2
4
6
8
10
12
5 6 7 8 9
Mean wind speed at hub height in m/s
Gen
erat
ion
cost
s in
€ce
nts/
kWh
Source: Windpower monthly, January 2001; European Commission 2001
Nuclear
GasCoal
Wind
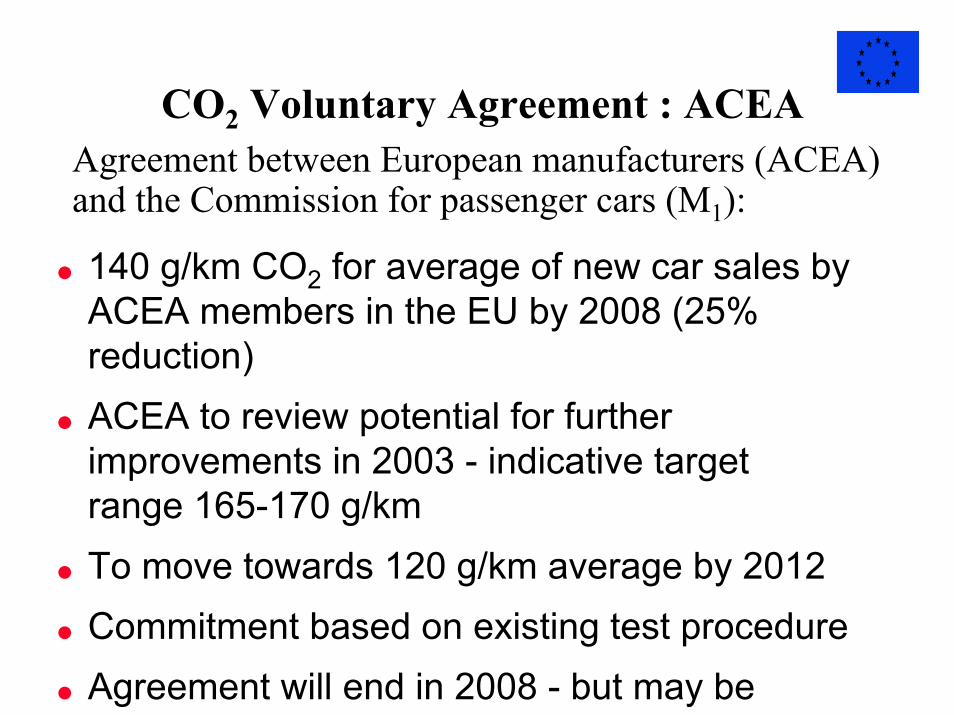
CO2 Voluntary Agreement : ACEAAgreement between European manufacturers (ACEA)and the Commission for passenger cars (M1):
140 g/km CO2 for average of new car sales byACEA members in the EU by 2008 (25%reduction)ACEA to review potential for furtherimprovements in 2003 - indicative targetrange 165-170 g/kmTo move towards 120 g/km average by 2012Commitment based on existing test procedureAgreement will end in 2008 - but may be
CO2 : monitoring and labelling
Commission will report annually to Counciland Parliament on the implementation of theagreement and progress of average CO2emissions
Member-States data on new vehicles, ACEAmarket average figure
labelling information, e.g. at point ofsale, to enable consumer choice
EU-directive in force since Jan. 2001
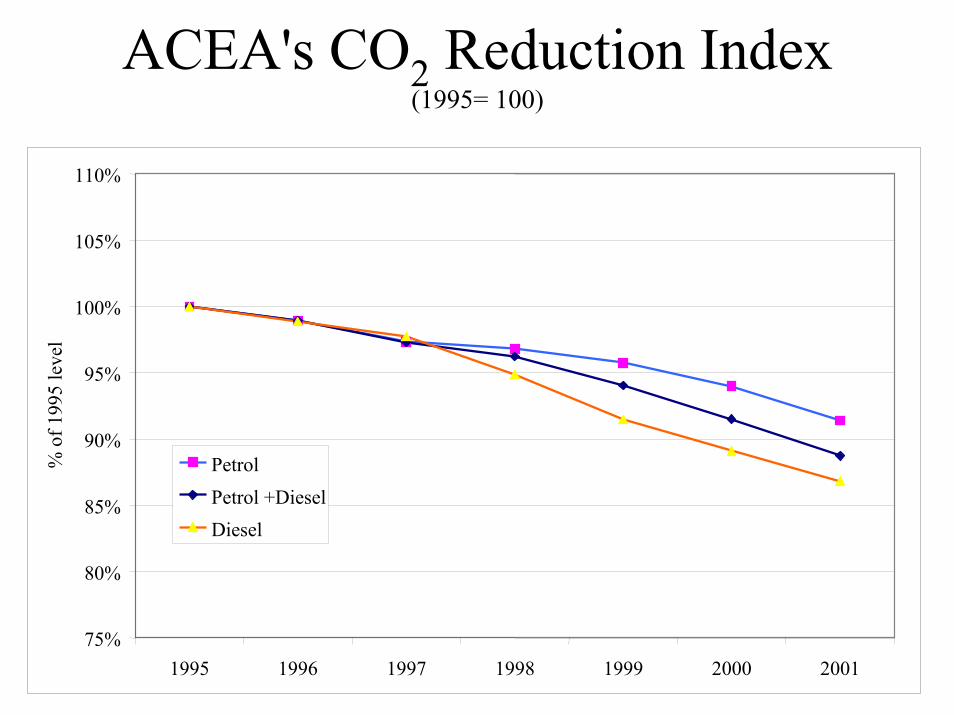
ACEA's CO2 Reduction Index(1995= 100)
75%
80%
85%
90%
95%
100%
105%
110%
1995 1996 1997 1998 1999 2000 2001
% o
f 199
5 le
vel
PetrolPetrol +DieselDiesel
80%
85%
90%
95%
100%
105%
110%
115%
120%
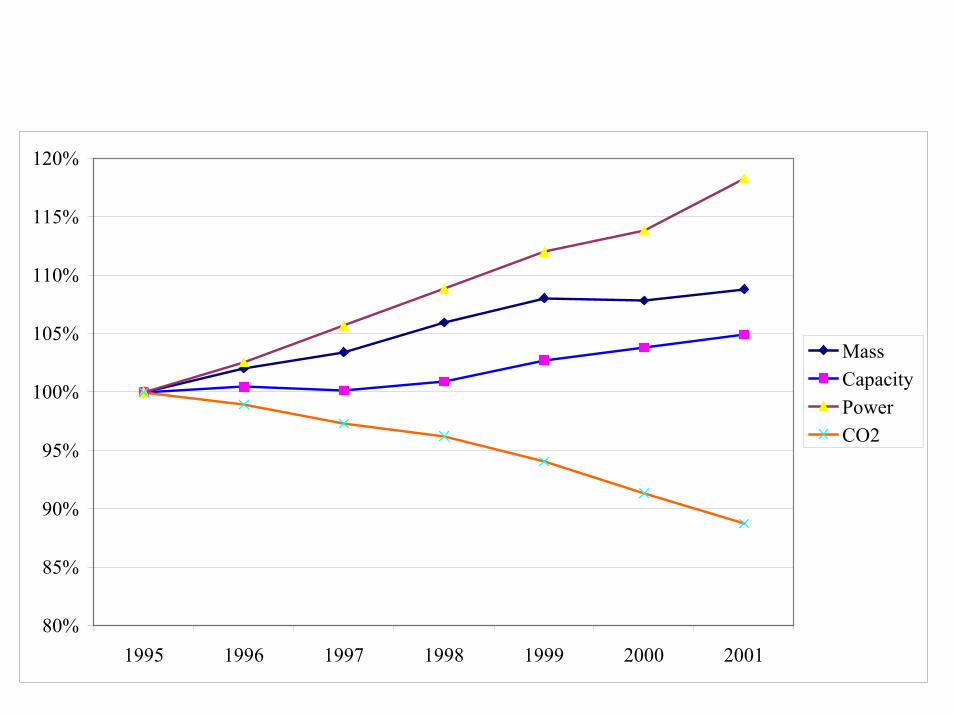
1995 1996 1997 1998 1999 2000 2001
Mass Capacity PowerCO2
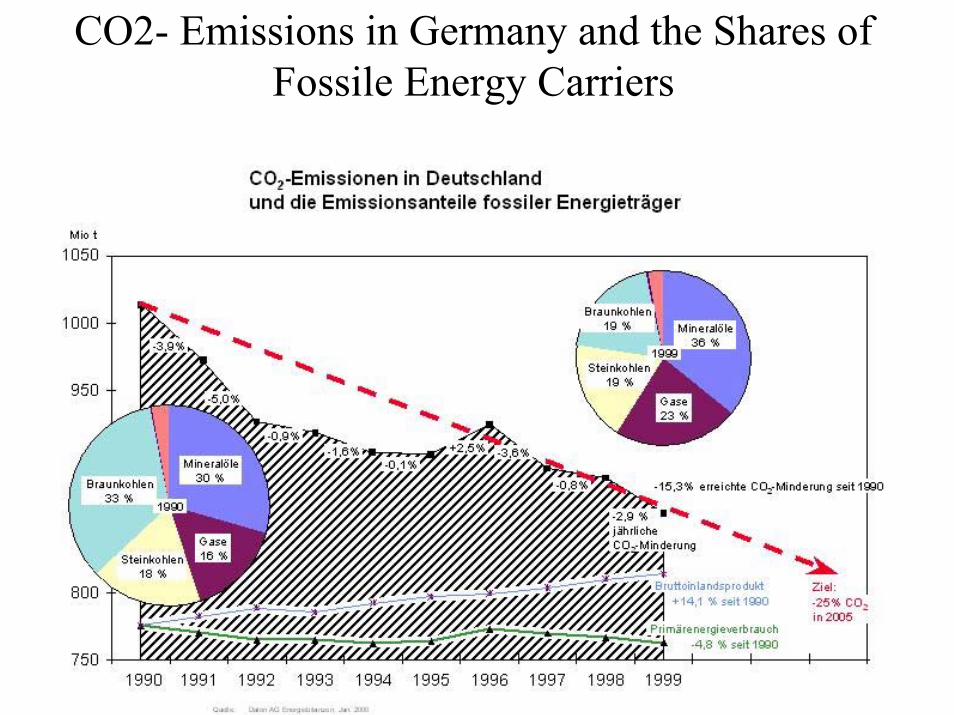
CO2- Emissions in Germany and the Shares ofFossile Energy Carriers
National Plan to reduceGreenhouse Gases
Each Ministry has to supply a definedamount of CO2 Reductione.g. Ministry of Transport:15- 20 Mio t of CO2 until 2005
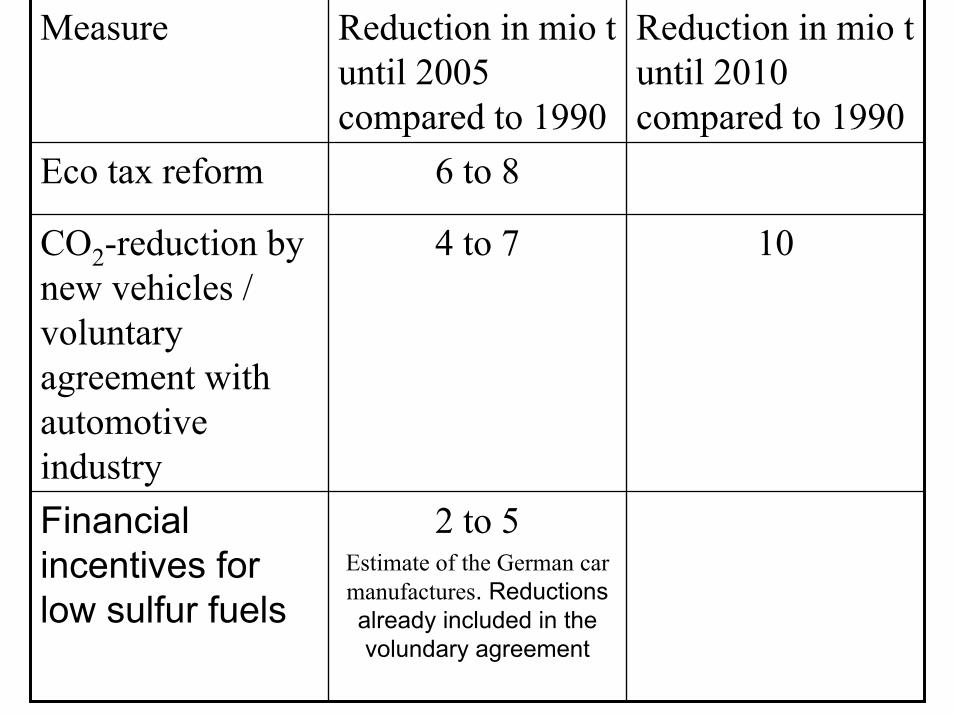
2 to 5Estimate of the German carmanufactures. Reductionsalready included in thevolundary agreement
Financialincentives forlow sulfur fuels
104 to 7CO2-reduction bynew vehicles /voluntaryagreement withautomotiveindustry
6 to 8Eco tax reform
Reduction in mio tuntil 2010compared to 1990
Reduction in mio tuntil 2005compared to 1990
Measure
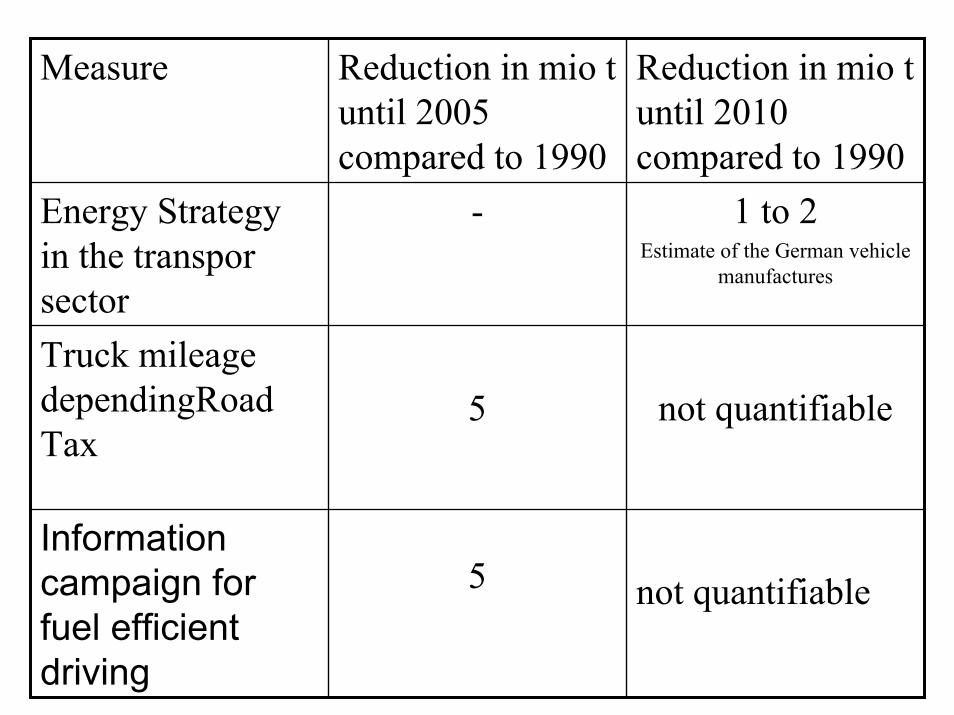
not quantifiable5Informationcampaign forfuel efficientdriving
not quantifiable5Truck mileagedependingRoadTax
1 to 2Estimate of the German vehicle
manufactures
-Energy Strategyin the transporsector
Reduction in mio tuntil 2010compared to 1990
Reduction in mio tuntil 2005compared to 1990
Measure
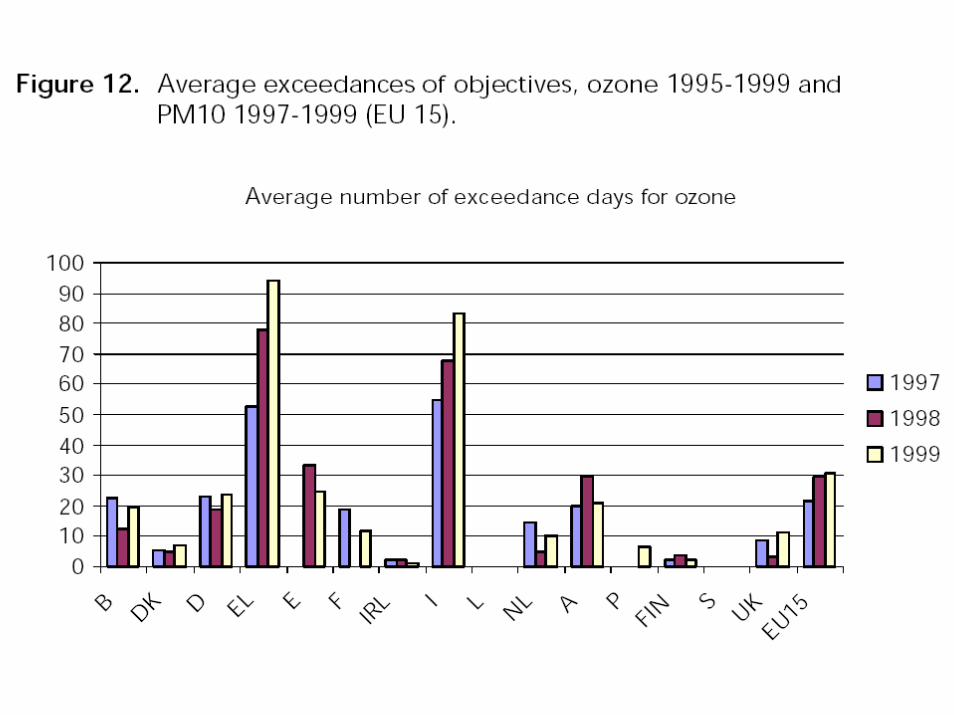
Pollutants( Nox, HC, Particulates )
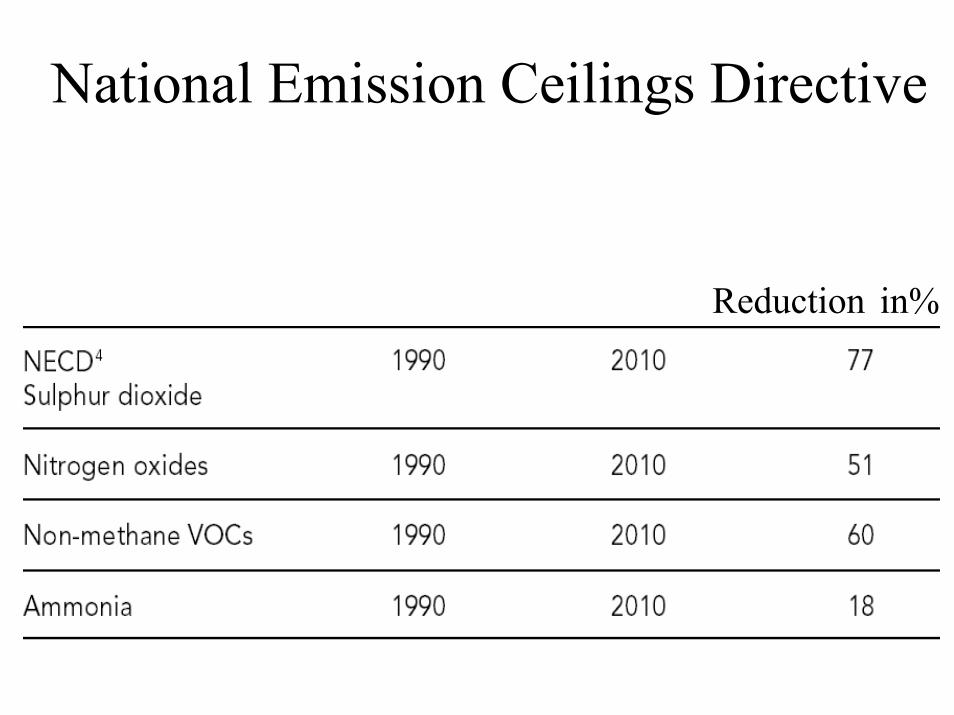
National Emission Ceilings Directive
Reduction in%
0
2000
4000
6000
8000
10000
12000
14000
1990 1995 2000 2005 2010 2015 2020
kt
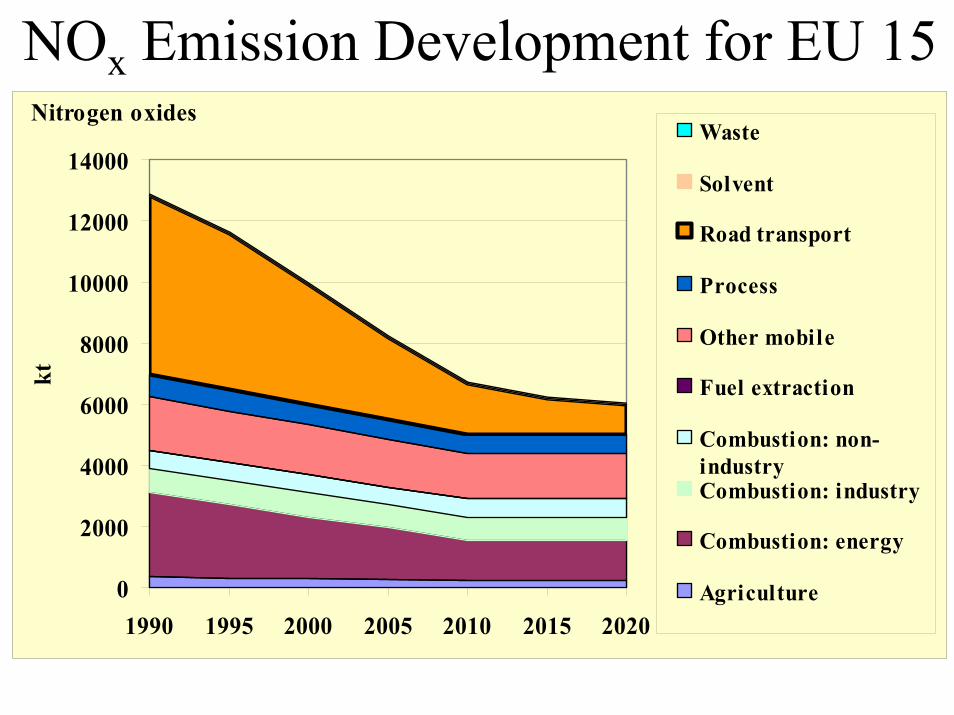
Waste
Solvent
Road transport
Process
Other mobile
Fuel extraction
Combustion: non-industryCombustion: industry
Combustion: energy
Agriculture
Nitrogen oxides
NOx Emission Development for EU 15
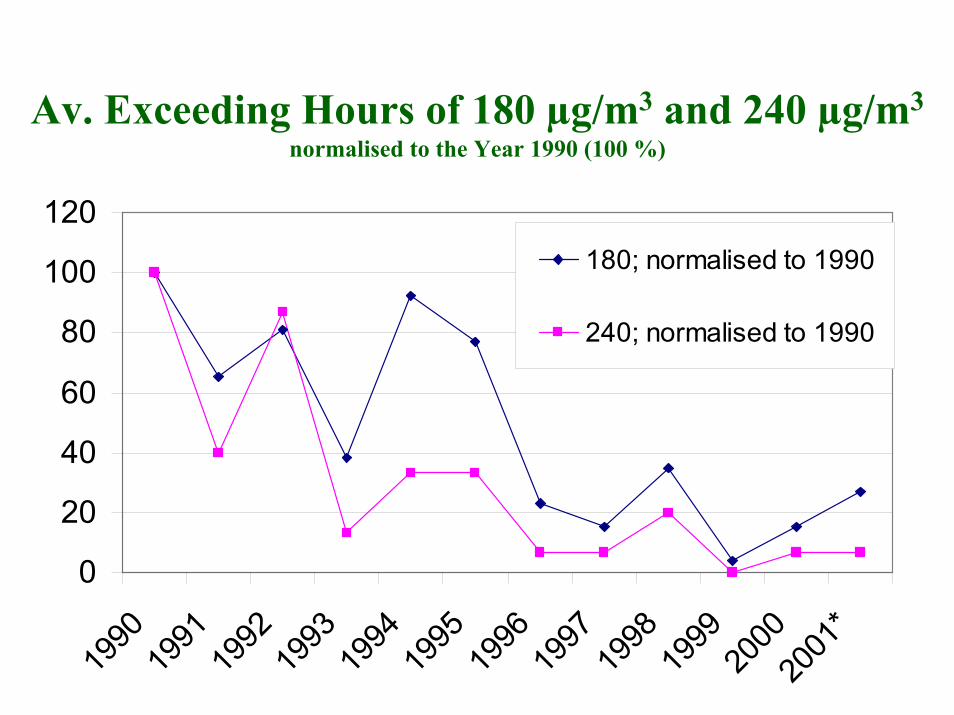
Av. Exceeding Hours of 180 µg/m3 and 240 µg/m3
normalised to the Year 1990 (100 %)
0
20
40
60
80
100
120
1990
1991
1992
1993
1994
1995
1996
1997
1998
1999
2000
2001
*
180; normalised to 1990
240; normalised to 1990
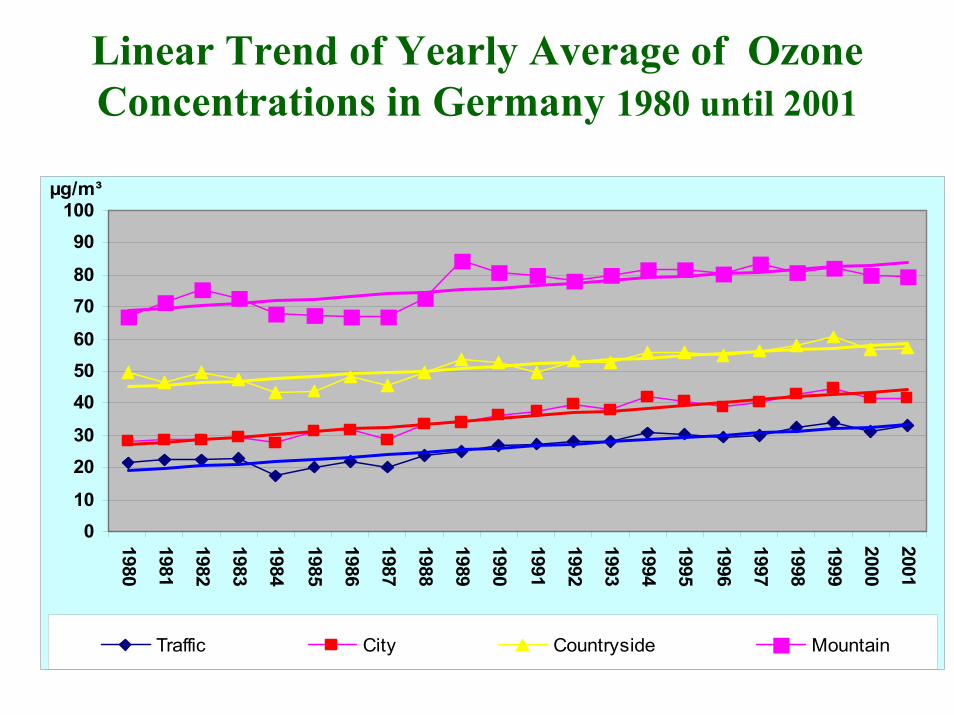
Linear Trend of Yearly Average of OzoneConcentrations in Germany 1980 until 2001
0102030405060708090
100
1980
1981
1982
1983
1984
1985
1986
1987
1988
1989
1990
1991
1992
1993
1994
1995
1996
1997
1998
1999
2000
2001
Traffic City Countryside Mountain
µg/m³
Transport
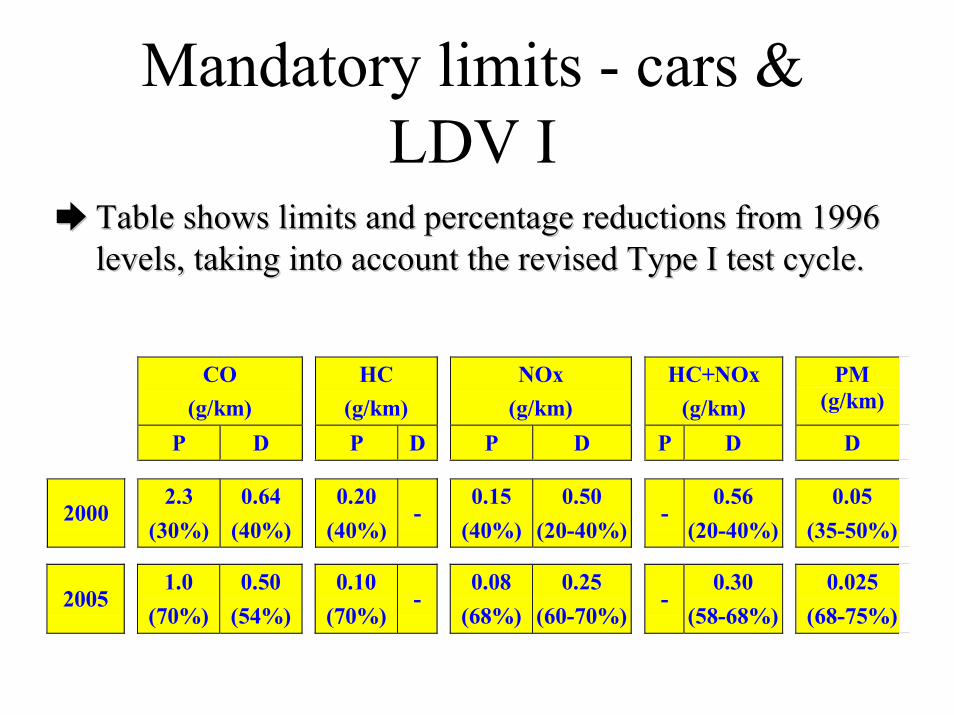
Mandatory limits - cars &LDV I
Table shows limits and percentage reductions from 1996Table shows limits and percentage reductions from 1996levels, taking into account the revised Type I test cycle.levels, taking into account the revised Type I test cycle.
CO(g/km)
HC(g/km)
NOx(g/km)
HC+NOx(g/km)
PM(g/km)
P D P D P D P D D
20002.3
(30%)0.64
(40%)0.20
(40%)-
0.15(40%)
0.50(20-40%)
-0.56
(20-40%)0.05
(35-50%)
20051.0
(70%)0.50
(54%)0.10
(70%)-
0.08(68%)
0.25(60-70%)
-0.30
(58-68%)0.025
(68-75%)
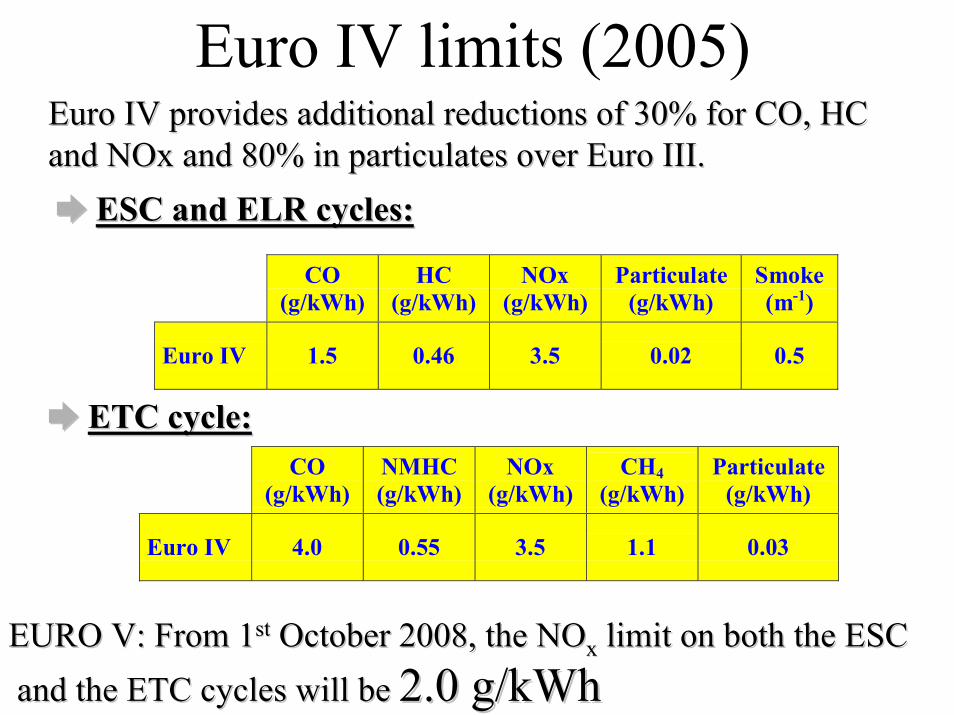
Euro IV limits (2005)Euro IV provides additional reductions of 30% for CO, HCEuro IV provides additional reductions of 30% for CO, HCand NOx and 80% in particulates over Euro III.and NOx and 80% in particulates over Euro III.
CO(g/kWh)
HC(g/kWh)
NOx(g/kWh)
Particulate(g/kWh)
Smoke(m-1)
Euro IV 1.5 0.46 3.5 0.02 0.5
ESC and ELR cycles:ESC and ELR cycles:
CO(g/kWh)
NMHC(g/kWh)
NOx(g/kWh)
CH4(g/kWh)
Particulate(g/kWh)
Euro IV 4.0 0.55 3.5 1.1 0.03
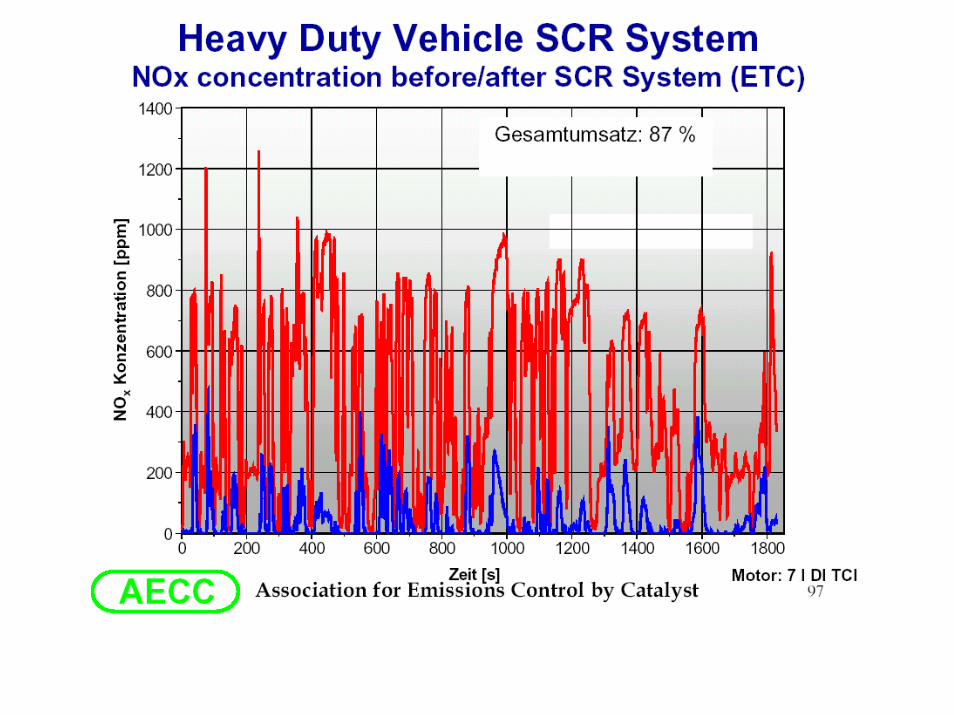
ETC cycle:ETC cycle:
EURO V: EURO V: From 1From 1stst October 2008, the NO October 2008, the NOxx limit on both the ESC limit on both the ESC and and the ETC cycles will be the ETC cycles will be 2.0 g/kWh2.0 g/kWh
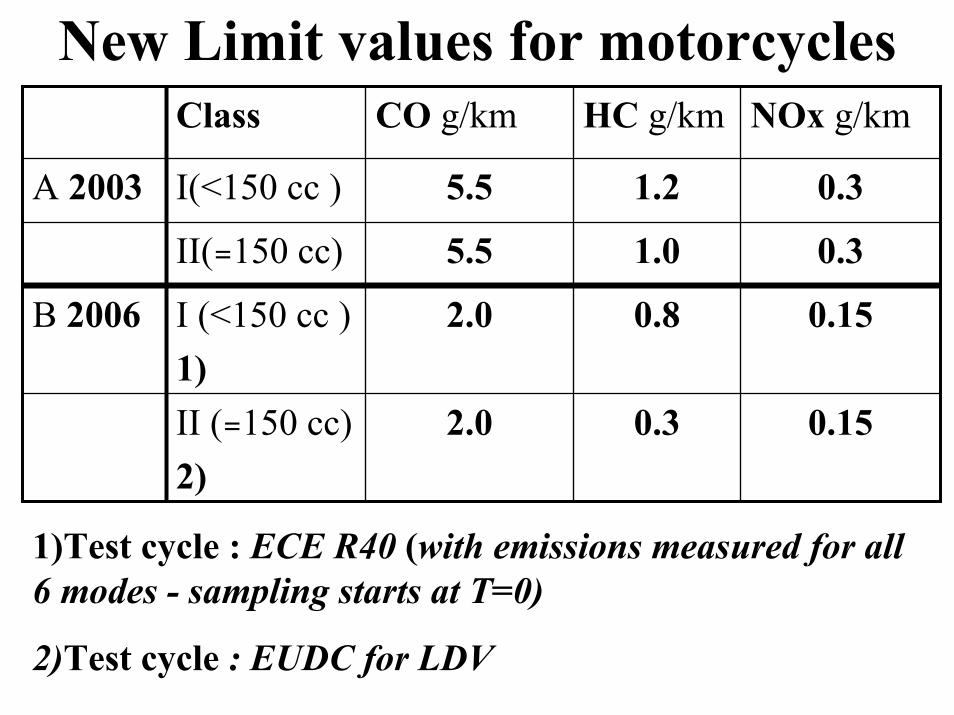
New Limit values for motorcycles
0.150.32.0II (=150 cc)2)
0.150.82.0I (<150 cc )1)
B 2006
0.31.05.5II(=150 cc)
0.31.25.5I(<150 cc )A 2003
NOx g/kmHC g/kmCO g/kmClass
1)Test cycle : ECE R40 (with emissions measured for all6 modes - sampling starts at T=0)
2)Test cycle : EUDC for LDV
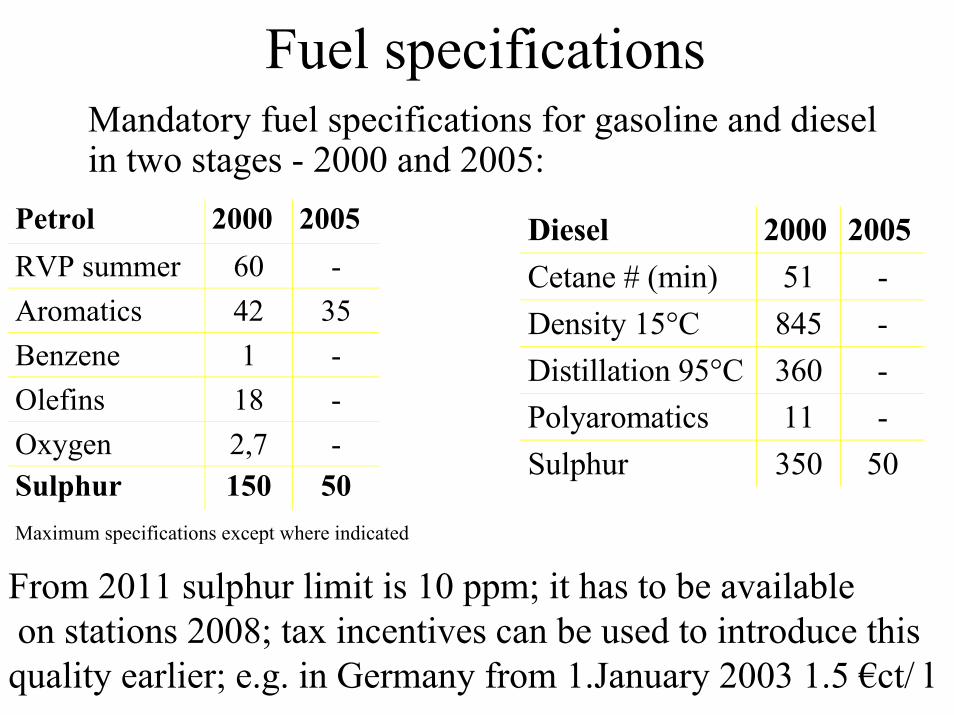
Diesel 2000 2005 Cetane # (min) 51 - Density 15°C 845 - Distillation 95°C 360 - Polyaromatics 11 - Sulphur 350 50
Fuel specificationsMandatory fuel specifications for gasoline and dieselin two stages - 2000 and 2005:
Petrol 2000 2005 RVP summer 60 - Aromatics 42 35 Benzene 1 - Olefins 18 - Oxygen 2,7 - Sulphur 150 50 Maximum specifications except where indicated
From 2011 sulphur limit is 10 ppm; it has to be available on stations 2008; tax incentives can be used to introduce thisquality earlier; e.g. in Germany from 1.January 2003 1.5 €ct/ l
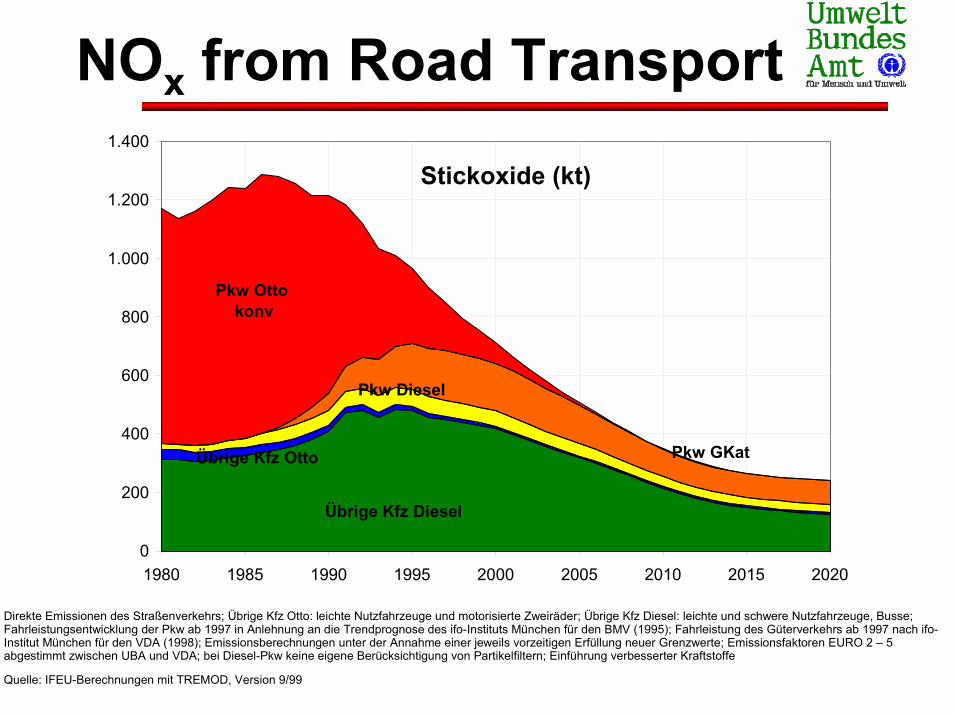
NOx from Road Transport
0
200
400
600
800
1.000
1.200
1.400
1980 1985 1990 1995 2000 2005 2010 2015 2020
Pkw Otto konv
Pkw GKat
Stickoxide (kt)
Pkw Diesel
Übrige Kfz Diesel
Übrige Kfz Otto
Direkte Emissionen des Straßenverkehrs; Übrige Kfz Otto: leichte Nutzfahrzeuge und motorisierte Zweiräder; Übrige Kfz Diesel: leichte und schwere Nutzfahrzeuge, Busse; Fahrleistungsentwicklung der Pkw ab 1997 in Anlehnung an die Trendprognose des ifo-Instituts München für den BMV (1995); Fahrleistung des Güterverkehrs ab 1997 nach ifo-Institut München für den VDA (1998); Emissionsberechnungen unter der Annahme einer jeweils vorzeitigen Erfüllung neuer Grenzwerte; Emissionsfaktoren EURO 2 – 5 abgestimmt zwischen UBA und VDA; bei Diesel-Pkw keine eigene Berücksichtigung von Partikelfiltern; Einführung verbesserter Kraftstoffe
Quelle: IFEU-Berechnungen mit TREMOD, Version 9/99
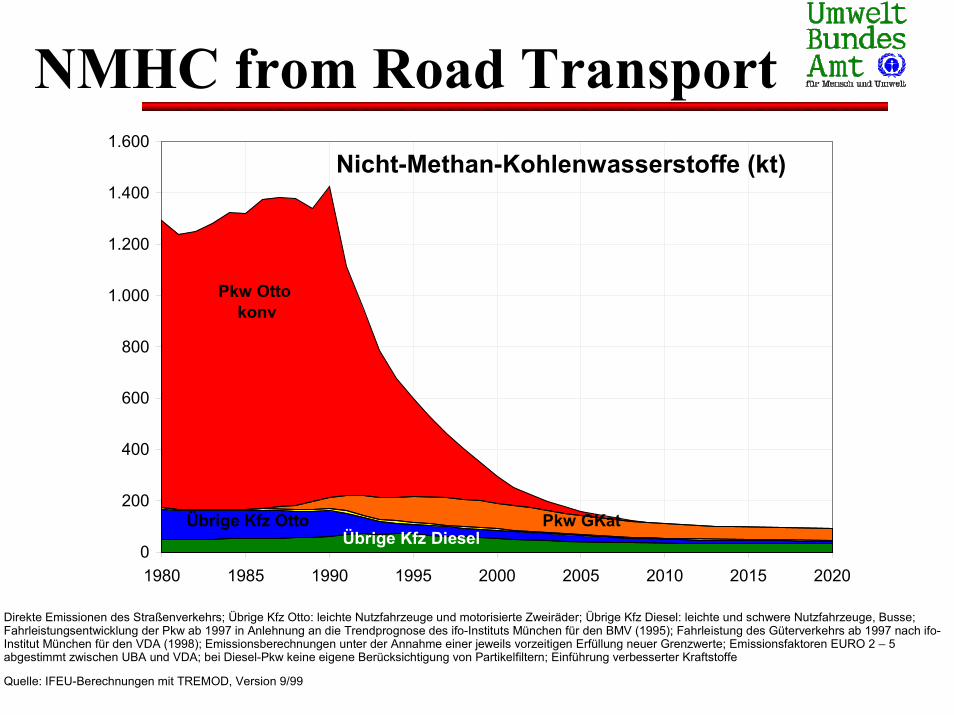
NMHC from Road Transport
0
200
400
600
800
1.000
1.200
1.400
1.600
1980 1985 1990 1995 2000 2005 2010 2015 2020
Pkw Otto konv
Pkw GKat
Nicht-Methan-Kohlenwasserstoffe (kt)
Übrige Kfz DieselÜbrige Kfz Otto
Direkte Emissionen des Straßenverkehrs; Übrige Kfz Otto: leichte Nutzfahrzeuge und motorisierte Zweiräder; Übrige Kfz Diesel: leichte und schwere Nutzfahrzeuge, Busse; Fahrleistungsentwicklung der Pkw ab 1997 in Anlehnung an die Trendprognose des ifo-Instituts München für den BMV (1995); Fahrleistung des Güterverkehrs ab 1997 nach ifo-Institut München für den VDA (1998); Emissionsberechnungen unter der Annahme einer jeweils vorzeitigen Erfüllung neuer Grenzwerte; Emissionsfaktoren EURO 2 – 5 abgestimmt zwischen UBA und VDA; bei Diesel-Pkw keine eigene Berücksichtigung von Partikelfiltern; Einführung verbesserter Kraftstoffe
Quelle: IFEU-Berechnungen mit TREMOD, Version 9/99
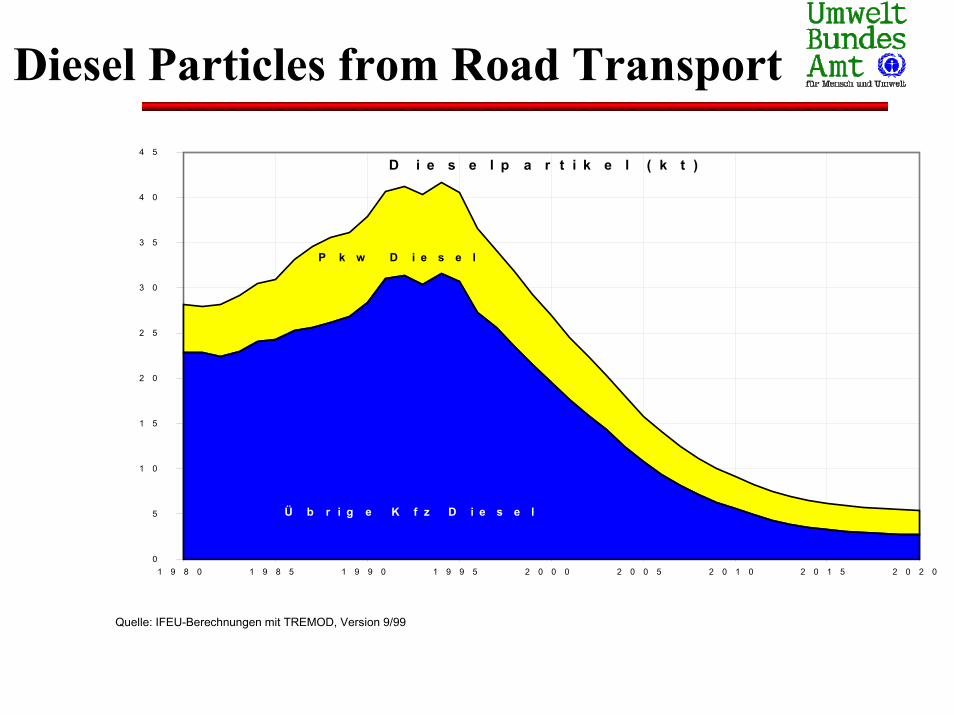
Diesel Particles from Road Transport
0
5
1 0
1 5
2 0
2 5
3 0
3 5
4 0
4 5
1 9 8 0 1 9 8 5 1 9 9 0 1 9 9 5 2 0 0 0 2 0 0 5 2 0 1 0 2 0 1 5 2 0 2 0
D i e s e l p a r t i k e l ( k t )
Ü b r i g e K f z D i e s e l
P k w D i e s e l
Quelle: IFEU-Berechnungen mit TREMOD, Version 9/99
0,0
2,0
4,0
6,0
8,0
10,0
12,0
14,0
16,0
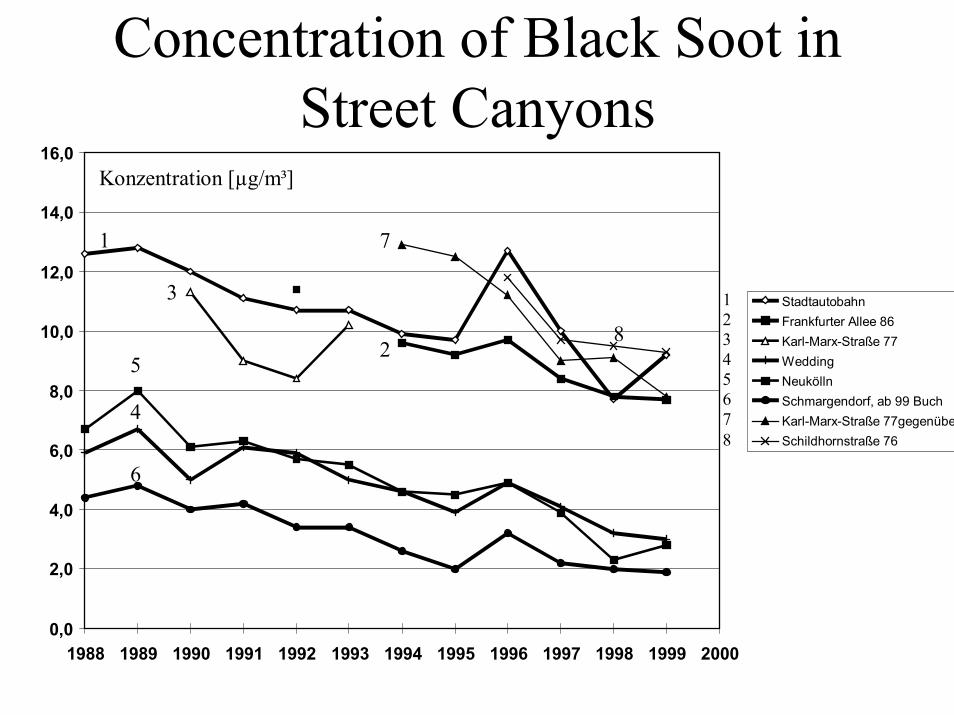
1988 1989 1990 1991 1992 1993 1994 1995 1996 1997 1998 1999 2000
StadtautobahnFrankfurter Allee 86Karl-Marx-Straße 77WeddingNeuköllnSchmargendorf, ab 99 Buch Karl-Marx-Straße 77gegenübeSchildhornstraße 76
12345678
1
2
3
4
5
6
7
8
Konzentration [µg/m³]
Concentration of Black Soot inStreet Canyons
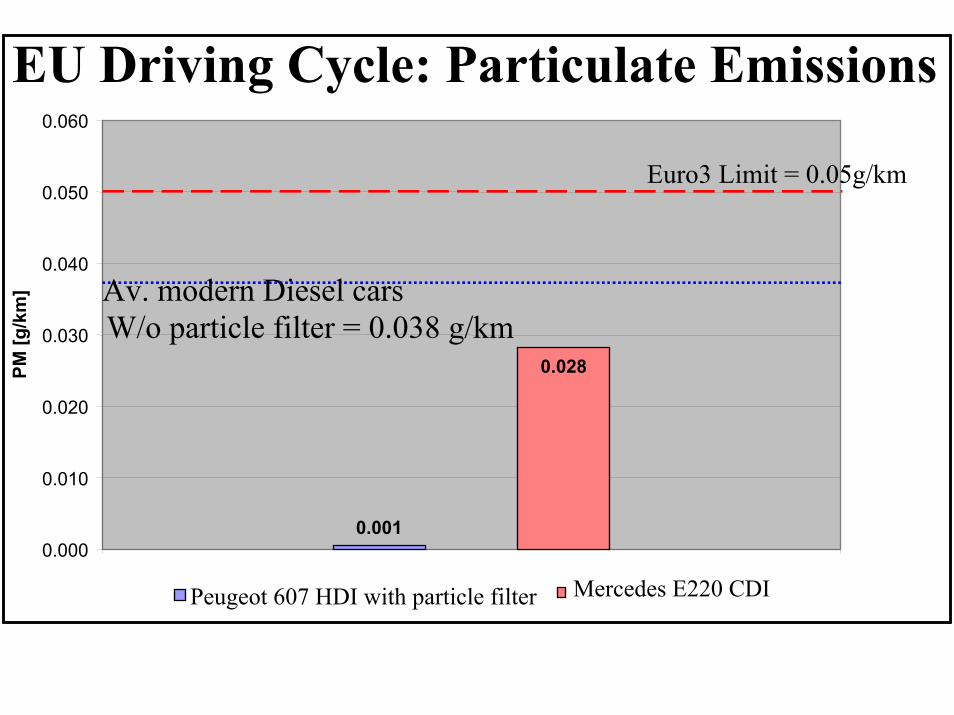
EU Driving Cycle: Particulate Emissions
0.001
0.028
0.000
0.010
0.020
0.030
0.040
0.050
0.060
PM [g
/km
]
Peugeot 607 HDI with particle filter Mercedes E220 CDI
Euro3 Limit = 0.05g/km
Av. modern Diesel carsW/o particle filter = 0.038 g/km
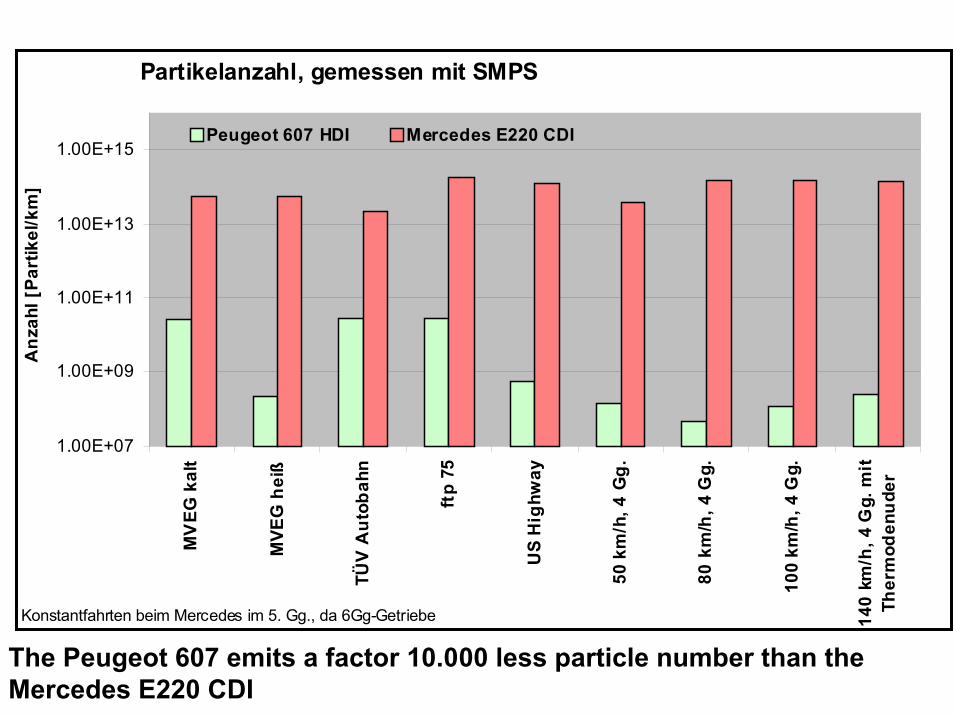
Partikelanzahl, gemessen mit SMPS
1.00E+07
1.00E+09
1.00E+11
1.00E+13
1.00E+15
MV
EG k
alt
MVE
G h
eiß
TÜV
Aut
obah
n
ftp
75
US
Hig
hway
50 k
m/h
, 4 G
g.
80 k
m/h
, 4 G
g.
100
km/h
, 4 G
g.
140
km/h
, 4 G
g. m
itTh
erm
oden
uder
Anz
ahl [
Part
ikel
/km
]
Peugeot 607 HDI Mercedes E220 CDI
Konstantfahrten beim Mercedes im 5. Gg., da 6Gg-Getriebe
The Peugeot 607 emits a factor 10.000 less particle number than theMercedes E220 CDI
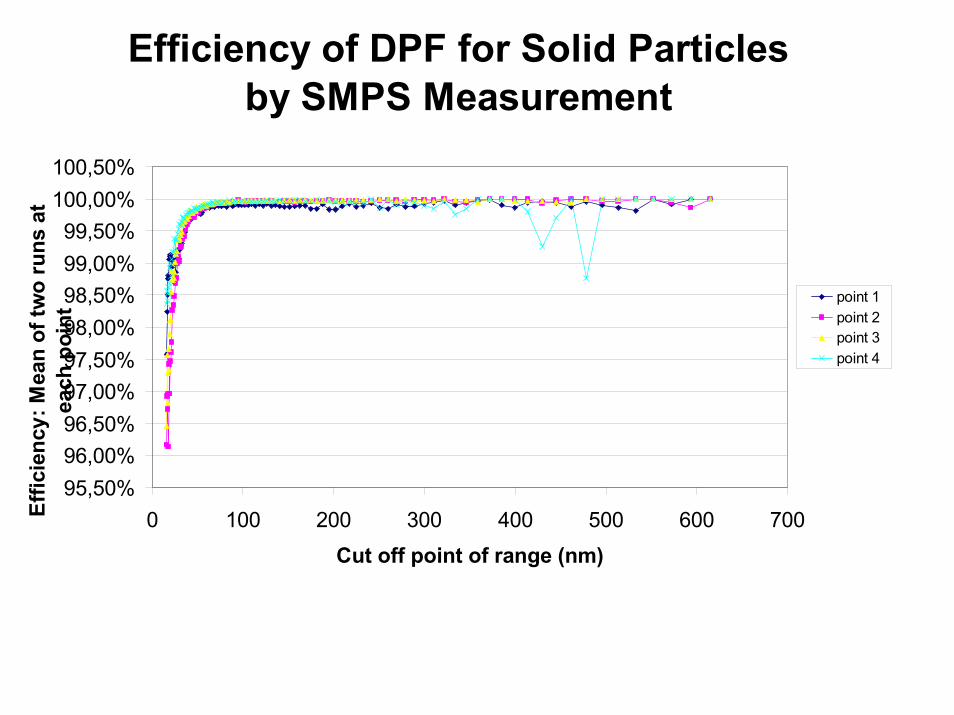
Efficiency of DPF for Solid Particles by SMPS Measurement
95,50%96,00%96,50%97,00%97,50%98,00%98,50%99,00%99,50%
100,00%100,50%
0 100 200 300 400 500 600 700Cut off point of range (nm)
Effic
ienc
y: M
ean
of tw
o ru
ns a
t ea
ch p
oint
point 1point 2point 3point 4
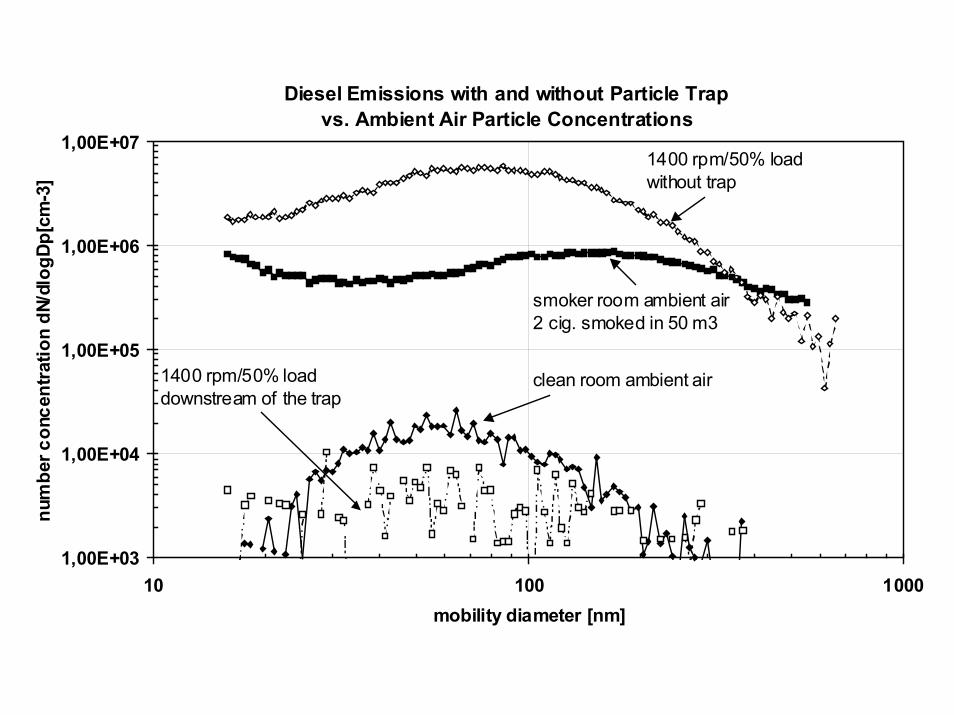
Diesel Emissions with and without Particle Trapvs. Ambient Air Particle Concentrations
1,00E+03
1,00E+04
1,00E+05
1,00E+06
1,00E+07
10 100 1000mobility diameter [nm]
num
ber c
once
ntra
tion
dN/d
logD
p[cm
-3]
1400 rpm/50% loadwithout trap
smoker room ambient air2 cig. smoked in 50 m3
clean room ambient air1400 rpm/50% loaddownstream of the trap
Economic Instruments to Reduce Emissions from the Transport Sector 41
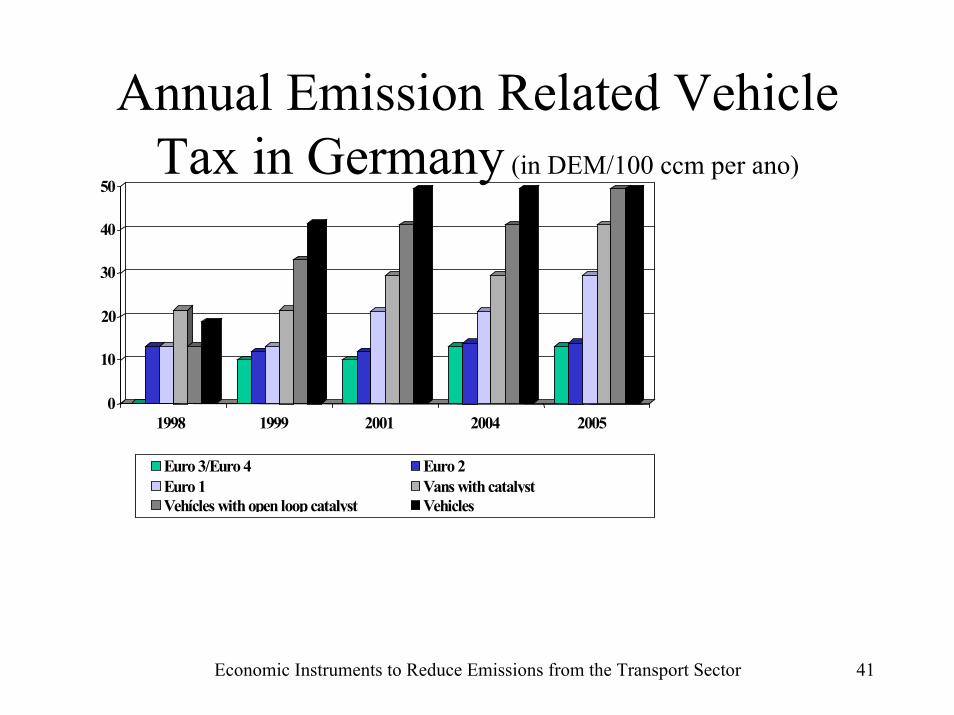
Annual Emission Related VehicleTax in Germany (in DEM/100 ccm per ano)
0
10
20
30
40
50
1998 1999 2001 2004 2005
Euro 3/Euro 4 Euro 2Euro 1 Vans with catalystVehícles with open loop catalyst Vehicles
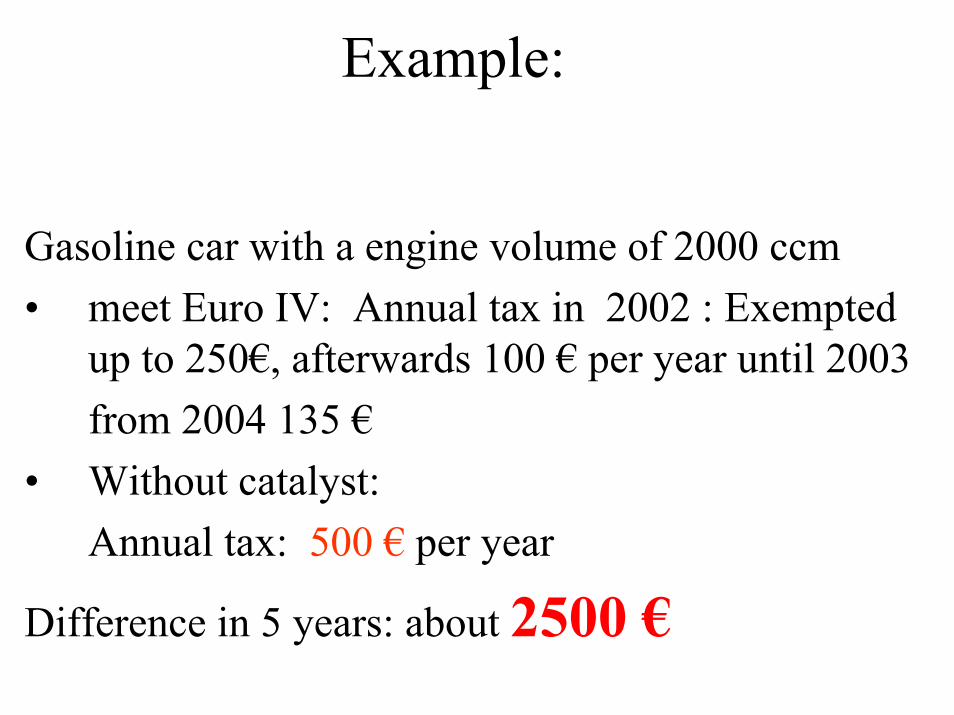
Example:
Gasoline car with a engine volume of 2000 ccm• meet Euro IV: Annual tax in 2002 : Exempted
up to 250€, afterwards 100 € per year until 2003 from 2004 135 €• Without catalyst: Annual tax: 500 € per year
Difference in 5 years: about 2500 €
Solvent Control
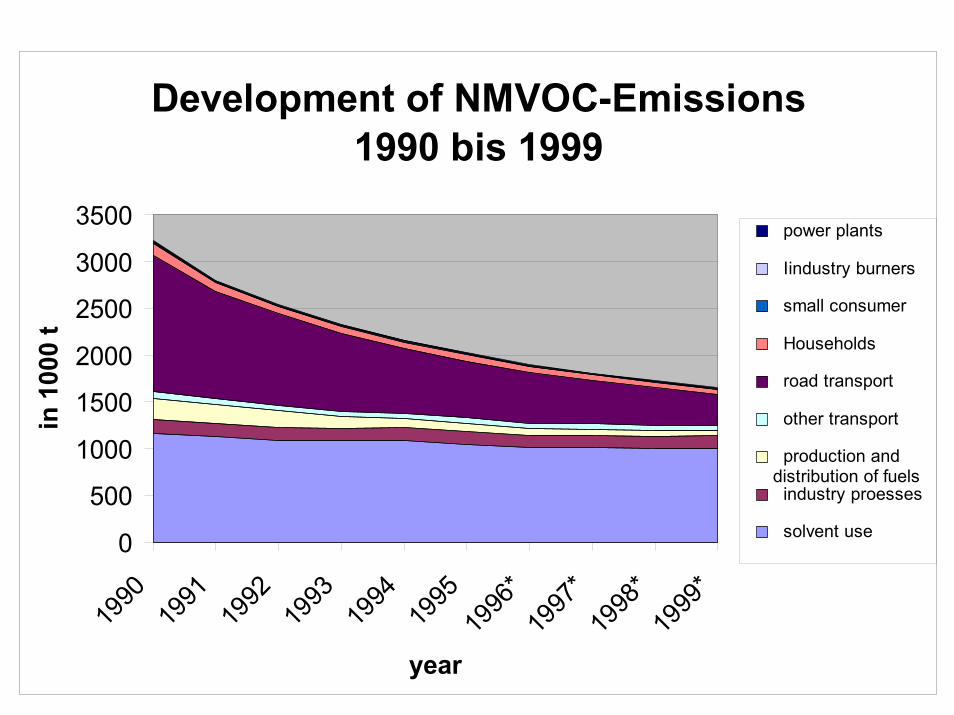
Development of NMVOC-Emissions 1990 bis 1999
0
500
1000
1500
2000
2500
3000
3500
1990
1991
1992
1993
1994
1995
1996
*19
97*
1998
*19
99*
year
in 1
000
t
power plants
Iindustry burners
small consumer
Households
road transport
other transport
production anddistribution of fuels industry proesses
solvent use
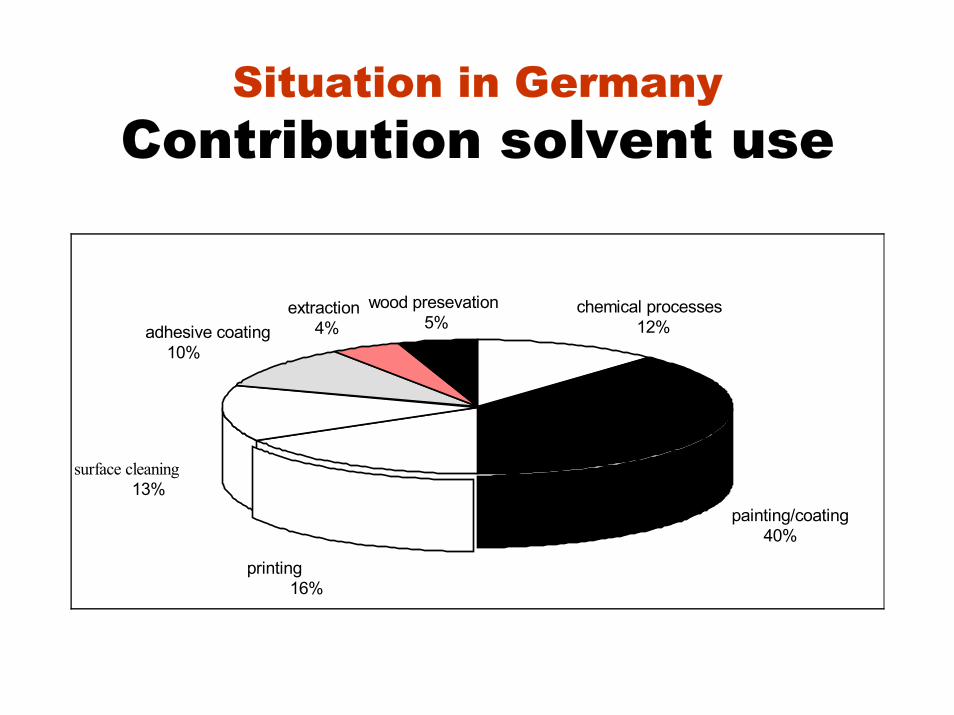
Situation in GermanyContribution solvent use
chemical processes12%
painting/coating40%
printing16%
surface cleaning 13%
adhesive coating10%
extraction4%
wood presevation5%
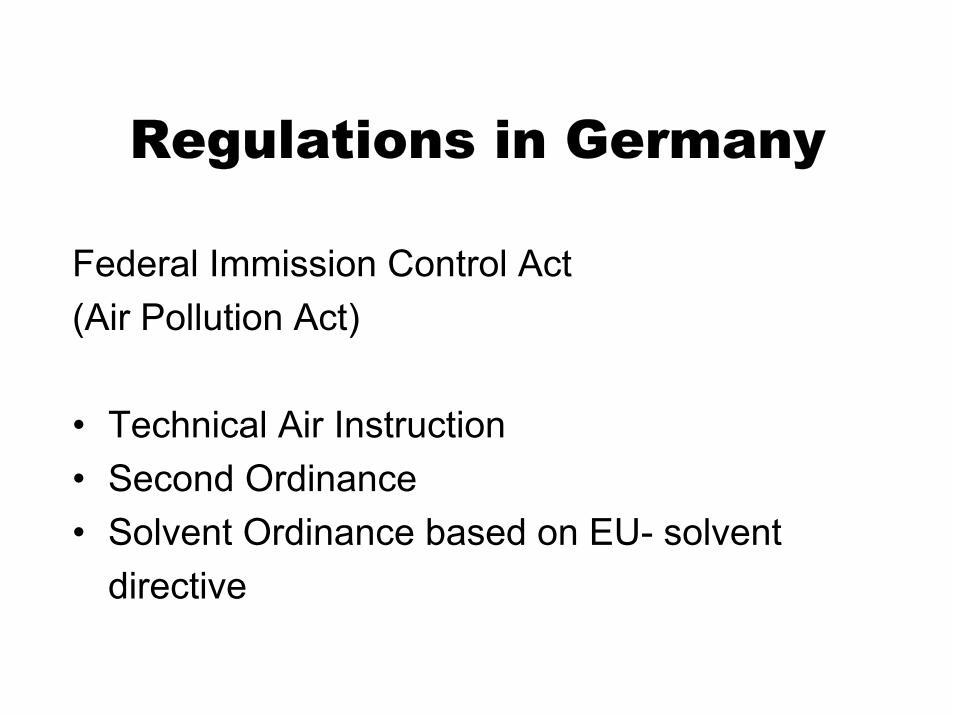
Regulations in Germany
Federal Immission Control Act(Air Pollution Act)
• Technical Air Instruction• Second Ordinance• Solvent Ordinance based on EU- solvent
directive
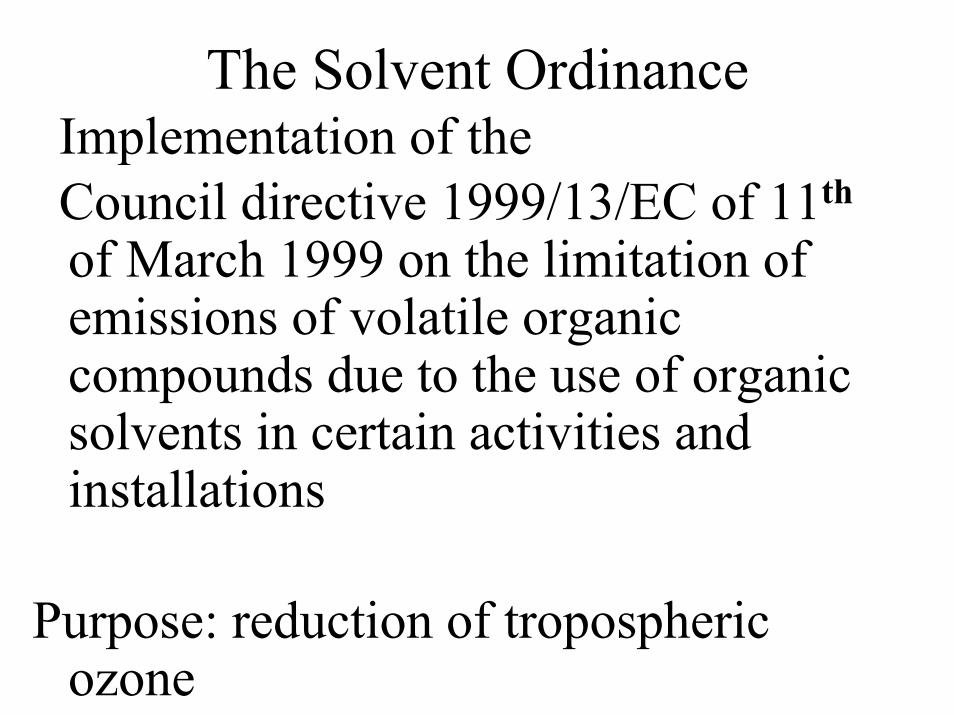
The Solvent Ordinance Implementation of the Council directive 1999/13/EC of 11th
of March 1999 on the limitation ofemissions of volatile organiccompounds due to the use of organicsolvents in certain activities andinstallations
Purpose: reduction of troposphericozone
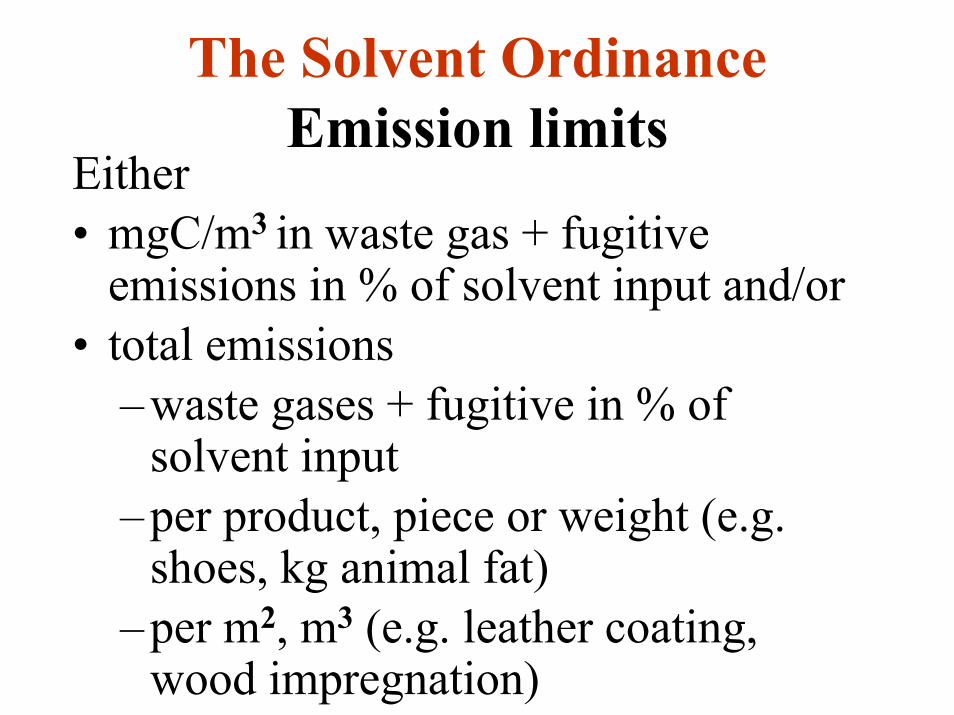
The Solvent OrdinanceEmission limits
Either• mgC/m3 in waste gas + fugitive
emissions in % of solvent input and/or• total emissions
–waste gases + fugitive in % ofsolvent input
–per product, piece or weight (e.g.shoes, kg animal fat)
–per m2, m3 (e.g. leather coating,wood impregnation)
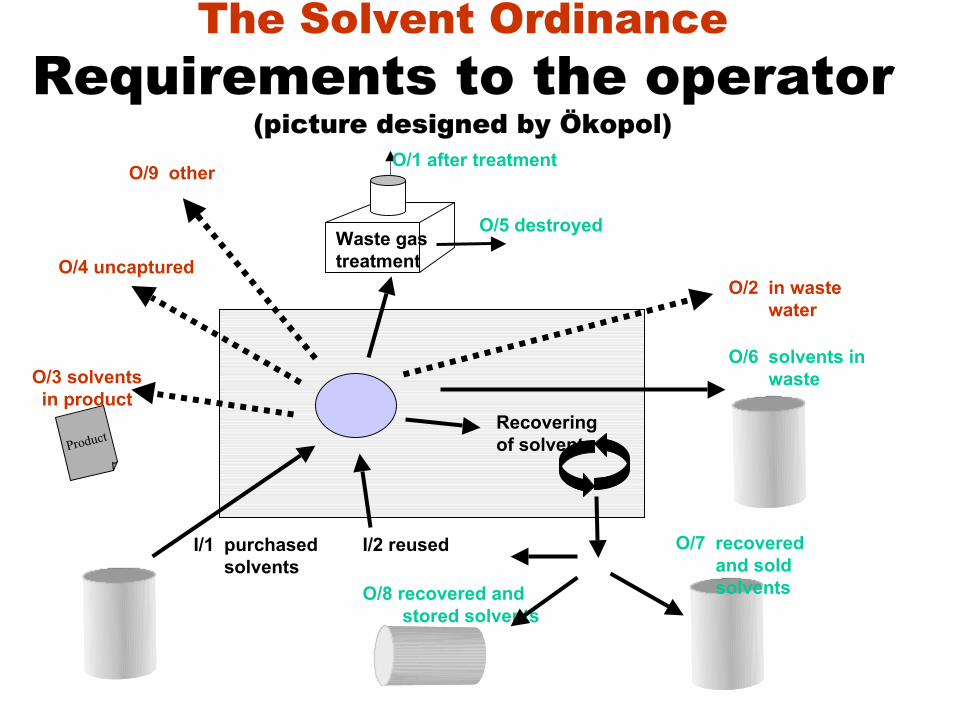
The Solvent OrdinanceRequirements to the operator
(picture designed by Ökopol)
Recoveringof solvents
O/4 uncapturedWaste gastreatment
O/1 after treatment
O/5 destroyed
O/9 other
Product
O/3 solventsin product
I/1 purchasedsolvents
I/2 reused
O/8 recovered andstored solvents
O/7 recoveredand soldsolvents
O/6 solvents inwaste
O/2 in wastewater
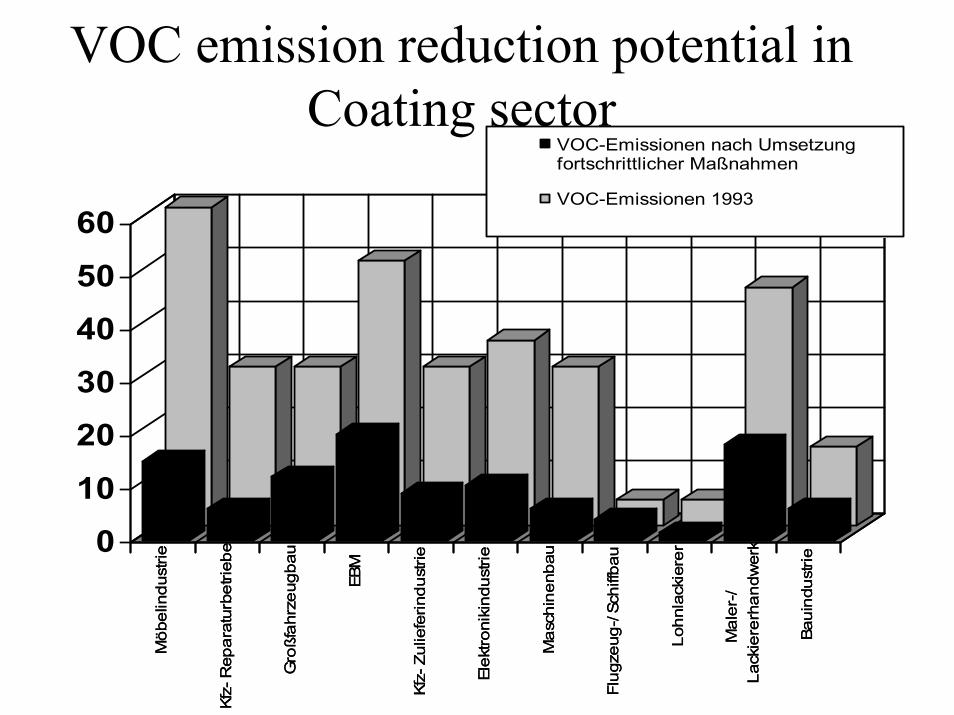
VOC emission reduction potential inCoating sector
Möb
elin
dust
rie
Kfz-
Rep
arat
urbe
trieb
e
Gro
ßfah
rzeu
gbau
EBM
Kfz-
Zul
iefe
rindu
strie
Elek
troni
kind
ustri
e
Mas
chin
enba
u
Flug
zeug
-/ Sc
hiffb
au
Lohn
lack
iere
r
Mal
er-/
Lack
iere
rhan
dwer
k
Baui
ndus
trie0
102030405060
Möb
elin
dust
rie
Kfz-
Rep
arat
urbe
trieb
e
Gro
ßfah
rzeu
gbau
EBM
Kfz-
Zul
iefe
rindu
strie
Elek
troni
kind
ustri
e
Mas
chin
enba
u
Flug
zeug
-/ Sc
hiffb
au
Lohn
lack
iere
r
Mal
er-/
Lack
iere
rhan
dwer
k
Baui
ndus
trie
VOC-Emissionen nach Umsetzungfortschrittlicher Maßnahmen
VOC-Emissionen 1993