danone q3 2018 · recurring operating margin, recurring net income, recurring income tax rate,...
TRANSCRIPT

I 1 I
Q3 2018 SALES
Cécile Cabanis
CFO
October 17, 2018
I 2 I
• This presentation contains certain forward-looking statements concerning Danone. In some cases, you can identify these forward-
looking statements by forward-looking words, such as “estimate,” “expect,” “anticipate,” “project,” “plan,” “intend,” “objective”“believe,” “forecast,” “foresee,” “likely,” “may,” “should,” “goal,” “target,” “might,” “will,” “could,” “predict,” “continue,”“convinced,” and “confident,” the negative or plural of these words and other comparable terminology. Forward looking
statements in this document include, but are not limited to, statements regarding Danone’s operation of its business, and the futureoperation, directionand success of Danone’sbusiness.
• Although Danone believes its expectations are based on reasonable assumptions, these forward-looking statements are subject to
numerous risks and uncertainties, which could cause actual results to differ materially from those anticipated in these forward-looking statements. For a detailed description of these risks and uncertainties, please refer to the “Risk Factor” section of Danone’sRegistrationDocument (the current version of which is available on www.danone.com).
• Subject to regulatory requirements, Danone does not undertake to publicly update or revise any of these forward-looking
statements. This document does not constitute an offer to sell, or a solicitationof an offer tobuy Danone securities.
• All references in this presentation to “Like-for-like (LFL)”, ”Like-for-like (LFL) New Danone” changes, recurring operating income,recurring operating margin, recurring net income, recurring income tax rate, Recurring EPS, Yakult Transaction Impact, free cash
flow and net financial debt correspond to financial indicators not defined in IFRS. Their definitions, their reconciliation with financialstatements and IAS29 accounting treatment for Argentina, are included in the Q3 results press release issued on October 17th,2018. Q1, Q2 and Q3 2017 reported figures have been restated for IFRS 15.
• Due to rounding, the sum of values presented in this presentation may differ from totals as reported. Such differences are not
material.
Disclaimer
I 3 I
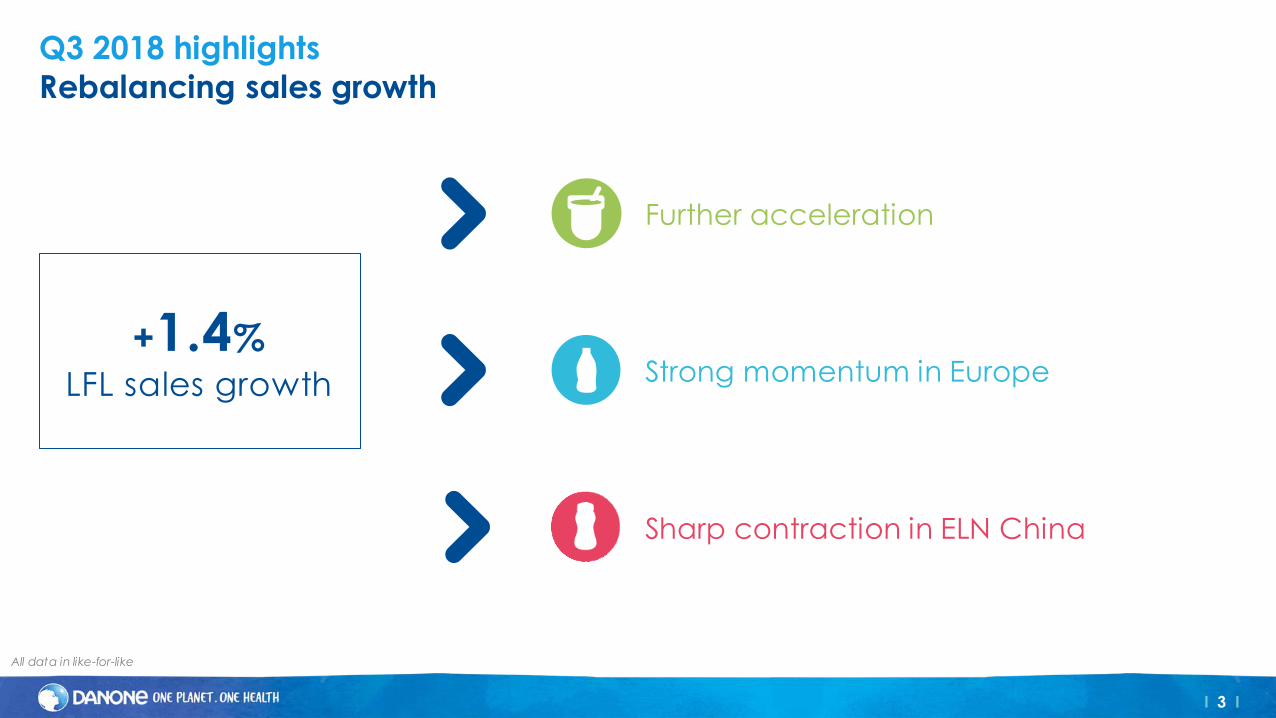
Q3 2018 highlights
Rebalancing sales growth
All data in like-for-like
+1.4%
LFL sales growth
Further acceleration
Strong momentum in Europe
Sharp contraction in ELN China
I 4 I
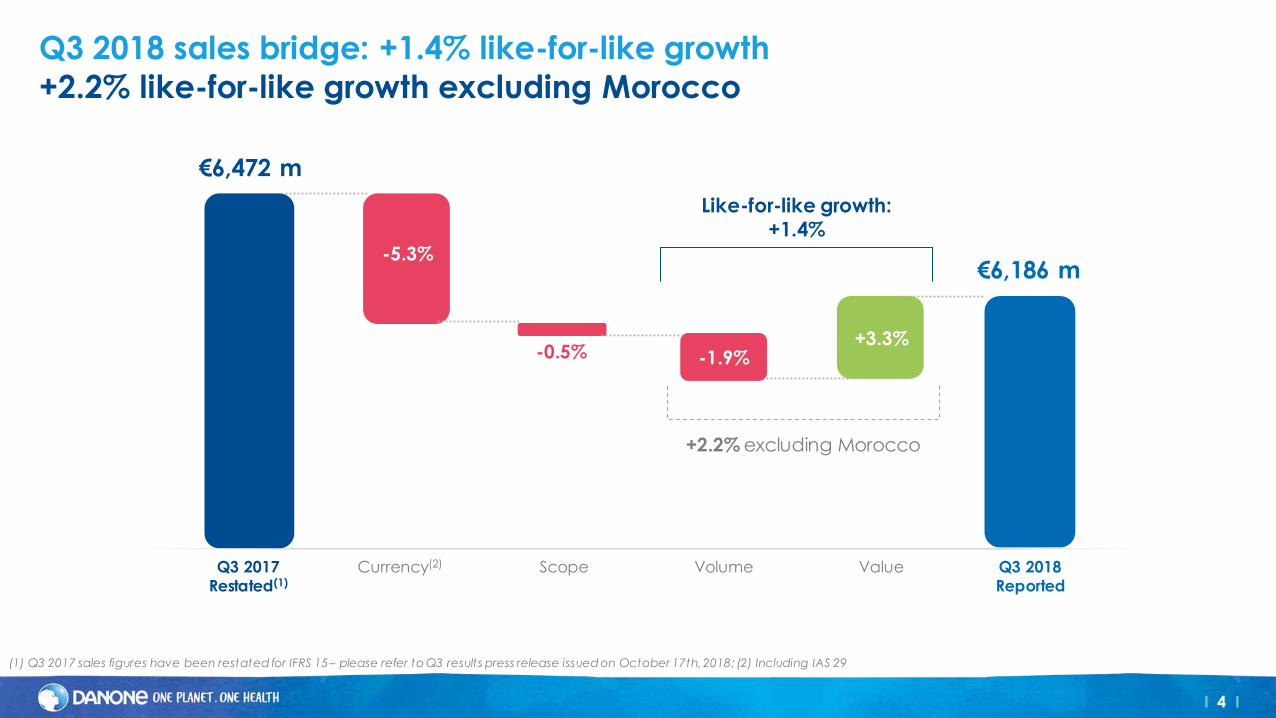
€6,472 m
€6,186 m
+3.3%
Q3 2017Restated(1)
Currency(2) Volume Value Q3 2018Reported
Like-for-like growth:
+1.4%
-0.5%
-5.3%
Q3 2018 sales bridge: +1.4% like-for-like growth
+2.2% like-for-like growth excluding Morocco
(1) Q3 2017 sales figures have been restated for IFRS 15 – please refer to Q3 results press release issued on October 17th, 2018; (2) Including IAS 29
-1.9%
+2.2% excluding Morocco
Scope
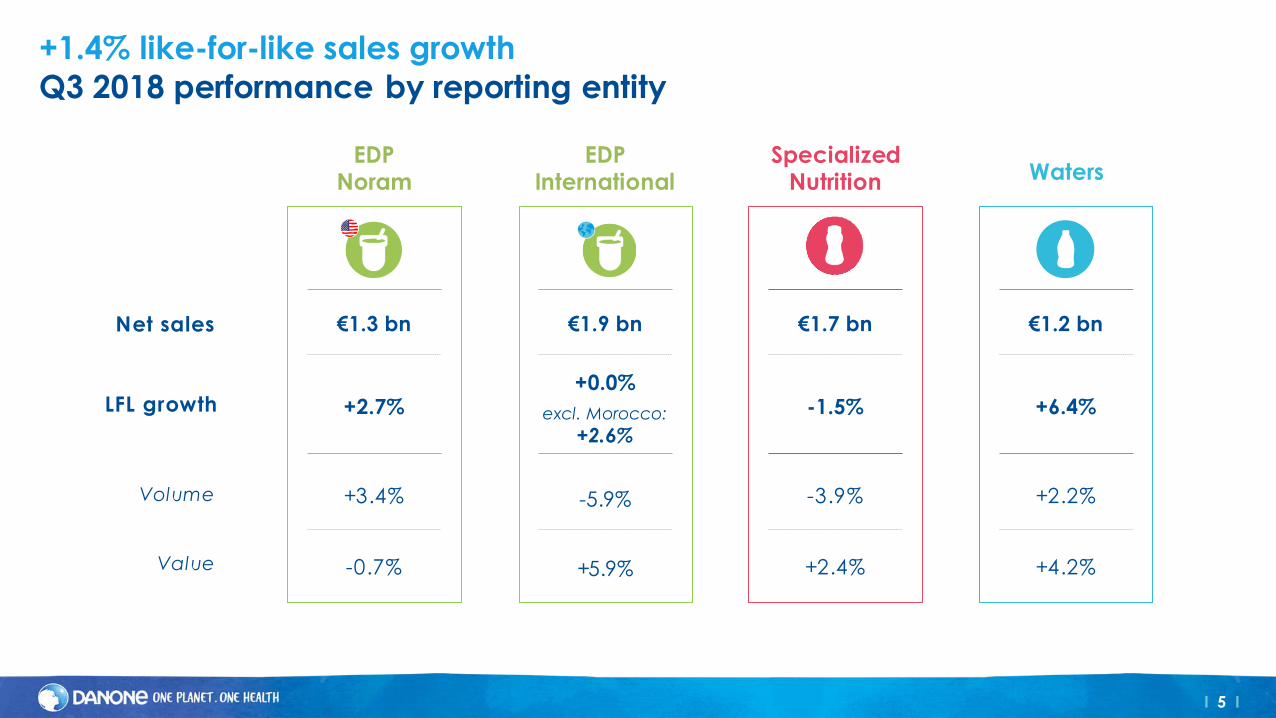
I 5 I
WatersEDP
InternationalEDP
Noram
Volume
Net sales
Value
+2.7%
€1.3 bn
+3.4%
-0.7%
+0.0%
€1.9 bn
-5.9%
+5.9%
+6.4%
€1.2 bn
+2.2%
+4.2%
LFL growth
+1.4% like-for-like sales growth
Q3 2018 performance by reporting entity
excl. Morocco:
+2.6%
SpecializedNutrition
-1.5%
€1.7 bn
-3.9%
+2.4%
I 7 I
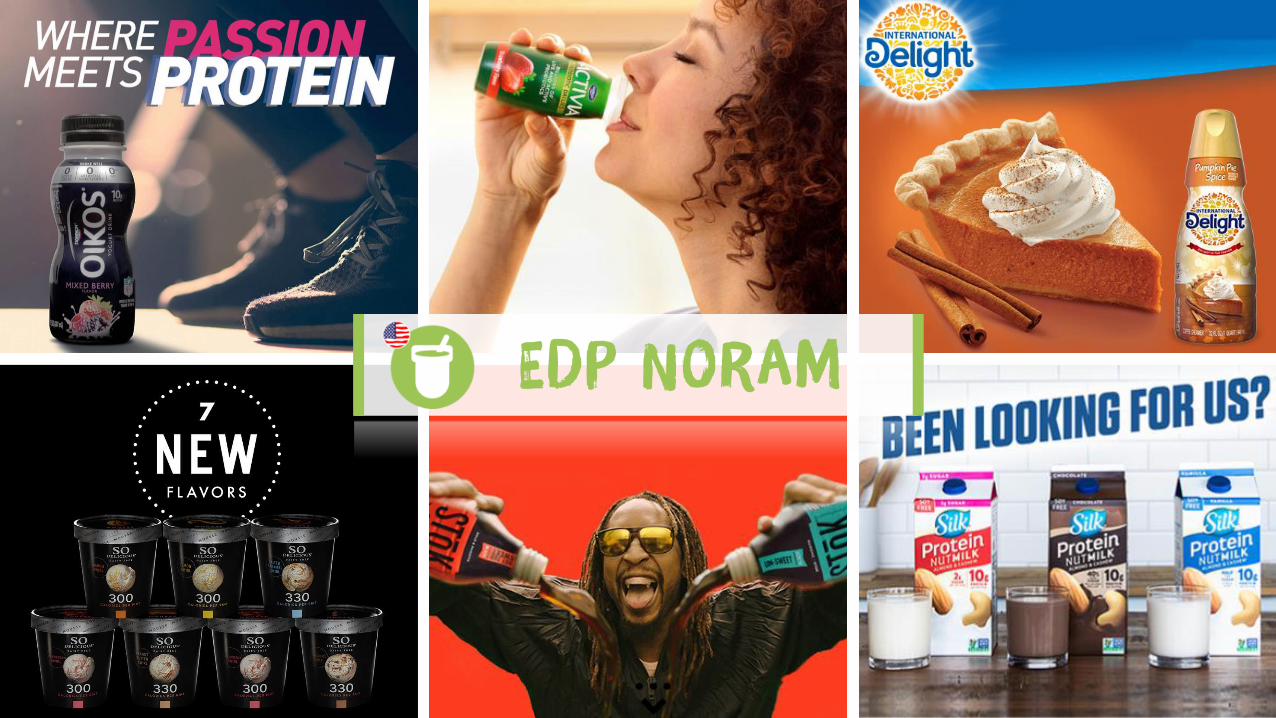
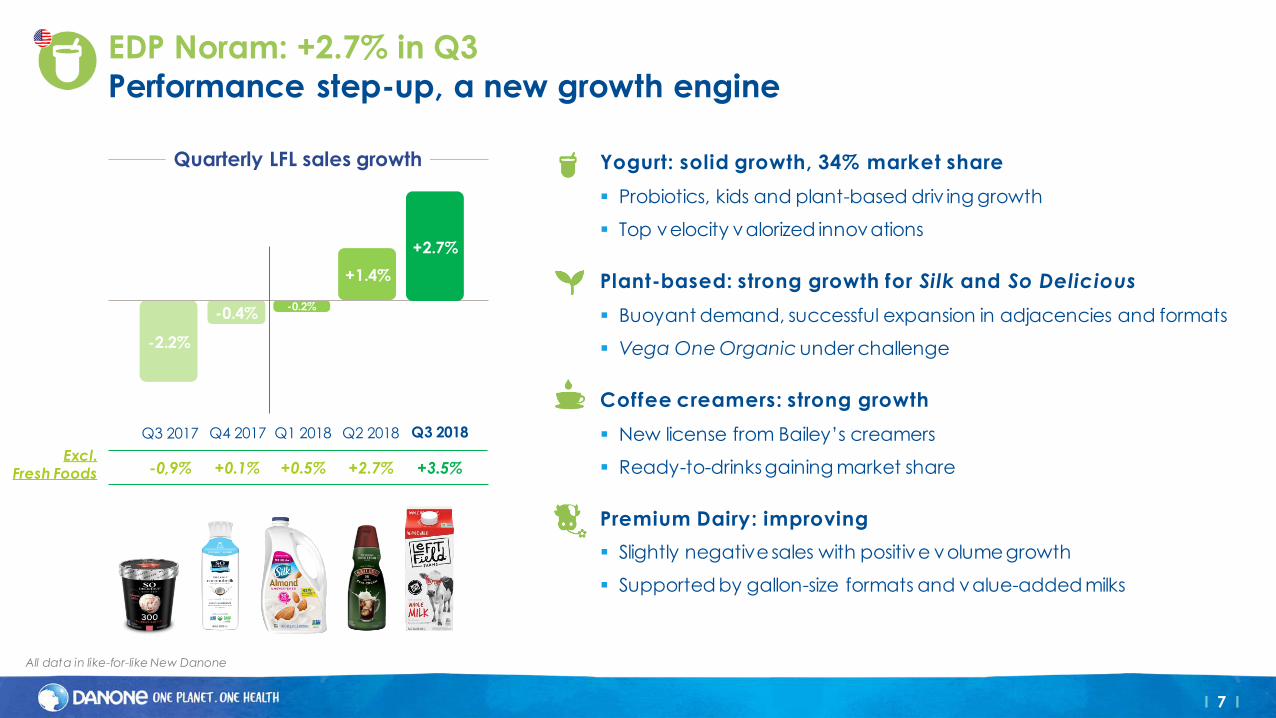
Yogurt: solid growth, 34% market share
▪ Probiotics, kids and plant-based driv ing growth
▪ Top velocity valorized innovations
Plant-based: strong growth for Silk and So Delicious
▪ Buoyant demand, successful expansion in adjacencies and formats
▪ Vega One Organic under challenge
Coffee creamers: strong growth
▪ New license from Bailey’s creamers
▪ Ready-to-drinks gaining market share
Premium Dairy: improving
▪ Slightly negative sales with positive volume growth
▪ Supported by gallon-size formats and value-added milks
EDP Noram: +2.7% in Q3
Performance step-up, a new growth engine
Q4 2017 Q1 2018
-0.4%-0.2%
-2.2%
Q3 2017
+0.5%Excl.
Fresh Foods -0,9% +0.1%
Quarterly LFL sales growth
Q2 2018
+2.7%
+1.4%
+2.7%
Q3 2018
+3.5%
All data in like-for-like New Danone
I 8 I
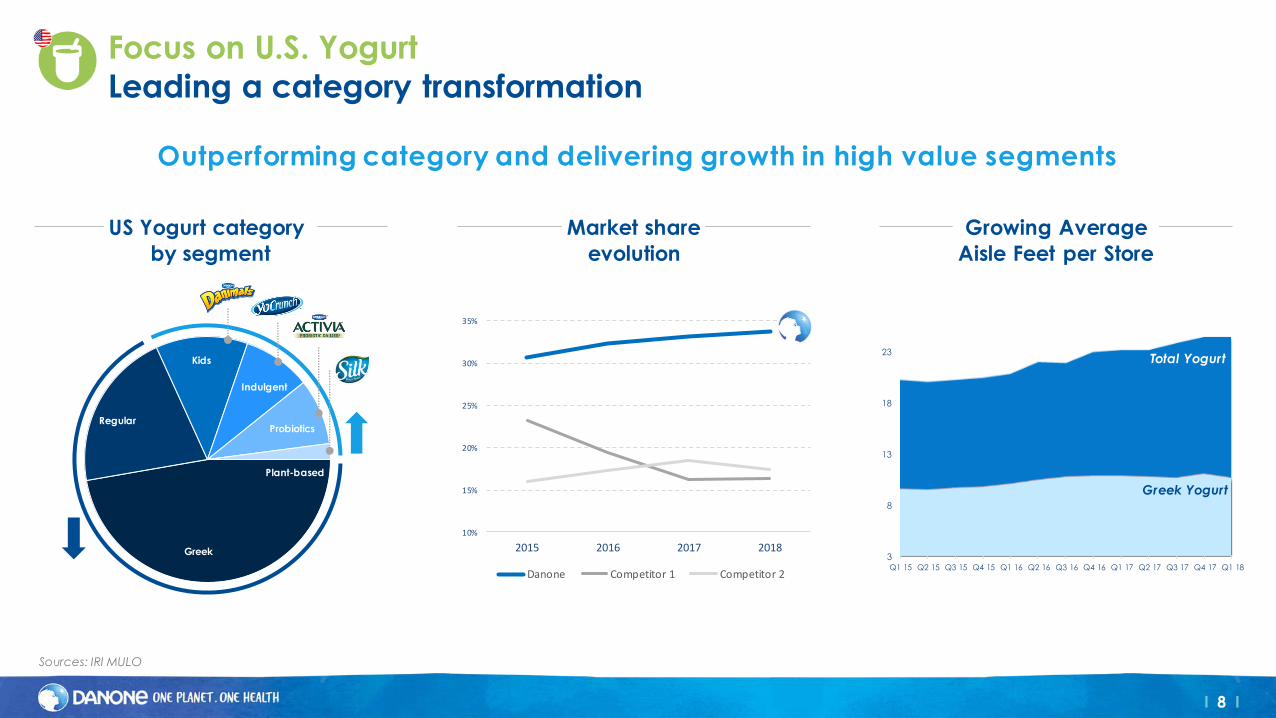
Greek
Regular
Kids
Indulgent
Probiotics
Plant-based
Focus on U.S. Yogurt
Leading a category transformation
US Yogurt category
by segment
10%
15%
20%
25%
30%
35%
2015 2016 2017 2018
Danone Competitor 1 Competitor 2
Market share
evolution
Outperforming category and delivering growth in high value segments
Sources: IRI MULO
3
8
13
18
23
Q1 15 Q2 15 Q3 15 Q4 15 Q1 16 Q2 16 Q3 16 Q4 16 Q1 17 Q2 17 Q3 17 Q4 17 Q1 18
Growing Average
Aisle Feet per Store
Total Yogurt
Greek Yogurt
I 10 I
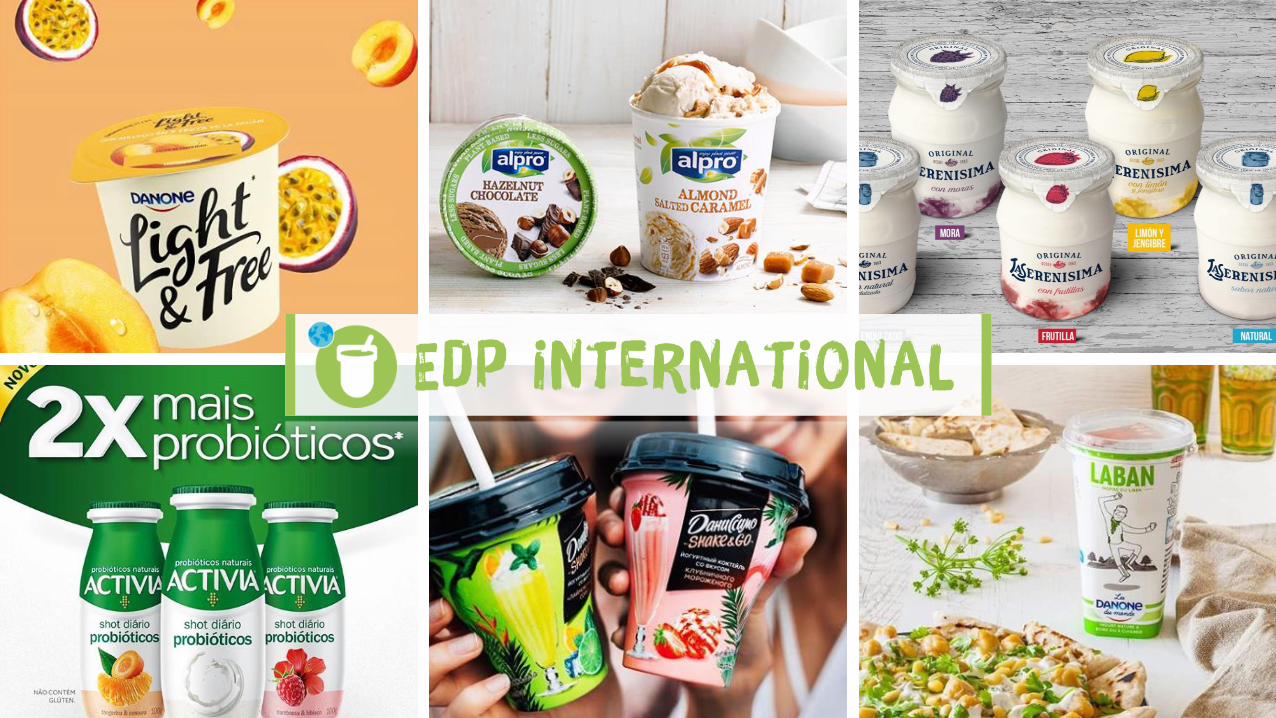
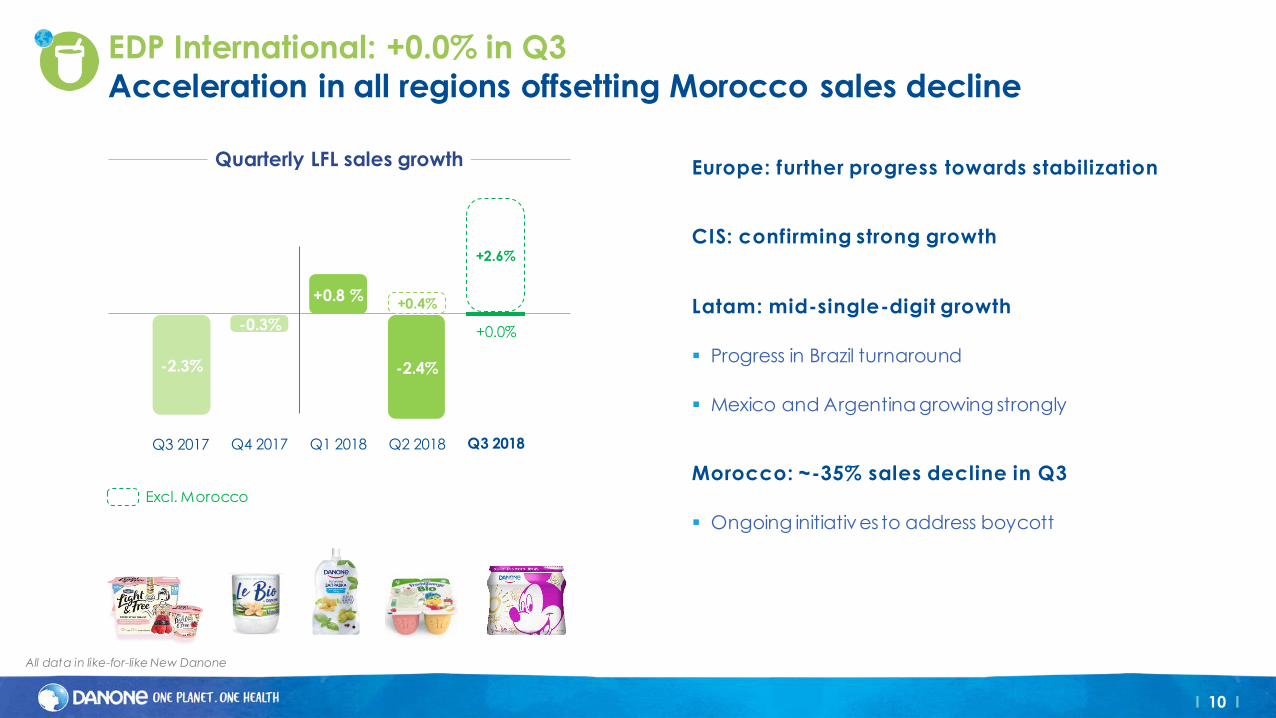
EDP International: +0.0% in Q3
Acceleration in all regions offsetting Morocco sales decline
Europe: further progress towards stabilization
CIS: confirming strong growth
Latam: mid-single-digit growth
▪ Progress in Brazil turnaround
▪ Mexico and Argentina growing strongly
Morocco: ~-35% sales decline in Q3
▪ Ongoing initiatives to address boycott
Excl. Morocco
Quarterly LFL sales growth
-0.3%
+0.8 %
-2.3% -2.4%
+0.4%
+2.6%
+0.0%
Q4 2017 Q1 2018Q3 2017 Q2 2018 Q3 2018
All data in like-for-like New Danone
I 11 I
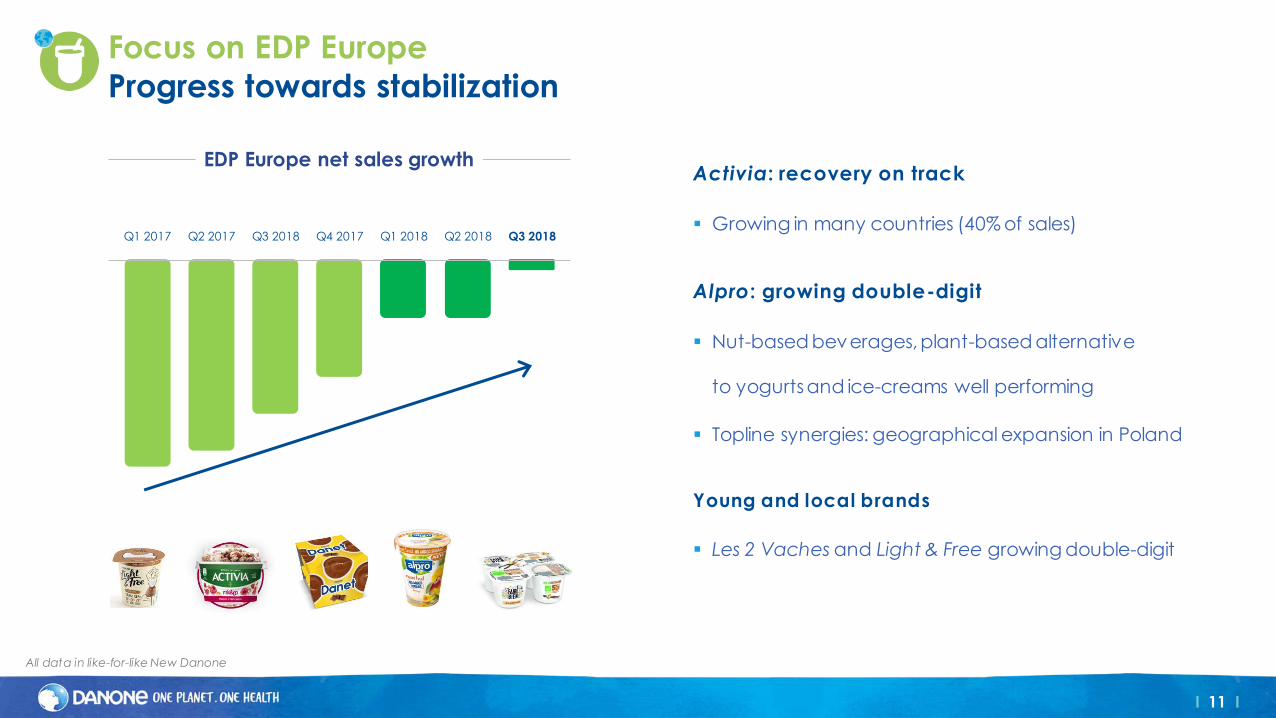
Focus on EDP Europe
Progress towards stabilization
Q2 2017 Q3 2018Q1 2017 Q4 2017 Q2 2018Q1 2018 Q3 2018
Activia: recovery on track
▪ Growing in many countries (40% of sales)
Alpro: growing double-digit
▪ Nut-based beverages, plant-based alternative
to yogurts and ice-creams well performing
▪ Topline synergies: geographical expansion in Poland
Young and local brands
▪ Les 2 Vaches and Light & Free growing double-digit
All data in like-for-like New Danone
EDP Europe net sales growth
I 13 I
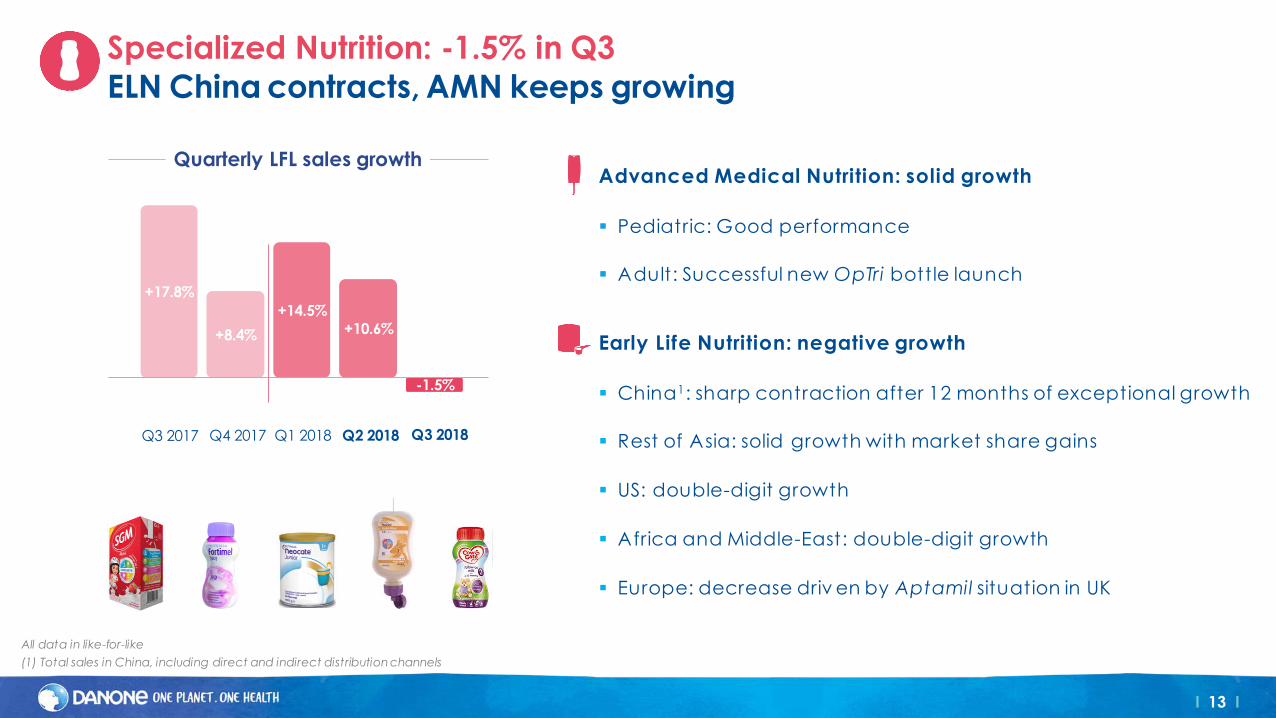
Specialized Nutrition: -1.5% in Q3
ELN China contracts, AMN keeps growing
Advanced Medical Nutrition: solid growth
▪ Pediatric: Good performance
▪ Adult: Successful new OpTri bottle launch
Early Life Nutrition: negative growth
▪ China1: sharp contraction after 12 months of exceptional growth
▪ Rest of Asia: solid growth with market share gains
▪ US: double-digit growth
▪ Africa and Middle-East: double-digit growth
▪ Europe: decrease driv en by Aptamil situation in UK
All data in like-for-like
(1) Total sales in China, including direct and indirect distribution channels
+8.4%
+14.5%
+17.8%
+10.6%
-1.5%
Quarterly LFL sales growth
Q4 2017 Q1 2018Q3 2017 Q2 2018 Q3 2018
I 14 I
0
50
100
150
200
250
300
350
400
450
500
Q3 16 Q3 17 Q3 18
Sale
s (€
mill
ion
)
Direct Indirect
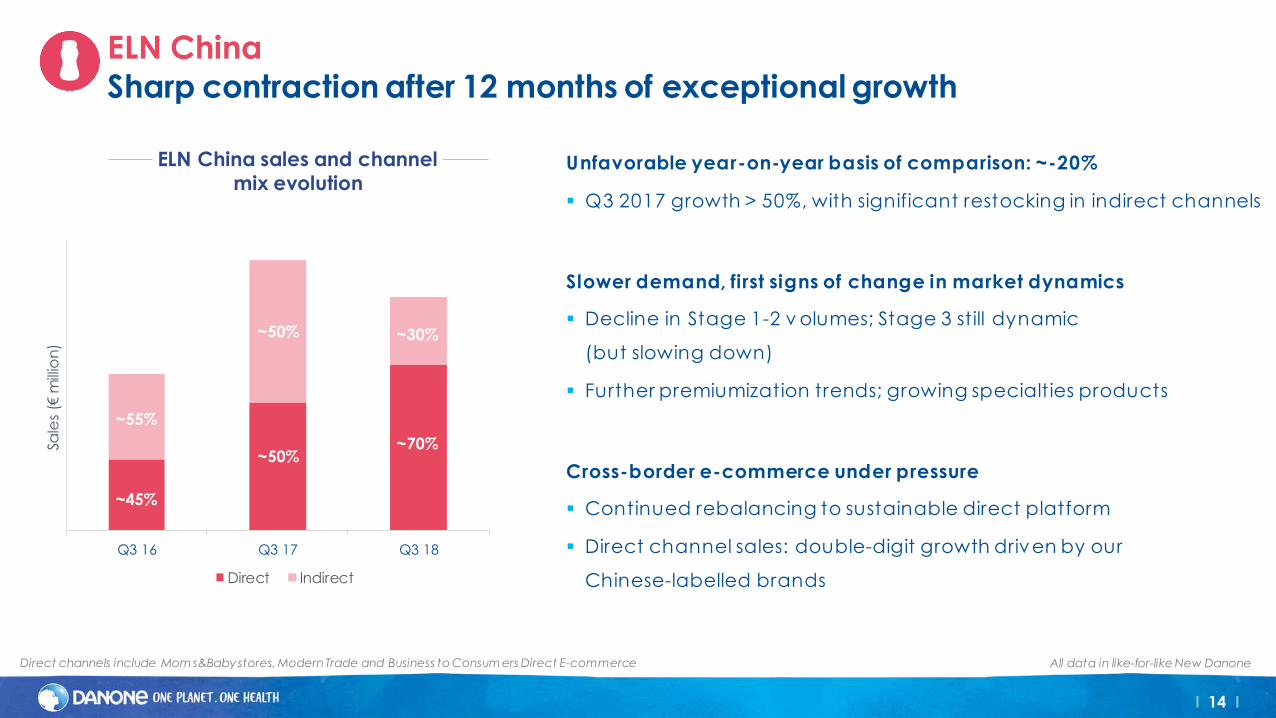
ELN China
Sharp contraction after 12 months of exceptional growth
Unfavorable year-on-year basis of comparison: ~-20%
▪ Q3 2017 growth > 50%, with significant restocking in indirect channels
Slower demand, first signs of change in market dynamics
▪ Decline in Stage 1-2 v olumes; Stage 3 still dynamic
(but slowing down)
▪ Further premiumization trends; growing specialties products
Cross-border e-commerce under pressure
▪ Continued rebalancing to sustainable direct platform
▪ Direct channel sales: double-digit growth driven by our
Chinese-labelled brands
~30%
~70%
~50%
~50%
~55%
~45%
Direct channels include Mom s&Babystores, Modern Trade and Business to Consum ers Direct E-commerce All data in like-for-like New Danone
ELN China sales and channel
mix evolution
I 15 I
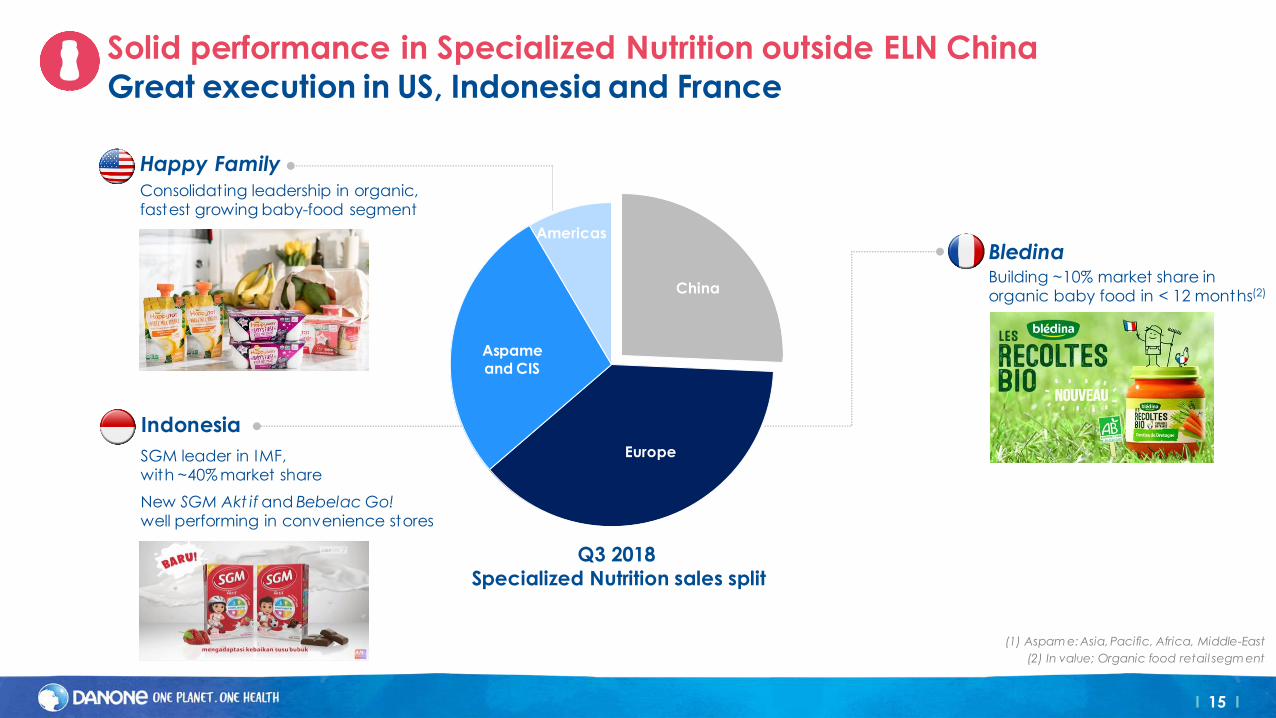
China
Europe
Aspame
and CIS
Americas
Solid performance in Specialized Nutrition outside ELN China
Great execution in US, Indonesia and France
SGM leader in IMF,with ~40% market share
New SGM Akt if and Bebelac Go! well performing in convenience stores
Consolidating leadership in organic, fastest growing baby-food segment
(1) Aspam e: Asia, Pacific, Africa, Middle-East
(2) In value; Organic food retail segm ent
Q3 2018
Specialized Nutrition sales split
Happy Family
Indonesia
Building ~10% market share in organic baby food in < 12 months(2)
Bledina
I 17 I
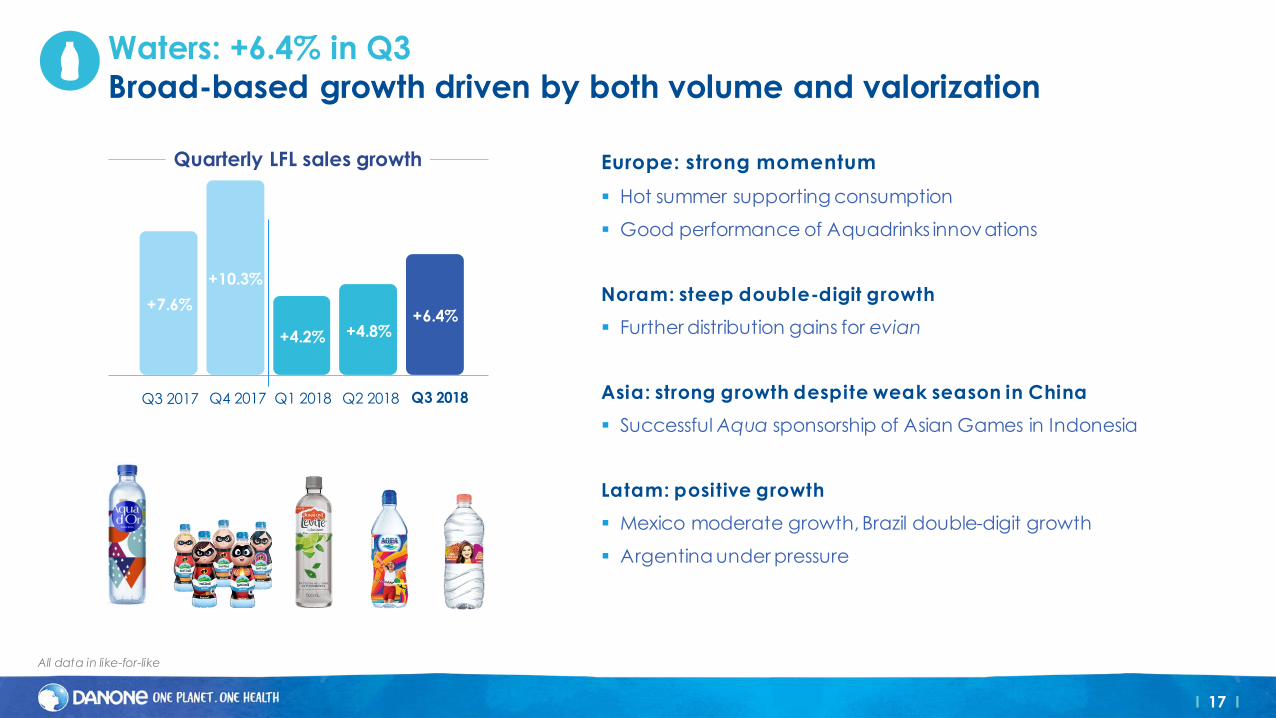
Europe: strong momentum
▪ Hot summer supporting consumption
▪ Good performance of Aquadrinks innovations
Noram: steep double-digit growth
▪ Further distribution gains for evian
Asia: strong growth despite weak season in China
▪ Successful Aqua sponsorship of Asian Games in Indonesia
Latam: positive growth
▪ Mexico moderate growth, Brazil double-digit growth
▪ Argentina under pressure
Waters: +6.4% in Q3
Broad-based growth driven by both volume and valorization
All data in like-for-like
+10.3%
+4.2%
+7.6%
+4.8%+6.4%
Quarterly LFL sales growth
Q4 2017 Q1 2018Q3 2017 Q2 2018 Q3 2018
I 18 I
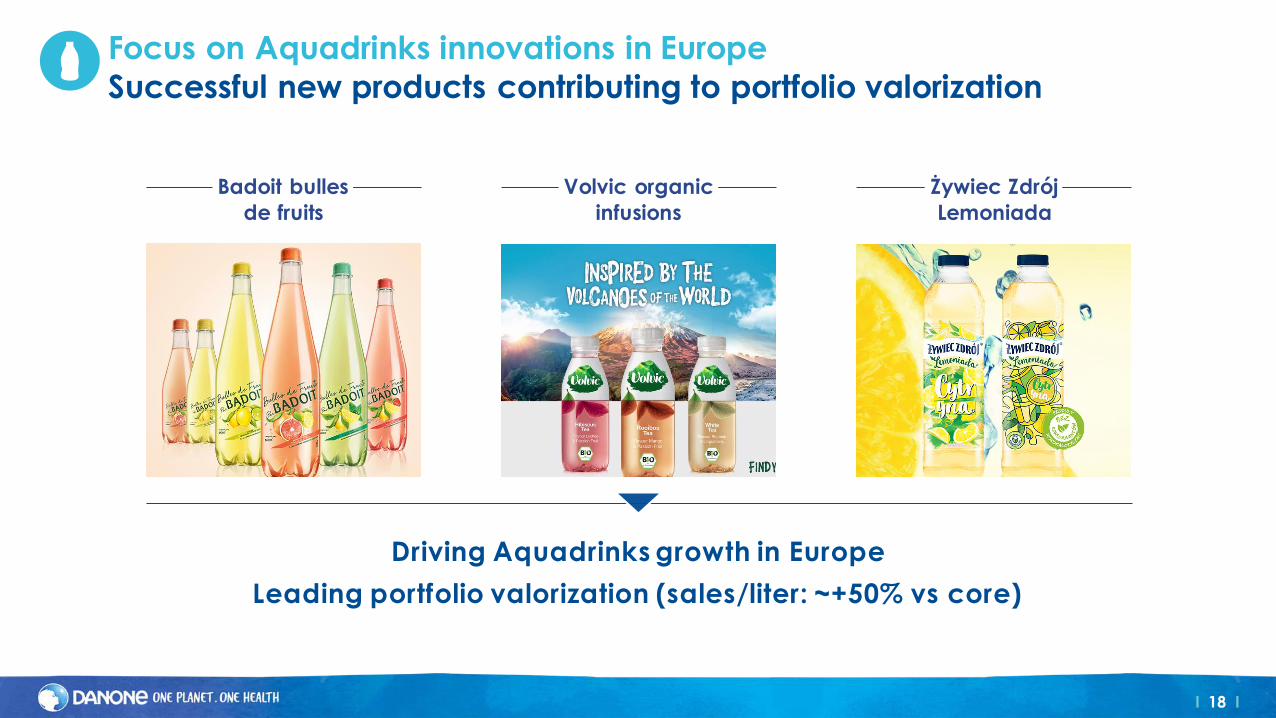
Focus on Aquadrinks innovations in Europe
Successful new products contributing to portfolio valorization
Driving Aquadrinks growth in Europe
Leading portfolio valorization (sales/liter: ~+50% vs core)
Badoit bulles
de fruits
Volvic organic
infusions
Żywiec Zdrój
Lemoniada
I 19 I
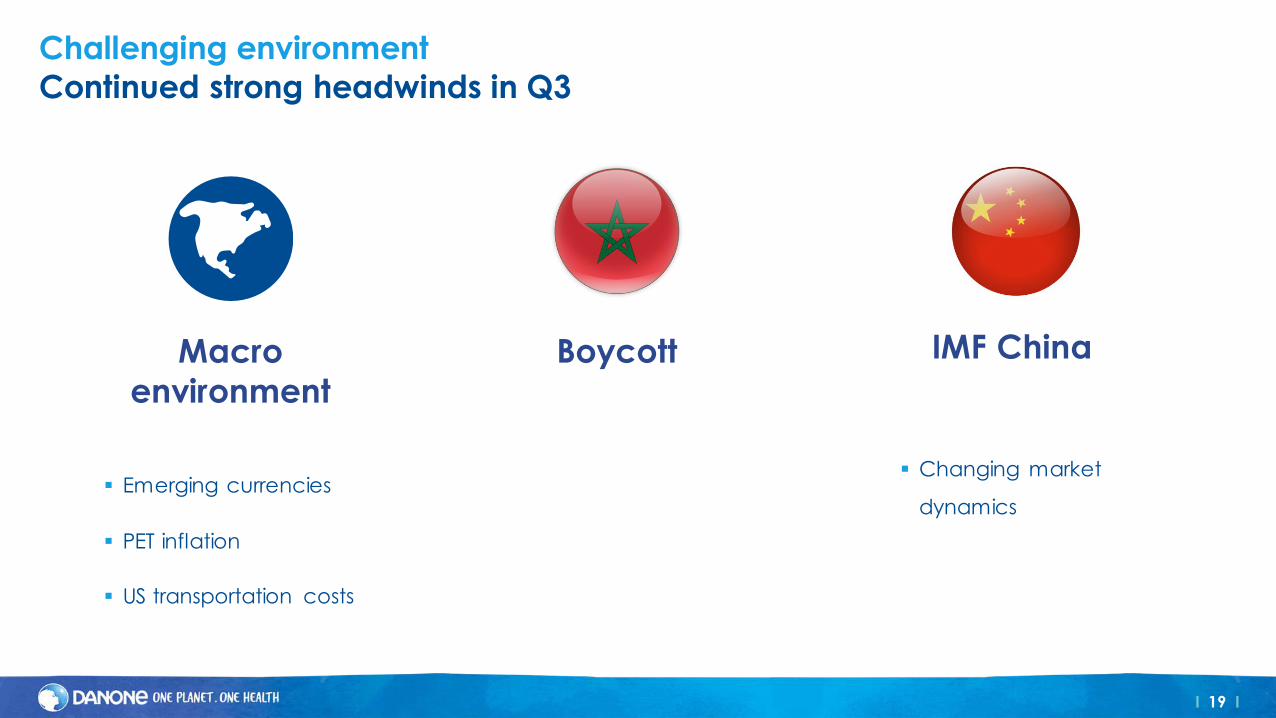
Challenging environment
Continued strong headwinds in Q3
Macro
environment
Boycott IMF China
▪ Emerging currencies
▪ PET inflation
▪ US transportation costs
▪ Changing market
dynamics
I 20 I
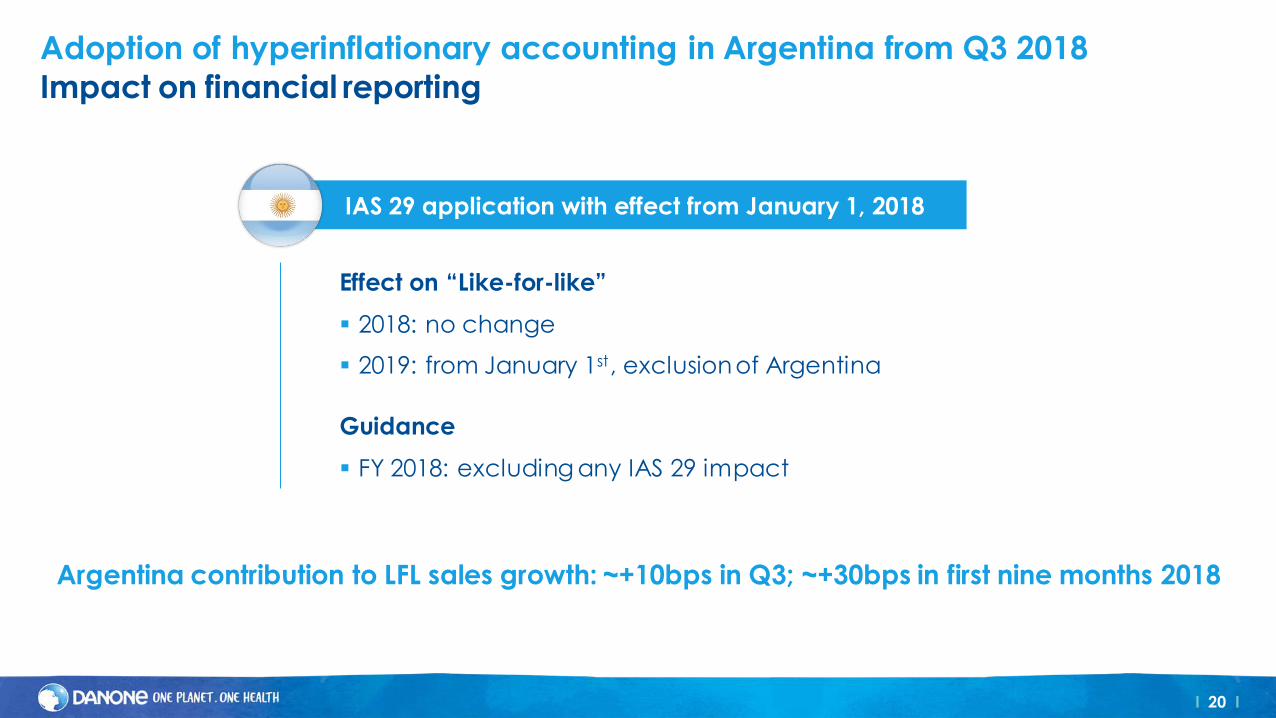
Adoption of hyperinflationary accounting in Argentina from Q3 2018
Impact on financial reporting
Effect on “Like-for-like”
▪ 2018: no change
▪ 2019: from January 1st, exclusion of Argentina
Guidance
▪ FY 2018: excluding any IAS 29 impact
IAS 29 application with effect from January 1, 2018
Argentina contribution to LFL sales growth: ~+10bps in Q3; ~+30bps in first nine months 2018
I 21 I
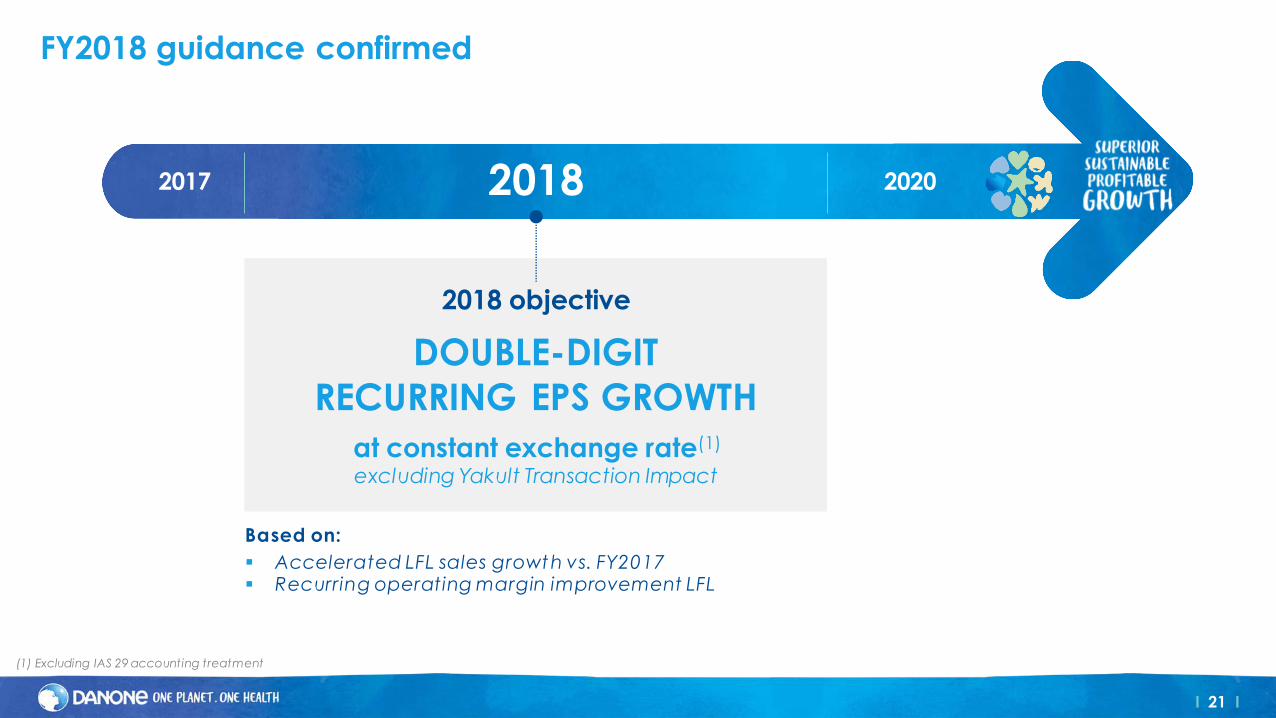
20202017 2018
FY2018 guidance confirmed
2018 objective
DOUBLE-DIGIT
RECURRING EPS GROWTH
at constant exchange rate(1)
excluding Yakult Transaction Impact
Based on:
▪ Accelerated LFL sales growth vs. FY2017▪ Recurring operating margin improvement LFL
(1) Excluding IAS 29 accounting treatment

Appendix
I 23 I
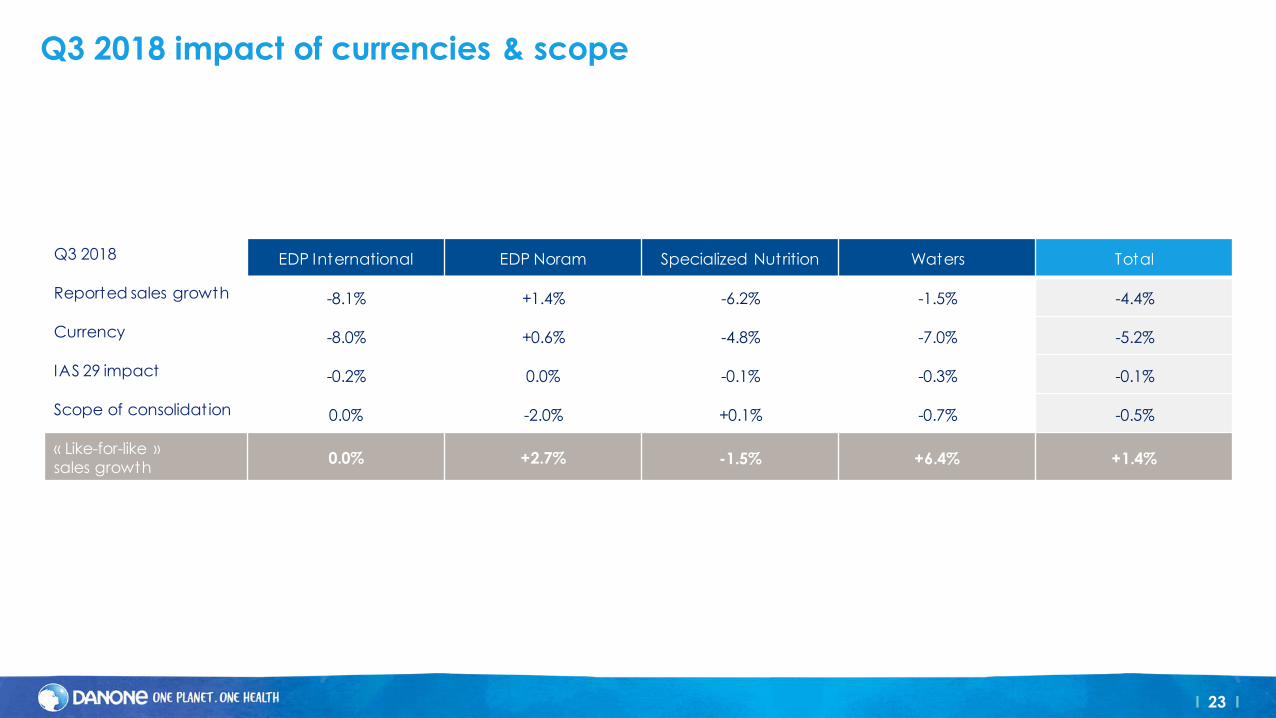
Q3 2018 impact of currencies & scope
Q3 2018 EDP International EDP Noram Specialized Nutrition Waters Total
Reported sales growth -8.1% +1.4% -6.2% -1.5% -4.4%
Currency -8.0% +0.6% -4.8% -7.0% -5.2%
IAS 29 impact -0.2% 0.0% -0.1% -0.3% -0.1%
Scope of consolidation 0.0% -2.0% +0.1% -0.7% -0.5%
« Like-for-like » sales growth
0.0% +2.7% -1.5% +6.4% +1.4%
I 24 I
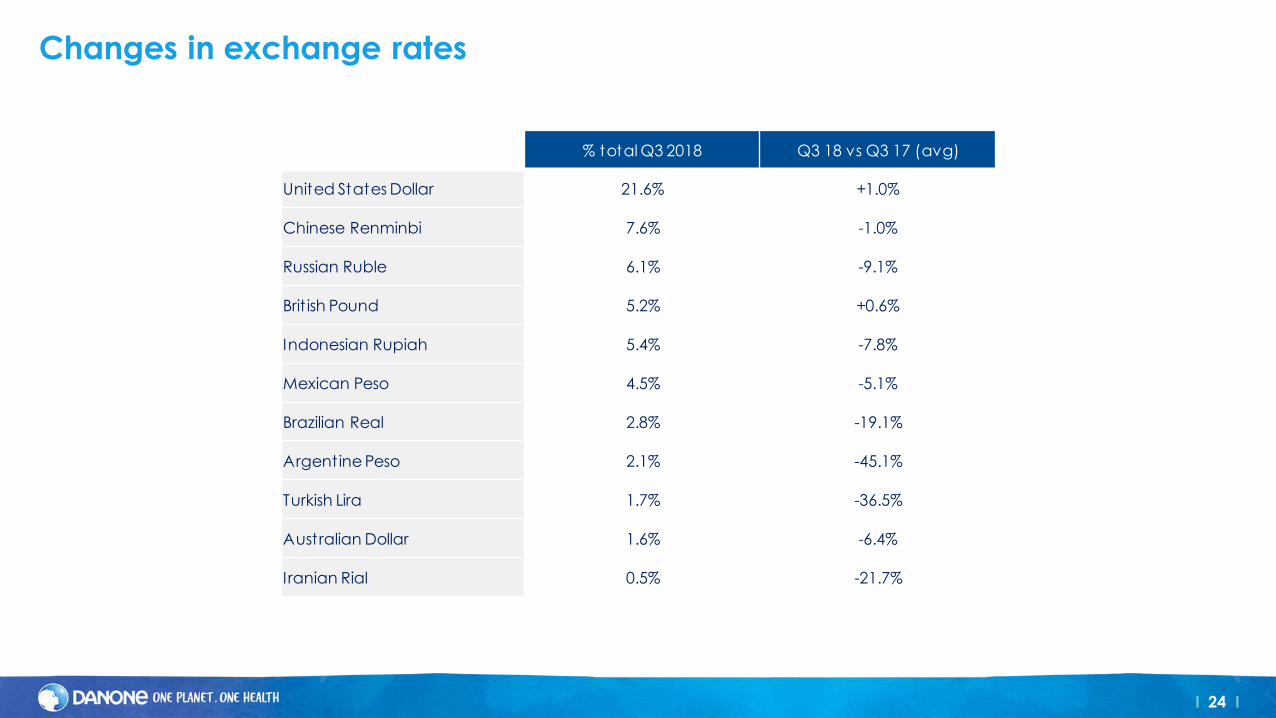
Changes in exchange rates
% total Q3 2018 Q3 18 vs Q3 17 (avg)
United States Dollar 21.6% +1.0%
Chinese Renminbi 7.6% -1.0%
Russian Ruble 6.1% -9.1%
Brit ish Pound 5.2% +0.6%
Indonesian Rupiah 5.4% -7.8%
Mexican Peso 4.5% -5.1%
Brazilian Real 2.8% -19.1%
Argentine Peso 2.1% -45.1%
Turkish Lira 1.7% -36.5%
Australian Dollar 1.6% -6.4%
I ranian Rial 0.5% -21.7%