dairy policy issues 2012 farm bill
TRANSCRIPT
Dairy Policy Issuesfor the
2012 Farm Bill
Dairy Policy Analysis Alliance

Introduction. . . . . . . . . . . . . . . . . . . . . . . . . . . . . . . . . . . . . . . . . . . . . . 1
Dairy Price Supports . . . . . . . . . . . . . . . . . . . . . . . . . . . . . . . . . . . . . . . 3
Milk Income Loss Contract (MILC) Program . . . . . . . . . . . . . . . . . . . 9
Voluntary Supply Management. . . . . . . . . . . . . . . . . . . . . . . . . . . . . . . 16
Mandatory Milk Supply Management . . . . . . . . . . . . . . . . . . . . . . . . . 22
Federal Milk Marketing Orders . . . . . . . . . . . . . . . . . . . . . . . . . . . . . . 25
U.S. Dairy Trade Policy . . . . . . . . . . . . . . . . . . . . . . . . . . . . . . . . . . . . 44
Table of Contents
Dairy Policy Issues for the 2012 Farm BillDairy Policy Analysis Alliance

Introduction
DAIRY POLICY ISSUES 1
Since the last farm bill (the Food, Conservation and Energy Act of 2008) was enacted in May 2008,the U.S. dairy industry has experienced major upheaval. The U.S. all-milk price in May 2008 was$18.30/hundredweight; a year later it was $11.60. Given high feed costs, this price was below the cashcosts of producing milk for most, if not all, dairies in the United States. Moreover, the 37 percent fall-off in the milk price was indicative of the enormous increase in price volatility observed over the last15 years, putting milk prices and dairy profitability on a more-or-less constant roller coaster ride thatnearly all dairy market participants would like to see end.
Discussions about the dairy title of the next farm bill have already begun in Washington, DC, with thisbackdrop of intensified concern among producers about the level and volatility of milk prices. Alsorelevant to these discussions are anticipated federal spending constraints in the face of record budgetdeficits and the growing global presence of dairy companies located in the U.S. In addition to propos-ing alterations in existing federal dairy programs (including federal milk marketing orders, which arenot usually part of farm bill discussions), dairy groups are looking at brand new federal programs andprivate initiatives to stabilize milk prices and provide a more effective price floor.
This report is intended to help sort through the myriad of dairy policy alternatives that will likely beconsidered as the next farm bill process evolves. We provide a description of existing and potentialprograms and policies that attempt to stabilize or support milk prices and identify issues relating totheir current and future deployment.
In brief:
Dairy price supports have been a fixture of federal dairy policy for more than 60 years. The ability ofprice supports to maintain an effective price floor diminished as the support price was lowered and asdairy product manufacturers became increasingly reluctant to sell product to the government. In somecases, price supports have impeded U.S. dairy exports, distorted domestic markets, and constraineddairy product innovation.
The federal Milk Income Loss Contract (MILC) program is relatively new, and provides income sup-port rather than price support. MILC has supported dairy farmers’ incomes, but size-based limits onpayments have generated strong opposition from regions with predominantly larger herds.
Voluntary supply management, which offers a carrot to producers willing to cut milk production intimes of surplus, has been used only sparingly as a part of federal dairy policy. The CooperativesWorking Together (CWT) herd retirement program is a new approach that is privately funded throughvoluntary producer assessments. CWT has achieved success, but because assessments are not manda-tory, there are issues related to free riders and the adequacy of funding.
Mandatory supply control uses a stick instead of a carrot to manage milk supplies, assessing penaltieson producers who exceed assigned production quotas or bases. Mandatory supply control is attractivefrom a budgetary perspective because the milk price can be enhanced without payments to dairy farm-ers. But quotas and bases inevitably take on value that raises production costs for new entrants orfarmers expanding their dairy herds and they can prevent efficient structural change and regional shiftsin milk production.
Federal and state milk marketing orders have regulated minimum milk prices since the 1930s. Mar-keting orders are complex instruments that can significantly affect milk allocation and milk productiondecisions. Orders use classified pricing and pooling to achieve their stated purpose of promoting or-derly marketing. Pricing issues relate to the appropriate number of classes and how to set minimummilk prices for manufacturing milk and price differentials for milk used for fluid products. Pooling is-
2 DAIRY POLICY ISSUES
sues include which dairy plants should be allowed to pool and how to promote equitable and effi-cient inter-order movement of milk.
Finally, U.S. dairy trade policy does not directly affect milk prices in the same way as marketingorders or the MILC program, but trade policy does influence the competitive environment for U.S.exports and imports of dairy products. Greater exposure to world markets has brought an addedelement of milk price instability to U.S. dairy markets. At the same time, foreign demand for dairyproducts is expanding more rapidly than U.S. demand, offering an opportunity for acceleratedgrowth in U.S. milk production.
This report was authored by members of the FAPRI-UW Dairy Policy Analysis Alliance. It servesas a companion to a related Alliance report titled, Dairy Policy Briefs, which consists of one-pagesummaries of the material covered here.
The Alliance is a cooperative dairy policy research and outreach program between the Food andAgricultural Policy Research Institute at the University of Missouri and the Department of Agri-cultural and Applied Economics at the University of Wisconsin-Madison.
Alliance documents and other resources can be accessed and downloaded at either of the followingwebsites:
FAPRI site: (http://www.fapri.missouri.edu/)University of Wisconsin Understanding Dairy Markets site: (http://www.aae.wisc.edu/future/).
If you would like additional information, please contact FAPRI or UW-Madison Alliance affiliatesat the following phone numbers or email addresses:
Scott Brown (573)882-3861 [email protected]
Bob Cropp (608)262-9483 [email protected]
Brian W. Gould (608)263-3212 [email protected]
Ed Jesse (608)262-6348 [email protected]
Published by the Food and Agricultural Policy Research Institute (FAPRI), University of Missouri-Columbia,101 Park DeVille Drive, Suite E, Columbia, MO 65203, and the Department of Agricultural and Applied Eco-nomics, University of Wisconsin-Madison, Taylor Hall, 427 Lorch Street, Madison, WI 53706, April 2010.
Material in this publication is based upon work supported by the Cooperative State Research, Education andExtension Service, U.S. Department of Agriculture, under Agreement No. 2009-34149-19825.
Any opinions, findings, conclusions, or recommendations expressed in this publication are those of the authorsand do not necessarily reflect the view of the U.S. Department of Agriculture.
Permission is granted to reproduce this information with appropriate attribution to the authors, the University ofWisconsin-Madison and the Food and Agricultural Policy Research Institute, University of Missouri-Columbia.
April 2010

DAIRY POLICY ISSUES 3
Price supports for milk and dairy products used inthe United States represent a market interventionprogram. The government offers to purchase non-perishable dairy products (cheese, butter and nonfatdry milk) from manufacturers at specified (interven-tion) prices. The program is dormant when marketprices are above intervention prices. It is activatedwhen the supply of products exceeds demand at theintervention prices, preventing market prices fromdropping to levels that would otherwise be necessaryto clear the excess supply.
Dairy price supports have been amended over time,mainly to alter the way that the support price formilk is determined and how corresponding productprices are set and changed. Amajor change imple-mented with passage of the 2008 Farm Bill elimi-nated reference to supporting a milk price. Now,purchase prices for cheese, butter and nonfat drymilk are specified, but there is no longer a minimummilk price target.
Public policy issues and concerns relating to dairyprice supports include:
• Effectiveness in establishing a realistic price floor• Distortion in allocation of milk and relative productprices
• Impact on U.S. dairy trade
Historical ReviewPrice supports for milk and dairy products have beenused continuously in the United States since passageof the Agricultural Act of 1949. That Act required theSecretary of Agriculture to support the price receivedby dairy farmers for manufacturing use milk at be-tween 75 percent and 90 percent of parity. The Secre-tary determined the specific parity level within thisrange by forecasting the adequacy of future milk pro-duction in fulfilling market needs. Parity attemptedto keep the same relationship between milk pricesand farm costs as existed in the period 1910-14. Theparity formula used the Index of Prices Paid by farm-ers to adjust the parity price for milk.
Using assumed yields and manufacturing costs, thesupport price for manufacturing use milk was trans-lated into prices per pound for three “hard” (i.e., non-perishable) manufactured dairy products—cheddarcheese, butter and nonfat dry milk—and USDA’s
Commodity Credit Corporation (CCC) stood readyto purchase unlimited quantities of these dairy prod-ucts at the announced prices. Reasonably efficientplants making and selling cheese, butter and nonfatdry milk at the purchase prices would, in theory,have enough money to pay farmers the announcedsupport price for milk. And competition amongplants would force those plants manufacturing otherdairy products to also pay the support price or risklosing their milk supply.
As long as milk supply and demand were in balanceand market prices stayed above CCC purchaseprices, the support program was inactive. But duringperiods of surplus milk production, milk in excess offluid and fresh product needs would increasingly bediverted to plants making nonperishable products.Larger supplies of cheese, butter and nonfat dry milkwould lower their market prices, triggering govern-ment sales if and when market prices fell below CCCpurchase prices.
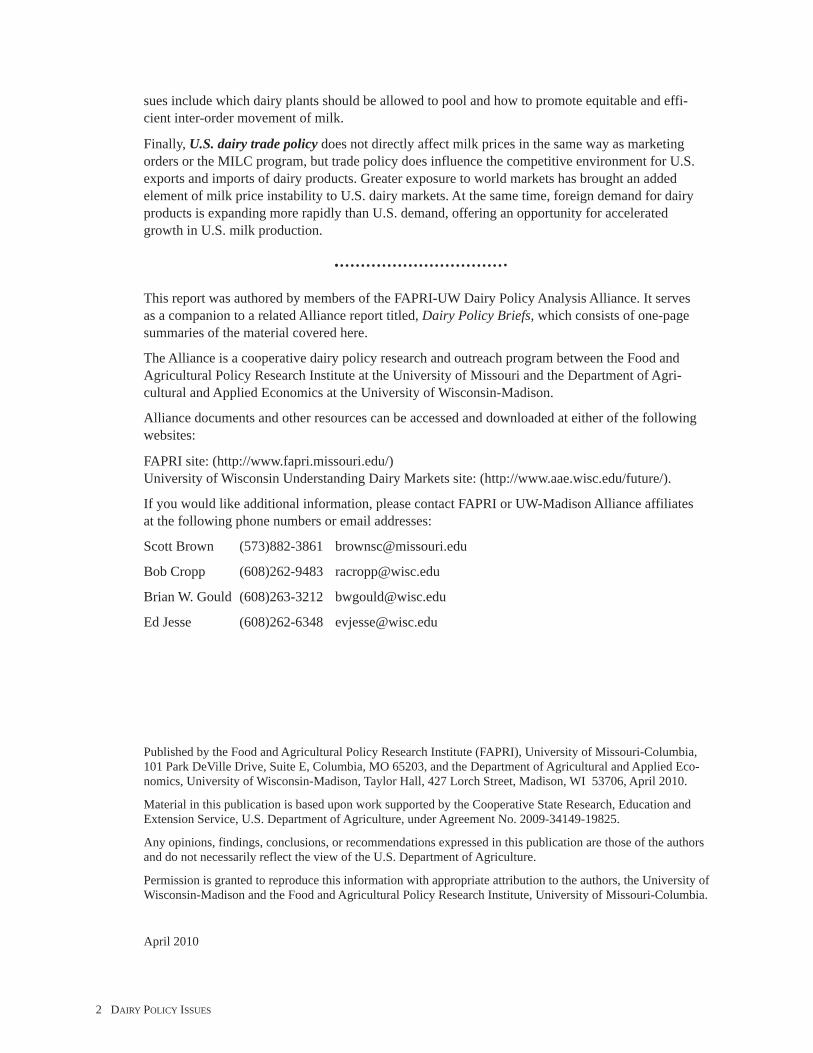
The 1949 Agricultural Act has been amended manytimes, most commonly through omnibus farm bills.A critical amendment that proved very disruptive andcostly was in the 1973 Agricultural and ConsumerProtection Act, which raised the minimum supportlevel from 75 percent to 80 percent of parity. Thesubsequent farm bill (the Food and Agriculture Actof 1977) continued the minimum support level of 80percent of parity through April 1, 1981 and requiredthat the support price be adjusted semi-annually(October 1 and April 1) to reflect changes in theparity formula.
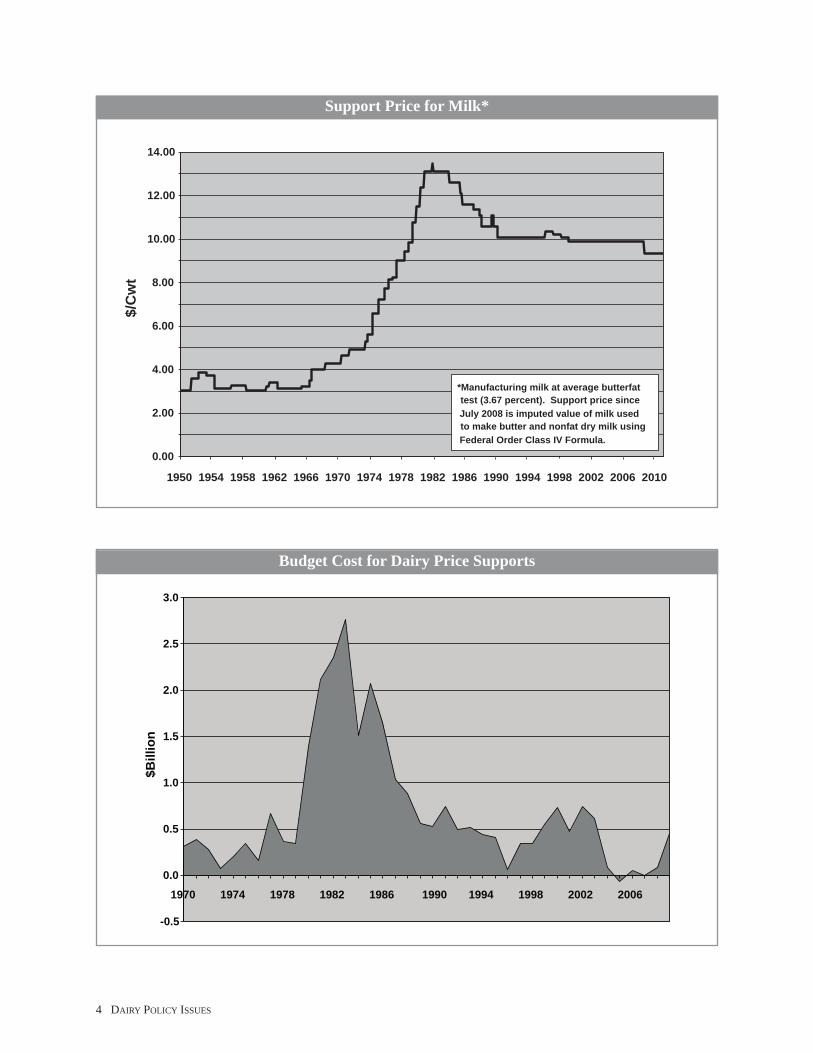
High rates of inflation during the 1970s—plus thefact that the parity formula ignored changes in pro-ductivity at the farm—resulted in the support priceincreasing from $4.28 per hundredweight on October1, 1970, to $13.10 per hundredweight on October1,1980 (see figure)1. Dairy farmers responded torapidly-increasing support prices by increasing milkproduction far beyond commercial use. Surplus dairyproducts purchased by the CCC under the supportprogram approached the equivalent of 10 percent ofall farm milk marketed and associated governmentcosts reached $2.7 billion in 1983 (see figures onfollowing page.)
Dairy Price Supports
0.00
2.00
4.00
6.00
8.00
10.00
12.00
14.00
$/C
wt
*Manufacturing milk at average butterfattest (3.67 percent). Support price sinceJuly 2008 is imputed value of milk usedto make butter and nonfat dry milk usingFederal Order Class IV Formula.
1950 1954 1958 1962 1966 1970 1974 1978 1982 1986 1990 1994 1998 2002 2006 2010
-0.5
0.0
0.5
1.0
1.5
2.0
2.5
3.0
$Bill
ion
1970 1974 1978 1982 1986 1990 1994 1998 2002 2006
4 DAIRY POLICY ISSUES
Support Price for Milk*
Budget Cost for Dairy Price Supports
This unprecedented surplus situation resulted inmajor changes in the support program. The Agricul-ture and Food Act of 1981 removed the milk supportprice from parity, instead tying it to the level of CCCpurchases and associated net government costs of theprogram. Under this and subsequent amendments,the support price was gradually ratcheted down to$9.90 per hundredweight.
The Food, Agriculture, Conversation and Trade Actof 1990 required termination of the program on De-cember 31,1999. Subsequent legislation extended theprogram until May 2002, when the Farm Securityand Rural Investment Act of 2002 reinstated theprice program through 2007 at the $9.90 per hun-dredweight support level then in effect.
The Current Price Support ProgramThe 2008 Food, Conservation and Energy Act madeanother major change in the federal dairy price sup-port program. What was the Milk Price Support Pro-gram was renamed the Dairy Product Price SupportProgram. USDA still commits to purchasing cheddarcheese, butter and nonfat dry milk, but the CCC pur-chase prices for these products are no longer linked
to a specified support price per hundredweight ofmanufacturing milk.
The CCC purchase prices specified in current legisla-tion are: butter–$1.05 per pound; block cheddarcheese–$1.13 per pound; barrel cheddar cheese–$1.10 per pound; and nonfat dry milk–$0.80 perpound. These prices are the same as what werelinked to the $9.90 milk support price in previouslegislation. When the current purchase prices areinserted into federal milk marketing order formulasused for calculating minimum prices for milk usedfor cheese (Class III) and butter and nonfat dry milk(Class IV), they yield milk prices of $9.50 and $9.33per hundredweight, respectively.2
Under current law, purchase prices may be reduced ifCCC net removals of product exceed specified levelsfor 12 consecutive months.3 These trigger inventorylevels are large compared to recent net removals andare not expected to alter purchase prices during thelife of the 2008 Act (expires December 2012).
Commodities purchased by CCC can be re-sold atmarket prices prevailing at the time of sale as long asmarket prices are at least 110 percent of the purchaseprice at the time the commodity was acquired. Sales
-100
0
100
200
300
400
500
600
700
800
900
1000
1100
1970
1972
1974
1976
1978
1980
1982
1984
1986
1988
1990
1992
1994
1996
1998
2000
2002
2004
2006
2008
1,00
0to
ns
Cheese
Butter
Nonfat Dry Milk
DAIRY POLICY ISSUES 5
Government Purchases of Dairy Products

back into commercial markets are called unrestrictedsales.
Besides making unrestricted sales when marketprices warrant, the CCC makes surplus dairy prod-ucts available for use in several domestic and foreignfood programs. Most of these special programs onlyprovide dairy products on an “as available” basis;that is, donations are made only if there are stocksavailable to donate. The CCC has also held fire salesof nonfat dry milk for cattle feed and for manufactur-ing milk protein concentrate when stocks were espe-cially burdensome.
While the change from supporting a milk price tosupporting prices for dairy products may seem sub-tle, it could have significant implications for U.S.conformance with World Trade Organization (WTO)rules. Even though there were few CCC purchases ofsurplus dairy products between 2004 and 2007, theWTO still scores the dairy support program as amajor trade-distorting domestic subsidy to dairyfarmers. The WTO calculates domestic farm subsi-dies for a country by using a value called the Aggre-gate Measure of Support (AMS). Computing AMSfor marketing intervention programs involves com-paring supported prices with world market prices.Under the current WTO agreement (the 1994Uruguay Round), the contribution of the dairy pricesupport program to AMS is measured as the differ-ence between the $9.90 per hundredweight supportprice and a world price of $7.25 per hundredweight(average price for 1986-88) multiplied by total U.S.milk production. For 2008, the dairy AMS calcula-tion yields $5 billion ($2.65 per hundredweight X 1.9billion hundredweight of milk). The AMS upper limitfor all of U.S. agriculture is $19.1 billion annually,which means that the dairy price support programalone contributed more than 25 percent to this limit.
Supporting product prices instead of milk prices is anattempt to reduce dairy’s contribution to the WTOcalculation of AMS for the United States. Using1986-88 world market prices for cheddar cheese,butter and nonfat dry milk, we estimate that the cur-rent support program would contribute only about $3billion to AMS. More recent base year prices thatwould be used in any new WTO agreement wouldgenerate much smaller AMS contributions.
Another major difference between supporting a spe-cific milk price and supporting dairy product priceshas to do with alignment of CCC purchase prices for
butter and nonfat dry milk. Under current law, theSecretary can reduce the purchase prices for cheese,butter or nonfat dry milk if accumulated purchases ofany of these products exceed trigger levels. The Sec-retary is not obligated to consider the impact on milkprices or to maintain relative price relationships.
This authority replaces language in farm bills datingto 1990 that instructed the Secretary to use butter-powder “tilts”— altering the relative CCC purchaseprices for butter and nonfat dry milk — to minimizethe public cost of the support program. Under previ-ous versions of the dairy price support program,butter and nonfat dry milk were considered jointproducts and the combined net revenue from salesof butter and nonfat dry milk made from a hundred-weight of milk was intended to yield the milk sup-port price. So the purchase price of one product (e.g.,butter) could only be lowered if the purchase price ofthe other product (nonfat dry milk) were increasedenough to offset the reduced revenue
In the early 1990s, butter was in surplus relative tononfat dry milk. Four tilts were made between April1990 and July 1993, when the support price wasconstant at $10.10 per hundredweight. The butterpurchase price was decreased from $1.0925 to $0.65per pound and the nonfat dry milk price was corre-spondingly increased from $0.79 to $1.034 perpound in order to maintain the $10.10 per hundred-weight value for milk used to make butter and nonfatdry milk.
Beginning in 2000, nonfat dry milk was in surplusrelative to butter and the Secretary implemented twotilts, reducing the support price for nonfat dry milkfrom $1.032 to $0.80 per pound and correspondinglyincreasing the support price for butter from $0.6549to $1.05 per pound in order to maintain the $9.90 perhundredweight support price then in effect.
The lowering of the nonfat dry milk price was verycontentious because of its effect on the minimumprice of milk used to make fluid dairy products.4Under the Dairy Product Price Support Program,CCC purchase prices for cheese, butter and nonfatdry milk are no longer tied to a milk support price.So if butter were in surplus relative to nonfat drymilk, for example, the CCC purchase price for buttermay be lowered without increasing the purchaseprice for nonfat dry milk. The controversial issue ofbutter-powder tilts no longer exists.
6 DAIRY POLICY ISSUES
Dairy Price Support IssuesFlooring milk prices. Dairy price supports have notalways been successful in keeping dairy productprices above CCC purchase prices or in flooringfarm milk prices when that was a direct program ob-jective. For example, during the 48-month periodJanuary 2000 to December 2003, the Class III pricewas below the support price in 17 months, with thegap as large as $1.23 per hundredweight. During Jan-uary 2009, the CME block cheddar cheese price av-eraged $1.07 per pound and reached as low as $1.04.These prices were well below the CCC block ched-dar cheese price of $1.13 per pound.
Because of product, packaging, payment and otherspecifications that do not meet industry standards,it costs more to sell products to the government thanto commercial buyers. This is a particular problemfor cheese and butter; less so for nonfat dry milk.So market prices for the products that are purchasedunder the Dairy Products Price Support Programneed to be less than intervention prices in order to offset the difference in costs and trigger CCCpurchases.
There are several ways of correcting this problem. Adirect way is to simply raise the intervention pricesenough to offset the higher costs of selling product tothe CCC. This would require monitoring of cost dif-ferences and making periodic changes in CCC pur-chase prices, adding administrative burden to theDPPSP. Moreover, higher selling costs are not likelythe only reason market prices fall below CCC pur-chase prices, so raising purchase prices would notguarantee the problem would be corrected.
Another option, at least in areas regulated by federalmilk marketing orders, is to “snub” the butter,cheese, and nonfat dry milk prices used in federalorder Class III and Class IV pricing formulas at theCCC purchase prices. In other words, if in any montha NASS product price used in the formulas were lessthan CCC prices, the formula would use the higherCCC price. This option was used in the Californiamilk pricing system for about a two-year period be-ginning April 1, 2003. California 4a (butter-powder)and 4b (cheese) pricing formulas used the higher ofmarket prices or CCC purchase prices for butter,nonfat dry milk, and cheese.5
Snubbing formula product prices would be a very ef-fective way to prevent market prices less than sup-
port from negatively affecting federal order mini-mum Class III and Class IV prices. However, snub-bing would not prevent market prices for cheese andother CCC products from falling below CCC pur-chase prices by at least the difference in selling costsbetween commercial and CCC sales. Consequently,manufacturers would object strongly to this option.They would legitimately argue that their marginswere being squeezed whenever CME prices wereless than CCC prices. Snubbing would place a partic-ular hardship on smaller plants that are not in a posi-tion to sell to the CCC.
A third way to solidify DPPSP price floors is to havethe CCC participate as a trader on the CME or con-tract with CME brokers to place an irrevocable bid(offer to purchase) for block cheese, butter and non-fat dry milk on the CME at announced CCC pur-chase prices. CCC product, delivery, and paymentspecifications would need to be modified to moreclosely match those of the CME. To the extent that isimpractical or impossible under USDA rules, thenthe CCC would have to equalize net sales prices be-tween CCC and CME sales, probably through premi-ums that offset these costs. Any offers to sell at thestanding bid would be accepted by the CCC. UnderCME trading rules, there can be no sales or offers tosell at a price below the standing bid. Hence, this op-tion would place an absolute floor on CME prices atthe CCC purchase prices.
While this option would effectively floor CMEprices, it may not floor the NASS survey prices usedin Class III and Class IV pricing formulas. For exam-ple, the relationship between CME and NASS cheeseprices has been very tight because most cheese issold through pricing formulas tied to CME prices.But there is a possibility that these sales contractscould be altered if the CCC were a buyer on theCME. Buyers might use larger discounts or smallerpremiums when CME prices reached floors that re-sulted in. In that event, NASS commodity pricescould end up lower than CCC prices.
Market price distortions. Dairy price supports haveaffected milk utilization by setting a price floor forsome commodities but not for others. Perhaps thebest example of this market distortion relates to non-fat dry milk. Nonfat dry milk is a source of dairyprotein in many food applications. There is a largeU.S. market for other dairy-based proteins, notablymilk protein concentrate (MPC) and casein. Most of
DAIRY POLICY ISSUES 7

the MPC and nearly all of the casein used in the U.S.comes from imports.6 Because nonfat dry milk is pur-chased by the CCC at a minimum price, it is oftenmore profitable and less risky to produce nonfat drymilk than other forms of dairy proteins. U.S. produc-tion of whole milk powder (WMP) is similarly af-fected by the DPPSP standing ready to purchaseunlimited quantities of nonfat dry milk. WMP is amajor world dairy export product, but little is pro-duced in the U.S.
The narrow line of homogeneous dry milk productsstands in vivid contrast to the broad spectrum of wheyproducts manufactured in the U.S. for domestic andexport use. Whey protein has become essentially a“made to spec” product tailored to individualizeduses. Whey is also converted to specialized lactoseproducts. Not coincidentally, whey is not purchasedunder the DPPSP.
While the evidence is less clear, the DPPSP may alsoaffect the mix of cheeses produced in the U.S. Ched-dar cheese accounted for about a third of total U.S.cheese production in 2009. Obviously, cheddar cheesedemand heavily influences how much is manufac-tured. But both absolute production and the styles ofcheddar being produced may be influenced by theability to sell cheese to the CCC.
U.S. dairy export effects. Prior to 2006, world pricesfor cheese, butter and nonfat dry milk were oftenbelow CCC purchase prices. This was primarily theresult of limited world trade in dairy products and, forwhat trade there was, large EU export subsidies thatkept prices low. Consequently, selling to the CCC wasusually a more lucrative market than exporting.
During most of 2006-2008, world dairy market pricesexceeded CCC purchase prices and the U.S. enjoyeda dairy export boom. Purchase prices are currentlylow by historical standards and they cannot be in-
creased under existing law. Consequently, on average,export markets are expected to be more attractive toU.S manufacturers than selling cheese, butter andnonfat dry milk to the CCC over the long term.
But averages hide world market downsides. With thedairy price support program in effect, manufacturersshift their allegiance from export sales to CCC saleswhen world market prices dip far enough below CCCprices. This tends to make the United States an unreli-able supplier to world markets.
Endnotes1Milk price support levels noted here are for milk of averagebutterfat content (3.67 percent).2The Class III price includes a value for dry whey, which isnot purchased by the CCC. The Class III value noted here as-sumes a dry whey price of 19.11 cents per pound, which isequal to the whey make allowance in the Class III price for-mula. For every penny per pound that the whey price exceeds19.11 cents, the supported Class III price would be higher by5.8 cents per hundredweight3Net removals under the 2008 Act are defined as CCC pur-chases plus Dairy Export Incentive Program (DEIP) removalsminus unrestricted sales.4 See paper on federal milk marketing orders.5 Market prices under the California pricing system are definedas: CME butter, CME block cheddar cheese, California GradeA and Extra Grade nonfat dry milk, and Western dry whey.Federal orders use NASS prices for these four commodities.6 U.S. production of MPC was reported by USDA for the firsttime in 2009, and measured about 92 million pounds. MPC im-ports in 2009 were 114 million pounds. U.S. production ofMPC is believed to have increased from near zero ten yearsago, while imported MPC has declined 40 percent from 2005-2007 levels. U.S. casein production is not reported by USDA.In 2009, imports of casein and caseinates totaled 160 millionpounds.
8 DAIRY POLICY ISSUES
DAIRY POLICY ISSUES 9
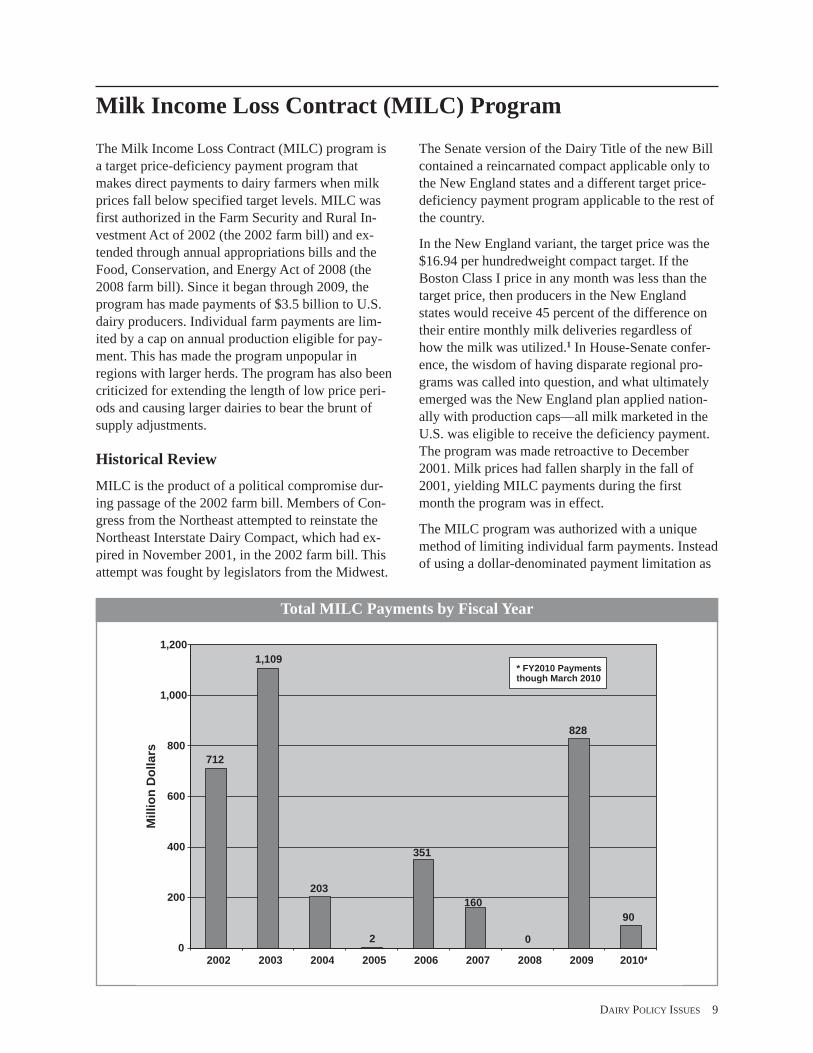
The Milk Income Loss Contract (MILC) program isa target price-deficiency payment program thatmakes direct payments to dairy farmers when milkprices fall below specified target levels. MILC wasfirst authorized in the Farm Security and Rural In-vestment Act of 2002 (the 2002 farm bill) and ex-tended through annual appropriations bills and theFood, Conservation, and Energy Act of 2008 (the2008 farm bill). Since it began through 2009, theprogram has made payments of $3.5 billion to U.S.dairy producers. Individual farm payments are lim-ited by a cap on annual production eligible for pay-ment. This has made the program unpopular inregions with larger herds. The program has also beencriticized for extending the length of low price peri-ods and causing larger dairies to bear the brunt ofsupply adjustments.
Historical ReviewMILC is the product of a political compromise dur-ing passage of the 2002 farm bill. Members of Con-gress from the Northeast attempted to reinstate theNortheast Interstate Dairy Compact, which had ex-pired in November 2001, in the 2002 farm bill. Thisattempt was fought by legislators from the Midwest.
The Senate version of the Dairy Title of the new Billcontained a reincarnated compact applicable only tothe New England states and a different target price-deficiency payment program applicable to the rest ofthe country.
In the New England variant, the target price was the$16.94 per hundredweight compact target. If theBoston Class I price in any month was less than thetarget price, then producers in the New Englandstates would receive 45 percent of the difference ontheir entire monthly milk deliveries regardless ofhow the milk was utilized.1 In House-Senate confer-ence, the wisdom of having disparate regional pro-grams was called into question, and what ultimatelyemerged was the New England plan applied nation-ally with production caps—all milk marketed in theU.S. was eligible to receive the deficiency payment.The program was made retroactive to December2001. Milk prices had fallen sharply in the fall of2001, yielding MILC payments during the firstmonth the program was in effect.
The MILC program was authorized with a uniquemethod of limiting individual farm payments. Insteadof using a dollar-denominated payment limitation as
Milk Income Loss Contract (MILC) Program
712
1,109
203
2
351
160
0
828
90
0
200
400
600
800
1,000
1,200
2002 2003 2004 2005 2006 2007 2008 2009 2010*
Mill
ion
Dol
lars
* FY2010 Paymentsthough March 2010
Total MILC Payments by Fiscal Year
in most farm programs, the MILC program imposeda limit on milk marketings eligible for payment dur-ing any fiscal year. The cap was initially set at 2.4million pounds, the annual production from a herd of100-150 cows, depending on milk yield per cow.Producers could sign up to begin receiving paymentsany month during a fiscal year (October-September)and receive payments from that month until market-ings for which MILC payments had been receivedreached the cap or the end of the fiscal year. Market-ings during any month in which there was not aMILC payment did not count against the cap.
In the 2002 farm bill, the MILC program was onlyauthorized through September 2005. The programwas extended in the fall of 2005 through the life ofthe bill. The extension renamed the program MILC-X and reduced the payment rate from 45 percent to34 percent of the difference between $16.94 and theBoston Class I price.
The MILC name and initial payment rate were rein-stated in the 2008 farm bill. Other significantchanges to this program were “floating” the targetprice in accordance with changes in feed prices andraising the payment cap from 2.4 million pounds to2.985 million pounds.
Since it began, the MILC program has made pay-ments of about $3.5 billion. More than half of totalpayments were made in the first two years the pro-gram was in effect. No payments were made inFY2008 and practically none in FY2005.
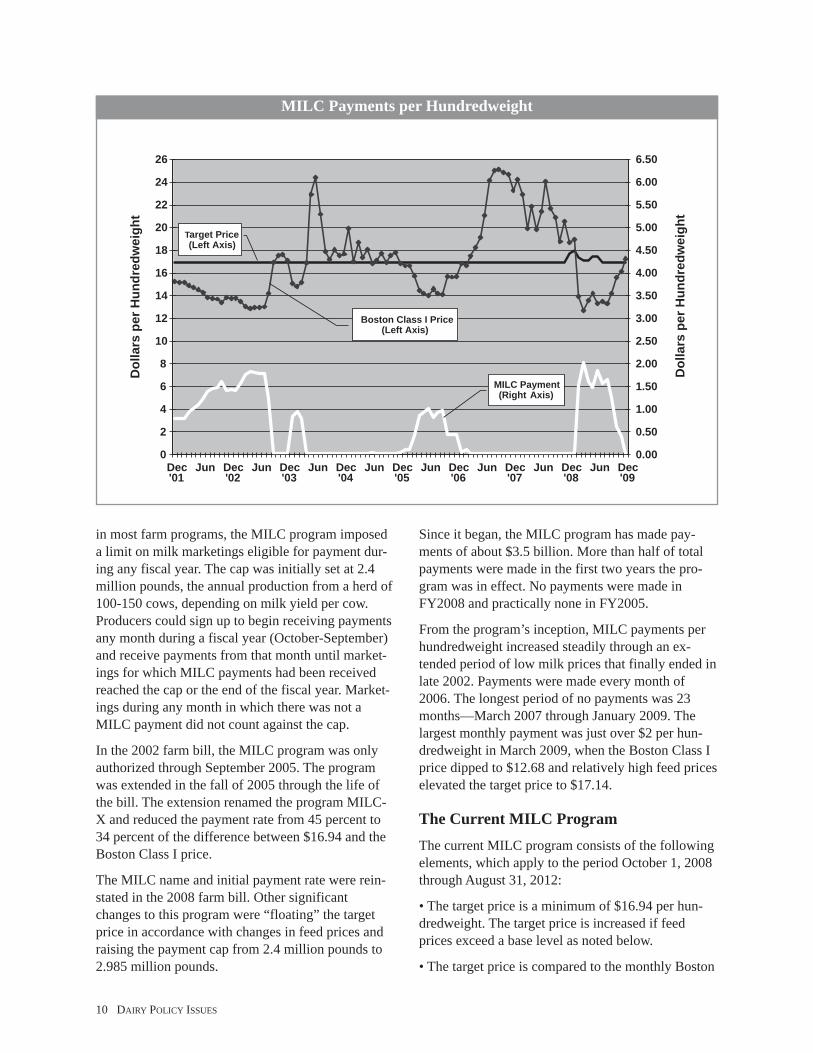
From the program’s inception, MILC payments perhundredweight increased steadily through an ex-tended period of low milk prices that finally ended inlate 2002. Payments were made every month of2006. The longest period of no payments was 23months—March 2007 through January 2009. Thelargest monthly payment was just over $2 per hun-dredweight in March 2009, when the Boston Class Iprice dipped to $12.68 and relatively high feed priceselevated the target price to $17.14.
The Current MILC ProgramThe current MILC program consists of the followingelements, which apply to the period October 1, 2008through August 31, 2012:
• The target price is a minimum of $16.94 per hun-dredweight. The target price is increased if feedprices exceed a base level as noted below.
• The target price is compared to the monthly Boston
0.00
0.50
1.00
1.50
2.00
2.50
3.00
3.50
4.00
4.50
5.00
5.50
6.00
6.50
0
2
4
6
8
10
12
14
16
18
20
22
24
26
Dec'01
Jun Dec'02
Jun Dec'03
Jun Dec'04
Jun Dec'05
Jun Dec'06
Jun Dec'07
Jun Dec'08
Jun Dec'09
Dol
lars
perH
undr
edw
eigh
t
Dol
lars
perH
undr
edw
eigh
t
Target Price(Left Axis)
Boston Class I Price(Left Axis)
MILC Payment(Right Axis)
MILC Payments per Hundredweight
10 DAIRY POLICY ISSUES
Class I price. If the Boston Class I price is lessthan the target price, then all producers are eligibleto receive a deficiency payment of 45 percent ofthe difference.
• Producers can receive payment on no more than2.985 million pounds of milk marketed in any fiscalyear (October-September). Producers can specifywhich month during the fiscal year they want tobegin receiving MILC payments. Once paymentsbegin, marketings during any month that paymentsare made count against the cap. The default month tobegin receiving payments is October. Once enrolledin the MILC program a producer cannot withdrawfrom the program and then re-enroll during the samefiscal year.
On September 1, 2012 (unless altered by a new farmbill or other legislation), the payment rate is reducedfrom 45 percent to 34 percent and the production capis reduced from 2.985 million pounds to 2.4 millionpounds.
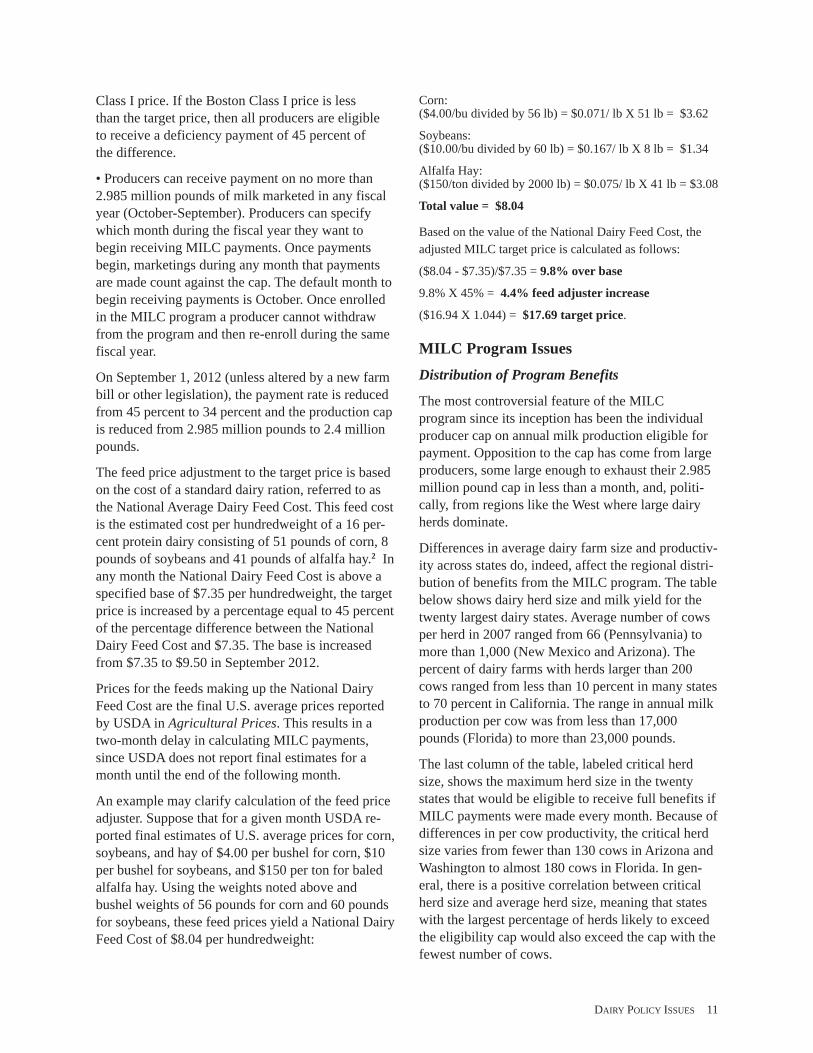
The feed price adjustment to the target price is basedon the cost of a standard dairy ration, referred to asthe National Average Dairy Feed Cost. This feed costis the estimated cost per hundredweight of a 16 per-cent protein dairy consisting of 51 pounds of corn, 8pounds of soybeans and 41 pounds of alfalfa hay.2 Inany month the National Dairy Feed Cost is above aspecified base of $7.35 per hundredweight, the targetprice is increased by a percentage equal to 45 percentof the percentage difference between the NationalDairy Feed Cost and $7.35. The base is increasedfrom $7.35 to $9.50 in September 2012.
Prices for the feeds making up the National DairyFeed Cost are the final U.S. average prices reportedby USDA in Agricultural Prices. This results in atwo-month delay in calculating MILC payments,since USDA does not report final estimates for amonth until the end of the following month.
An example may clarify calculation of the feed priceadjuster. Suppose that for a given month USDA re-ported final estimates of U.S. average prices for corn,soybeans, and hay of $4.00 per bushel for corn, $10per bushel for soybeans, and $150 per ton for baledalfalfa hay. Using the weights noted above andbushel weights of 56 pounds for corn and 60 poundsfor soybeans, these feed prices yield a National DairyFeed Cost of $8.04 per hundredweight:
Corn:($4.00/bu divided by 56 lb) = $0.071/ lb X 51 lb = $3.62
Soybeans:($10.00/bu divided by 60 lb) = $0.167/ lb X 8 lb = $1.34
Alfalfa Hay:($150/ton divided by 2000 lb) = $0.075/ lb X 41 lb = $3.08
Total value = $8.04
Based on the value of the National Dairy Feed Cost, theadjusted MILC target price is calculated as follows:
($8.04 - $7.35)/$7.35 = 9.8% over base
9.8% X 45% = 4.4% feed adjuster increase
($16.94 X 1.044) = $17.69 target price.
MILC Program IssuesDistribution of Program Benefits
The most controversial feature of the MILCprogram since its inception has been the individualproducer cap on annual milk production eligible forpayment. Opposition to the cap has come from largeproducers, some large enough to exhaust their 2.985million pound cap in less than a month, and, politi-cally, from regions like the West where large dairyherds dominate.
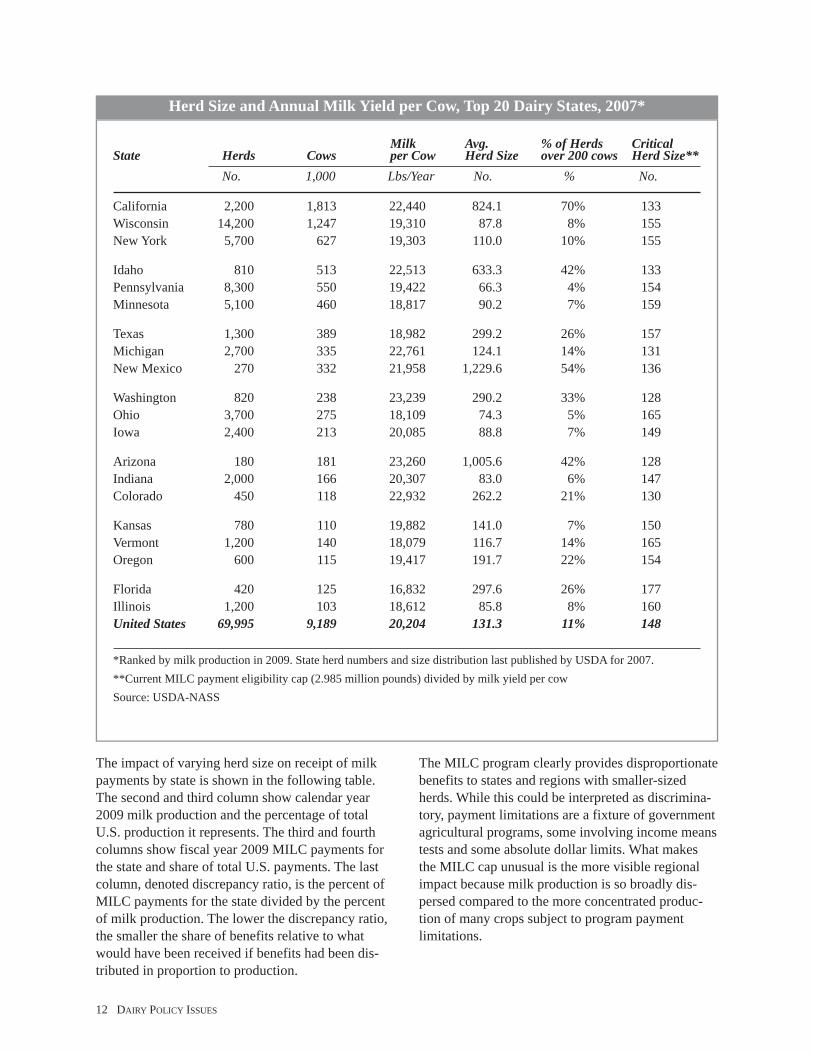
Differences in average dairy farm size and productiv-ity across states do, indeed, affect the regional distri-bution of benefits from the MILC program. The tablebelow shows dairy herd size and milk yield for thetwenty largest dairy states. Average number of cowsper herd in 2007 ranged from 66 (Pennsylvania) tomore than 1,000 (New Mexico and Arizona). Thepercent of dairy farms with herds larger than 200cows ranged from less than 10 percent in many statesto 70 percent in California. The range in annual milkproduction per cow was from less than 17,000pounds (Florida) to more than 23,000 pounds.
The last column of the table, labeled critical herdsize, shows the maximum herd size in the twentystates that would be eligible to receive full benefits ifMILC payments were made every month. Because ofdifferences in per cow productivity, the critical herdsize varies from fewer than 130 cows in Arizona andWashington to almost 180 cows in Florida. In gen-eral, there is a positive correlation between criticalherd size and average herd size, meaning that stateswith the largest percentage of herds likely to exceedthe eligibility cap would also exceed the cap with thefewest number of cows.
DAIRY POLICY ISSUES 11
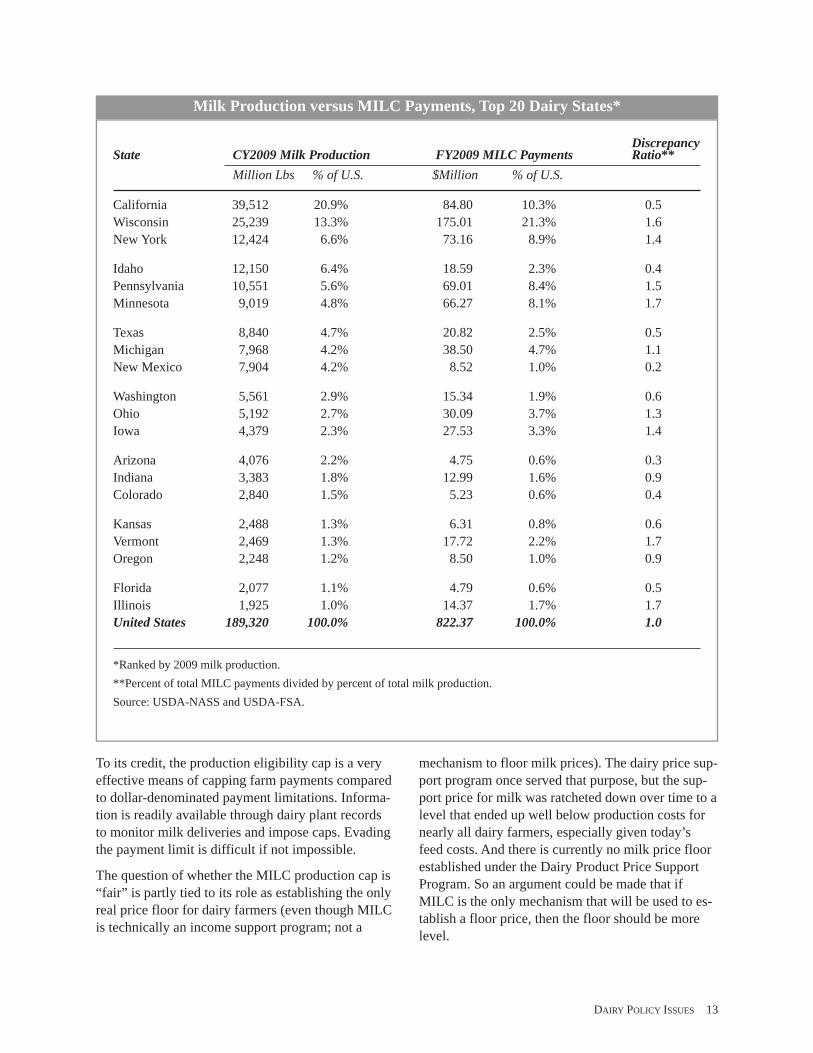
The impact of varying herd size on receipt of milkpayments by state is shown in the following table.The second and third column show calendar year2009 milk production and the percentage of totalU.S. production it represents. The third and fourthcolumns show fiscal year 2009 MILC payments forthe state and share of total U.S. payments. The lastcolumn, denoted discrepancy ratio, is the percent ofMILC payments for the state divided by the percentof milk production. The lower the discrepancy ratio,the smaller the share of benefits relative to whatwould have been received if benefits had been dis-tributed in proportion to production.
The MILC program clearly provides disproportionatebenefits to states and regions with smaller-sizedherds. While this could be interpreted as discrimina-tory, payment limitations are a fixture of governmentagricultural programs, some involving income meanstests and some absolute dollar limits. What makesthe MILC cap unusual is the more visible regionalimpact because milk production is so broadly dis-persed compared to the more concentrated produc-tion of many crops subject to program paymentlimitations.
Milk Avg. % of Herds CriticalState Herds Cows per Cow Herd Size over 200 cows Herd Size**
No. 1,000 Lbs/Year No. % No.
California 2,200 1,813 22,440 824.1 70% 133Wisconsin 14,200 1,247 19,310 87.8 8% 155New York 5,700 627 19,303 110.0 10% 155
Idaho 810 513 22,513 633.3 42% 133Pennsylvania 8,300 550 19,422 66.3 4% 154Minnesota 5,100 460 18,817 90.2 7% 159
Texas 1,300 389 18,982 299.2 26% 157Michigan 2,700 335 22,761 124.1 14% 131New Mexico 270 332 21,958 1,229.6 54% 136
Washington 820 238 23,239 290.2 33% 128Ohio 3,700 275 18,109 74.3 5% 165Iowa 2,400 213 20,085 88.8 7% 149
Arizona 180 181 23,260 1,005.6 42% 128Indiana 2,000 166 20,307 83.0 6% 147Colorado 450 118 22,932 262.2 21% 130
Kansas 780 110 19,882 141.0 7% 150Vermont 1,200 140 18,079 116.7 14% 165Oregon 600 115 19,417 191.7 22% 154
Florida 420 125 16,832 297.6 26% 177Illinois 1,200 103 18,612 85.8 8% 160United States 69,995 9,189 20,204 131.3 11% 148
*Ranked by milk production in 2009. State herd numbers and size distribution last published by USDA for 2007.**Current MILC payment eligibility cap (2.985 million pounds) divided by milk yield per cowSource: USDA-NASS
Herd Size and Annual Milk Yield per Cow, Top 20 Dairy States, 2007*
12 DAIRY POLICY ISSUES
To its credit, the production eligibility cap is a veryeffective means of capping farm payments comparedto dollar-denominated payment limitations. Informa-tion is readily available through dairy plant recordsto monitor milk deliveries and impose caps. Evadingthe payment limit is difficult if not impossible.
The question of whether the MILC production cap is“fair” is partly tied to its role as establishing the onlyreal price floor for dairy farmers (even though MILCis technically an income support program; not a
mechanism to floor milk prices). The dairy price sup-port program once served that purpose, but the sup-port price for milk was ratcheted down over time to alevel that ended up well below production costs fornearly all dairy farmers, especially given today’sfeed costs. And there is currently no milk price floorestablished under the Dairy Product Price SupportProgram. So an argument could be made that ifMILC is the only mechanism that will be used to es-tablish a floor price, then the floor should be morelevel.
DiscrepancyState CY2009 Milk Production FY2009 MILC Payments Ratio**
Million Lbs % of U.S. $Million % of U.S.
California 39,512 20.9% 84.80 10.3% 0.5Wisconsin 25,239 13.3% 175.01 21.3% 1.6New York 12,424 6.6% 73.16 8.9% 1.4
Idaho 12,150 6.4% 18.59 2.3% 0.4Pennsylvania 10,551 5.6% 69.01 8.4% 1.5Minnesota 9,019 4.8% 66.27 8.1% 1.7
Texas 8,840 4.7% 20.82 2.5% 0.5Michigan 7,968 4.2% 38.50 4.7% 1.1New Mexico 7,904 4.2% 8.52 1.0% 0.2
Washington 5,561 2.9% 15.34 1.9% 0.6Ohio 5,192 2.7% 30.09 3.7% 1.3Iowa 4,379 2.3% 27.53 3.3% 1.4
Arizona 4,076 2.2% 4.75 0.6% 0.3Indiana 3,383 1.8% 12.99 1.6% 0.9Colorado 2,840 1.5% 5.23 0.6% 0.4
Kansas 2,488 1.3% 6.31 0.8% 0.6Vermont 2,469 1.3% 17.72 2.2% 1.7Oregon 2,248 1.2% 8.50 1.0% 0.9
Florida 2,077 1.1% 4.79 0.6% 0.5Illinois 1,925 1.0% 14.37 1.7% 1.7United States 189,320 100.0% 822.37 100.0% 1.0
*Ranked by 2009 milk production.**Percent of total MILC payments divided by percent of total milk production.Source: USDA-NASS and USDA-FSA.
Milk Production versus MILC Payments, Top 20 Dairy States*
DAIRY POLICY ISSUES 13

Supply ImpactsWhile the purpose of the MILC program is to pro-vide income protection to dairy farmers, most dairyfarmers likely view MILC payments as an augmenta-tion of their milk price rather than a decoupled in-come supplement. Accordingly, the MILC programhas been criticized by some for lengthening the pe-riod of supply adjustment to low milk prices by im-plicitly raising prices, thus impeding or preventingthe “natural selection process” of attrition that occursin response to sustained low milk prices.
The argument behind this criticism is that operatorsof smaller dairy farms whose payments are notcapped would be the most likely to exit the industrywhen milk prices are low. Since smaller dairiesreceive maximum MILC payments, they are ableto stay in business. Moreover, the argument goes,operators of large dairies receive only a fractionof the per hundredweight MILC payments goingto small dairies (a smaller milk price augmentation).Therefore they are forced to bear the brunt ofsupply adjustment.
While this argument is plausible, the assumptionthat, absent MILC payments, smaller dairy farmswould be the first to go is questionable. There aremany factors that determine financial vulnerability.Important determinants are debt load and debt-to-equity ratios. USDA-ERS dairy balance sheet dataindicate that smaller dairy farmers carry less debt perdollar of assets and have a lower debt-to-equity ratiothan larger dairy farmers.3 Hence, it seems unlikelythat smaller farmers are more likely to be forced outof business from foreclosure than large farmers.
Composition of the Feed Price AdjusterThe feed composition and the weights applied tocorn, soybeans and alfalfa hay are subject to ques-tion. Few dairies include soybeans directly in theirdairy ration, instead using soybean meal or otheroilseed meals as a source of protein. Prices for soy-bean and other oilseed meals are highly correlatedwith the U.S. average soybean price, but the smallweight on soybeans may not match the use of highprotein meals in dairy rations. Similarly, while dryalfalfa hay is common in dairy rations, corn silageis extensively used in many parts of the UnitedStates. The value of corn silage would be more
highly correlated with corn prices than alfalfa hayprices. Moreover, while the use of a single feed priceadjustor is likely necessary for purposes of adminis-tration, it ignores significant regional differences infeed rations and feeding rates.
Delay in Calculating Feed Cost AdjusterUsing the feed price adjuster makes the MILC pro-gram more sensitive to cost side changes in dairyprofitability, but the way it is calculated has created adelay in calculating MILC payments.
The monthly feed cost adjuster used to increase theMILC target price is based on USDA-NASS final es-timates of U.S. average corn, soybean and baled al-falfa hay prices. These estimates are reported in themonthly Agriculture Prices report published by theUSDA near the end of each month.
Agricultural Prices reports preliminary estimates ofthe prices making up the feed cost adjuster at the endof the current month. For example, preliminary corn,soybean and hay prices for the month of March 2010were reported on March 30. Final estimates are re-ported at the end of the following month, e.g. March2010 final estimates were reported April 30. Thismeans that the feed price adjusted MILC target priceis not known until the end of the month following themonth it applies, e.g., the March 2010 target pricecould not be reported until April 30.
Federal Order Class I prices are announced on theFriday on or before the 23rd of the month beforethey apply. The March 2010 Boston Class I price wasannounced on February 19. So the reference price inthe calculation of the March 2010 MILC paymentwas known 10 weeks before the target price.
Prior to adoption of the feed price adjuster, MILCpayment rates were known as soon as the BostonClass I price was announced, which was severaldays before the month the rates applied. Currently,payments are not known until the end of the monthfollowing the month they apply, delaying the ac-counting and payment process.
This lag could be shortened by using preliminaryNASS estimates of feed prices. Historically, differ-ences between preliminary and final feed cost esti-mates have been small. But revisions have becomelarger on average with higher and more volatile cornand soybean prices in recent years.
14 DAIRY POLICY ISSUES

Using preliminary feed prices would result in poten-tial underpayment of producers in months when finalfeed price estimates exceeded preliminary estimatesand possible overpayment if the opposite occurred.Over time, downward price adjustments would beexpected to offset upward adjustments. But offsetswould not likely match the timing of MILC paymentmonths—for example positive revisions might occurmostly in months when no payments are made.USDA could adjust subsequent payments if feedprice revisions resulted in over- or under-paymentsfor a given month. But adjustments could not bemade for several months if prices stayed abovethe target.
Soft Price FloorThe current MILC program pays out 45 percent ofthe difference between the feed price adjusted targetprice and the Boston Class I price. Especially in lightof recent low milk prices, some question whether theprogram always offers an acceptable safety net fordairy producers.
The decision to use $16.94 per hundredweight in ref-erence to the Boston Class I price is the main reasonfor the 45 percent payout factor. A payout factor of100 percent would have resulted in a level of supportabove average price levels since the program’s incep-tion, considerably higher than what many mightthink is a reasonable safety net. Using a 100 percentpayout factor would have resulted in very high gov-ernment costs. Given budget constraints, the pricefloor can be made more solid only by setting a lowertarget price, perhaps in reference to some percentageof a moving national average all-milk price or thefederal order Class III price.
Simply put and ignoring the production cap, once theBoston class I price falls below the feed-adjusted
trigger level, producers only recoup 45 percent of thedecline in market receipts from the MILC direct pay-ments. That is, they still see lower overall receipts asprices decline from the trigger level.
This raises the question of whether a better optionwould be a sliding payout factor that increased thefurther the market price fell below the target price.Alternatively, once the market price fell to a speci-fied minimum level, the program could compensate100 percent of the difference between that level andthe market price. Choosing a price floor would be acritical decision in order to avoid interference withmarket signals. Given the variability in productioncosts today, the price floor may need to be adjustedregularly to avoid the over-supply situation thatexcessively high support price levels created in the1980s or the under-supply situation that could unfoldif production costs continue their rise of the pastfew years.
Endnotes
1Under the compact, Class I handlers paid the full differencebetween $16.94 and the Boston Class I price into a compactpool, which was distributed to all producers in proportion totheir monthly total milk marketings. Since Class I utilizationin the compact area was about 45 percent, in effect, MILC re-produced the compact.
2For a spreadsheet model that shows the MILC feed adjusterrefer to the following URL located within the University ofWisconsin Understanding Dairy Markets website: http://fu-ture.aae.wisc.edu/
3For state level balance sheet data, see:http://www.ers.usda.gov/Data/ARMS/StatesOverview.htm
DAIRY POLICY ISSUES 15
Government-sponsored voluntary supply managementhas been used infrequently in the U.S. dairy industry.Programs used in the mid-1980s involved payingdairy farmers to reduce milk production or exit dairyfarming. After much of the burdensome supplies ofthe 1980s were controlled, there were no programsthat allowed producers to voluntarily cut supplies inexchange for incentives. In July 2003, a private vol-untary supply management program was initiated bythe National Milk Producers Federation. The Cooper-atives Working Together, or CWT, program periodi-cally solicits bids from eligible dairy farmers (thosepaying an assessment) representing how much perhundredweight of base production they are willing toaccept to slaughter their dairy herds. Through the endof 2009, there have been nine CWT herd retirementrounds and participating producers are currentlysigned up through the end of 2010 to pay an assess-ment of 10 cents per cwt of milk marketed.
Historical ReviewVoluntary supply management involves a “carrot” ap-proach to keeping supply in line with consumption inorder to achieve satisfactory farm-level prices. In ageneric sense, voluntary supply management pro-grams pay producers to cut back production or go outof business. Willing producers participate; others arenot obligated to.
Prior to the 21st century, voluntary supply manage-ment had been used only twice in the U.S dairy sector,both within a short period of time in the mid-1980s.This period was characterized by massive overproduc-tion of milk, which resulted in government purchasecosts under the dairy price support program in excessof $2 billion per year.
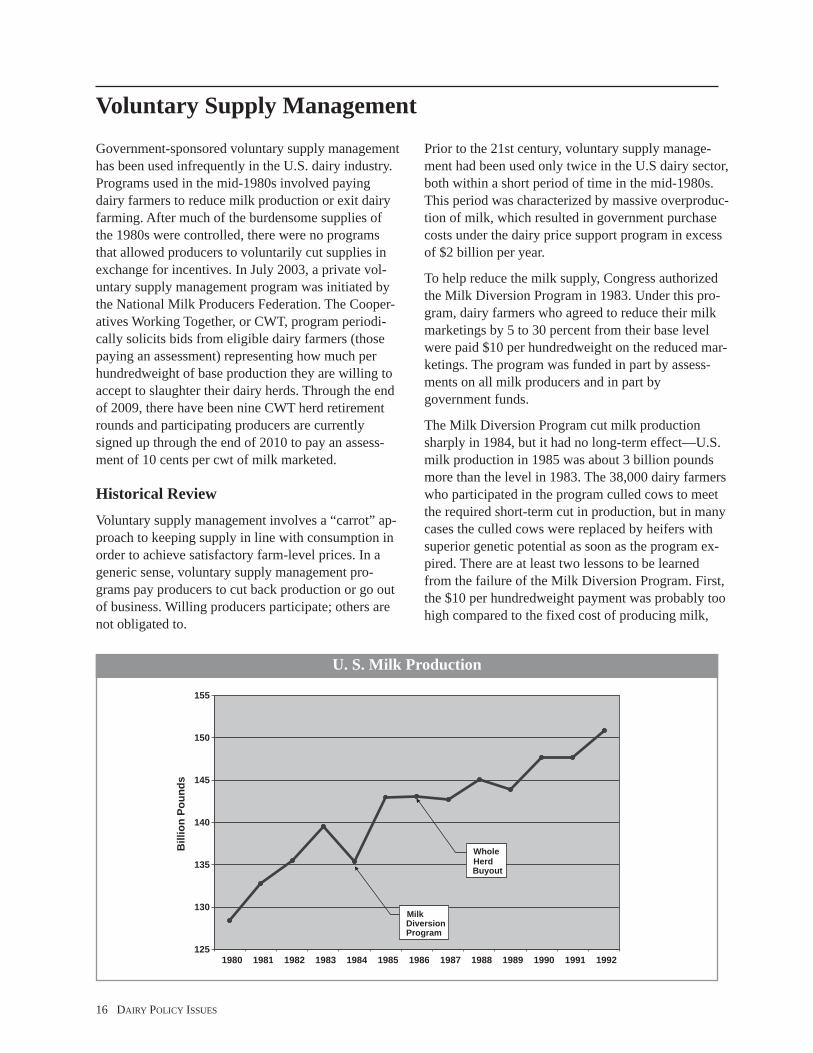
To help reduce the milk supply, Congress authorizedthe Milk Diversion Program in 1983. Under this pro-gram, dairy farmers who agreed to reduce their milkmarketings by 5 to 30 percent from their base levelwere paid $10 per hundredweight on the reduced mar-ketings. The program was funded in part by assess-ments on all milk producers and in part bygovernment funds.
The Milk Diversion Program cut milk productionsharply in 1984, but it had no long-term effect—U.S.milk production in 1985 was about 3 billion poundsmore than the level in 1983. The 38,000 dairy farmerswho participated in the program culled cows to meetthe required short-term cut in production, but in manycases the culled cows were replaced by heifers withsuperior genetic potential as soon as the program ex-pired. There are at least two lessons to be learnedfrom the failure of the Milk Diversion Program. First,the $10 per hundredweight payment was probably toohigh compared to the fixed cost of producing milk,
125
130
135
140
145
150
155
1980 1981 1982 1983 1984 1985 1986 1987 1988 1989 1990 1991 1992
Bill
ion
Poun
ds
MilkDiversionProgram
WholeHerdBuyout
Voluntary Supply Management
U. S. Milk Production
16 DAIRY POLICY ISSUES
making the program attractive to savvy milk produc-ers who knew how to “beat the system.”Second, thetime period for reducing milk marketings was tooshort, making it easy to hold back higher-producingreplacements for the cows culled to meet the market-ing restriction.
Still facing a major milk surplus problem, Congressauthorized the Dairy Termination Program (WholeHerd Buyout) in the Food Security Act of 1985.The USDA accepted bids from dairy farmers whowere willing to slaughter or export all female dairycattle and remain out of the dairy business for atleast 5 years.
The USDAwas able to sign up dairy producers total-ing about 12 billion pounds of milk marketings byaccepting all bids made by producers of $22.50 percwt or less. Those producers whose bids were ac-cepted had to dispose of all dairy cattle over an 18month period during 1986 and 1987 and remain outof dairying for five years. Direct payments to partici-pants totaled $1.8 billion over the fiscal 1986through fiscal 1991 period.
Compared to the Milk Diversion Program, the wholeherd buyout was successful in moderating productiontrends. However, the induced slaughter of dairy cowswas credited for negatively affected beef markets,raising the ire of cattle producers and leading to criesof, “never again.”
The use of refundable assessments has been the mostrecent voluntary supply management option used inthe U.S. dairy industry. The milk assessments thatdairy producers faced during the early 1990s wereput in place to reduce government spending on dairyprograms. These assessments were not debated as avoluntary supply management proposal. Yet, whenCongress allowed these assessments to be refundedto producers who did not increase their milk market-ings, producers had to make a choice each year aboutwhether to increase their milk production or holdmilk production flat and receive a check reimbursingtheir assessment.
The first assessment program that allowed for the re-fund of producer assessments arose out of the 1982Omnibus Reconciliation Act. The act collected twoseparate 50 cent assessments. The first 50 cent as-sessment was not refundable while the second 50cent assessment was refundable to producers who re-duced their marketings at least 8.4 percent belowtheir base marketings.
The 1990 Omnibus Budget Reconciliation Act re-quired that all milk marketed in the U.S. be assessed5 cents per hundredweight in 1991 and a minimumof 11.25 cents per hundredweight over 1992-1995.Those producers who held milk marketings flatrelative to the previous year were eligible for a re-fund of the assessments they paid the following year.The assessment rate was then increased during the1992-1995 period to result in a net assessment of11.25 cents per hundredweight to be collected. Re-funds of dairy assessments in fiscal 1996 reached$82.039 million, the last full fiscal year of the pro-gram. Assessments collected in fiscal 1995 totaled$225 million.
The Current Program: Cooperatives Work-ing Together (CWT)The objective of the government-sponsored volun-tary supply management programs was to enhanceand stabilize farm-level milk prices by controllingthe amount of milk marketed. Recently, an industry-sponsored voluntary milk supply management pro-gram was initiated to achieve similar objectives byusing some of the same techniques.
The program, labeled CWT for Cooperatives Work-ing Together, was designed and is managed by theNational Milk Producers Federation, a trade associa-tion of dairy cooperatives. Members of participatingdairy cooperatives and, if they choose, independentdairy farmers fund the program through an assess-ment of ten cents per hundredweight of milk mar-keted (the original program had a five centassessment that increased to the current ten cent levelin July 2006). Participation in the CWT has rangedbetween 67 and 74 percent of all milk marketed inthe U.S. The early CWT press releases suggest theprogram collected a little less than $60 million annu-ally when there was a five cent assessment. Movingto the ten cent assessment reduced program partici-pation, but a general increase in milk production sug-gests that funds have roughly doubled with theincrease in the assessment.
CWT has used two methods of voluntary supplymanagement: herd retirement and dairy export incen-tives.1 Under herd retirement, bids are accepted fromdairy farmers who are willing to slaughter their milk-ing herd. Export incentives provide participating co-operatives subsidies on exports of butter and cheese.There is some flexibility in the operation of CWTprogram since the CWT committee has the ability to
DAIRY POLICY ISSUES 17

adjust the operation of these two programs or addnew programs as it chooses.
CWT programs are only available to those producersand cooperatives who participate by paying the CWTassessment. The CWT program is a federation of co-operatives and producers formed in accordance withthe Capper-Volstead Act and acts in association forthe specific purpose of achieving strong and stablemilk prices.
The CWT Herd Retirement ProgramThe herd retirement program has been the mostheavily used part of the CWT programs. Roughly 90percent of the funds have been used for herd retire-ment. CWT has had nine herd retirement “rounds” todate. The inaugural herd retirement in late 2003 re-moved 32,724 cows from 299 dairy farms (see figurebelow for a history of CWT herd retirements). Intotal, the herd retirement program has removed over475,000 cows through 2009.
Herds accepted in any CWT herd retirement roundgo through an audit process that includes examiningcurrent milk production relative to the previous yearto ensure that the herd has not seen significantchanges in production prior to be accepted. Once thataudit process is successfully completed, the dry and
milking cows are CWT tagged and the producer isresponsible to send these animals to slaughter in thenext 15 days. Once the tags are returned to CWT, theproducer will receive his/her check.
CWT has a general set of guidelines that are used indetermining when to hold a herd retirement. They in-clude the: 1) all-milk price, 2) cost of milk produc-tion, 3) milk-feed price ratio, 4) dairy cow numbers,5) milk production, and 6) dairy cow culling.
Beginning in 2008, the herd retirement program wasexpanded to allow producers to bid their bred heifersin addition to their milk cow herd. To date, just over4,500 bred heifers have been removed throughslaughter.
The herd retirement program was ramped up signifi-cantly in late 2008 as the serious decline in milkprices was becoming reality for the industry. In fact,over 50 percent of the cows bought in herd retire-ments occurred in the last four herd retirements thatoccurred in a span of about 12 months.
Current discussion of CWT has focused on how tomake the herd retirement program more effective. AsCWT looks to maximize return on participating pro-ducers’ assessment, new program features continueto be examined. Ideas like partial herd retirementshave recently surfaced.
32.7
50.5
64.1
52.8
24.6
50.6
101.0
74.1
26.4
0
20
40
60
80
100
120
1 2 1 2 3
2003 2004 2005 2007 2008 2008 2009 2009 2009
1,00
0H
ead
CWT Round
CWT Herd Retirement Levels
18 DAIRY POLICY ISSUES
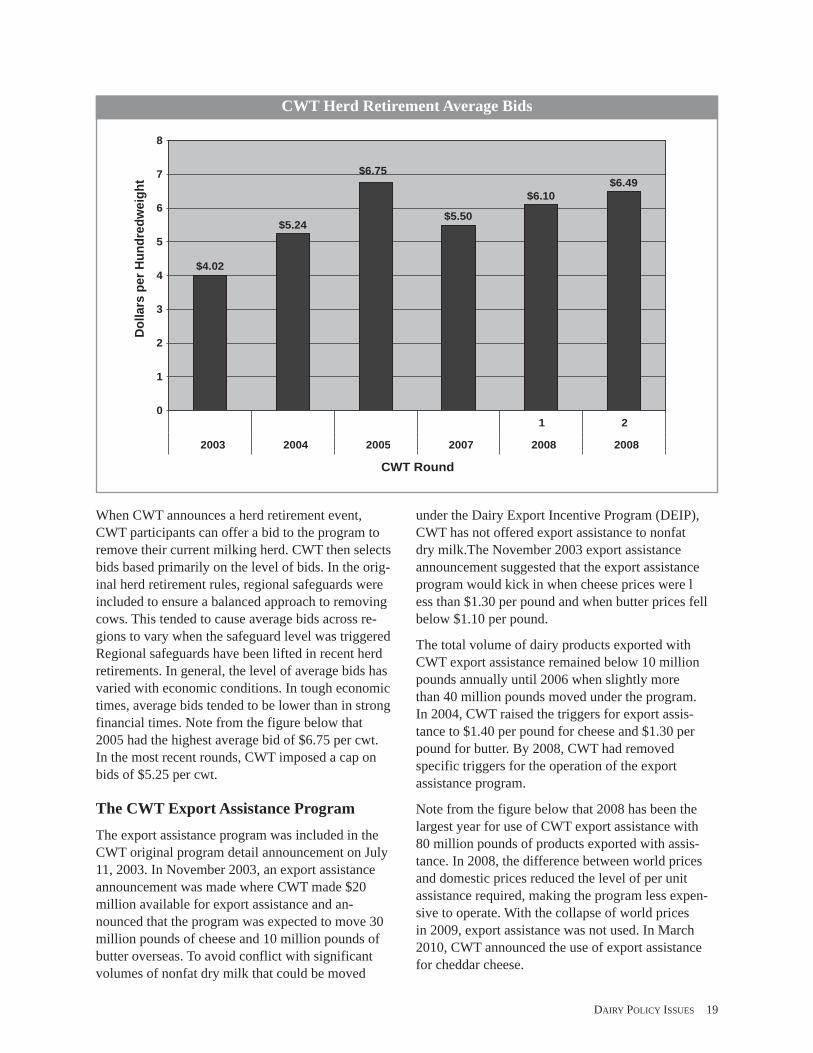
When CWT announces a herd retirement event,CWT participants can offer a bid to the program toremove their current milking herd. CWT then selectsbids based primarily on the level of bids. In the orig-inal herd retirement rules, regional safeguards wereincluded to ensure a balanced approach to removingcows. This tended to cause average bids across re-gions to vary when the safeguard level was triggeredRegional safeguards have been lifted in recent herdretirements. In general, the level of average bids hasvaried with economic conditions. In tough economictimes, average bids tended to be lower than in strongfinancial times. Note from the figure below that2005 had the highest average bid of $6.75 per cwt.In the most recent rounds, CWT imposed a cap onbids of $5.25 per cwt.
The CWT Export Assistance ProgramThe export assistance program was included in theCWT original program detail announcement on July11, 2003. In November 2003, an export assistanceannouncement was made where CWT made $20million available for export assistance and an-nounced that the program was expected to move 30million pounds of cheese and 10 million pounds ofbutter overseas. To avoid conflict with significantvolumes of nonfat dry milk that could be moved
under the Dairy Export Incentive Program (DEIP),CWT has not offered export assistance to nonfatdry milk.The November 2003 export assistanceannouncement suggested that the export assistanceprogram would kick in when cheese prices were less than $1.30 per pound and when butter prices fellbelow $1.10 per pound.
The total volume of dairy products exported withCWT export assistance remained below 10 millionpounds annually until 2006 when slightly morethan 40 million pounds moved under the program.In 2004, CWT raised the triggers for export assis-tance to $1.40 per pound for cheese and $1.30 perpound for butter. By 2008, CWT had removedspecific triggers for the operation of the exportassistance program.
Note from the figure below that 2008 has been thelargest year for use of CWT export assistance with80 million pounds of products exported with assis-tance. In 2008, the difference between world pricesand domestic prices reduced the level of per unitassistance required, making the program less expen-sive to operate. With the collapse of world pricesin 2009, export assistance was not used. In March2010, CWT announced the use of export assistancefor cheddar cheese.
$4.02
$5.24
$6.75
$5.50
$6.10$6.49
0
1
2
3
4
5
6
7
8
1 2
2003 2004 2005 2007 2008 2008
Dol
lars
perH
undr
edw
eigh
t
CWT Round
CWT Herd Retirement Average Bids
DAIRY POLICY ISSUES 19

20 DAIRY POLICY ISSUES
Issues Regarding the Operation of theCWT ProgramAs with any program that has operated in agriculturalmarkets, there have been critics of the CWT programand the associated benefits and costs to the U.S.dairy industry. There are several features involved inoperating the CWT program that can influence theeffects the program can have on the marketplace.Some of the criticism can be tackled head on whileother criticism remains impossible to answer withcertainty given CWT effects happen simultaneouslywith everything else happening in the industry.
The herd retirement program has had critics that feelsignificant producer cheating has occurred. Movingof milking cows in the night or construction of aCWT herd retirement operation are examples ofthese criticisms. However, the stories of these kindsof activities often greatly exaggerate what has hap-pened in reality. CWT has a formal audit process thattakes place for each operation that bids into a herdretirement to ensure compliance with the program.Additional guidelines have been incorporatedthrough time that has minimized the ability to takeadvantage of the system. Cheating in any programcan never be eliminated but the guidelines used byCWT make this a rare problem.
Perhaps a more important issue to the CWT herd re-tirement program is whether the program has boughtcows that were going to leave regardless of thewhether they were taken out in a herd retirementevent or not. This is often described as “buying air”since the production was going to leave anyway. It isimpossible to know which or how many dairy farm-ers who bid into a herd retirement would have doneso in the absence of the program. It is clear that CWTbought and removed cows that were contributing tocurrent milk supplies. By buying these cows, theywere removed from production instead of being soldto another dairy farmer who continued to milk them.So regardless of producer intent, CWT herd retire-ment removed milk supplies more quickly thanwould have occurred otherwise.
The CWT program does not require producers to stayout of production when they participate in a herd re-tirement round; only that they sell all of their milkingcows. If producers have interest in multiple opera-tions, they must offer cows from all of the operationsif they wish to participate. Rule changes in 2009 re-quire producers to stay out of production for twelvemonths to receive their full payment. Specifically,producers are paid 90 percent of their bid when ac-cepted but the last 10 percent plus interest is paid
0
10
20
30
40
50
60
70
80
90
2004 2005 2006 2007 2008
Mill
ion
Poun
ds
Whole Milk PowderAnhydous MilkfatButterCheese
CWT Export Assistance Levels

DAIRY POLICY ISSUES 21
twelve months later when it is verified that the pro-ducer and the producer’s operation still remains outof milking. But this CWT feature is less restrictivethan many of the government voluntary supply man-agement programs used in the past. Consequently,bids under CWT have fallen well below the average$15 bid accepted under the whole herd buyout pro-gram of the 1980s, which has been the only otherprogram that directly targeted cow removal. This as-pect of the program has led to discussion about howquickly CWT herd retirement producers are returningto production. CWT surveyed producers who partici-pated in the 2007 herd retirement program and foundthat 88 percent of those who returned a survey didnot plan to return to production. Many of the respon-dents cited economic conditions as the reason for ex-iting with only eight percent wanting to start a newherd and one percent of respondents indicating thatthey wanted to relocate the dairy.
Perhaps more important to the magnitude of the ef-fects of a herd retirement program is how producersnot participating respond. If these producers are in-terested in expanding their operation, they may timetheir expansion to coincide with a herd retirementround, anticipating higher milk prices from the herdretirement. Current economic conditions facing theindustry and the availability of dairy heifers are im-portant determinants of the magnitude of this effect.Other things held constant, the less anticipated aCWT herd retirement round, the less likely non-par-ticipants are to ramp up cow numbers and therebyoffset the CWT program effect.
Many participating dairy producers have voiced con-cern regarding those producers who are not con-tributing to the CWT program but still benefit from itthrough the participation of others. The CWT pro-gram saw participation reach 74 percent around 2006but then decline to below 70 percent today. Decliningparticipation reduces total funding for CWT and di-minishes its impact. How to increase participationand funding appears to be the largest issue the CWTprogram will need to address in the near term.
CWT herd retirements have little long-term effect onmilk supplies. The general economic conditions fac-
ing the dairy industry will determine milk supplies.However, CWT can significantly influence short-runmilk supplies in periods of low economic returns. IfCWT herd retirements end, the industry will return tothe same level of milk supplies in three to five yearsthat would have occurred in absence of the program.As a result, herd retirements can have significant ef-fects on the path towards long-run milk prices.Analysis conducted by Brown for the CWT programshows that the effects of an individual herd retire-ment are completely gone after about three years. Yetthe combination of all herd retirement events hasprovided an increase in 2009 U.S. all milk prices ofover $1.50 per cwt.
CWT export assistance moves certain dairy productsout of domestic markets and into world markets.That reduces available supplies of these dairy prod-ucts and raises their prices. How much depends onthe elasticity of domestic demand for these products.The more inelastic the demand the larger the priceincrease.
The market psychology of the export assistance pro-gram may have also benefited dairy prices. The mar-ket price for cheese stayed slightly above CWTtrigger levels during some periods of the programsoperation. Further longer term help to producer re-turns can occur if export assistance helps companiesdevelop new longer term markets for U.S. dairyproducts. The USDEC involvement in export assis-tance may prove helpful in developing new marketsfor U.S. dairy products over the long term. Brown’sanalysis suggests that the 80 million pounds of dairyproducts that received export assistance in 2008 in-creased U.S. all milk prices by about $0.10 per cwtin that year.
Endnotes1 Initially, CWT also included a milk production reduction in-centive program that, like the Milk Diversion Program, paidproducers for cutting production below a base level. This pro-gram was used only once since there was limited interest withonly 514 bids submitted and 77 bids accepted for the programin 2003.

The dairy industry works within a market economygoverned by the laws of supply and demand. Thismeans that market forces interact within the confinesof dairy market regulations to influence the level offarm milk prices, milk production and milk and dairyproduct consumption. When milk production in-creases faster than consumption, the laws of supplyand demand imply that the market price of milk willfall. As prices fall, some dairy farmers may leavethe dairy industry. Simultaneously, consumptionincreases as wholesale and retail prices of milkand dairy products slowly decrease. These forcescontinue until a milk price is determined that bal-ances milk production and consumption, plus anyquantity purchased by the existing federal dairy pricesupport program.
Since the mid-1990’s, support prices establishedunder the federal price support program have been ata level that provides a very limited safety net to farmmilk prices. The result has been increased volatilityof farm milk prices. When farm milk prices are rela-tively high expansions and new entrants increase thesize of the nation’s dairy herd and total milk produc-tion, putting downward pressure on farm milk prices.Falling farm milk prices lead to unfavorable pro-ducer returns, causing some producers to exit dairy-ing and reducing cow numbers and milk production.Dairy producers struggle with managing the risk as-sociated with these volatile milk prices. When milkprices are low dairy producers are under financialstress and experience loss of equity in their opera-tion. When milk prices improve it takes a period oftime to recover and build back lost equity. These upsand downs have turned attention to some type of sup-ply management program that will reduce pricevolatility and prevent the very low milk prices thatcause costly disinvestment.
Public policy issuesSupply management can be defined as a nationalprogram that regulates the level of milk productionto match the demand for milk and dairy products atan acceptable farm milk price level. Supply pro-grams may be either voluntary or mandatory. Volun-tary supply management, like the Milk Diversion andWhole-Herd Buyout programs of the mid-1980’s,typically offer a carrot to encourage participation.
Mandatory supply management uses a stick—penalties for failing to adhere to production limits.Mandatory supply management programs for dairyin the U.S. have long been discussed and debated,but have never come close to being adopted. Butwith increased milk price volatility and a sustainedperiod of very low prices, interest in adopting sometype of mandatory supply management programhas increased.
On the surface, a mandatory supply managementprogram may look rather simple. Some central au-thority calculates the anticipated level of consump-tion at a specified milk price and then makes surethe amount of milk marketed matches consumptionat this price. However, implementing such a programwithin a dairy industry comprised of about 70,000commercial dairy farmers would be a formidableendeavor. In particular, with differences in milkproduction costs among regions of the U.S. andamong individual farmers within a region, decidingon an appropriate farm milk price target would becontentious. And determining the amount of milkproduction that matches domestic consumptionand export sales at the target price would be anenormous challenge.
Because the goal of mandatory supply managementis to restrict milk production to maintain farm milkprices above where they would otherwise be, theright to deliver milk to the market becomes a valu-able possession. Some method must be developed toallocate these rights to current or would-be dairy pro-ducers. As domestic consumption and/or dairy ex-ports grow, questions emerge regarding how thisgrowth should be allocated between current produc-ers and new entrants to the industry. Should thesemarket rights, defined as a base or quota milk vol-ume, be held by individual dairy producers or ownedby the government and allocated through a govern-ment agency? Should the marketing right be freelytransferable from one dairy producer to another orshould the right be tied to the dairy farm? Should themarketing right be on volume of milk or volume ofmilk components marketed?
Mandatory supply management programs can havestructural consequences. The implementation ofmandatory supply management by allocatingbases/quotas to existing dairy producers has the ef-
Mandatory Milk Supply Management
22 DAIRY POLICY ISSUES

fect of stabilizing the current human and physicalcapital base, technology practices, and location ofmilk production. The tendency of mandatory supplymanagement programs is to freeze the structure ofdairy farms and regional milk production. Howbases/quota is transferred determines how quicklythis structure may change. If bases/quotas are freelytransferable and not tied to a specific dairy facility,structural changes would be quicker than those tiedto a facility or region of the U.S.
History of milk supply managementMandatory milk supply management programs havebeen widely discussed and several related bills havebeen introduced in Congress. None of these bills haspassed. Voluntary supply management programshave been implemented, but only temporarily. TheMilk Diversion Program operated from January 1,1984 through May 31, 1985. Under this programdairy producers who voluntarily reduced their milkmarketings from the previous years by 10 to 30 per-cent were paid $10 per hundredweight for the re-duced marketings. Then fromApril 1, 1986 throughAugust 31, 1987 the Dairy Termination program wasin effect. Dairy farmers submitted bids for agreeingto slaughter or export their entire herd of milk cowsand replacement heifers and to remain out of dairy-ing for the next five years.
The depressed milk prices experienced in 2009 againmotivated industry support for some type of milksupply management program. Proposals for both vol-untary and mandatory programs are being discussed,with some proposals drafted into bill form and intro-duced to Congress. Whether there will be sufficientCongressional support and support by dairy farmersto put a supply management program in place is un-certain. In the past, dairy farmer interest in supplymanagement has dwindled if milk prices improveduring Congressional debate on supply managementproposals.
Concerns and issues with mandatorysupply managementMaintaining a milk price and/or reducing pricevolatility different from what normal market forceswould dictate requires careful management of milksupply. A number of decisions need to be made by acentral authority, most likely the US Department ofAgriculture with the possibility of input from an in-
dustry advisory committee. Concerns and issues thatneed to be considered include the following:
• Facilitating change: Dairy markets need to be al-lowed to evolve and change. Successful supply man-agement programs need to contain a mechanism toallow for milk production capacity to adjust as do-mestic consumption and dairy exports change.USDAmust forecast the amount of milk productionneeded for domestic consumption and exports atleast annually and adjust quotas accordingly. In addi-tion, the target milk price under the program needs tobe adjusted from time to time to reflect changes inmilk production costs.
• Transferability: The need to transfer bases andquotas arises when supply controls are in place formore than a year or two as some producers exit theindustry, some want to expand milk production andothers want to enter the industry. The options fortransfer include letting existing dairy producers selland transfer their base and quota to the highest bid-der, perhaps through an organized auction market,having the bases and quota owned and controlled bythe government, or a combination of these two op-tions. Allowing dairy producers to be free to sell andtransfer bases and quotas could lead to a concentra-tion of allowable milk production among a smallnumber of relatively large dairy operations andmaking it extremely difficult for new producersto enter dairying. Politics is likely to enter into asystem where the government controls all transfers.A combination of these options could allow produc-ers to transfer a portion of their base and quota withthe government controlling and transferring theremaining portion to other dairy producers and tonew producers.
Quotas used by some countries also restrict geo-graphic transfers. For example, the EU prohibits thetransfer of quotas between countries. Similarly,Canada restricts transfer between provinces. Such re-strictions prevent milk production to move to areasof growing demand or lower milk production cost
• Capitalization of quota values: Because supplymanagement programs are designed to elevate milkprices or keep them from falling, the first dairy pro-ducers to receive quota “rights to produce” stand toreceive a significant windfall gain. If quotas are al-lowed to be transferred, their value will eventuallyrise to the value of benefits accruing over time. Thisis true whether quotas are tied to farms, cows or just
DAIRY POLICY ISSUES 23
pieces of paper. This capitalization makes it difficultfor new producers to purchase enough quota to enterdairying and increases the cost of dairy expansion byexisting producers. Only a government-owned andcontrolled quota transfer system could eliminate orreduce this capitalization issue. It is doubtful that thismuch government control would be acceptable todairy producers.
• The penalty for over quota production: To en-sure the mandatory supply management holds milkproduction to the level necessary to achieve a highermilk price, there needs to be a penalty for producingand marketing milk in excess of quota. This mostlikely would involve a two-tier pricing system thathas a relatively high price for quota milk and a lowmilk price for over quota milk that is below the vari-able cost of production. But with significant differ-ences in milk production costs among individualdairy producers and regions of the U.S., getting aconsensus on what is an acceptable price for quotamilk and the penalty for over quota milk may be dif-ficult.
• Demand impacts: If supply management increasesaverage farm milk prices, then, average prices formilk and dairy products to consumers will also be
higher. While the demand for milk and dairy prod-ucts is inelastic, consumers do respond to prices andhigher prices mean lower consumption of milk anddairy products. The decision on the level of farmmilk price to maintain must take into considerationthe impact on consumption.
• Imports and exports: The decision on the level offarm milk prices to maintain under supply manage-ment also needs to take into account the impact ondairy imports and dairy exports. A farm price that istoo high may attract additional imports or requiretightened import restrictions. U.S. dairy productscould become less competitive in international mar-kets, reducing export potential.
Endnotes
1Wholesale and retail prices don’t necessarily change by therelative same amount as the farm milk price changes.
24 DAIRY POLICY ISSUES

This paper is lengthier than the other papers inthis series because the issues are more compli-cated. Federal milk marketing orders haveevolved over 75 years. Over that time, there havebeen numerous changes in pricing rules and otherregulations to conform to changes in the dairyindustry. Changes in federal orders have fre-quently been controversial, often because of theirdisparate regional effects.
We begin this paper with a general discussion ofhow federal orders work. We then move to someaspects of orders that have generated recent con-troversy: methods of setting minimum prices formilk used for manufacturing and for moving othermilk prices; level and regional pattern of Class Imilk prices; number of classes and dairy productswithin classes; and regulations related to pooling.
We stress at the outset that our description offederal milk marketing order pricing is simplifiedand abbreviated. Readers looking for more detailshould refer to:
Jesse, Ed, and Bob Cropp, Basic Milk PricingConcepts for Dairy Farmers, Bul. No. A3379,Cooperative Extension, University of Wisconsin-Extension, Sept. 2008.
Milk Pricing Under Federal Milk Market-ing OrdersFederal milk marketing orders regulate the pricing ofabout 65 percent of the Grade Amilk produced in theUnited States.1 Most of the remaining Grade Amilkis regulated by state marketing orders, the largest ofwhich is California’s state order that prices about 21percent of U.S milk. Federal orders require milkplants, called handlers, to pay no less than specifiedminimum prices for milk and milk components ac-cording to how their milk receipts are used; that is,what products they make. This is called classifiedpricing. Producers—who are not regulated under or-ders—are guaranteed minimum prices that representweighted average values of the handler prices. This iscalled market-wide pooling.
Classified pricingFederal orders define four classes of milk, from high-est to lowest value in most cases:
1. Class I milk is used for beverage products. Theseproducts include whole, low-fat and skim milk,chocolate and other flavored milk, liquid buttermilkand eggnog.
2. Class II milk is used for soft manufactured prod-ucts like ice cream and other frozen desserts, cottagecheese and cream products.
3. Class III milk is used for manufacture hard cheesesand cream cheese.
4. Class IV milk is used to make butter and dry milkproducts, principally nonfat dry milk.
USDA announces monthly minimum handler payprices for each of the four classes of milk. accordingto a predefined schedule. Monthly prices for ClassesIII, Class IV, and the butterfat portion of Class II areannounced on the Friday on or before the 5th of themonth following the month to which they apply. Forexample, March 2010 prices were announced on Fri-day, April 2.
Based on the argument that Class I milk products andmost Class II milk products move through the market-ing system within a few days of processing, the mini-mum Class I price and the minimum skim milk pricefor Class II are announced earlier than the Class IIIand IV prices. They are announced by USDA on theFriday on or before the 23rd of the month before themonth to which they apply. This “early warning” isdesigned to allow processors to alter price sheets toretailers and other distributors before the new pricesbecome effective. For example, the March 2010prices were announced on Friday, February 19.
The following table details the Class price announce-ment dates for the month of March 2010.
The Class prices are based on product price formulasthat relate milk component values to: (1) the whole-sale prices of dairy products manufactured from themilk components, (2) the yield of the finished productin terms of the milk components used to make them,and (3) assumed manufacturing costs, or make al-lowances. The volume of components per 100 pounds
Federal Milk Marketing Orders
DAIRY POLICY ISSUES 25
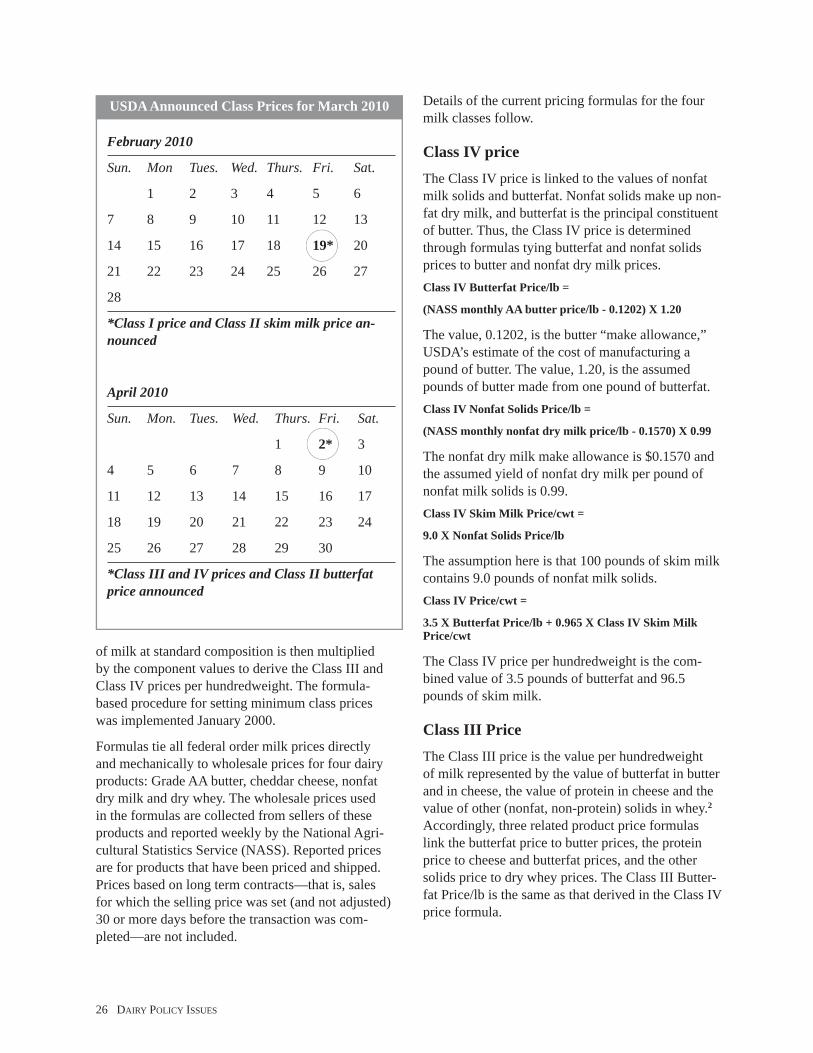
of milk at standard composition is then multipliedby the component values to derive the Class III andClass IV prices per hundredweight. The formula-based procedure for setting minimum class priceswas implemented January 2000.
Formulas tie all federal order milk prices directlyand mechanically to wholesale prices for four dairyproducts: Grade AA butter, cheddar cheese, nonfatdry milk and dry whey. The wholesale prices usedin the formulas are collected from sellers of theseproducts and reported weekly by the National Agri-cultural Statistics Service (NASS). Reported pricesare for products that have been priced and shipped.Prices based on long term contracts—that is, salesfor which the selling price was set (and not adjusted)30 or more days before the transaction was com-pleted—are not included.
Details of the current pricing formulas for the fourmilk classes follow.
Class IV priceThe Class IV price is linked to the values of nonfatmilk solids and butterfat. Nonfat solids make up non-fat dry milk, and butterfat is the principal constituentof butter. Thus, the Class IV price is determinedthrough formulas tying butterfat and nonfat solidsprices to butter and nonfat dry milk prices.Class IV Butterfat Price/lb =
(NASS monthly AA butter price/lb - 0.1202) X 1.20
The value, 0.1202, is the butter “make allowance,”USDA’s estimate of the cost of manufacturing apound of butter. The value, 1.20, is the assumedpounds of butter made from one pound of butterfat.Class IV Nonfat Solids Price/lb =
(NASS monthly nonfat dry milk price/lb - 0.1570) X 0.99
The nonfat dry milk make allowance is $0.1570 andthe assumed yield of nonfat dry milk per pound ofnonfat milk solids is 0.99.Class IV Skim Milk Price/cwt =
9.0 X Nonfat Solids Price/lb
The assumption here is that 100 pounds of skim milkcontains 9.0 pounds of nonfat milk solids.Class IV Price/cwt =
3.5 X Butterfat Price/lb + 0.965 X Class IV Skim MilkPrice/cwt
The Class IV price per hundredweight is the com-bined value of 3.5 pounds of butterfat and 96.5pounds of skim milk.
Class III PriceThe Class III price is the value per hundredweightof milk represented by the value of butterfat in butterand in cheese, the value of protein in cheese and thevalue of other (nonfat, non-protein) solids in whey.2Accordingly, three related product price formulaslink the butterfat price to butter prices, the proteinprice to cheese and butterfat prices, and the othersolids price to dry whey prices. The Class III Butter-fat Price/lb is the same as that derived in the Class IVprice formula.
USDAAnnounced Class Prices for March 2010
February 2010
Sun. Mon Tues. Wed. Thurs. Fri. Sat.
1 2 3 4 5 6
7 8 9 10 11 12 13
14 15 16 17 18 19* 20
21 22 23 24 25 26 27
28
*Class I price and Class II skim milk price an-nounced
April 2010
Sun. Mon. Tues. Wed. Thurs. Fri. Sat.
1 2* 3
4 5 6 7 8 9 10
11 12 13 14 15 16 17
18 19 20 21 22 23 24
25 26 27 28 29 30
*Class III and IV prices and Class II butterfatprice announced
26 DAIRY POLICY ISSUES
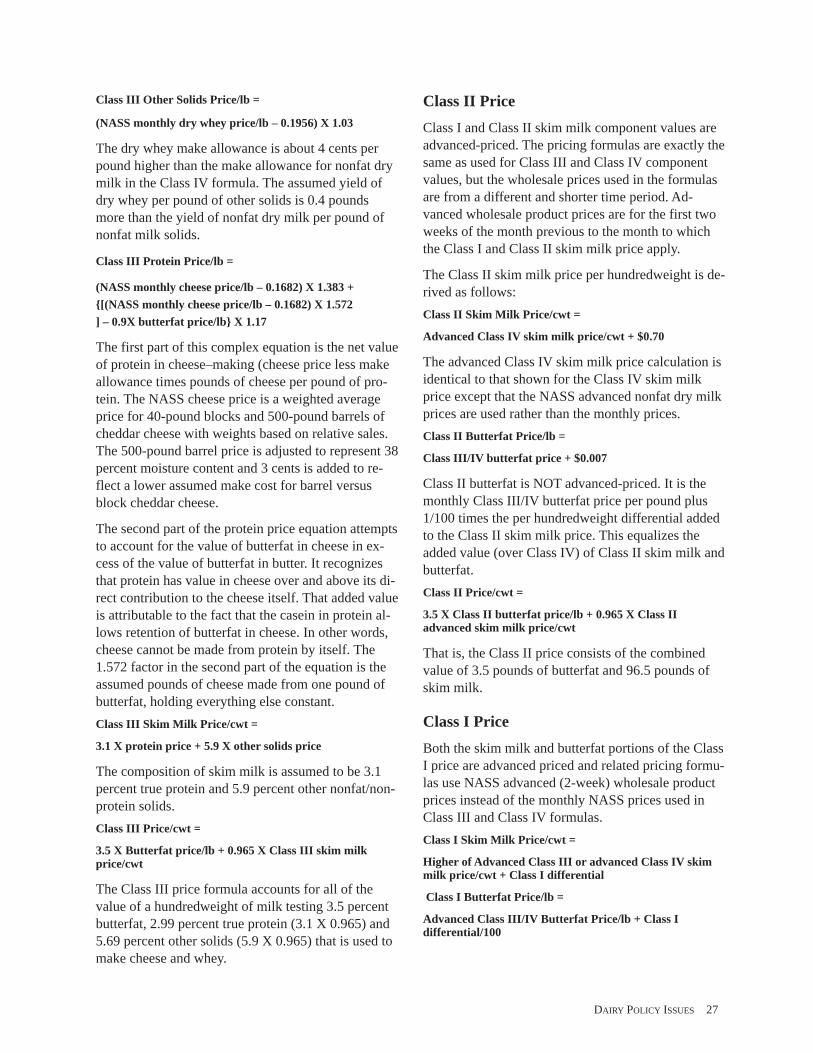
Class III Other Solids Price/lb =
(NASS monthly dry whey price/lb – 0.1956) X 1.03
The dry whey make allowance is about 4 cents perpound higher than the make allowance for nonfat drymilk in the Class IV formula. The assumed yield ofdry whey per pound of other solids is 0.4 poundsmore than the yield of nonfat dry milk per pound ofnonfat milk solids.
Class III Protein Price/lb =
(NASS monthly cheese price/lb – 0.1682) X 1.383 +{[(NASS monthly cheese price/lb – 0.1682) X 1.572] – 0.9X butterfat price/lb} X 1.17
The first part of this complex equation is the net valueof protein in cheese–making (cheese price less makeallowance times pounds of cheese per pound of pro-tein. The NASS cheese price is a weighted averageprice for 40-pound blocks and 500-pound barrels ofcheddar cheese with weights based on relative sales.The 500-pound barrel price is adjusted to represent 38percent moisture content and 3 cents is added to re-flect a lower assumed make cost for barrel versusblock cheddar cheese.
The second part of the protein price equation attemptsto account for the value of butterfat in cheese in ex-cess of the value of butterfat in butter. It recognizesthat protein has value in cheese over and above its di-rect contribution to the cheese itself. That added valueis attributable to the fact that the casein in protein al-lows retention of butterfat in cheese. In other words,cheese cannot be made from protein by itself. The1.572 factor in the second part of the equation is theassumed pounds of cheese made from one pound ofbutterfat, holding everything else constant.Class III Skim Milk Price/cwt =
3.1 X protein price + 5.9 X other solids price
The composition of skim milk is assumed to be 3.1percent true protein and 5.9 percent other nonfat/non-protein solids.Class III Price/cwt =
3.5 X Butterfat price/lb + 0.965 X Class III skim milkprice/cwt
The Class III price formula accounts for all of thevalue of a hundredweight of milk testing 3.5 percentbutterfat, 2.99 percent true protein (3.1 X 0.965) and5.69 percent other solids (5.9 X 0.965) that is used tomake cheese and whey.
Class II PriceClass I and Class II skim milk component values areadvanced-priced. The pricing formulas are exactly thesame as used for Class III and Class IV componentvalues, but the wholesale prices used in the formulasare from a different and shorter time period. Ad-vanced wholesale product prices are for the first twoweeks of the month previous to the month to whichthe Class I and Class II skim milk price apply.
The Class II skim milk price per hundredweight is de-rived as follows:Class II Skim Milk Price/cwt =
Advanced Class IV skim milk price/cwt + $0.70
The advanced Class IV skim milk price calculation isidentical to that shown for the Class IV skim milkprice except that the NASS advanced nonfat dry milkprices are used rather than the monthly prices.Class II Butterfat Price/lb =
Class III/IV butterfat price + $0.007
Class II butterfat is NOT advanced-priced. It is themonthly Class III/IV butterfat price per pound plus1/100 times the per hundredweight differential addedto the Class II skim milk price. This equalizes theadded value (over Class IV) of Class II skim milk andbutterfat.Class II Price/cwt =
3.5 X Class II butterfat price/lb + 0.965 X Class IIadvanced skim milk price/cwt
That is, the Class II price consists of the combinedvalue of 3.5 pounds of butterfat and 96.5 pounds ofskim milk.
Class I PriceBoth the skim milk and butterfat portions of the ClassI price are advanced priced and related pricing formu-las use NASS advanced (2-week) wholesale productprices instead of the monthly NASS prices used inClass III and Class IV formulas.Class I Skim Milk Price/cwt =
Higher of Advanced Class III or advanced Class IV skimmilk price/cwt + Class I differential
Class I Butterfat Price/lb =
Advanced Class III/IV Butterfat Price/lb + Class Idifferential/100
DAIRY POLICY ISSUES 27
The “mover” of Class I skim milk prices is the higherof the advanced Class IV or Class III skim milk price.Class I differentials are specified for each countywithin a federal milk marketing order marketing area.In general, differentials within orders decrease withdistance from the major consumption location withinthe order marketing area. Differentials range from alow of $1.60 per hundredweight for some NorthDakota counties to a high of $6.00 for some Floridacounties.
PoolingPooling is accomplished under federal orders by obli-gating each regulated handler to account for milk re-ceipts according to how the milk was utilized withineach of the four classes. Handlers pay into or drawfrom a producer settlement fund depending on thevalue of their milk receipts priced at order minimumprices relative to the market-wide average value(often called uniform price or blend price). Basically,a Class I bottler would pay into the pool the differ-ence between the higher-valued Class I milk and themarket-wide average value. A Class III handler (e.g.,a cheese plant—called a supply plant under the order)would draw out of the pool the difference between themarket-wide average price and the lower Class IIIprice. Each handler (the exception being dairy coop-eratives) is obligated to pay producers no less than thefederal order market-wide uniform price.
A handler’s obligation under the pooling concept is asfollows:
Class I obligation =Class I skim milk price at location3 X skim milk pounds+ Class I butterfat price at location X butterfat pounds
Class II obligation =Class II nonfat solids price X nonfat solids pounds+ Class II butterfat price X butterfat pounds
Class III obligation =Protein price X protein pounds+ Other solids price X other solids pounds+ Class III/IV Butterfat price X butterfat pounds
Class IV obligation =Nonfat solids price X nonfat solids pounds+ Class III/IV Butterfat price X butterfat pounds
The following items are deducted from the grossvalue of each handler’s milk based on the obligation’snoted above to derive the “net” handler obligation tothe pool:
• Producer price differential (for orders using multiplecomponent pricing)
• Butterfat, Protein and Other Solids value at mini-mum component prices
• Producer location adjustment
• Somatic cell count adjustment value (in someorders)
If the results of subtracting these deductions fromgross milk value is positive (which is normally thecase for a Class I handler), the handler pays the differ-ence into the producer settlement fund. If the result isnegative (as it normally would be for a Class III han-dler), the handler draws the difference from the fund.
The producer price differential (often abbreviated,PPD) applies to the federal orders that pay producerson the basis of milk components marketed—poundsof butterfat, protein and other solids.4 For these ordersthe handler is obligated to pay producers the Class IIIvalues per pound of butterfat, protein and other solidsmarketed by the producer. The PPD is a measure ofhow much the average market-wide value of handlerreceipts exceeds the average value if all milk werepriced at Class III.
The PPD can be approximated by adding the differ-ences between the Class III price and the Class I,Class II and Class IV prices multiplied by the respec-tive percent utilization of milk in the entire pool asClass I, II and IV. For example, in January 2010 theClass III price was $14.50. An estimate of the PPD inJanuary 2010 for the Upper Midwest order would becalculated as follow
($16.83 Class I - $14.50) X 13.0% Class I = $0.3029
($15.22 Class II - $14.50) X 2.6% Class II = $0.0187
($13.85 Class IV - $14.50) X 2.0% Class IV = ($0.0130)
January PPD = $0.3086
The actual PPD will differ from this sum due to otheradjustments in the order pool including transportationcredits, assembly credits and producer milk somaticcell count adjustment.
28 DAIRY POLICY ISSUES

The producer location adjustment accounts for differ-ences in the Class I differential at the receiving plant(plant where milk is processed) and the differential atthe location of the supply plant (plant that suppliesraw milk) for interplant milk shipments.
The somatic cell value relates to price adjustments forquality at the producer level for milk used in Class II,III and IV. Quality is measured by somatic cell countof producer milk relative to a base level of 350,000cells per ml. Since somatic cell count affects cheeseyield, a rate per 1,000 cell count above or below thebase is derived by multiplying the cheese price usedin the protein price formula by 0.0005.5
Handlers’ producer settlement fund payments may beadjusted by transportation credits and assembly cred-its. Transportation credits apply to actual shipmentsof milk for Class I use from supply plants to distribut-ing plants to partially defray the cost of moving themilk to the Class I market. Distributing plants are pri-marily engaged in processing packaged fluid milkproducts. Supply plants are primarily engaged in
manufacturing dairy products, shipping milk to dis-tributing plants on an “as needed” basis and to meetminimum shipping requirements under the applicableorder. Assembly credits are paid to pool plants (dis-tributing plants, supply plants, and cooperatives) onproducer milk that is used for Class I purposes. As-sembly credits provide an additional incentive to“give up” milk for Class I use that may otherwise bedestined for manufacturing. Transportation and as-sembly credits are only paid to handlers on actualmovements of milk to Class I use and are subtractedfrom the total pool proceeds in the process of calcu-lating the PPD. In other words, the total Class I valueis reduced by the amount of these credits.
The producer settlement fund accounting is illustratedin the table below for two handlers using actualUpper Midwest Order January 2010 componentprices, Class I differential and PPD. Both handlershave January milk receipts of 200,000,000 pounds ofmilk with a milk composition of 3.7 percent butterfat,3.08 percent protein and 5.7 percent other solids.
Class of milk, Rate Handler 1 Handler 2deductions and permilk components pound Pounds Value Pounds Value
Class I: Skim milk $0.1162 128,050,000 $14,879,410 3,940,000 $457,828Butterfat $1.5874 1,950,000 $3,095,430 600,000 $952,440
Class II: Nonfat solids $1.1689 2,724,000 $3,184,084 908,000 $1,061,361Butterfat $1.4475 3,990,000 $5,775,525 1,330,000 $1,925,175
Class III: Protein $2.7916 616,000 $1,719,626 4,312,000 $12,037,379Other solids $0.1946 1,140,000 $221,844 7,980,000 $1,552,908Butterfat $1.4405 740,000 $1,065,970 5,180,000 $7,461,790
Class IV: Nonfat solids $1.0148 1,880,000 $1,907,824 940,000 $953,912Butterfat $1.4405 720,000 $1,037,160 290,000 $417,745
Total value for Handler $32,886,873 $26,820,538
Less: deductions from the pool•PPD $0.0026 200,000,000 $520,000 200,000,000 $520,000•Protein value $2.7916 6,160,000 $17,196,256 6,160,00 $17,196,256•Other solids value $0.1946 11,400,000 $2,218,440 11,400,000 $2,218,440•Butterfat value $1.4405 7,400,000 $10,659,700 7,400,000 $10,659,700
Total deductions $30,594,396 $30,594,396
Net to/from the pool $2,292,477 ($3,773,858)
Illustration of Producer Settlement Fund Obligations
DAIRY POLICY ISSUES 29

Handler 1 has milk utilization of 65 percent Class I,15 percent Class II, 10 percent Class III and 10 per-cent Class IV. Handler 2 has milk utilization of 20percent Class I, 5 percent Class II, 70 percent ClassIII and 5 percent Class IV. Both Handlers receivemilk that has an average somatic cell count of350,000, so the somatic cell adjustment is zero.
Handler 1, primarily a bottling plant, has a positivenet pool obligation of $2,292,477 and pays thatamount into the producer settlement fund. Handler 2,primarily a cheese plant, has a negative pool obliga-tion of ($3,773,858) and draws that amount from theproducer settlement fund.6
The Class I price and the Class II skim milk price areannounced about 10 days before the first of the monthto which they apply whereas Class III and Class IVprices are announced a few days after the first of themonth to which they apply. Because of this roughlysix week time difference, the Class III price occasion-ally ends up higher than the Class I price when thereis a large and rapid increase in either the Class III orClass IV price. This “price inversion” results in a neg-ative PPD and reverses the normal pool obligations ofdistributing plants and supply plants—Class III han-dlers pay into the fund and Class I handlers drawfrom the fund. To avoid making producer settlementfund payments, many supply plants “depooled” (be-came unregulated plants) in months when the PPDwas negative, causing considerable market disruption.Recent USDA decisions have tightened rules forpooling and de-pooling.
Producer pricesWith federal order pooling, producers receive a com-mon price for their milk regardless of how their milkis used. Minimum pay prices to producers will differamong plants within an order only according to milkcomposition, milk quality (in orders with a somaticcell count adjustment), and the location of the receiv-ing plant.
In the six orders using multiple component pricing,handlers must pay producers at least the followinggross amount:Individual Producer Total Gross Milk Payment, MultipleComponent Pricing Orders =
Pounds of butterfat marketed X the butterfat price perpound
+ Pounds of protein marketed X the protein price perpound
+ Pounds of other solids marketed X the other solids priceper pound
+ Producer price differential X hundredweights of milkmarketed
+/- Somatic cell adjustment per hundredweight of milkmarketed (if applicable)
In the four federal orders that use fat/skim milk pric-ing, handlers must pay producers at least the follow-ing gross amount:Individual Producer Total Gross Milk Payment, Fat/SkimOrders =
Hundredweights of skim milk marketed X uniform skimmilk price
+ Pounds of butterfat marketed X uniform butterfat price
+/- Hundredweights of milk marketed X plant locationadjustment
The uniform skim milk price is the weighted averageskim milk price from each of the four classes of milkas calculated from the formulas detailed earlier. Theuniform butterfat price is the weighted average butter-fat price from the four classes of milk as calculatedfrom the formulas. The plant location adjustment maybe positive or negative depending upon the locationof the milk plant.
SummaryTen federal milk marketing orders regulate the pricingof about 65 percent of the Grade Amilk marketed byproducers in the United States. Six of these orderspay producers on the basis of milk components mar-keted—butterfat, protein and other solids—and fourpay producers using fat/skim milk pricing. In bothforms of payment, milk component, skim milk, andstandardized whole milk values are determined fromformulas that link these values directly to wholesaleprices for four dairy products: Grade AA butter, ched-dar cheese, nonfat dry milk and dry whey. Wholesaleprices used in the formulas are collected from sellersand reported weekly by the National AgriculturalStatistics Service (NASS). Based on these pricingformulas, USDA announces monthly minimum han-dler pay prices for four use classes of milk. Handlersare obligated to a federal order pool for the value ofthe milk they received based on use class and classprices. In turn, regulated handlers (except dairycooperatives) are required to pay producers no lessthan the announced federal order prices for milk andmilk components.
30 DAIRY POLICY ISSUES
Setting and Moving Class Prices
Historical reviewDuring the 1940’s and 1950’s, individual federal milkmarketing orders used several different methods toestablish minimum class prices. Most orders then hadthree classes: Class III (which included all milk usedto make nonperishable manufactured dairy products),Class II (perishable or fresh products) and Class I(beverage milk). Besides serving as the minimumprice for milk used for manufacturing, the Class IIIprice often served as the base price for Class II andClass I prices.
Economic formulas were used in most orders to deter-mine the base price. These formulas included factorsthat reflected general economic conditions such as in-flation, wholesale prices, and wage rates; supply con-ditions such as feed costs, prices received for all farmproducts, farm wage rates, and stock levels of dairyproducts; and demand conditions such as Class Isales, inflation rate, and consumer income. These fac-tors were weighted to determine an index for makingmonthly adjustments in the base price. Other ordersused selling prices of dairy products such as butterand cheese in product formulas to calculate the baseprice. Because different methods were used to setminimum prices for milk used to make manufactureddairy products, prices varied considerably among fed-eral orders.
By the early 1960’s, this uncoordinated pricing sys-tem began to exhibit problems. Improved transporta-tion systems meant that nonfat dry milk, butter andcheese could be economically transported across thecountry. Using a host of different economic index for-mulas or product formulas resulted in serious pricealignment problems. Midwest manufacturing plantscomplained that “surplus” Grade Amilk not neededfor Class I purposes was being priced lower in theNortheast, placing them at a competitive disadvantagein selling their manufactured dairy products in whatwas increasingly a national market.
The need for uniformity and consistency in federalmilk order pricing provisions was emphasizedthrough a series of federal order hearings. USDA con-cluded that in order to achieve competitive equity,surplus milk had to be priced uniformly among ordersand these prices had to be aligned with competitivepay prices being paid for the majority of the unregu-lated manufacturing grade milk (Grade B) in theUnited States. USDA determined that these objectives
could best be achieved by using the reported Min-nesota-Wisconsin Grade B milk price (M-W price) asthe uniform Class III price. Most of the milk pro-duced in Minnesota and Wisconsin was Grade B andthese two states accounted for the majority of U.Sproduction of Grade B milk. Manufacturing plants inthese two states competed aggressively for Grade Bmilk supplies. Further, since Minnesota and Wiscon-sin represented the major reserve supply area forGrade Amilk for Class I use, national milk supplyand demand conditions were reflected in the M-Wprice.
To achieve orderly marketing, USDA deemed it nec-essary to tie federal order Class II and Class I pricesto the Class III price in a consistent fashion across or-ders. So not only did the M-W price become the com-mon price for Grade Amilk used for manufactureddairy products, it also became the mover of bothClass II and Class I prices. The M-W price was firstused for setting minimum prices paid by regulatedmilk plants (handlers) in the Chicago Regional mar-keting order in 1961 and was gradually adopted byother federal orders during the remainder of the1960’s.
The M-W price was computed by the National Agri-cultural Statistics Service (NASS). It was reported onor before the 5th of each month and applied to GradeB milk delivered during the previous month. Deriva-tion of the M-W price involved a two-stage processinvolving two different surveys of manufacturingmilk plants that purchased Grade B milk in Min-nesota and Wisconsin. In the first stage, base monthprices were estimated from a summary of monthly re-ports from a sample of manufacturing milk plants lo-cated in the two states. The plants reported after theend of the month to which the base month estimateapplied. Hence the base month price was after-the-fact. It represented an estimate of what plants actuallypaid for Grade B milk. The base month price was re-ported by NASS by the fifth of the month two monthsafter the month to which it applied. For example, thebase price for a September M-W would be releasedon or before October 5, and represent the estimatedplant pay prices for August.
In the second stage of the M-W price derivationprocess, NASS surveyed a sub-sample of Minnesotaand Wisconsin Grade B plants. These plants reportedactual pay prices for the first half of the month andestimated pay prices for the second half of the monthto which the M-W price applied. NASS used this in-
DAIRY POLICY ISSUES 31

formation to calculate an estimate of the change in theGrade B prices from the base month to the currentmonth. The change in price was added to (subtractedfrom) the base month price to create the M-W price.
By the late 1980’s, the M-W price had become an in-creasingly unreliable indicator of national supply anddemand conditions for milk used for manufacturingfor several reasons. Competition for Grade B milk inMinnesota and Wisconsin had substantially dimin-ished with steady declines in Grade B milk produc-tion and the number of plants buying Grade B milk.Total milk production in both states had also fallen,resulting in excess manufacturing plant capacity andthe use of various competitive plant premiums andfarm-to-plant hauling subsidies in an attempt to keepplants full. Multiple component pricing was becom-ing more common. And the Upper Midwest region(primarily Minnesota and Wisconsin) was no longerthe only area having reserve Grade Amilksupplies.
A federal order hearing was held in 1992 to explorealternatives to the M-W price. Proposals for othercompetitive pay prices and well as product price for-mulas were offered. USDA recommended that the M-W price be replaced by the Basic Formula Price(BFP). The BFP retained the base-month price fromthe M-W price, but replaced the change in the base-month price with a change in value of manufacturedproducts generated by a product price formula.Specifically, the base month change was the weightedpercentage change in butter, nonfat dry milk, dry but-termilk and cheese prices. The prices used in theproduct price formula were monthly average prices asreported by Dairy Market News and the weights werebased on milk use in Minnesota and Wisconsin. TheBFP went into effect on June 1, 1995.
Federal order reform was later mandated by the Fed-eral Agriculture Improvement and ReformAct of1996. Among other things the Act required USDA toconduct a study on replacing the BFP. The study ana-lyzed several alternatives including another competi-tive pay price series (NASS at this time wascollecting and reporting A/B competitive pay prices),economic formulas and product price formulas.
USDA ultimately recommended using product priceformulas that included make allowances and productyield factors to calculate the minimum monthly pricesfor Class III and Class IV. These formulas replacedthe BFP in January 2000. While the make allowances
and yield factors have changed over time, productprice formulas as described earlier continue to beused today.
Shortly after their adoption, USDA called a hearing toconsider adjustments to the Class III and Class IVproduct price formulas to conform to a Congressionalmandate. Resulting amendments were minor exceptfor a proposed separation of Class III and Class IVbutterfat prices, which was enjoined by a federalcourt before implemented. In Late 2001, USDA is-sued a recommended decision to address the injunc-tion. The department scrapped the separate butterfatclasses and made some smaller changes in the formu-las that became effective two years later.
USDA held another hearing in 2007 to address con-cerns of manufacturing milk plants that make al-lowances were not reflecting increased energy-relatedcosts. Based on this hearing, higher make allowanceswere implemented July 1, 2008.
Product price formula IssuesDo Class III/IV prices reflect national supply and de-mand conditions and plant operating costs for manu-facturing use milk? When federal milk orders usedcompetitive pay prices (the M-W price and the BFP),minimum class prices were tied to competitively-de-termined prices paid by milk plants for manufacturingmilk. There was a certain sense of confidence associ-ated with that linkage, as competition for the milksupply tended to dictate plant margins, profitabilityand viability. Efficient plants making the right prod-ucts attracted milk away from plants that were less-ef-ficient or making products with weak demand. Thisconfidence has waned since 2000 when federal ordersimplemented product price formulas. Formulas derivemilk component values and milk prices through math-ematical equations that employ assumed yields andmanufacturing costs. Milk plants differ significantlywith respect to manufacturing costs and efficiency.Manufacturing costs can quickly change with changesin energy, labor and other costs. The fixed manufac-turing costs in the formulas can only change througha lengthy administrative process. Plants cannot offsethigher manufacturing costs by increasing their sellingprice of cheese, butter or nonfat dry milk—any priceincreases are immediately reflected in higher NASSproduct prices and elevate minimum pay prices forClass III and Class IV milk through the formulas.
Do formulas use the right dairy products? Cheddar
32 DAIRY POLICY ISSUES

cheese, butter, nonfat dry milk and dry whey pricesare used in the current product price formulas.
Do the prices of these products accurately reflect thevalue of milk for Class III and Class IV uses? Ched-dar cheese only represents 32 percent of total cheeseproduction. Not all cheese plants process whey ormake and sell dry whey. Increasingly larger volumesof whey are being processed into value-added prod-ucts such as whey protein concentrates and whey pro-tein isolates. The prices of these value-added productsdon’t necessarily move in concert with dry wheyprices. Dry whey is used to derive the other solidsprice in the Class III formula. When dry whey pricesincreased dramatically in 2007, a higher other solidsprice was responsible for a large part of the elevatedClass III price. As a result, many cheese plants expe-rienced unfavorable operating margins. A similarsituation is occurring with nonfat dry milk. During2007-2008 the U.S. experienced expanding exportsof skim milk powder. Skim milk powder has a differ-ent composition than nonfat dry milk and prices areinfluenced by different factors. But nonfat dry milk isused to derive the nonfat solids price in the Class IVformula.
Are product prices representative? Product price for-mulas require reliable and representative marketprices for dairy products in order to derive accuratecomponent values. Butter and cheese prices are tiedstrongly to wholesale prices on the Chicago Mercan-tile Exchange (CME). But largely because of con-cerns over the thinness of the CME cheese and buttermarkets (few traders and a small percentage of thedairy product actually traded), prices reported byNASS are used instead. NASS collects actual salesprices from reporting plants, but does not includecontract sales with prices longer than 30 days.
Despite criticism of the CME butter and cheese mar-kets, the industry uses CME prices as formal or infor-mal references in establishing actual selling prices forthe vast majority of transactions. This raises impor-tant questions. Do CME prices accurately reflectbroad market conditions or are they subject to manip-ulation? Should the prices in forward pricing con-tracts be included in NASS reporting? Since NASSreported prices lag CME and actual selling prices,would using CME prices in formulas yield Class IIIand Class IV values more responsive to rapidly-changing market conditions? Would some other re-ported prices—such as futures market prices—betterreflect dairy product values?
Alternatives to current product priceformulasThe inherent problems and issues with the currentproduct price formulas have spurred interest in ex-ploring a different means for establishing minimumClass III and Class IV prices and moving prices forClass II and Class III. Some alternatives to considerinclude:
• Amend current product price formulas: Consid-eration could be given to including other products inthe formulas, such mozzarella cheese and whey pro-tein concentrates. However, these products are not asstandardized as is cheddar cheese or dry whey. Also,manufacturing cost could be adjusted more quicklyby indexing input costs such as energy and labor inthe formulas. But the issue of differences in costs andefficiencies among plants remains.
• Use economic index formulas:: As noted earlier,economic index formulas were widely used in settingminimum federal order prices during the 1940’s and1950’s. Economic formulas can consider a large num-ber of factors reflecting general economic conditionsand supply and demand for milk and dairy products.But assigning appropriate weights to factors is anissue and it is uncertain whether prices resultingfrom economic formulas would adequately reflectdairy product market conditions and allow thesemarkets to clear.
• Include milk production costs when settingprices: Dairy producers argue that federal orderprices ought to reflect the cost to produce milk.Changing federal order prices to reflect changes inmilk production costs would reduce the price risknow faced by dairy producers. This could very wellspur expanded milk production beyond market needsand increase government cost under the dairy prod-ucts price support program, or necessitate some typeof government supply management. Further, milkproduction costs vary considerably among dairy pro-ducers within and across regions. Using an averagecost of production would favor low cost producersand regions and could still be judged inadequate byproducers in high cost regions.
• Return to a competitive pay price:With practi-cally all of the nation’s milk production Grade A,there is not enough Grade B milk to base a competi-tive pay price. Not all Grade Amilk is regulatedunder orders, but unregulated Grade Amilk may notbe produced in areas of strong plant competition for
DAIRY POLICY ISSUES 33
milk. Areas where most of the regulated Grade Amilkis used to make manufactured dairy products and suf-ficient plant competition exist could be considered fordetermining a competitive Grade A pay price. Regu-lated manufacturing milk plants could be exemptedfrom paying minimum Class III and Class IV prices.The actual pay price by these exempt plants couldthen be used as the competitive pay prices for settingthe minimum Class III and Class IV prices and mov-ing Class I and Class II. To be feasible, this optionwould need to include some provision for exemptmanufacturing plants to share in the federal orderpool.
• Pool differentials/no minimum Class III andClass IV price: Under this option there would be noestablished monthly minimum plant pay prices forClass III and Class IV milk. Milk plants would paywhatever market competition dictated and reportClass III and Class IV milk volumes to the federalorder pool. Milk plants with Class I and Class II milkwould pay into the federal order pool the respectiveClass I and Class II differentials on Class I and ClassII milk volumes. The sum of this Class I and Class IIdifferential revenue would be divided by the total vol-ume of milk in the pool to determine a market wideuniform Class I/II value per hundredweight to be paidto dairy producers. Under competition the low costand more efficient plants would most likely drive ac-tual pay prices. Without announced minimum pricesfor Class I and Class II milk, dairy cooperatives couldfind it more difficult to negotiate over order premi-ums. The cost of raw milk to competing Class I bot-tlers could also differ among bottlers.
• Set prices through Federal order hearings: Fed-eral order prices could be determined by havingUSDA periodically hold hearings and issue minimumprices based on the hearing record. Hearings could betime consuming and costly for regulated handlers.Further, unless hearings were held frequently, estab-lished minimum prices could become quickly out ofdate.
Setting Class I differentialsHistorical reviewThe following criteria have been used in the past toestablish Class I differentials:
• The additional cost of meeting Grade A (versusGrade B) standards.7
• Costs of transporting milk from areas of production
to areas of consumption.• Cost of producing milk in the supply area.• Supply and demand for milk, including the cost ofalternative supplies.
Class I differentials are set for each federal order andaligned between orders. Within a market area differ-entials decrease with distance from a major consump-tion location. This is to partially account for the costof moving milk to the consumption location. Align-ment of Class I differentials between federal orderswas intended to assure orderly movement of milkfrom reserve areas to deficit areas when needed.
By the early 1960’s it was recognized that improvedtransportation and packaging technology had mademarkets for manufacturing dairy products national inscope. Federal orders were gradually amended to usethe same minimum price for manufacturing usemilk—Class III—in all orders and to use the Class IIIprice to move the Class I price. The Minnesota-Wis-consin (M-W) Grade B price series was initiallyadopted to serve this purpose.
Over time, Class I differentials were set to establishEau Claire, Wisconsin, as a single basing point toalign Class I prices among orders east of the RockyMountains. In the 1960s, Wisconsin and Minnesotawere the principal source of reserve Grade Amilkwhen need to provide supplemental milk for fluid usein other markets. Class I differentials increased about15 cents per hundredweight per 100 miles with dis-tance from Eau Claire, which was roughly equivalentto hauling costs for bulk milk shipments. These dif-ferentials remained unchanged from 1968 to 1985 de-spite increases in transportation costs. The rationalefor keeping differentials constant was that Federalorder prices were minimum prices, and dairy coopera-tives could negotiate premiums to cover the addedcost of transporting milk. Further, less and less re-serve Grade Amilk from the Upper Midwest wasneeded to supply distant markets.
In 1985, Congress passed legislation that increaseddifferentials for federal order markets distant from theUpper Midwest. By the late 1980s, milk production inthe traditional dairy states like Minnesota and Wis-consin was stabilizing or declining while milk pro-duction in some other states with much higher Class Idifferentials, for example Texas, was increasing. Re-serve supplies of milk for Class I use outside of theUpper Midwest were also increasing.
The Upper Midwest charged that higher Class I dif-
34 DAIRY POLICY ISSUES

ferentials were encouraging expanded milk produc-tion not needed for Class I. The excess milk wasbeing allocated to manufactured dairy products, low-ering market prices and producer milk prices in areaswhere the majority of milk was used to make manu-factured dairy products. In 1990, USDA held a na-tional federal order hearing to review Class I pricing.USDA’s decision was to retain existing Class I differ-entials. A suit challenging the legality of Class I dif-ferentials was filed by the Minnesota Milk ProducersAssociation in early 1990. The suit was ultimatelydismissed in 1999 after several appeals, reversals, andremands.
The Federal Agricultural Improvement and ReformAct of 1996 mandated federal order reform includinga review of the structure of Class I differentials. Afterextensive study, USDA issued a final rule for a muchflatter Class I price structure. The final rule was ap-proved by producers in an August 1999 referendum.However, before the modified price surface could beimplemented, Congress intervened, passing legisla-tion that required USDA to adopt a price surface moresimilar to the status quo.
A federal order hearing was held in May 2007 to con-sider proposals to raise Class I differentials in threedeficit federal orders—Florida, Southeast and Ap-palachian. Justification for the increases was to attractand allocate Grade Amilk to Class I needs. USDA is-sued an interim final rule granting the proposed in-creases in March, 2008. These increases changed thealignment of Class prices in adjoining orders, leadingto requests for hearings to increase Class I differen-tials in these orders as well.
Issues with Class I differentialsExisting Class I differentials range from $1.60 perhundredweight in parts of the Upper Midwest order to$6.00 for Miami. Considering the availability of milksupplies nationally and the ability to transport rawmilk as well as packaged beverage milk products, therationale for these differentials can be questioned onseveral grounds:
• Adequacy of milk supplies for Class I needs: In2009, Class I utilization for the 10 existing orders av-eraged 37 percent with a high of 86 percent for theFlorida order to a low of 14 percent for the UpperMidwest order. Only three of the 10 orders—Florida,Appalachian and Southeast—have insufficient localsupplies of milk to meet Class I needs year-round.
There are considerable seasonal differences in the ad-equacy of local milk supplies in these three markets,with major shortages in mid-summer and early falland excess supplies during the winter and spring. Butregardless of season, the national supply of Grade Amilk to meet fluid needs is more than ample. Theissue here is whether the geographical structure ofClass I prices should encourage an adequate supply offluid milk at the local level or at the national level.
• Preference for local milk: Related to the issueabove is whether consumers prefer local milk to milkacquired from distant markets and what cost they arewilling to bear to promote local self-sufficiency influid milk. Contrary to the early days of federal or-ders, modern transportation and packaging methodsallow raw milk and packaged beverage milk to betransported long distances without negatively affect-ing milk quality. This calls into question the need tohave local milk supplies to assure wholesome fluidmilk products. And even if local supplies are judgedto be preferable, it is doubtful that Class I differentialsin seasonally-deficit milk markets can be increasedenough to achieve year-round self-sufficiency withoutencountering serious inefficiencies. Year-round self-sufficiency would require higher costs to either trans-port milk out of the market during seasonal surplusperiods or to construct and operate manufacturingplants to handle the seasonal surplus locally. Ratherthan increasing Class I differentials to induce high-cost local production, would obtaining milk fromreserve markets be a better option?
• Single basing point: The Upper Midwest is nolonger the major source of reserve Grade Amilk. Therelated question is why Class I differentials should in-crease with distance from the Upper Midwest to re-flect the cost of transporting raw milk that is seldomif ever transported. Should multiple basing points beestablished to reflect the location of other reserve sup-plies?
• Allocating Grade A supplies to Class I use:Grade Amilk supplies are more than adequate forClass I needs and Class I differentials result in Class Itypically being the highest class price. Nevertheless,Class I needs are not always readily satisfied, even inlow Class I utilization markets. Regulated manufac-turing plants within in an order market area are oftenreluctant to give up milk to Class I bottlers. Thisproblem is most serious during summer and fallmonths, when milk production is seasonally low andmanufacturing plants need to build inventory of butter
DAIRY POLICY ISSUES 35
and cheese for fall and early winter sales. Plus operat-ing a plant at significantly less than capacity increasesaverage manufacturing costs. Increasing Class I dif-ferentials is not likely to remedy this problem. Othermeans need to be considered such as imposing ship-ping requirements on supply plant to meet Class Ineeds, implementing market administrator “call”provisions to require supply plants to ship milk whenneeded, providing adequate transportation allowancesfor transporting milk to bottlers and compensatingsupply plants for the cost of operating at reducedcapacity. Similar means need to be considered forallocating reserve milk supplies to deficit markets.
• Negotiated over order premiums: Federal orderprices are minimum prices and not always effectiveprices. This allows for dairy cooperatives supplyingfluid milk plants to negotiate premiums that reflectmarket conditions and compensate for costs associ-ated with transporting milk, balancing functions andother market wide services. The vast majority ofGrade Amilk is marketed by dairy cooperatives.The question is, do higher Class I differentials reducethe ability of dairy cooperatives to negotiate premi-ums, and if so, would raising differentials reducetheir ability to perform market-wide services thatenhance the ability of federal orders to meet theirstated objectives?
Number of Milk ClassesAs part of federal milk marketing order reform man-dated by the 1996 Farm Bill, federal orders estab-lished four uniform classes of milk use. Dairyproducts within each of the four use classes weredefined identically across all federal orders. The ap-propriateness of this four class system is now beingquestioned. A key question relates to the relative priceelasticity of demand for various dairy products. Theassumption that demand for beverage milk is moreinelastic that the demand for manufactured dairyproducts is the basis for price discrimination—settinga higher minimum price for milk assigned to bever-age use. Is that assumption still valid? Another issueis what products to use in setting classified prices inpricing formulas. Hundreds of cheese varieties aremade today, yet only cheddar cheese is considered inestablishing the minimum Class III price. Moderntechnology allows milk components to be separatedinto refined components for a variety of uses in milkproducts and other food products. Some argue thatthere ought to be more classes to reflect this much
broader use of milk and milk components. Othersargue that there is already too much difficulty andcontroversy over how to establish minimum prices forthe four classes currently used, and any expansion ofclasses would only make matters worse. It would beextremely difficult, if not impossible to establish sep-arate classes for all of the possible uses of milk andsetting the appropriate minimum pay price for eachclass. Attempting to do so may be over-regulation ofmilk pricing. Some are suggesting a better approachmay be to return to the two class system, one for bev-erage use milk and one for milk used for all types ofmanufactured dairy products including existing ClassII products.
Historical review of multiple classesWhile it was institutionalized with federal and statemilk marketing orders, classified pricing pre-dates or-ders. In the 1920’s, some dairy cooperatives imple-mented a two class pricing system in an attempt toreduce the seasonal swings in milk prices. A higherprice was negotiated for milk used for beverage pur-poses and a lower price for milk used to manufactur-ing dairy products, primarily cheese and butter. Withbeverage milk having a more inelastic demand thanmanufactured dairy products the average milk pricewas higher under this two class system than under flatpricing. However, dairy cooperatives lacking suffi-cient market share of raw milk had limited success inholding all milk plants to a two price system. Dairycooperatives as well as milk plants in general sup-ported the passage of the Agricultural MarketingAgreement Act of 1937 which authorized federal milkmarketing orders.
Initially, federal orders used a two class system, onefor beverage use milk (Class I) and another for allmanufacturing use milk (Class II), with Class I pricedhigher than Class II. Factors justifying the higherClass I price were: beverage milk has a more inelasticdemand than manufactured dairy products so charg-ing a higher price benefits producers through pricediscrimination; milk for beverage use must be GradeA, so producers should be compensated for the highercost to produce Grade A versus Grade B milk; andproducers should be compensated for the higher costof transporting Grade Amilk to city bottling plantsrather than to the corner creamery or cheese factory.
Later, a third class was added for milk used to manu-facture soft products such as ice cream, cream prod-
36 DAIRY POLICY ISSUES
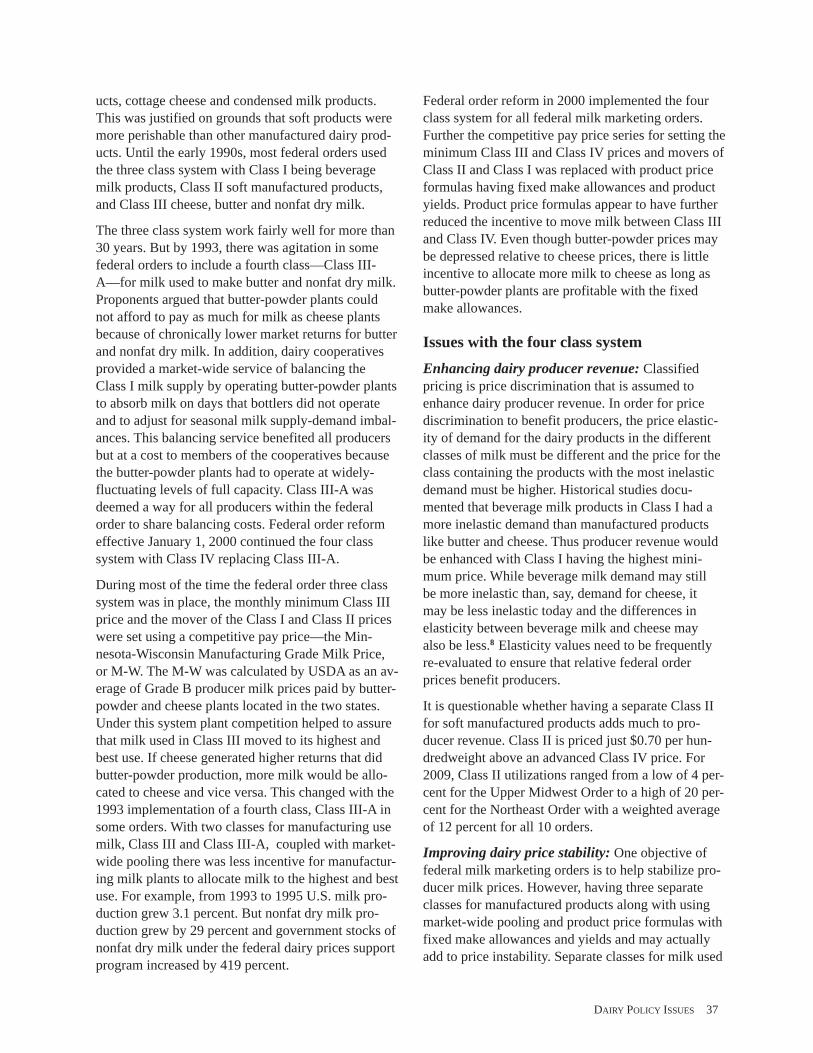
ucts, cottage cheese and condensed milk products.This was justified on grounds that soft products weremore perishable than other manufactured dairy prod-ucts. Until the early 1990s, most federal orders usedthe three class system with Class I being beveragemilk products, Class II soft manufactured products,and Class III cheese, butter and nonfat dry milk.
The three class system work fairly well for more than30 years. But by 1993, there was agitation in somefederal orders to include a fourth class—Class III-A—for milk used to make butter and nonfat dry milk.Proponents argued that butter-powder plants couldnot afford to pay as much for milk as cheese plantsbecause of chronically lower market returns for butterand nonfat dry milk. In addition, dairy cooperativesprovided a market-wide service of balancing theClass I milk supply by operating butter-powder plantsto absorb milk on days that bottlers did not operateand to adjust for seasonal milk supply-demand imbal-ances. This balancing service benefited all producersbut at a cost to members of the cooperatives becausethe butter-powder plants had to operate at widely-fluctuating levels of full capacity. Class III-A wasdeemed a way for all producers within the federalorder to share balancing costs. Federal order reformeffective January 1, 2000 continued the four classsystem with Class IV replacing Class III-A.
During most of the time the federal order three classsystem was in place, the monthly minimum Class IIIprice and the mover of the Class I and Class II priceswere set using a competitive pay price—the Min-nesota-Wisconsin Manufacturing Grade Milk Price,or M-W. The M-W was calculated by USDA as an av-erage of Grade B producer milk prices paid by butter-powder and cheese plants located in the two states.Under this system plant competition helped to assurethat milk used in Class III moved to its highest andbest use. If cheese generated higher returns that didbutter-powder production, more milk would be allo-cated to cheese and vice versa. This changed with the1993 implementation of a fourth class, Class III-A insome orders. With two classes for manufacturing usemilk, Class III and Class III-A, coupled with market-wide pooling there was less incentive for manufactur-ing milk plants to allocate milk to the highest and bestuse. For example, from 1993 to 1995 U.S. milk pro-duction grew 3.1 percent. But nonfat dry milk pro-duction grew by 29 percent and government stocks ofnonfat dry milk under the federal dairy prices supportprogram increased by 419 percent.
Federal order reform in 2000 implemented the fourclass system for all federal milk marketing orders.Further the competitive pay price series for setting theminimum Class III and Class IV prices and movers ofClass II and Class I was replaced with product priceformulas having fixed make allowances and productyields. Product price formulas appear to have furtherreduced the incentive to move milk between Class IIIand Class IV. Even though butter-powder prices maybe depressed relative to cheese prices, there is littleincentive to allocate more milk to cheese as long asbutter-powder plants are profitable with the fixedmake allowances.
Issues with the four class systemEnhancing dairy producer revenue: Classifiedpricing is price discrimination that is assumed toenhance dairy producer revenue. In order for pricediscrimination to benefit producers, the price elastic-ity of demand for the dairy products in the differentclasses of milk must be different and the price for theclass containing the products with the most inelasticdemand must be higher. Historical studies docu-mented that beverage milk products in Class I had amore inelastic demand than manufactured productslike butter and cheese. Thus producer revenue wouldbe enhanced with Class I having the highest mini-mum price. While beverage milk demand may stillbe more inelastic than, say, demand for cheese, itmay be less inelastic today and the differences inelasticity between beverage milk and cheese mayalso be less.8 Elasticity values need to be frequentlyre-evaluated to ensure that relative federal orderprices benefit producers.
It is questionable whether having a separate Class IIfor soft manufactured products adds much to pro-ducer revenue. Class II is priced just $0.70 per hun-dredweight above an advanced Class IV price. For2009, Class II utilizations ranged from a low of 4 per-cent for the Upper Midwest Order to a high of 20 per-cent for the Northeast Order with a weighted averageof 12 percent for all 10 orders.
Improving dairy price stability: One objective offederal milk marketing orders is to help stabilize pro-ducer milk prices. However, having three separateclasses for manufactured products along with usingmarket-wide pooling and product price formulas withfixed make allowances and yields and may actuallyadd to price instability. Separate classes for milk used
DAIRY POLICY ISSUES 37
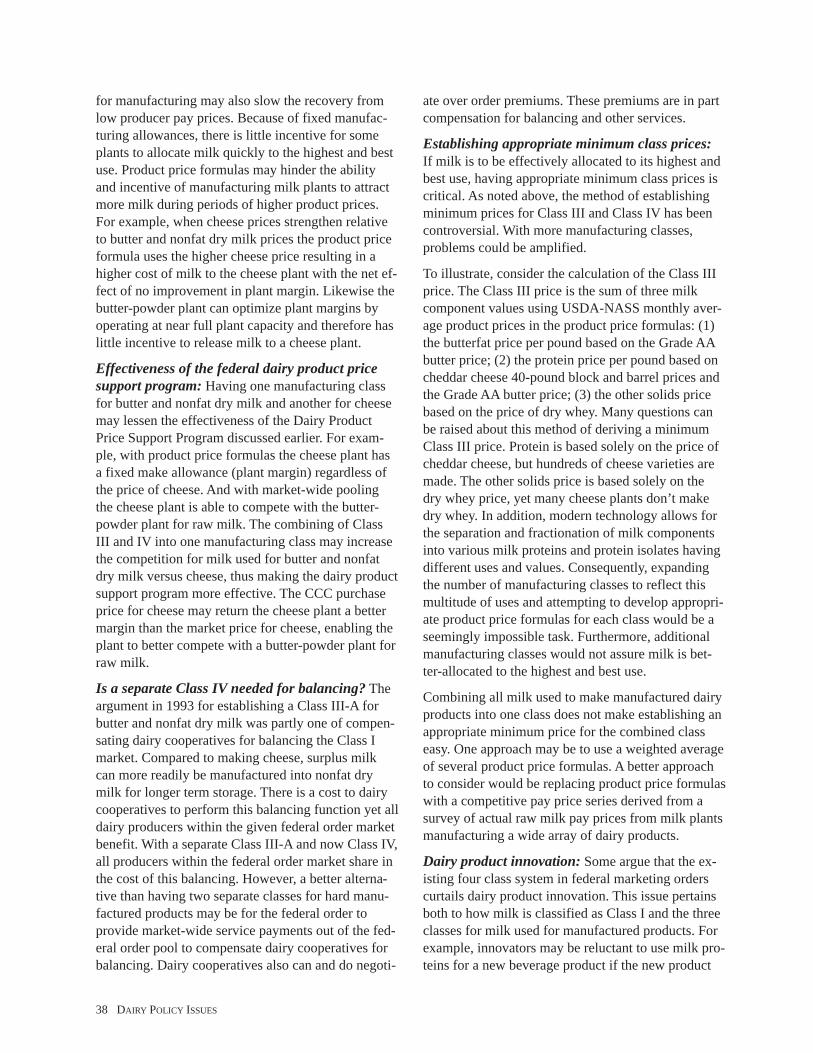
for manufacturing may also slow the recovery fromlow producer pay prices. Because of fixed manufac-turing allowances, there is little incentive for someplants to allocate milk quickly to the highest and bestuse. Product price formulas may hinder the abilityand incentive of manufacturing milk plants to attractmore milk during periods of higher product prices.For example, when cheese prices strengthen relativeto butter and nonfat dry milk prices the product priceformula uses the higher cheese price resulting in ahigher cost of milk to the cheese plant with the net ef-fect of no improvement in plant margin. Likewise thebutter-powder plant can optimize plant margins byoperating at near full plant capacity and therefore haslittle incentive to release milk to a cheese plant.
Effectiveness of the federal dairy product pricesupport program: Having one manufacturing classfor butter and nonfat dry milk and another for cheesemay lessen the effectiveness of the Dairy ProductPrice Support Program discussed earlier. For exam-ple, with product price formulas the cheese plant hasa fixed make allowance (plant margin) regardless ofthe price of cheese. And with market-wide poolingthe cheese plant is able to compete with the butter-powder plant for raw milk. The combining of ClassIII and IV into one manufacturing class may increasethe competition for milk used for butter and nonfatdry milk versus cheese, thus making the dairy productsupport program more effective. The CCC purchaseprice for cheese may return the cheese plant a bettermargin than the market price for cheese, enabling theplant to better compete with a butter-powder plant forraw milk.
Is a separate Class IV needed for balancing? Theargument in 1993 for establishing a Class III-A forbutter and nonfat dry milk was partly one of compen-sating dairy cooperatives for balancing the Class Imarket. Compared to making cheese, surplus milkcan more readily be manufactured into nonfat drymilk for longer term storage. There is a cost to dairycooperatives to perform this balancing function yet alldairy producers within the given federal order marketbenefit. With a separate Class III-A and now Class IV,all producers within the federal order market share inthe cost of this balancing. However, a better alterna-tive than having two separate classes for hard manu-factured products may be for the federal order toprovide market-wide service payments out of the fed-eral order pool to compensate dairy cooperatives forbalancing. Dairy cooperatives also can and do negoti-
ate over order premiums. These premiums are in partcompensation for balancing and other services.
Establishing appropriate minimum class prices:If milk is to be effectively allocated to its highest andbest use, having appropriate minimum class prices iscritical. As noted above, the method of establishingminimum prices for Class III and Class IV has beencontroversial. With more manufacturing classes,problems could be amplified.
To illustrate, consider the calculation of the Class IIIprice. The Class III price is the sum of three milkcomponent values using USDA-NASS monthly aver-age product prices in the product price formulas: (1)the butterfat price per pound based on the Grade AAbutter price; (2) the protein price per pound based oncheddar cheese 40-pound block and barrel prices andthe Grade AA butter price; (3) the other solids pricebased on the price of dry whey. Many questions canbe raised about this method of deriving a minimumClass III price. Protein is based solely on the price ofcheddar cheese, but hundreds of cheese varieties aremade. The other solids price is based solely on thedry whey price, yet many cheese plants don’t makedry whey. In addition, modern technology allows forthe separation and fractionation of milk componentsinto various milk proteins and protein isolates havingdifferent uses and values. Consequently, expandingthe number of manufacturing classes to reflect thismultitude of uses and attempting to develop appropri-ate product price formulas for each class would be aseemingly impossible task. Furthermore, additionalmanufacturing classes would not assure milk is bet-ter-allocated to the highest and best use.
Combining all milk used to make manufactured dairyproducts into one class does not make establishing anappropriate minimum price for the combined classeasy. One approach may be to use a weighted averageof several product price formulas. A better approachto consider would be replacing product price formulaswith a competitive pay price series derived from asurvey of actual raw milk pay prices from milk plantsmanufacturing a wide array of dairy products.
Dairy product innovation: Some argue that the ex-isting four class system in federal marketing orderscurtails dairy product innovation. This issue pertainsboth to how milk is classified as Class I and the threeclasses for milk used for manufactured products. Forexample, innovators may be reluctant to use milk pro-teins for a new beverage product if the new product
38 DAIRY POLICY ISSUES

will be classified as Class I. This could make theproduct more costly than using vegetable proteinsas an alternative. Deriving a minimum pay price foreach separate manufacturing use of milk may havesimilar effect, especially if the correct milk productsor milk components are not considered. Milk compo-nent values do not always move together. For exam-ple, in 2007 the price of dry whey increased substan-tially relative to prices for whey protein concentrates.Since only dry whey is used in the Class III calcula-tion, milk plants making whey protein concentrateswere at a competitive disadvantage to those makingdry whey. Perhaps this problem could be minimizedby a change in the Class III product price formula.But federal milk marketing orders disincentives todairy product innovation can best be eliminated byhaving one manufacturing milk class and using sometype of competitive pay price to set the minimumclass price.
PoolingPooling issues have been frequent topics of discus-sion, especially since federal order reform was imple-mented in January 2000. Particularly controversial aredepooling and distant pooling, both of which affectfederal order producer prices. Numerous questionshave been raised related to what is pooling, whichproducers are eligible to share in federal order pools,what is a pool milk plant, how do regulated manufac-turing milk plants decide to pool or depool, and howdoes pooling affect producer pay prices, in particularthe producer price differential (PPD) and the uniformprice.
The terms pool, pooled and pooling have severalmeanings within federal orders, which leads to someconfusion. Pooling refers to both milk and money. Afederal order milk pool refers to the amount of milkeligible to share in the federal order money pool. Afederal order money pool is the amount of moneygenerated by applying minimum federal order Classprices to the amount of milk used in each Classwithin an order.
Each federal order has a marketing area. Amarketingarea is defined as a geographical area where fluidmilk plants compete for sales of Class I milk.9 Themarketing area is not where milk is produced; it iswhere fluid milk is sold. Pooling involves the associa-tion of both locally produced milk (milk producedwithin the market area) and more distant milk withpool plants.
Three types of milk handlers can be designated poolplants under an order:
1) Distributing plants: Plants that process, packageand sell beverage milk products within the designatedmarketing area. Distributing plants may procure milkdirectly from producers or obtain milk from supplyplants and cooperatives.
2) Supply plants: Plants that supply raw Grade Amilk to distributing plants. These are manufacturingmilk plants, like cheese plants, that procure milk di-rectly from producers or obtain milk from coopera-tives. While engaged primarily in manufacturing,supply plants help assure an adequate supply of milkfor fluid purposes by carrying a fluid milk reserves.Supply plants also provide a balancing service bymanufacturing milk that is not needed for fluid pur-poses on days when bottling plants are not operatingand handling seasonal surpluses.
3) Dairy cooperatives: Some dairy cooperatives bot-tle milk and others have manufacturing facilities.Other cooperatives are involved in exclusively in rep-resenting their members in negotiations with propri-etary firms. Dairy cooperatives, like other handlersare obligated to the federal order pool for the estab-lished minimum prices. But, cooperatives are not ob-ligated to pay their member-producers the orderminimum producer prices. Cooperatives often “re-blend” the proceeds from milk sales across two ormore federal order markets and pay their membersprices in different regions that reflect different com-petitive conditions.
Whether or not a milk plant or dairy cooperative is apool plant, i.e., a regulated handler under a specificfederal order, hinges on whether the plant meets theorder’s performance requirements. Performance re-quirements for distributing plants are different fromthose applying to supply plants and cooperatives. Fordistributing plants, performance requirements pertainto the percentage of the plant’s packaged milk that isdistributed within the marketing area. If the distribut-ing plant meets the required minimum distributionpercentage under the order, it is pooled—there is nochoice in the matter. Pooling is required because fed-eral orders assure that all fluid milk handlers have thesame minimum cost of raw Grade Amilk to preventone handler from gaining a competitive advantageover another in processing and selling packaged milkwithin the market area.
DAIRY POLICY ISSUES 39

For supply plants and dairy cooperatives, perform-ance requirements are called shipping requirements,and relate to the percentage of their milk receipts thatmust be shipped to a distributing plants. But, unlikedistributing plants, supply plants and cooperatives candecide whether they wish to meet the shipping re-quirements or not. The minimum shipping percent-ages required of supply plants or cooperatives vary byfederal milk order. Shipping requirements dependupon the local supply of milk in relation to Class Imilk needs. In federal milk orders with relatively highClass I utilization, like the Southeast, Appalachianand Florida orders, the shipping requirements arehigher than orders with relatively low Class I utiliza-tion, like the Upper Midwest order.
Shipping requirements also may vary by months ofthe year. In the South and Southeast milk productionis very seasonal, with production dropping off sub-stantially during summer and fall to the point that lo-cally produced milk is short of meeting Class I needsand some distant milk must be purchased by distribut-ing plants. Shipping requirements are higher duringthose months.
The incentive for supply plants and dairy coopera-tives to meet shipping requirements and becomepooled under a given order is sharing in the order’smoney pool. Each regulated handler is obligated topay the established monthly minimum prices for thefour classes of milk according to their milk receiptsfor the month, which makes up the federal ordermoney pool. The federal order money pool is dividedby the federal order milk pool to derive a weightedaverage value of milk for the entire order, called uni-form price. All pool handlers within the order payproducers this same uniform price.
Producers affiliated with pooled handlers individuallyreceive this uniform price (adjusted for milk composi-tion and quality), regardless of how their milk handleruses the producers’ milk (i.e., to which Class theirmilk is assigned. This is possible through the use of aproducer settlement fund. The federal order marketadministrator calculates the weighted average valueof milk for each pooled plant, applying the minimumclass prices to the volume of milk used by the handlerin each class. If a handler’s weighted average milkvalue is greater than the uniform price for the entireorder (usually a Class I bottler), then the handler willpay the difference into a producer settlement fund,that is the difference multiplied by the handler’s pro-
ducer deliveries for the month. If the handler’sweighted average milk value is less than the uniformprice for the entire order (usually a manufacturingplant such as a cheese plant), then the handler drawsout of the producer settlement fund the differencetimes its producer deliveries.
Eligibility to receive this pool draw is the primaryreason that cheese plants seek pool status under theorder. These plants are interested in making cheese,not supplying milk for Class I use. But their limitedcommitment to service the Class I market and the as-sociated pool draw provides them with revenue to paytheir producers beyond what they receive from sellingcheese and whey.
Issues with poolingMajor pooling issues concern what milk can or mustbe pooled, both locally produced milk and distantmilk, and depooling.
Pooling locally produced milk. A major objective offederal milk marketing orders is to assure consumersof an adequate supply of Grade Amilk for beverageuse. When federal orders were initially implemented,the majority of milk produced was Grade B, whichwas not eligible for use in packaged fluid milk prod-ucts. Grade Amilk received a premium above GradeB. Through time, the differences between Grade Band Grade A standards narrowed. In the 1950’s, themovement from can-shipped milk to bulk milk tankson the farm often required modernization of the milkhouse which helped Grade B producers to meet GradeA standards. With premiums paid for Grade Amilk,the narrowing of Grade B and Grade A standards andconversion to bulk tanks, more and more of the milkproduction became Grade A. Today, 97 percent ofnation’s milk production is Grade A and eligible tobe pooled under a federal milk order. But, of the 10existing federal orders only three—the Appalachian,Southeast and Florida orders—have Class I utilizationof 65 percent or higher with an average of 37 percentacross all 10 orders. In six of the federal orders ClassIII utilization exceeds or is close to the Class I utiliza-tion. In general there is more Grade Amilk pooledunder federal orders than what is required to meetClass I needs and having a reasonable Grade A re-serve. As more and more Grade Amilk becamepooled under a federal order the Class I utilization de-clined lowering the uniform price paid to producersassociated with a regulated handler.
40 DAIRY POLICY ISSUES
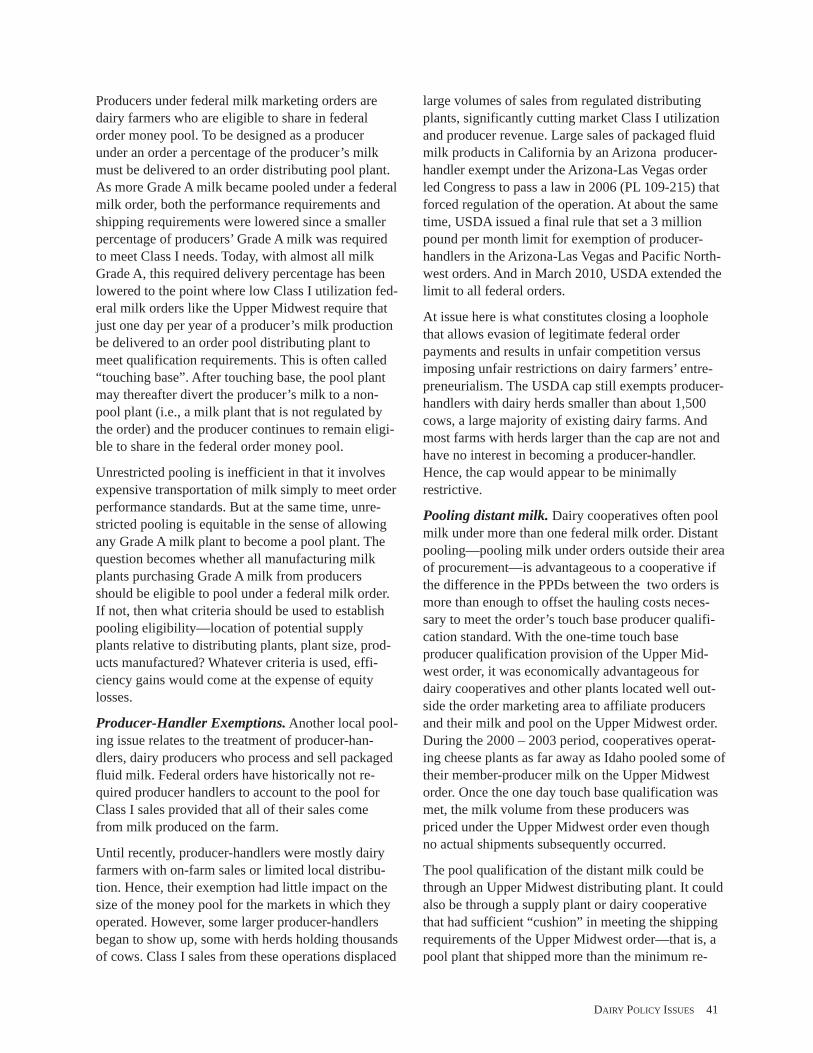
Producers under federal milk marketing orders aredairy farmers who are eligible to share in federalorder money pool. To be designed as a producerunder an order a percentage of the producer’s milkmust be delivered to an order distributing pool plant.As more Grade Amilk became pooled under a federalmilk order, both the performance requirements andshipping requirements were lowered since a smallerpercentage of producers’ Grade Amilk was requiredto meet Class I needs. Today, with almost all milkGrade A, this required delivery percentage has beenlowered to the point where low Class I utilization fed-eral milk orders like the Upper Midwest require thatjust one day per year of a producer’s milk productionbe delivered to an order pool distributing plant tomeet qualification requirements. This is often called“touching base”. After touching base, the pool plantmay thereafter divert the producer’s milk to a non-pool plant (i.e., a milk plant that is not regulated bythe order) and the producer continues to remain eligi-ble to share in the federal order money pool.
Unrestricted pooling is inefficient in that it involvesexpensive transportation of milk simply to meet orderperformance standards. But at the same time, unre-stricted pooling is equitable in the sense of allowingany Grade Amilk plant to become a pool plant. Thequestion becomes whether all manufacturing milkplants purchasing Grade Amilk from producersshould be eligible to pool under a federal milk order.If not, then what criteria should be used to establishpooling eligibility—location of potential supplyplants relative to distributing plants, plant size, prod-ucts manufactured? Whatever criteria is used, effi-ciency gains would come at the expense of equitylosses.
Producer-Handler Exemptions.Another local pool-ing issue relates to the treatment of producer-han-dlers, dairy producers who process and sell packagedfluid milk. Federal orders have historically not re-quired producer handlers to account to the pool forClass I sales provided that all of their sales comefrom milk produced on the farm.
Until recently, producer-handlers were mostly dairyfarmers with on-farm sales or limited local distribu-tion. Hence, their exemption had little impact on thesize of the money pool for the markets in which theyoperated. However, some larger producer-handlersbegan to show up, some with herds holding thousandsof cows. Class I sales from these operations displaced
large volumes of sales from regulated distributingplants, significantly cutting market Class I utilizationand producer revenue. Large sales of packaged fluidmilk products in California by an Arizona producer-handler exempt under the Arizona-Las Vegas orderled Congress to pass a law in 2006 (PL 109-215) thatforced regulation of the operation. At about the sametime, USDA issued a final rule that set a 3 millionpound per month limit for exemption of producer-handlers in the Arizona-Las Vegas and Pacific North-west orders. And in March 2010, USDA extended thelimit to all federal orders.
At issue here is what constitutes closing a loopholethat allows evasion of legitimate federal orderpayments and results in unfair competition versusimposing unfair restrictions on dairy farmers’ entre-preneurialism. The USDA cap still exempts producer-handlers with dairy herds smaller than about 1,500cows, a large majority of existing dairy farms. Andmost farms with herds larger than the cap are not andhave no interest in becoming a producer-handler.Hence, the cap would appear to be minimallyrestrictive.
Pooling distant milk. Dairy cooperatives often poolmilk under more than one federal milk order. Distantpooling—pooling milk under orders outside their areaof procurement—is advantageous to a cooperative ifthe difference in the PPDs between the two orders ismore than enough to offset the hauling costs neces-sary to meet the order’s touch base producer qualifi-cation standard. With the one-time touch baseproducer qualification provision of the Upper Mid-west order, it was economically advantageous fordairy cooperatives and other plants located well out-side the order marketing area to affiliate producersand their milk and pool on the Upper Midwest order.During the 2000 – 2003 period, cooperatives operat-ing cheese plants as far away as Idaho pooled some oftheir member-producer milk on the Upper Midwestorder. Once the one day touch base qualification wasmet, the milk volume from these producers waspriced under the Upper Midwest order even thoughno actual shipments subsequently occurred.
The pool qualification of the distant milk could bethrough an Upper Midwest distributing plant. It couldalso be through a supply plant or dairy cooperativethat had sufficient “cushion” in meeting the shippingrequirements of the Upper Midwest order—that is, apool plant that shipped more than the minimum re-
DAIRY POLICY ISSUES 41

quired shipping percentage to a distributing plant. Theplant that qualified the distant milk would receive afee for providing qualification.
The effect of distant pooling is to reduce the value ofthe PPD in the receiving market. This occurs becausethe milk pool is increased more than the money pool.In 2003, distant milk from Idaho equaled 10.6 percentof total producer receipts in the Upper Midwest order.The Western order was terminated effective April 1,2004. This raised concern that even more Idaho milkwould be pooled on the Upper Midwest order. UpperMidwest dairy cooperatives requested a federal orderhearing to tighten pooling requirements. The Centraland Mideast orders followed with hearings in re-sponse to large quantities of milk from Minnesota andWisconsin being pooled on these orders, reducingClass I utilization and their PPD.
As a result of these hearings, federal orders wereamended to tighten pooling requirements. This wasprimarily accomplished by requiring that pooled milkcould not be diverted for manufacturing to non-poolplants located outside of the marketing area. Whilethis does not prohibit the pooling of distant milk onthe order, it substantially weakens the incentive to doso because more distant milk would incur transporta-tion costs.
Depooling: Since Class I milk and Class II skim milkare advanced priced, elapse about six weeks betweenthe time these prices are announced and when theClass III and Class IV prices are announced. If theprice of cheese during that six week period increasesenough to raise the Class III price by more than thefederal order Class I differential, then the Class IIIprice will exceed the Class I price. This yields a nega-tive PPD. Pooled cheese plants, if staying pooled,would pay into the producer settlement fund the dif-ference between their higher weighted average milkvalue and the uniform price for the order rather thandrawing from the producer settlement fund. But whenthis happens, many cheese plants can and do elect todepool from the order, effectively becoming an unreg-ulated plant for the month. This causes higher volumemilk receipts in the order to decline, making the nega-tive PPD even more negative. Taking the higher-priced Class III milk out of the milk poolsubstantially reduces the money pool and theweighted average value of the milk that remainspooled—the lower priced Class I milk is now agreater percentage of the smaller pooled milk volume.
The largest recorded negative PPD in the Upper Mid-west order was $4.11 in April 2004. The two-weekaverage cheese price used in deriving the April 2004Class I skim milk price was $1.4582 per pound. Thefour-week average cheese price used in deriving theClass III price was $2.0520 per pound. So betweenthe times the Class I price was announced and theClass III price announced, the cheese price increased$0.5938 per pound. This resulted in the April 2004Class I price (announced on March 19th) of $15.44per hundredweight and the April Class III price (an-nounced on April 30th) of $19.66 per hundredweight.Because of this price inversion, most of the Class IIImilk on the Upper Midwest order was depooled ascheese plants avoided producer settlement fund pay-ments.
While negative PPDs have periodically occurredsince then, they have not been as large. For the UpperMidwest order negative PDDs occurred one monthduring 2005, one month during 2007, and 5 monthsduring 2008. These negative PPDs ranged from $0.04to $0.46 per hundredweight.
While there is still an incentive for cheese plants todepool when PPDs are negative, federal order amend-ments have reduced the incentive. Some amendmentsprohibited “in and out” pooling. If a pool plant(cheese plant) decides to depool during one month,they can no longer re-pool the following month, butrather have to stay depooled for a period of time. TheUpper Midwest order used a different approach. Itlimits pooled milk in any month to a specified per-centage of pooled milk in the previous month. So if aplant depooled in one month, it could only partiallyrepool in the subsequent months.
A possible effect of restricting depooling is thatcheese plants might decide to permanently disaffiliatefrom the order. In that case, the reserve supply ofGrade Amilk for Class I use would shrink and ship-ping requirements for remaining pooled supply plantsand cooperatives would need to be increased.
Restricting depooling deals with the symptoms of theproblem rather than the cause. The problem is priceinversion caused by the combination of volatilecheese prices and advanced Class I pricing. Federalorders cannot address cheese price volatility, but theycould be altered to eliminate advanced Class I pric-ing. If advanced pricing is retained and product priceformulas continue to be used to derive the Class Imover, then using CME cheese prices rather than an-
42 DAIRY POLICY ISSUES

nounced NASS cheese prices would reduce the like-lihood of price inversion. NASS prices are highlycorrelated with CME prices lagged about two weeks.The California milk pricing system uses CME pricesfor butter and cheese in its pricing formulas. Resist-ance to using CME prices in federal order formulaswould come from those concerned about the thinnessof the CME spot markets.
Endnotes
1About 3 percent of U.S. milk production is Grade B, whichcan only be used for manufactured dairy products. Grade Bmilk is not covered by Federal orders. Subsequent referenceto “milk” is Grade Amilk.
2 Other solids are milk solids other than protein and butterfatand consist primarily of lactose.
3 The term, “at location,” means where the plant is situatedwithin the marketing area of the order; that is, the Class Iprice applying to the county where the plant is located.
4 Four federal orders—Appalachia, Arizona, Florida andSoutheast—pay producers under fat/skim milk pricing.
5 Of the six federal milk marketing orders that pay producerson the basis of milk components, four—Midest, Upper Mid-west, Central, and Southwest—apply a somatic cell count ad-justment.
6 The pool does not balance because the combined utilizationif the two handlers does not match utilization of milk as re-flected by the producer price differential.
7 Grade A and Grade B quality standards are currently nearlyidentical. The small amount of remaining Grade B milkcomes mainly from producers who are unable to meet physi-cal standards such as cooling requirements (e.g., Amish farm-ers who do not use mechanical refrigeration) or well location,or from producers who ship their milk to cheese factories thatare not regulated under federal orders and are indifferent withrespect to grade as long as the milk meets quality standards
8 Some recent studies have estimated price elasticities of de-mand for manufactured dairy products lower (in absolutevalue) than the price elasticity of demand for fluid milk prod-ucts. See, for example Chouinard, Hayley H., David E. Davis,Jeffrey T. LaFrance, and Jeffrey M. Perloff, Milk MarketingOrder Winners and Losers, Applied Economics Perspectivesand Policy 32 (1), Spring 2010.
9With modern transportation and packaging it sis difficult todetermine where one market ends and another starts. In gen-eral, a fluid milk plant is regulated by the order in which it hasthe largest percentage of its fluid milk sales.
DAIRY POLICY ISSUES 43
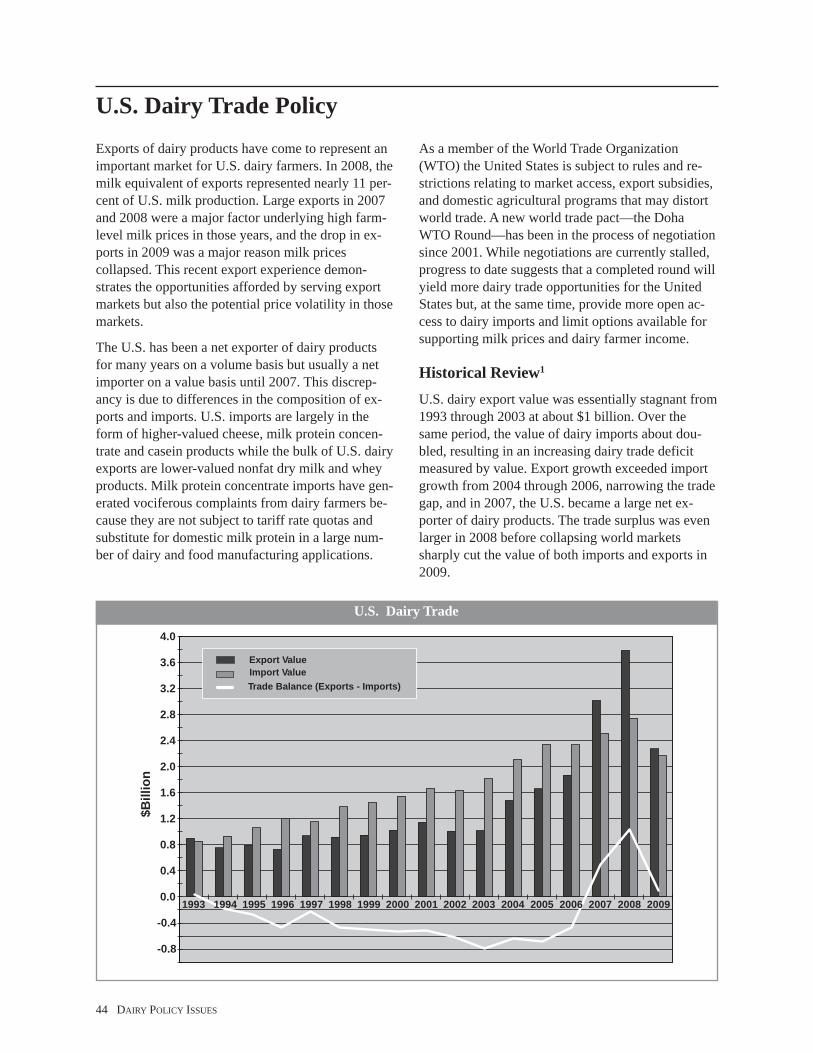
Exports of dairy products have come to represent animportant market for U.S. dairy farmers. In 2008, themilk equivalent of exports represented nearly 11 per-cent of U.S. milk production. Large exports in 2007and 2008 were a major factor underlying high farm-level milk prices in those years, and the drop in ex-ports in 2009 was a major reason milk pricescollapsed. This recent export experience demon-strates the opportunities afforded by serving exportmarkets but also the potential price volatility in thosemarkets.
The U.S. has been a net exporter of dairy productsfor many years on a volume basis but usually a netimporter on a value basis until 2007. This discrep-ancy is due to differences in the composition of ex-ports and imports. U.S. imports are largely in theform of higher-valued cheese, milk protein concen-trate and casein products while the bulk of U.S. dairyexports are lower-valued nonfat dry milk and wheyproducts. Milk protein concentrate imports have gen-erated vociferous complaints from dairy farmers be-cause they are not subject to tariff rate quotas andsubstitute for domestic milk protein in a large num-ber of dairy and food manufacturing applications.
As a member of the World Trade Organization(WTO) the United States is subject to rules and re-strictions relating to market access, export subsidies,and domestic agricultural programs that may distortworld trade. A new world trade pact—the DohaWTO Round—has been in the process of negotiationsince 2001. While negotiations are currently stalled,progress to date suggests that a completed round willyield more dairy trade opportunities for the UnitedStates but, at the same time, provide more open ac-cess to dairy imports and limit options available forsupporting milk prices and dairy farmer income.
Historical Review1
U.S. dairy export value was essentially stagnant from1993 through 2003 at about $1 billion. Over thesame period, the value of dairy imports about dou-bled, resulting in an increasing dairy trade deficitmeasured by value. Export growth exceeded importgrowth from 2004 through 2006, narrowing the tradegap, and in 2007, the U.S. became a large net ex-porter of dairy products. The trade surplus was evenlarger in 2008 before collapsing world marketssharply cut the value of both imports and exports in2009.
U.S. Dairy Trade Policy
-0.8
-0.4
0.0
0.4
0.8
1.2
1.6
2.0
2.4
2.8
3.2
3.6
4.0
$Bill
ion
Export ValueImport ValueTrade Balance (Exports - Imports)
1993 1994 1995 1996 1997 1998 1999 2000 2001 2002 2003 2004 2005 2006 2007 2008 2009
U.S. Dairy Trade
44 DAIRY POLICY ISSUES

The U.S. exports a wide variety of dairy prod-ucts, but three—nonfat dry milk/skim milk pow-der, dry whey products and cheese—accountedfor about 70 percent of total export value in 2009.
U.S. dairy products were shipped to 153 coun-tries in 2009. The biggest customers are nextdoor. Mexico is our largest foreign market, andits share of total exports has grown steadily sinceimplementation of the North American FreeTrade Agreement (NAFTA) in 1995. Canadaaccounted for 16.5 percent of 2009 dairy exportvalue. Other important buyers are East Asia(primarily Japan, China and Korea) and sixSoutheast Asian countries.
U.S. imports of dairy products are also diverse,but cheese has long been the largest import item.Cheese accounted for 43 percent of 2009 dairyimport value. Concentrated milk protein importsfollowed cheese in importance with, a combined30 percent of import value.
The U.S. imported dairy products from 88 coun-tries in 2009. Imports were dominated by the EU(principally cheese) Oceania, Canada and Mex-ico. Italy, France and the Netherlands accountedfor about 60 percent of the value of imports fromthe EU.
Whey/Lactose568,287
NDM/SMP519,977
Cheese-All430,411
Misc Food Preps197,748
Infant Form.122,305 Conc Milk Proteins
93,466
Butter/Butterfat63,732
Ice Cream/Froz59,525
WMP 47,090
Fresh Milk & Cream44,259
Milk-Based Drinks37,285
Cult/Ferm 24,871Cond/Evap
37,285 Ferm 24,871 Evap
Other394,086
Values in $1,000Total Value: $2.233 Bil
Mexico 28.0%
East Asia16.7%
Canada16.5%
SoutheastAsia 12.7%
Caribbean 6.2%
European Union-273.0%
South America2.4%
Central America2.3%
South Asia 1.5%
Oceania 1.3%
Sub-Saharan Africa1.2%
Former Sov. Union0.6%
Other Europe 0.1%
Other 12.3%
North Africa 3.8%
Middle East 3.8%
Cheese-All1,004
Casein258
MPC246
Caseinates198 Misc FoodPreps
182
Whey & Lactose85
Cond/Evap 44
Butter/Butterfat 44
WMP 23
Cult & Ferm 13
Fresh Milk & Cream 8
Milk-Based Drinks 2
SMP 1
Other136
Values in $MillionTotal Import Value = $2.157 Bil
Froz 47Ice Cream/
EU-27 38.9%
New Zealand22.8%
Mexico4.8%
Aust 4.5%South America 4.4%
Non-EU Europe 4.0%
East Asia 1.8%South Asia 1.6%Middle East,1.3%Southeast Asia,1.0%Central America, 0.8%Sub-Saharan Africa, 0.3%Former Sov. Union, 0.2%Caribbean, 0.2%North Africa, 0.1%
Other15.6%
Total Import Value = $2.157 Billion
Canada 13.5%
Source of U.S. Dairy Imports, 2009
Destination of U.S. Dairy Exports, 2009
U.S. Exports of Dairy Products, 2009
U.S. Imports of Dairy Products, 2009
DAIRY POLICY ISSUES 45

Dairy Trade IssuesWorld Trade Organization Issues
The current WTO round was formally initiated witha declaration in November 2001 during a ministerialmeeting held in Doha, Qatar. The agricultural negoti-ations had started months earlier under the Agree-ment on Agriculture. Since the Doha declaration,ministerials have been held in Cancun in 2003,Geneva in 2004 and Hong Kong in 2005.
There are three “pillars” included in the WTO agri-cultural negotiations:
• Market Access. Prior to the Uruguay Round Agri-cultural Agreement (URAA) many agricultural prod-uct imports were restricted by quotas or other typesof non-tariff instruments. The Uruguay round con-verted all non-tariff barriers into tariff equivalents ina process called “tariffication.” This process at-tempted to create a tariff that would leave the ratio ofthe internal price to world price unchanged fromwhat existed under the non-tariff instrument. Besidesthe conversion of non-tariff barriers, the URAA en-sured that access to markets did not decline undertariffication by the introduction of tariff-rate quotas(TRQs) that had a lower in-quota tariff rate. The tar-iffs established under the URAAwere then cut onaverage by 36 percent (at least 15 percent for eachproduct) over five years (1995-2000) for developedcountries and by 24 percent (at least 10 percent foreach product) over ten years (1995-2004) for devel-oping countries. Least developed countries were notrequired to make tariff cuts under the URAA. Therewere special safeguard provisions in the URAA thatallowed governments to take action in cases of rap-idly declining prices or surges in imports. TheURAA set the stage for future trade rounds to dealmore easily with market access issues since marketaccess became increasingly transparent with non-tar-iff barriers removed.
Although agricultural products are now only pro-tected by tariffs in most cases, many tariffs remain atlevels that are high enough to prevent meaningfulmarket access. The numerous proposals on marketaccess reform under the Doha round have called forfurther reductions in tariffs in an effort to achievegreater progress in expanding agricultural trade.Early in the Doha round, some countries proposedthat cuts in tariffs should not be from the URAAbound rates but from applied tariff rates, the ratecountries actually impose on goods. In many cases,
the applied rates are well below their respectivebound rates, so there is no additional market accessopportunity until the bound rate is reduced to belowthe applied rate. There are many other issues relatedto tariff reductions that range from domestic food se-curity to tariff escalation that occurs in an attempt toprotect processing industries. There have been manydifferent proposals offered to cut tariffs. They all dif-fer in the degree in which they attempt to equalizetariffs over time. The Swiss formula, for example,provides for a narrow range of final tariffs and amaximum final tariff rate. The latest Doha proposalshave looked at bands that cut the largest tariffs by thelargest percentage and smaller tariffs by a smallerpercentage in an attempt to harmonize rates. Furthermarket access issues identified in the Doha round in-clude tariff quotas, tariff quota administration, spe-cial safeguards and state trading enterprises.
Under most Doha proposals, additional market ac-cess for most U.S. dairy product markets will occur.This additional access will tend to lower U.S. prices.Perhaps more important will be reductions in U.S.tariffs that will allow products like butter to flowmore easily into the U.S. when domestic prices arehigh relative to world prices. This will tend to cut theextreme peaks in U.S. prices that have characterizedbutter markets over the past few years as tariffs havebeen high enough to essentially keep over-TRQ im-ports from entering the U.S.
There is considerable evidence that additionalglobal market access achieved by a successful Doharound agreement would increase world dairy pricesto levels closer to current U.S. prices. This wouldminimize the negative effects of expanded marketaccess to the U.S. dairy sector and could even causeU.S. milk prices to increase because of expanded ex-port opportunities could outweigh additional marketaccess.
• Export Subsidies. Existing WTO rules prohibitexport subsidies on agricultural products unless theyare specified in a country’s commitment list. Subsi-dies on eligible products were required to be cutfrom base period (1986-1990) levels in both volumeand value terms. Developed countries were requiredto cut the value by 36 percent and the volume by 24percent in equal increments over the 1995 to 2000period. Developing countries were required to cut thevalue by 24 percent and the volume by 14 percent inequal increments over the 1995 to 2004 period. Leastdeveloped countries were not required to make any
46 DAIRY POLICY ISSUES

cuts. There are 25 WTO members who are able touse export subsidies, but only for products on theircommitment lists.
An interim agreement in the Doha round of WTO ne-gotiations calls for the elimination of all export sub-sidies, including export credit programs, by 2013.Subsequent proposals have sought a large cut in ex-port subsidies early in the agreement period, fol-lowed by an adjustment period before elimination ofall subsidies. Other proposals would allow greaterflexibility in the use of export subsidies for develop-ing countries. Smaller developing countries who im-port much of their food are seeking less aggressivecuts to subsidies, fearing that large reductions couldaffect food costs for their consumers. Although thereis general agreement to continue to promote food aidfor humanitarian purposes, there are concerns abouthow to properly discipline food aid so that it is notused by countries to primarily rid themselves of bur-densome surpluses. The role of state trading enter-prises and differences that exist relative to privatecompanies is also a point of contention under the ex-port subsidy debate.
Proposals under consideration would make the DairyExport Incentive Program (DEIP) less important tothe U.S. dairy industry. Current levels of dairy prod-ucts that can be exported under the DEIP are: butterand butteroil, 21,097 metric tons; skim milk powder,68,201 metric tons; and cheese, 3,030 metric tons.Annual DEIP commitments begin on a July 1 year.With further cuts in allowable DEIP exports, theCommodity Credit Corporation (CCC) would likelypurchase more nonfat dry milk during periods of sur-plus production.
The larger issue under the export subsidy pillar forthe U.S. dairy industry is not the reduction in theDEIP, but the likely effect on dairy product prices offewer subsidized exports from other countries. Worlddairy prices should rise as a result of cutting exportsubsidies. Analysis conducted by FAPRI examiningthe U.S. proposal of October 2005 suggested that thecut in EU subsidized exports would be large enoughto increase world dairy prices to U.S. levels. Thiswould limit the downside negative effects of changesin U.S. domestic support and market access for dairyproducts. Without export subsidy reductions, theU.S. proposal would be negative for the U.S. dairyindustry.
• Domestic support. The main issue surrounding do-mestic support programs is their tendency to stimu-late domestic production. This can squeeze outimports and provide motivation for a country to useexport subsidies to move excess product offshore,lowering world prices. The WTO Uruguay Roundmade a distinction between domestic support policiesthat stimulate production and distort trade and pro-grams that have only minimal effects on trade. Thiscategorization resulted in the creation of colored“boxes” to represent the different types of domesticsupport. Using a traffic light analogy, the green boxis used for domestic support that has minimal tradeeffects and can be used freely. Examples of programsthat fall into this category are: research, infrastruc-ture and payments to farmers that do not stimulateproduction. Domestic support that has a direct effecton production and trade was put into an amber boxand was to be cut under existing WTO rules. Pay-ments made to farmers that required limiting produc-tion to be eligible were defined to fall within the bluebox and did not require reductions. Rules were put inplace that countries must use to calculate a value ofthe total domestic support each country provides pro-ducers that includes direct support, input subsidiesand revenue transfers from consumers to producers.This calculation became a country’s aggregate meas-ure of support (AMS). Each country had to calculateits base period (1986-1998) AMS and agree to makecuts from that base period level. Developed countrieshad to cut their AMS by 20 percent over the 1995-2000 period while developing countries had to cuttheir AMS by 13 percent over the 1995-2004 period.For the U.S., the base period AMS was $23.9 billionand the required 20 percent URAA reduction resultedin an AMS ceiling in 2000 of $19.1 billion. There are34 WTO members who have commitments to reduceamber box spending in the URAA. The remainingWTO members must keep domestic support within 5percent of the value of production (10 percent for de-veloping countries).
There have been several proposals in the Doha roundfor reforms to domestic support. In nearly all cases,the proposals have focused on further reductions oroutright elimination of amber box spending. A U.S.proposal called for a 60 percent cut in domestic sup-port which results in an AMS ceiling for the UnitedStates below $8 billion. Other issues continue to bedebated regarding matters like de minimis rules andfurther refinement of both the green and blue box
DAIRY POLICY ISSUES 47
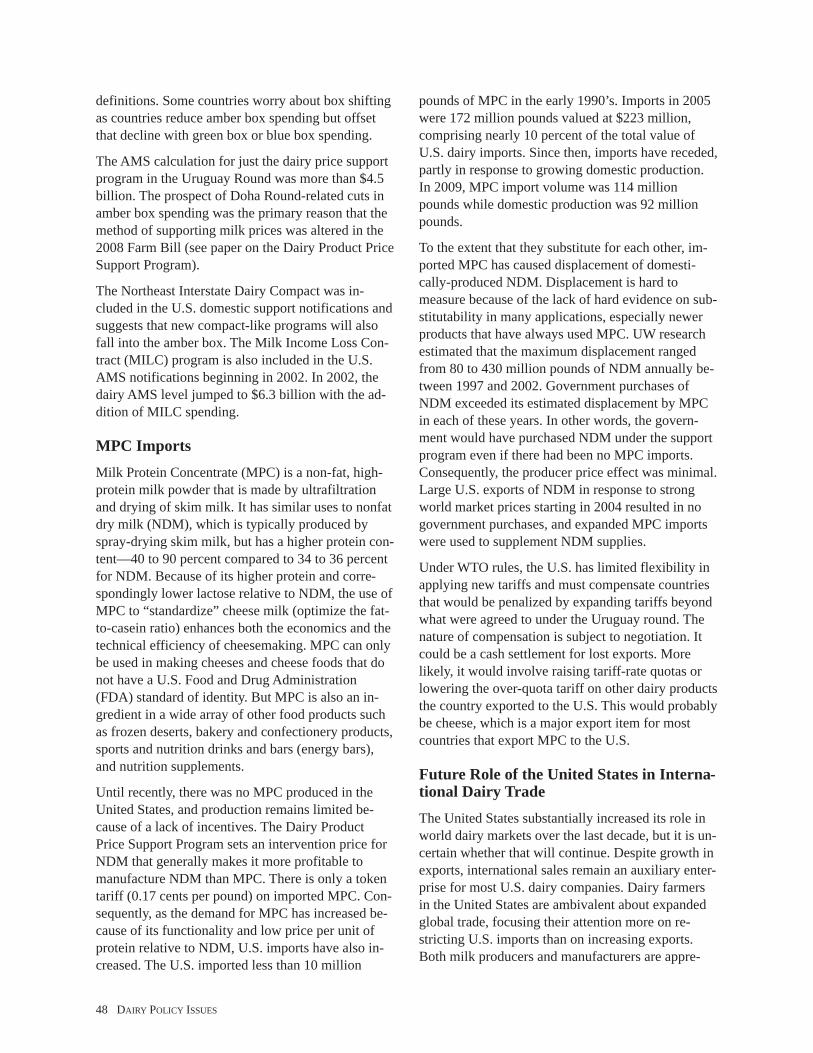
definitions. Some countries worry about box shiftingas countries reduce amber box spending but offsetthat decline with green box or blue box spending.
The AMS calculation for just the dairy price supportprogram in the Uruguay Round was more than $4.5billion. The prospect of Doha Round-related cuts inamber box spending was the primary reason that themethod of supporting milk prices was altered in the2008 Farm Bill (see paper on the Dairy Product PriceSupport Program).
The Northeast Interstate Dairy Compact was in-cluded in the U.S. domestic support notifications andsuggests that new compact-like programs will alsofall into the amber box. The Milk Income Loss Con-tract (MILC) program is also included in the U.S.AMS notifications beginning in 2002. In 2002, thedairy AMS level jumped to $6.3 billion with the ad-dition of MILC spending.
MPC ImportsMilk Protein Concentrate (MPC) is a non-fat, high-protein milk powder that is made by ultrafiltrationand drying of skim milk. It has similar uses to nonfatdry milk (NDM), which is typically produced byspray-drying skim milk, but has a higher protein con-tent—40 to 90 percent compared to 34 to 36 percentfor NDM. Because of its higher protein and corre-spondingly lower lactose relative to NDM, the use ofMPC to “standardize” cheese milk (optimize the fat-to-casein ratio) enhances both the economics and thetechnical efficiency of cheesemaking. MPC can onlybe used in making cheeses and cheese foods that donot have a U.S. Food and Drug Administration(FDA) standard of identity. But MPC is also an in-gredient in a wide array of other food products suchas frozen deserts, bakery and confectionery products,sports and nutrition drinks and bars (energy bars),and nutrition supplements.
Until recently, there was no MPC produced in theUnited States, and production remains limited be-cause of a lack of incentives. The Dairy ProductPrice Support Program sets an intervention price forNDM that generally makes it more profitable tomanufacture NDM than MPC. There is only a tokentariff (0.17 cents per pound) on imported MPC. Con-sequently, as the demand for MPC has increased be-cause of its functionality and low price per unit ofprotein relative to NDM, U.S. imports have also in-creased. The U.S. imported less than 10 million
pounds of MPC in the early 1990’s. Imports in 2005were 172 million pounds valued at $223 million,comprising nearly 10 percent of the total value ofU.S. dairy imports. Since then, imports have receded,partly in response to growing domestic production.In 2009, MPC import volume was 114 millionpounds while domestic production was 92 millionpounds.
To the extent that they substitute for each other, im-ported MPC has caused displacement of domesti-cally-produced NDM. Displacement is hard tomeasure because of the lack of hard evidence on sub-stitutability in many applications, especially newerproducts that have always used MPC. UW researchestimated that the maximum displacement rangedfrom 80 to 430 million pounds of NDM annually be-tween 1997 and 2002. Government purchases ofNDM exceeded its estimated displacement by MPCin each of these years. In other words, the govern-ment would have purchased NDM under the supportprogram even if there had been no MPC imports.Consequently, the producer price effect was minimal.Large U.S. exports of NDM in response to strongworld market prices starting in 2004 resulted in nogovernment purchases, and expanded MPC importswere used to supplement NDM supplies.
Under WTO rules, the U.S. has limited flexibility inapplying new tariffs and must compensate countriesthat would be penalized by expanding tariffs beyondwhat were agreed to under the Uruguay round. Thenature of compensation is subject to negotiation. Itcould be a cash settlement for lost exports. Morelikely, it would involve raising tariff-rate quotas orlowering the over-quota tariff on other dairy productsthe country exported to the U.S. This would probablybe cheese, which is a major export item for mostcountries that export MPC to the U.S.
Future Role of the United States in Interna-tional Dairy TradeThe United States substantially increased its role inworld dairy markets over the last decade, but it is un-certain whether that will continue. Despite growth inexports, international sales remain an auxiliary enter-prise for most U.S. dairy companies. Dairy farmersin the United States are ambivalent about expandedglobal trade, focusing their attention more on re-stricting U.S. imports than on increasing exports.Both milk producers and manufacturers are appre-
48 DAIRY POLICY ISSUES
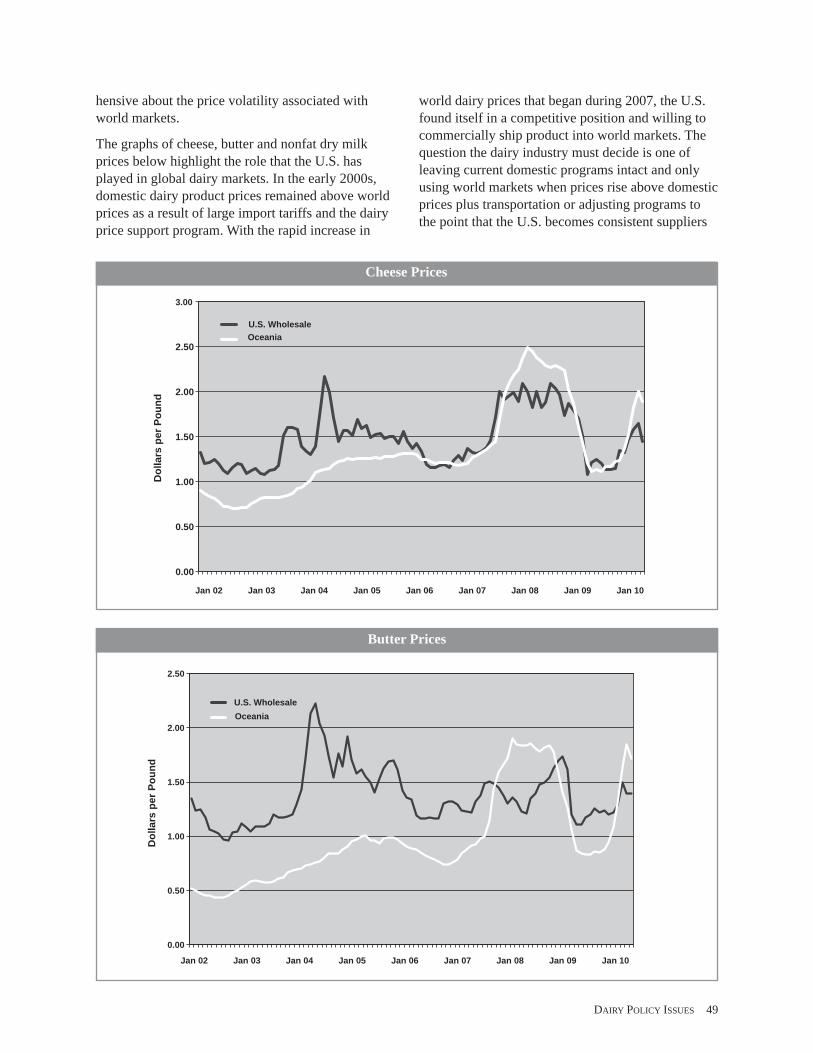
hensive about the price volatility associated withworld markets.
The graphs of cheese, butter and nonfat dry milkprices below highlight the role that the U.S. hasplayed in global dairy markets. In the early 2000s,domestic dairy product prices remained above worldprices as a result of large import tariffs and the dairyprice support program. With the rapid increase in
world dairy prices that began during 2007, the U.S.found itself in a competitive position and willing tocommercially ship product into world markets. Thequestion the dairy industry must decide is one ofleaving current domestic programs intact and onlyusing world markets when prices rise above domesticprices plus transportation or adjusting programs tothe point that the U.S. becomes consistent suppliers
0.00
0.50
1.00
1.50
2.00
2.50
U.S. WholesaleOceania
Dol
lars
perP
ound
Jan 02 Jan 03 Jan 04 Jan 05 Jan 06 Jan 07 Jan 08 Jan 09 Jan 10
0.00
0.50
1.00
1.50
2.00
2.50
3.00
U.S. WholesaleOceania
Dol
lars
perP
ound
Jan 02 Jan 03 Jan 04 Jan 05 Jan 06 Jan 07 Jan 08 Jan 09 Jan 10
Cheese Prices
Butter Prices
DAIRY POLICY ISSUES 49

50 DAIRY POLICY ISSUES
to other countries even in periods of low worldprices.
Becoming consistent suppliers may allow for muchlarge markets to be built than would be the case ofusing world markets to move products only whenglobal prices are high. This is not a simple questionto answer and depends greatly on the global outlookfor dairy demand.
One issue that must be included in deciding thisstrategy is exchange rates. The U.S. dollar has depre-ciated against many currencies for much of the 2000swhich has made U.S. products cheaper in other coun-tries’ currencies. Although most experts do not ex-pect the U.S. dollar to strengthen in the next decade,if it were to strengthen it could jeopardize the U.S.position in world dairy markets.
A New View Regarding Choices for the U.S.IndustryThe Innovation Center for U.S. Dairy (IC) recentlycommissioned a major study to sort through U.S.dairy trade challenges and opportunities. A task forceconsisting of IC board members actively engaged indairy exports was named to direct the study and Bain& Company was contracted to conduct interviewswith a broad range of dairy sector stakeholders andperform other analyses. The related report, entitled,
The Impact of Globalization on the U.S. Dairy In-dustry: Threats, Opportunities, and Implications, wasreleased October 2009.
IC traced the following likely future scenario withrespect to world dairy trade and implications for theU.S.:
• World demand for dairy products will grow rapidly,primarily as a result of strong economic growth inEast and Southeast Asia, the Middle East, and North-ern Africa. Internal milk production in these coun-tries cannot keep pace with increased demand.
• The resulting net demand growth will exceed thepotential milk supply growth in traditional low-costdairy exporting countries (New Zealand and Aus-tralia) despite higher world prices, resulting in a “la-tent demand gap” forecast at 7 billion pounds milkequivalent by 2013.
• The U.S. has the opportunity not only to help fillthis global demand gap, but also to benefit from dis-placing imports with internal sources of product.
• To fully exploit this opportunity, U.S. exporterswould need to be consistent suppliers of high-qualityproducts in the form demanded by importers. Federaldairy policy changes would be necessary as well.
• The window of opportunity afforded by the latent
0.00
0.50
1.00
1.50
2.00
2.50
Dol
lars
perP
ound
U.S. Wholesale
Oceania
Jan 02 Jan 03 Jan 04 Jan 05 Jan 06 Jan 07 Jan 08 Jan 09 Jan 10
Nonfat Dry Milk Prices
DAIRY POLICY ISSUES 51
demand gap may be limited if non-traditional dairyexporters—notably Brazil and Ukraine—success-fully deal with existing constraints to expanded pro-duction. But by committing to exports now, U.S.firms may be able to thwart this new competition.
IC identified four strategic options for the U.S. topursue: Fortress USA, the status quo, consistent ex-porter status, and global dairy player.
The Fortress USA option—exclusive focus on thedomestic market—was deemed infeasible because itwould require higher trade barriers and some form ofsupply control to match domestic supply with de-mand at acceptable farm-level milk prices. Restrict-ing market access would violate existing WTOcommitments and a completed Doha round agree-ment will likely further expand market access. Adop-tion of a strong form of supply control wasconsidered a political long shot.
Maintaining the status quo is the easiest option be-cause no changes are necessary and industry stake-holders have become comfortable operating withinthe current system. But the status quo would margin-alize the U.S. role in world markets and run the riskof increasing dairy imports and displacement of dairyingredients by non-dairy substitutes.
The global dairy player option would essentiallyadopt the strategy employed by export-orientedcountries like New Zealand and Ireland, where majordairy companies (e.g., Fonterra in New Zealand, andGlanbia in Ireland) focus almost exclusively on ex-port sales. These companies have developed exten-sive trading relationships with importing countriesand have established elaborate networks of joint ven-tures and direct foreign investments to source sup-plies outside their headquarter countries. While seenas a possible longer-term goal, the IC concluded thatseeking global player status was premature.
The recommended IC option for the U.S. dairy in-dustry was the consistent exporter status. This wouldinvolve an industry commitment to enhance dairycompanies’ trading skills and to manufacture prod-ucts aligned with foreign buyers’ needs. It would alsorequire altering federal programs and regulations thatimpede dairy exports and improving tools to manageprice risk.
More specifically, achieving consistent exporter sta-tus would require that importers perceive the U.S asa consistently reliable supplier of consistently high-quality dairy products manufactured to their specifi-cations and meeting the changing demands of theirconsumers. Whether U.S. dairy companies are will-ing to commit to the related changes in their businesspractices is not clear. Even if they were, the presenceof the Dairy Product Price Support program stands inthe way of the U.S. being perceived as a reliable sup-plier, since the Commodity Credit Corporation mayperiodically represent a more lucrative sales outletfor NDM, butter, and cheese than foreign buyers.The IC report also suggested that existing FDA stan-dards of identity could also stand in way of U.S.companies being able to make the right products tomeet export demand.
Recognizing the potential risks associated withworld market price volatility, the IC report recom-mended strengthening price risk management toolsavailable to dairy farmers and manufacturers. Whileit did not identify methods of doing this, the reportwas critical of the Federal Milk Marketing Ordersystem for increasing price volatility by limiting thedevelopment of forward contracting and use of dairyfutures markets.
It is important to point out that the Innovation Centerglobalization task force members represented majorcooperative and proprietary manufacturers of cheese,butter and NDM, which, along with whey productsderived from cheese production, are the principalU.S. dairy export items. Whether dairy farmerswould have come up with the same conclusions andrecommendations is an open question.
Regardless of the feasibility or the overall dairy in-dustry acceptance of the IC strategy, the report pro-vides a useful starting point for discussing the futureU.S. role in international dairy trade and how to sup-port that role.
Endnotes
1 Trade data for the charts here are drawn from theUSDA-FAS Global Agricultural Trade System.

Dairy Policy Analysis Alliance