dairy farm cash flow, debt repayment ability and financial...
TRANSCRIPT
March 1991 A.E. Ext. 91-5
A.E.. l-'jLE''V'" ..' ,.._.. ...."-.. '"
DAIRY FARM CASH FLOW, DEBT REPAYMENT ABILITY AND
FINANCIAL ANALYSIS
George L Casler
• Department ofAgricultural Economics
New York State College ofAgriculture and Ute Sciences
A Statutory College of the State University
Cornell University, Ithaca, New York 14853

It is the policy of Cornell University actively to support equality of educational and employment opportunity. No person shall be denied admission to any educational pr~ram or activity or be denied employment on the basis of any legally prohibited discrimination involving, but not limited to, such factors as race, color, creed, religion, national or ethnic origin, sex, age or •handicap. The University is committed to the maintenance of offlrmative action programs which will assure the continuation of such equality of opportunity.

FARM CASH FWW, DEBT REPAYMENT ABILITY AND FINANCIAL ANALYSIS
The procedure and worksheets in this publication will help you analyze your cash flow situation, future debt repayment ability, and current financial situation. The procedures are designed to make use of data either from your Federal income tax forms and balance sheets provided to lenders or from your farm record system.
The cash flow and debt repayment ability starts from last year's cash receipts and expenses. An opportunity is provided to adjust last year's receipts and expenses for changes in accounts receivable, accounts payable and inventories before using these data as a basis for this year's projected receipts and expenses (Worksheets 1 and 2). Worksheet 2A should be used if expenses are taken from the Cornell Farm Account Book, a Cornell Dairy Farm Business Summary, or a similar record system. Worksheet 2B may be used if last year's expenses are taken from Schedule F.
Debt payments for last year and projected for the coming year should be entered in Worksheet 3. Debt repayment ability may be calculated by including nonfarm income (Worksheet 4) or based on farm receipts and expenses only (Worksheet 6). Worksheet 5 is a checklist on ways to ease the cash flow crunch. A complete annual cash flow statement may be done in Worksheet 7.
RECEIYf AND EXPENSE WORKSHEETS
The receipt and expense worksheets each have three columns. The Last Year column is for cash receipts or expenses. At the bottom of this column is a place for adjustments for changes in accounts receivable (or payable) and changes in inventories. The purpose of these adjustments is to obtain a true picture of what the total receipts and expenses actually were for the year's operation of the business. For example, if you actually paid $150,000 in cash expenses during the year but accounts payable increased $20,000, actual expenses for the year were $170,000. Similarly, if the purchased feed and supply inventory at the end of the year were $10,000 smaller than at the beginning, this would add $10,000 to the feed and supplies actually used during the year. Considering both adjustments, actual operating expenses were $180,000.
You may also need to adjust for unusual circumstances which caused last year's expenses to be high or low. For example, the lime expense last year may have been unusually high due to seeding more alfalfa than normal.
The Last Year, Adjusted column provides a place to allocate the total changes in accounts receivable or payable and inventory changes to the individual receipt and ex •pense categories. For example, if the $20,000 increase in accounts payable discussed above were made up of $15,000 for feed and $5,000 for fuel, it should be allocated this way in filling out the Last Year, Adjusted column. The purpose of the Adjusted column is to have an accurate accounting of last year's expenses (and receipts) as a basis for projecting expenses and receipts for the coming year.

2
If you have completed a Cornell Dairy Farm Business Summary (DFBS), the accrual adjustments have already been made so you can start with the Last Year, Adjusted columns on the expense side. However, you should not necessarily start with the accrual DFBS numbers on the receipt side. For example, dairy cattle accrual receipts in DFBS include increase in inventory which was not a cash item last year and will not be in the coming year.
Worksheet 1. Receipts
Last Year
This worksheet is organized in categories to facilitate making projections for the coming year. Last year's receipts should include all the income from Part I of Schedule F plus sales of livestock and other capital items reported on Form 4797. You will need other records to be able to complete Worksheet 1 because there is little breakdown of receipt categories on Schedule F. In the case of 4797 items, the amount transferred to Worksheet 1 should be the sale price, not the gain.
If accounts receivable have increased or decreased during the year, the change should be entered on the adjustment line. The purpose of this adjustment is to help in projecting cash flows for the coming year. An increase in accounts receivable during the year indicates that you sold more products than you were paid for during the year. You may need to also consider changes in inventories if crop sales do not reflect the sales of one year's crops.
Last Year, Adjusted
The Last Year, Adjusted column provides an opportunity to adjust last year's cash receipts for changes in accounts receivable and inventories so that each number reflects the appropriate income from a year's operation of the business.
Changes in accounts receivable and inventories during the last year should be considered when projecting cash flows for the coming year. For example, if cash income from crop sales last year did not include all of the crops actually produced or sold, an adjustment should be made in last year's crop sales if they are to be used as the basis for projecting crop sales for the coming year.
Projected
Projections of income for the coming year should be made carefully, taking into account expected changes in items such as cow numbers, production per cow, milk prices, crop acreages, yields and crop prices.
•

3
Worksheet 2. Expenses
Last Year
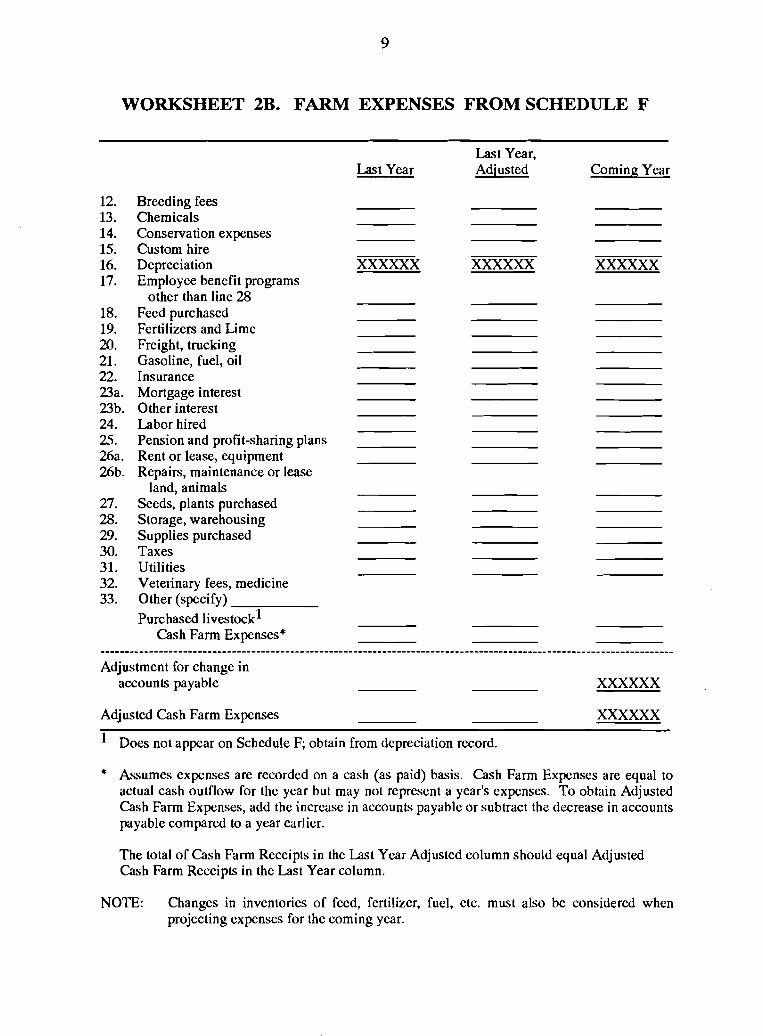
If you use the Cornell accounting system, use Worksheet 2A. The list of expenses in Worksheet 2B is consistent with those in Part II of Schedule F with two exceptions. Depreciation is omitted because it is not a cash expense. There is a line for purchased livestock (such as dairy cows) which does not appear on Schedule F. If dairy cows are included in cash expenses on your farm, the amount should be included here. If cows are purchased with borrowed money, the principal and interest payments on cows should be included with debt payments on Worksheet 3 rather than including the purchase price here.
If accounts payable increased or decreased during the year, any increase should be added and any decrease subtracted to get from Cash Farm Expenses to Adjusted Cash Farm Expenses.
Last Year, Adjusted
Last Year, Adjusted is used to help project expenses for the coming year. For example, if there were a $4,000 increase in accounts payable last year, the expense category causing this increase should be ascertained. If all the increase were in the feed bill, it suggests that feed consumed was $4,000 more than that paid for during the year. If last year's feed bill is to be used as the basis for projecting next year's feed bill, the $4,000 should be added to last year's feed expense before making any adjustments for expected changes in quantities or prices for the coming year.
Similar adjustments should be made if there were changes in inventory of feed and supplies from the beginning to the end of last year. The total of Cash Farm expenses in the Adjusted column should equal Adjusted Cash Farm Expenses in the Last Year column.
Projected
Projected expenses for the coming year should be made carefully by considering all changes in items such as cow numbers, crop acres, feeding practices, cropping practices, hired labor, and input prices.
Worksheet 3. Debt Payments
Space is provided for mortgages, cattle and equipment loans, and operating loans. Under each, there is space to enter principal and interest payments separately. If you don't know the breakdown between principal and interest, just enter the total payment. Lease payments should be included in expenses (Worksheet 2A or 2B) rather than under • debt payments.

4
Last Year
There are two columns for last year, one for "planned" (that is, the amount you planned to pay) and a second for "paid" (that is, the debt payments actually made during the year). Both of these columns are history but may be useful in completing the Projected column.
Debt payments entered in the Projected column should be those you are committed to make (or plan to make) in the coming year. Be sure to include payments that you will need to make on machinery and livestock to be acquired during the coming year, regardless of whether such purchases are to add to your machinery complement or herd size or if they are to be used as replacements.
The Reduction in Accounts Payable is used only for the Projected column. (Reduction in accounts payable last year is included in cash expenses.) If you plan to pay down your accounts payable to a level below what existed at the end of last year, enter that amount on this line. However, if you plan to borrow the money to reduce the accounts payable, payments on that amount should be included in projected debt payments rather than entering the amount of paydown on this line.
Worksheet 4. Farm and Nonfarm Repayment Ability
Total repayment ability is calculated by including nonfarm as well as farm income. Farm expenses are subtracted from cash receipts to obtain Net Farm Cash Inflow. Then interest paid is added back because it is included later in debt payments. Income from nonfarm sources is added to obtain Cash Available for Family Living and Debt Payments. After subtracting Family Living Expenses, the result is Cash Available for Debt Payments. The remainder, after deducting debt payments, is cash available for New Investments and "Risk and Uncertainty". Finally, Cash Flow Coverage Ratio is calculated by dividing Cash Available for Debt Payments by Debt Payments. If the result is less than 1.0, there is not enough cash available to make the debt payments and adjustments are needed.
Worksheet 4 has columns for two sets of calculations. The first column is for the most recent year for which data are available ("Last Year"). The second column is for projections for the coming year. The projected calculations are the most important; the calculations for "Last Year" are history. However, the calculations for last year are useful as a basis for making projections for the coming year.
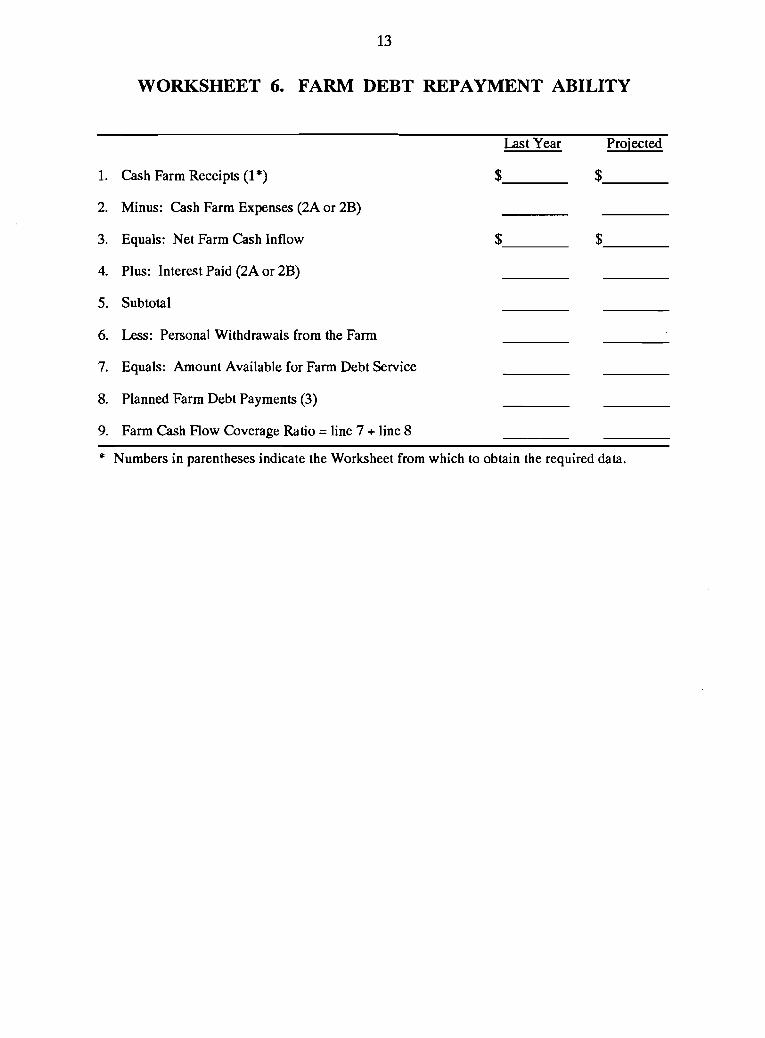
Worksheet 6. Farm Debt Repayment Ability
Worksheet 6 is designed for calculating farm debt repayment ability. It considers farm income and expenses and withdrawals from the farm for personal purposes. (If • there is nonfarm income available, personal withdrawals from the farm usually will be less than total personal withdrawals and family living expenses shown in Worksheet 4, and an adjustment will need to be made.) The numbers in parentheses indicate the worksheet from which to obtain the required data.
5
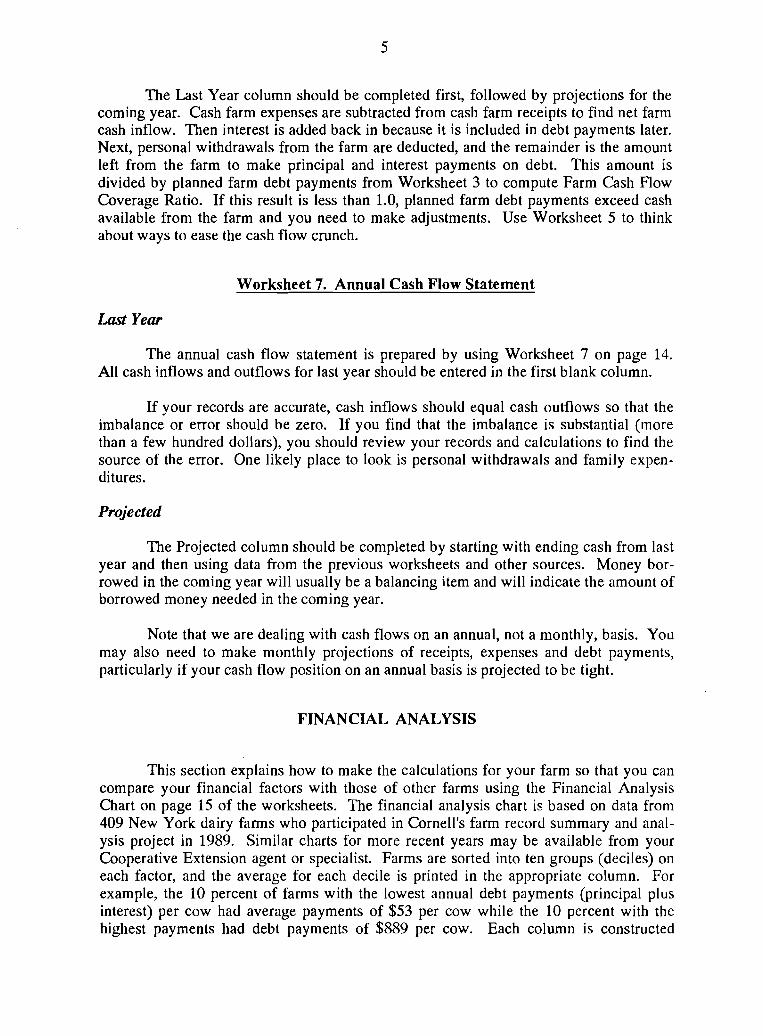
The Last Year column should be completed first, followed by projections for the coming year. Cash farm expenses are subtracted from cash farm receipts to find net farm cash inflow. Then interest is added back in because it is included in debt payments later. Next, personal withdrawals from the farm are deducted, and the remainder is the amount left from the farm to make principal and interest payments on debt. This amount is divided by planned farm debt payments from Worksheet 3 to compute Farm Cash Flow Coverage Ratio. If this result is less than 1.0, planned farm debt payments exceed cash available from the farm and you need to make adjustments. Use Worksheet 5 to think about ways to ease the cash flow crunch.
Worksheet 7. Annual Cash Flow Statement
Last Year
The annual cash flow statement is prepared by using Worksheet 7 on page 14. All cash inflows and outflows for last year should be entered in the first blank column.
If your records are accurate, cash inflows should equal cash outflows so that the imbalance or error should be zero. If you find that the imbalance is substantial (more than a few hundred dollars), you should review your records and calculations to find the source of the error. One likely place to look is personal withdrawals and family expenditures.
Projected
The Projected column should be completed by starting with ending cash from last year and then using data from the previous worksheets and other sources. Money borrowed in the coming year will usually be a balancing item and will indicate the amount of borrowed money needed in the coming year.
Note that we are dealing with cash flows on an annual, not a monthly, basis. You may also need to make monthly projections of receipts, expenses and debt payments, particularly if your cash flow position on an annual basis is projected to be tight.
FINANCIAL ANALYSIS
This section explains how to make the calculations for your farm so that you can compare your financial factors with those of other farms using the Financial Analysis Chart on page 15 of the worksheets. The financial analysis chart is based on data from 409 New York dairy farms who participated in Cornell's farm record summary and analysis project in 1989. Similar charts for more recent years may be available from your Cooperative Extension agent or specialist. Farms are sorted into ten groups (deciles) on • each factor, and the average for each decile is printed in the appropriate column. For example, the 10 percent of farms with the lowest annual debt payments (principal plus interest) per cow had average payments of $53 per cow while the 10 percent with the highest payments had debt payments of $889 per cow. Each column is constructed

6
independently of the others. It is usually considered better to be near the top rather than near the bottom of a column. A definition of each factor appears on page 16 of the worksheets.
Worksheet 8 which follows the Financial Analysis Chart will help you calculate the factors for your farm. In addition to the data ftom the previous Worksheets, you will need to know your number of cows at the end of last year and some information from your balance sheet to be able to make the calculations for the Financial Analysis Chart.
After you have made the calculations, draw a line through each column to represent approximately where your farm business falls for that factor. If you are above the middle of each column, you are probably in reasonably good financial shape, at least in comparison to your competitors. If you fall below the middle of several columns, you should be concerned about the financial health of your business. Even if you are not having difficulty making your debt payments now, you could be headed for trouble in the future.
•

7
WORKSHEET 1. FARM RECEIPTS
Item Tax Form l Last Year* Last Year Adjusted Coming Year
Milk sales F
Dairy cattle F,47972
Dairy calves
Other livestock sold
F
F,47972
Crop sales F
Government payments F
Custom machine work F
Gas tax refund F
Miscellaneous F
Other capital items 47972
Cash Farm Receipts
Adjustment for change in accounts receivable* xxxxxxx xxxxxxx Adjustment for inventory changes
Adjusted Cash Farm Receipts xxxxxxx xxxxxxx 1 The breakdown of receipts on Schedule F does not provide enough detail to be very useful in
cash flow planning. You will need to consult your records to find the breakdown of receipts.
2 Sales of dairy and breeding livestock, machinery, real estate, etc. are reported on Form 4797. Amount included here should be the sale price, not the gain or loss.
* Assumes receipts are recorded on a cash basis (as the money is actually received). Cash Farm Receipts is equal to cash inflow but may not reflect the income from a year's operation of the business. To obtain Adjusted Cash Farm Receipts, add any increase in accounts receivable or subtract any decrease in accounts receivable compared to a year earlier. You may also need to adjust for changes in inventories if last year's cash receipts do not accurately reflect the receipts from the year's operation of the business. The total of Cash Farm Receipts in the Last Year Adjusted column should equal Adjusted Cash Farm Receipts in the Last Year column. Last Year, Adjusted should be used as the basis for projections.

8
WORKSHEET 2A. FARM EXPENSES
Hired labor
Dairy grain and concentrate Dairy roughage
Nondairy livestock feed Machine hire, rent and lease
Machinery repairs and parts Auto expense (farm share)
Fuel, oil and grease Replacement livestock Breeding fees Veterinary, medicine
Milk mrktg. (including assessments) Cattle lease/rent
Other livestock expense Fertilizer and lime Seeds, plants Spray and other crop expense
Land, building, and fence repair Taxes (R.E.)
Rent/lease Insurance
Telephone (farm share) Electricity (farm share)
Interest paid Miscellaneous
Expansion livestock Cash Farm Expenses
Adjustment for change in accounts payable*
Adjustment for inventory changes
Adjusted Cash Farm Expenses
.Last Year, Last Year Adjusted Coming Year
xxxxxxx xxxxxxx
xxxxxxx xxxxxxx * Assumes expenses are recorded on a cash (as paid) basis. Cash Farm expenses are equal to
actual cash outflow for the year but may not represent a year's expenses. To obtain Adjusted Cash Farm Expenses, add the increase in accounts payable or subtract the decrease in accounts payable compared to a year earlier. The total Cash Farm Expenses in the Last Year, Adjusted column should equal the Adjusted Cash Farm Expenses in the Last Year column.
NOTE: Changes in inventories of feed, fertilizer, fuel, etc. must also be considered when projecting expenses for the coming year.
9
WORKSHEET 2B. FARM EXPENSES FROM SCHEDULE F
Last Year, Last Year Adjusted Coming Year
12. Breeding fees 13. Chemicals 14. Conservation expenses 15. Custom hire 16. Depreciation xxxxxx xxxxxx xxxxxx 17. Employee benefit programs
other than line 28 18. Feed purchased 19. Fertilizers and Lime 20. Freight, trucking 2l. Gasoline, fuel, oil 22. Insurance 23a. Mortgage interest 23b. Other interest 24. Labor hired 2'5. Pension and profit-sharing plans 26a. Rent or lease, equipment 26b. Repairs, maintenance or lease
land, animals 27. Seeds, plants purchased 28. Storage, warehousing 29. Supplies purchased 30. Taxes 31. Utilities 32. Veterinary fees, medicine 33. Other (specify) _.....,. _
Purchased livestock1
Cash Farm Expenses*
Adjustment for change in accounts payable xxxxxx
Adjusted Cash Farm Expenses xxxxxx 1 Does not appear on Schedule F; obtain from depreciation record.
* Assumes expenses are recorded on a cash (as paid) basis. Cash Farm Expenses are equal to actual cash outflow for the year but may not represent a year's expenses. To obtain Adjusted Cash Farm Expenses, add the increase in accounts payable or subtract the decrease in accounts payable compared to a year earlier.
The total of Cash Farm Receipts in the Last Year Adjusted column should equal Adjusted Cash Farm Receipts in the Last Year column.
NOTE: Changes in inventories of feed, fertilizer, fuel, etc. must also be considered when projecting expenses for the coming year.

10
WORKSHEET 3. DEBT PAYMENTS
Last Year Planned Paid
Projected for Coming Year**
Mortgages (10 years or more)
Principal
Interest
Total (1)
Cattle and Equipment Loans (1-10 yrs.)
Principal
Interest
Total (2)
Operating Loans (less than 1 yr.)
Principal*
Interest
Total (3)
Reduction in Accounts Payable (4)
Grand Total (1 + 2 + 3 + 4)
* Do not include here amounts that have been included in Worksheet 2A or 2B for the same year.
** Include payments on any new debt-financed investments or replacements.

11
WORKSHEET 4. FARM AND NONFARM REPAYMENT ABILITY
1. Cash Farm Receipts (1 *)
2. Minus: Cash Farm Expenses (2)
3. Equals: Net Farm Cash Inflow
4. Plus: Farm Interest Paid (2)
5. Plus: Nonfarm Income
6. Cash Available for Family Living, and Debt Payments
7. Less: Family Living Expenses and Taxes2
8. Cash Available for Debt Payments
9. Less: Debt Payment (Interest and principal) (3)
10. Cash Available for New Investments, Risk and Uncertainty
11. Cash Flow Coverage Ratio (Item 8 divided by Item 9)
Last Year Projected1
+ +
+ +
* Numbers in parentheses indicate the Worksheet from which to obtain this item.
1 Projections for the coming year should be made carefully by considering changes in items such as cow numbers, feeding programs, cropping programs, product prices and input prices.
2 Income and social security taxes as well as personal debt payments should be included in family living expenses.

12
WORKSHEET S. EASING THE CASH FLOW CRUNCH
If your projected Cash Flow Coverage Ratio is less than 1.0, it appears that you will not be able to make your debt payments. Therefore, adjustments are needed.
Some possible ways to ease the cash flow crunch are listed below:
Applicable to my farm
1. Borrow more money (this makes sense only if you expect the profitability of your business to increase in the future)
2. Restructure debt: Put more on long term and less on short term to lower total payments
3. Increase cash receipts (more than cash expenses)
4. Decrease cash expenses (more than cash receipts)
5. Cut capital purchases
6. Cut family living expenses
7. Sell nonessential capital assets
8. Keep inventory low (sell unneeded crops, buy feed only as needed, etc.)
9. Off-farm work by operator or family members
10. Sell assets and lease them back
11. Sell the assets to an investor and work as the manager
12. Bring in a limited partner to provide capital
13.
14.
13
WORKSHEET 6. FARM DEBT REPAYMENT ABILITY
Last Year Projected
1. Cash Farm Receipts (1 *) $--- $--
2. Minus: Cash Farm Expenses (2A or 2B)
3. Equals: Net Farm Cash Inflow $--- $--
4. Plus: Interest Paid (2A or 2B)
5. Subtotal
6. Less: Personal Withdrawals from the Farm
7. Equals: Amount Available for Farm Debt Service
8. Planned Farm Debt Payments (3)
9. Farm Cash Flow Coverage Ratio = line 7 + line 8
* Numbers in parentheses indicate the Worksheet from which to obtain the required data.

14
WORKSHEET 7. ANNUAL CASH FLOW STATEMENT
Item Last Year Projected
Cash Inflows
1. Beginning farm cash, checking & savings $ $
2. Cash farm receipts
3. Sale of assets: Machinery
4. Real estate
5. Other stocks & certificates
6. Money borrowed (intermediate & long term)
7. Money borrowed (short term)
8. Increase in operating debt
9. Nonfarm income
10. Cash from nonfarm capital used in the business
11. Money borrowed -- nonfarm
12. Total (A) $ $
Cash Outflows
13. Cash farm expenses $ $
14. Capital purchases: Expansion Livestock
15. Machinery
16. Real estate
17. Other stock & certificates
18. Principal payments (Intermediate & long term)
19. Principal payments (short term)
20. Decrease in operating debt
21. Personal withdrawals & family expenditures including nonfarm debt payments
22. Ending farm cash, checking & savings
23. Total (B)
Imbalance (error) =(A) - (B) $ $

15
FINANCIAL ANALYSIS CHART
The farm financial analysis chart may be used to measure the financial health of the farm business. The financial measures used are defined on page 16.
FINANOAL ANALYSIS CHART 409 New York Dairy Farms, 1989
Liquidity (repayment) Debt Available for
Payments Debt Service Per Cow Per Cow $ 53 $942
180 762 254 663 333 580 389 514 440 460 487 399 549 327 631 244 889 -50
Solvency
Leverage Percent Ratio· Equity
0.02 98 0.12 89 0.22 83 0.32 77 0.43 71 0.54 66 0.67 61 0.86 54 1.25 46 2.79 32
Cash Flow Coverage Ratio 7.00 2.25 1.75 1.49 1.21 1.07 0.93 0.77 0.55
-0.27
Debt/Asset Ratio Current & Long
Intermediate Term
0.01 0.00 0.05 0.00 0.10 0.08 0.17 0.20 0.22 0.29 0.27 0.39 0.33 0.51 0.39 0.60 0.49 0.73 0.74 1.05
Efficiency (Capital) Capital Real Estate
Turnover Investment (years) Per Cow 1.40 $1,420 1.69 1,973 1.83 2,297 1.96 2,570 2.10 2,837 2.26 3,081 2.41 3,445 2.59 3,940 2.90 4,646 4.19 7,175
Machinery Investment
Per Cow $ 563
759 906
1,029 1,138 1,255 1,391 1,567 1,786 2,505
Debt Payments as Percent Debt
of Milk Sales Per Cow 2% $ 129 7 682
10 1,156 13 1,542 16 1,863 18 2,212 20 2,643 23 3,051 28 3,541 39 4,655
Profitability Percent Rate of Return with
appreciation on: Equity Investment**
30 19 17 14 13 12 11 10 9 9 7 7 5 6 3 5 0 3
-14 -2
Total Farm Change in Assets Net Worth Per Cow w/Appreciation $ 4,248 $184,415
5,080 77,982 5,571 55,765 5,916 44,425 6,287 36,412 6,653 28,486 7,224 21,656 7,810 15,973 8,820 9,520
11,461 -14,836 *Dollars of debt per dollar of equity, computed by dividing total liabilities by total equity. **Return on all farm capital (no deduction for interest paid) divided by total farm assets.

16
DEFINITIONS
11 Scheduled Debt Payments Per Cow -- Debt payments scheduled to be made during the coming year (as known at the end of the current year) divided by the end-of-year number of cows.
'l:I Available for Debt Service Per Cow -- Net cash farm income (cash receipts minus cash expenses excluding interest paid) plus off-farm income minus family living expenses (estimated at $10,900 per operator plus 4 percent of cash receipts), divided by the average number of cows.
'JJ Cash Flow Coverage Ratio -- Amount available for debt service per dollar of annual scheduled debt payment, computed by dividing the available dollars by the annual payments planned. A high, positive ratio indicates a strong capacity to repay debt.
11 Debt Payments as Percent of Milk Sales -- Amount of milk income committed to debt repayment, calculated by dividing scheduled debt payments by total milk sales ($).
2/ Debt Per Cow -- Total end-of-year debt divided by end-of-year number of cows.
§j Leverage Ratio -- Dollars of debt per dollar of equity, computed by dividing total farm liability by total farm equity (nonfarm assets and liabilities are excluded).
1/ Percent Equity -- End-of-year farm net worth divided by end-of-year total farm assets (nonfarm assets and liabilities are excluded).
§j Current and Intermediate Debt/Asset Ratio -- All farm liabilities on less than 10-year repayment divided by all farm assets excluding real estate and other long-term assets.
21 Long-Term Debt/Asset Ratio -- Farm liabilities on 10 years or more repayment, including all real estate mortgages, divided by the value of farm real estate and other long-term assets.
10/ Percent Rate of Return on Equity -- Return on equity capital divided by farm net worth. Includes the change in market value of all assets.
11/ Percent Rate of Return on Investment -- Return on all farm capital (no deduction for interest paid), divided by total farm assets. Includes the change in market value of all assets.
12/ Capital Turnover -- Average total farm assets per dollar of total farm income. This indicates the number of years required for total farm income to equal total farm assets.
13/ Real Estate Investment Per Cow -- End-of-year investment in real estate divided by endof-year number of cows.
14/ Machinery Investment Per Cow -- End-of-year machinery investment divided by end-ofyear number of cows.
15/ Total Farm Assets Per Cow -- Total end-of-year farm investment divided by end-of-year number of cows.
16/ Change in Net Worth -- Net worth at the end of year minus net worth at beginning of year.
Prepared by E.L. LaDue, Cornell University.

----
----
17
WORKSHEET 8. COMPUTATIONS FOR FINANCIAL ANALYSIS CHART
1. Debt payments per cow = Debt payments =
____ No. of cows (end)
Available for 2. Available for debt = interest and principal =
service per cow ____....;No. of cows (end)
3. Cash flow coverage ratio =
4. Debt payments as % of =
milk sales
5. Debt per cow =
Cash available for interest and
principal payments = Interest and
____ principal payments
Debt payments x 100 =
Milk sales
Total liabilities = No. of cows (end)
6. Leverage ratio = Total farm liabilities =
_____ Total farm equity
7. Percent equity = Net worth x 100 =
Total assets
$---
$---
---_%
$---
%
-----
--------
-----
-----
----------
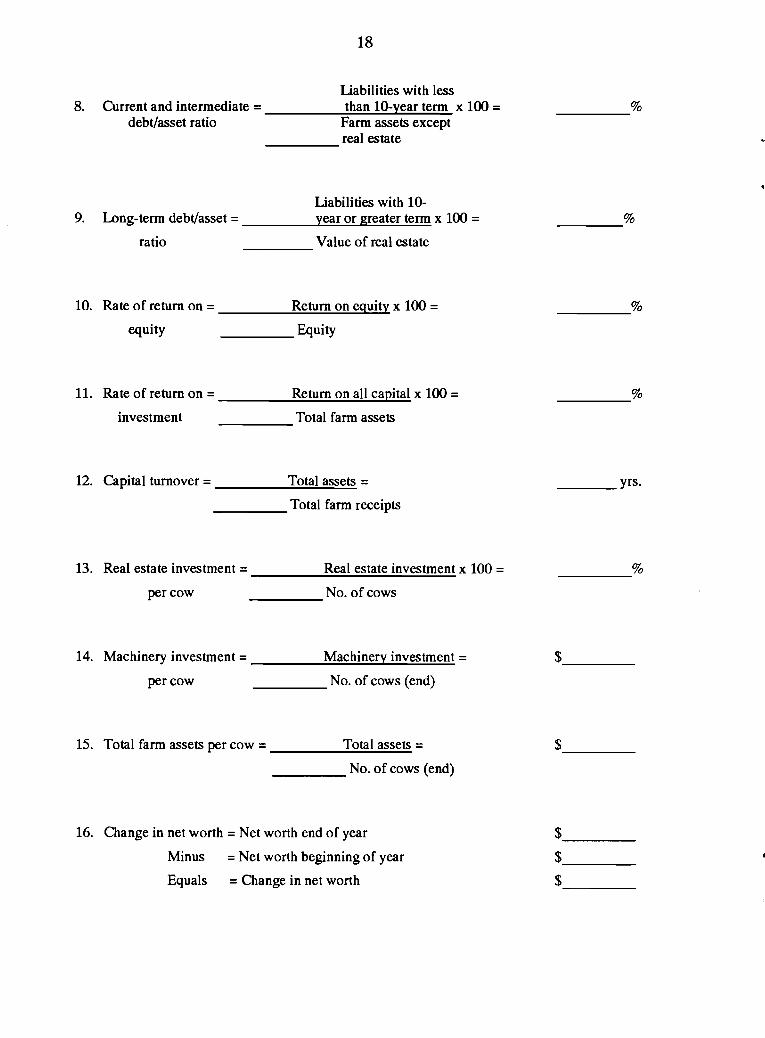
18
Liabilities with less 8. Current and intermediate = than lO-year term x 100 = %
debt/asset ratio Farm assets except _____ real estate
Liabilities with 109. Long-term debt/asset = year or greater term x 100 =
ratio Value of real estate
10. Rate of return on = Return on equity x 100 = equity ____ Equity
11. Rate of return on = Return on all capital x 100 =
investment _____ Total farm assets
12. Capital turnover = Total assets = _____ Total farm receipts
13. Real estate investment = Real estate investment x 100 =
per cow No. of cows
14. Machinery investment = Machinery investment =
per cow ____ No. of cows (end)
15. Total farm assets per cow = Total assets = ____ No. of cows (end)
16. Change in net worth = Net worth end of year
Minus = Net worth beginning of year
Equals = Change in net worth
%
%
%
____ yrs.
%
$---
$---
$---
$---
$---

Other Agricultural Economics Extension Publications
No. 90-25
Ne,. 90-26
No.
No.
No.
No.
Ne..
No.
90-27
90-28
90-29
90-30
91-1
91-2
•
No.
No.
91-3
91-4
Employee Recruitment and Selection Teaching Manual
Employee Recruitment and Selectlon Participant Manual
Farm Income Tax Management and Reporting
Pro-Dairy Financial Data Collection Workbook
Changes in the New York State Farm Minimum Wage Law
New York Economic Handbook 1991 Agricultural Situation and Outlook
Estimating Principal Due in Next 12 Manthe with Monthly Payments
Micro DFBS A Guide to Proceseing Dairy Farm Businees Summaries in County and Regional Extension Offices for Mlcro DFBS v 2.5
The National Dry Onion Market: A Monthly Analysis of New York State's Competitive Positl0n in Eastern Markets
Property T~~ Helief from New York's: Farmland Assessments and Agricultural Buildlngs Exemptions in the 1980's
Thomas Maloney Joann Gruttadaurio Walter Nelson Kristen Park Joan Pet:zen Alan White
Thc,mue Maloney Joann Gruttadaurio Walter Nelson Kristen Park Joan Petzen Alan White
George L. Casler Stuart F. Smith
Jonas B. Kauffman Stuart F. Smith
Thomas R. Maloney Kay Embrey
Extension Staff
Eddy L. LaDue
Linda D. PutnalD Wayne A. Knoblauch Stuart F. Smith
Enrique Figueroa
Hlchard N. Boisvert Nelson L. Bills