daimler fact sheet for q1 2013 · daimler buses 7,872 10,631 9,207 10,805 7,935 10,810 7,358 6,370...
TRANSCRIPT
Fact Sheet for Q1 2013
April 24, 2013
Contents
Daimler Group
Stock Market Information 3
Earnings and Financial Situation 4 - 13
Information for Divisions
Mercedes-Benz Cars 14 - 17
Daimler Trucks 18 - 22
Mercedes-Benz Vans 23 - 25
Daimler Buses 26 - 27
Daimler Financial Services 28
2

Stock Market Information
2nd Quarter 3rd Quarter 4th Quarter 1st Quarter2012 2011 2012 2011 2012 2011 2013 2012 Change
Earnings per share (in EUR)* basic 1.39 1.51 1.06 1.21 2.11 1.61 0.50 1.26 -60% diluted 1.39 1.51 1.06 1.21 2.11 1.61 0.50 1.26 -60%
Average number of shares outstanding (in millions)(adjusted for treasury stocks) basic 1,066.4 1,065.7 1,067.0 1,066.2 1,067.4 1,066.3 1,067.7 1,066.4 +0% diluted 1,066.8 1,067.3 1,067.3 1,066.8 1,067.5 1,066.3 1,068.1 1,067.3 +0%
Number of shares outstanding 1,066.5 1,065.8 1,067.3 1,066.3 1,067.6 1,066.3 1,067.9 1,066.4 +0%(at period end, in millions)
Share price Frankfurt 35.35 51.90 37.67 33.63 41.32 33.92 42.45 45.21 -6%(at period end, in EUR)
Market capitalization Frankfurt 37.70 55.32 40.20 35.86 44.11 36.17 45.33 48.21 -6%(at period end, in billions of EUR)
* The 2012 figures were adjusted for the effects of the application of the revised IAS 19.
3
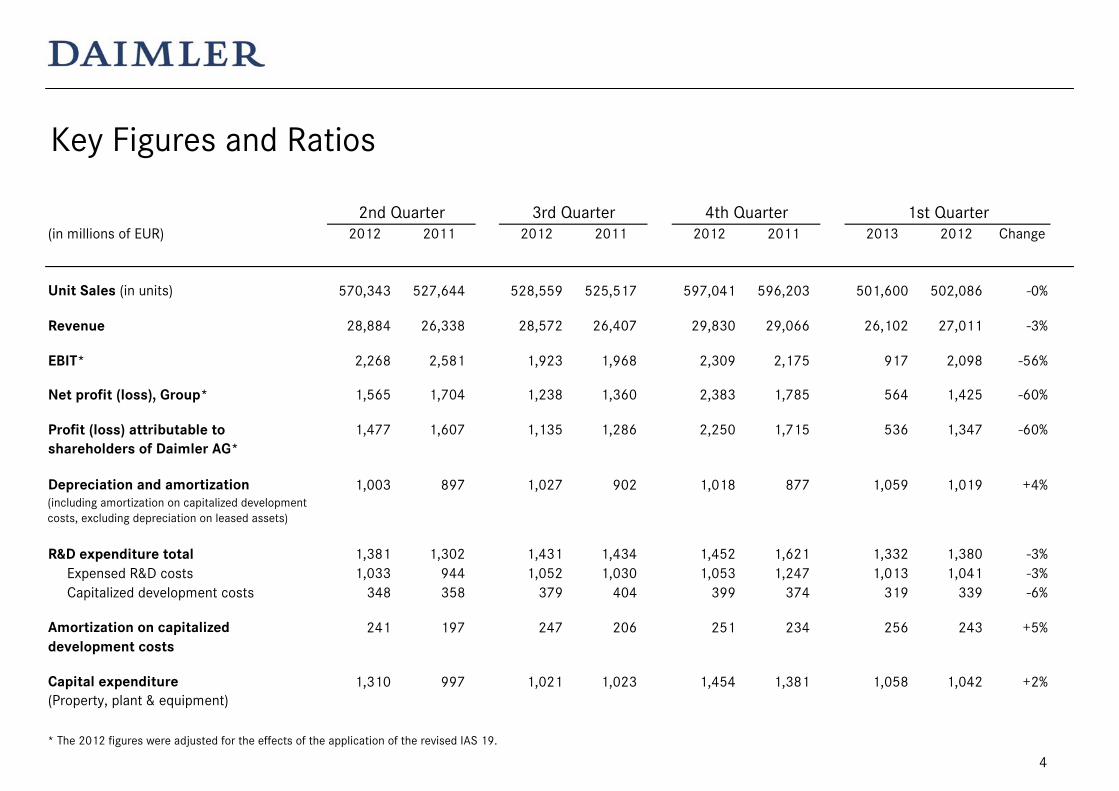
Key Figures and Ratios
2nd Quarter 3rd Quarter 4th Quarter 1st Quarter(in millions of EUR) 2012 2011 2012 2011 2012 2011 2013 2012 Change
Unit Sales (in units) 570,343 527,644 528,559 525,517 597,041 596,203 501,600 502,086 -0%
Revenue 28,884 26,338 28,572 26,407 29,830 29,066 26,102 27,011 -3%
EBIT* 2,268 2,581 1,923 1,968 2,309 2,175 917 2,098 -56%
Net profit (loss), Group* 1,565 1,704 1,238 1,360 2,383 1,785 564 1,425 -60%
Profit (loss) attributable to 1,477 1,607 1,135 1,286 2,250 1,715 536 1,347 -60%shareholders of Daimler AG*
Depreciation and amortization 1,003 897 1,027 902 1,018 877 1,059 1,019 +4%
R&D expenditure total 1,381 1,302 1,431 1,434 1,452 1,621 1,332 1,380 -3% Expensed R&D costs 1,033 944 1,052 1,030 1,053 1,247 1,013 1,041 -3% Capitalized development costs 348 358 379 404 399 374 319 339 -6%
Amortization on capitalized 241 197 247 206 251 234 256 243 +5%development costs
Capital expenditure 1,310 997 1,021 1,023 1,454 1,381 1,058 1,042 +2%(Property, plant & equipment)
* The 2012 figures were adjusted for the effects of the application of the revised IAS 19.
(including amortization on capitalized development costs, excluding depreciation on leased assets)
4
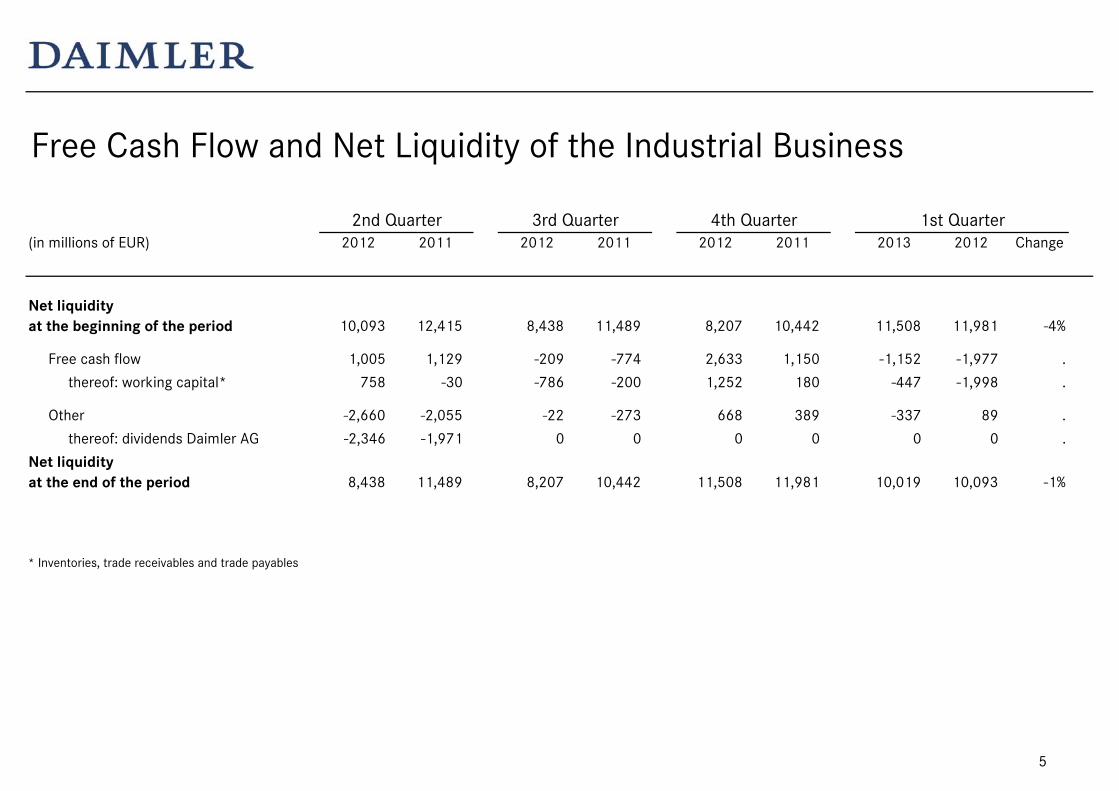
Free Cash Flow and Net Liquidity of the Industrial Business
2nd Quarter 3rd Quarter 4th Quarter 1st Quarter(in millions of EUR) 2012 2011 2012 2011 2012 2011 2013 2012 Change
Net liquidityat the beginning of the period 10,093 12,415 8,438 11,489 8,207 10,442 11,508 11,981 -4%
Free cash flow 1,005 1,129 -209 -774 2,633 1,150 -1,152 -1,977 .
thereof: working capital* 758 -30 -786 -200 1,252 180 -447 -1,998 .
Other -2,660 -2,055 -22 -273 668 389 -337 89 .
thereof: dividends Daimler AG -2,346 -1,971 0 0 0 0 0 0 .
Net liquidityat the end of the period 8,438 11,489 8,207 10,442 11,508 11,981 10,019 10,093 -1%
* Inventories, trade receivables and trade payables
5
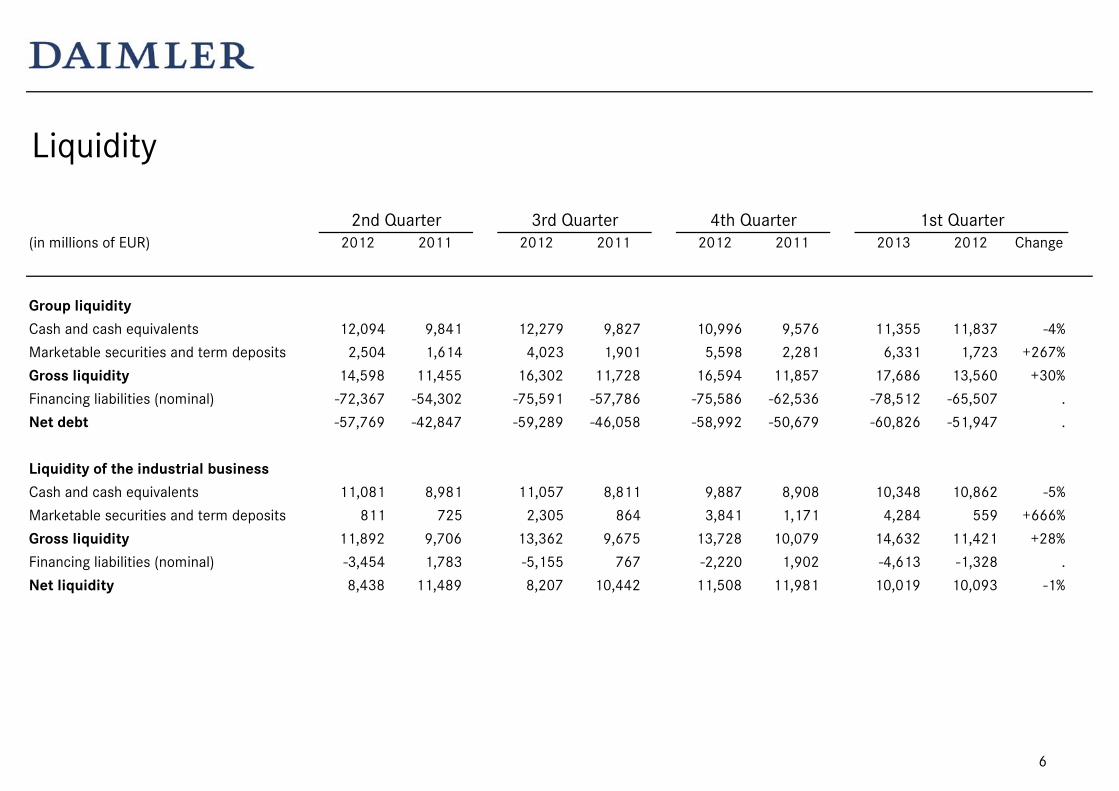
Liquidity
2nd Quarter 3rd Quarter 4th Quarter 1st Quarter(in millions of EUR) 2012 2011 2012 2011 2012 2011 2013 2012 Change
Group liquidityCash and cash equivalents 12,094 9,841 12,279 9,827 10,996 9,576 11,355 11,837 -4%
Marketable securities and term deposits 2,504 1,614 4,023 1,901 5,598 2,281 6,331 1,723 +267%
Gross liquidity 14,598 11,455 16,302 11,728 16,594 11,857 17,686 13,560 +30%
Financing liabilities (nominal) -72,367 -54,302 -75,591 -57,786 -75,586 -62,536 -78,512 -65,507 .
Net debt -57,769 -42,847 -59,289 -46,058 -58,992 -50,679 -60,826 -51,947 .
Liquidity of the industrial businessCash and cash equivalents 11,081 8,981 11,057 8,811 9,887 8,908 10,348 10,862 -5%
Marketable securities and term deposits 811 725 2,305 864 3,841 1,171 4,284 559 +666%
Gross liquidity 11,892 9,706 13,362 9,675 13,728 10,079 14,632 11,421 +28%
Financing liabilities (nominal) -3,454 1,783 -5,155 767 -2,220 1,902 -4,613 -1,328 .
Net liquidity 8,438 11,489 8,207 10,442 11,508 11,981 10,019 10,093 -1%
6
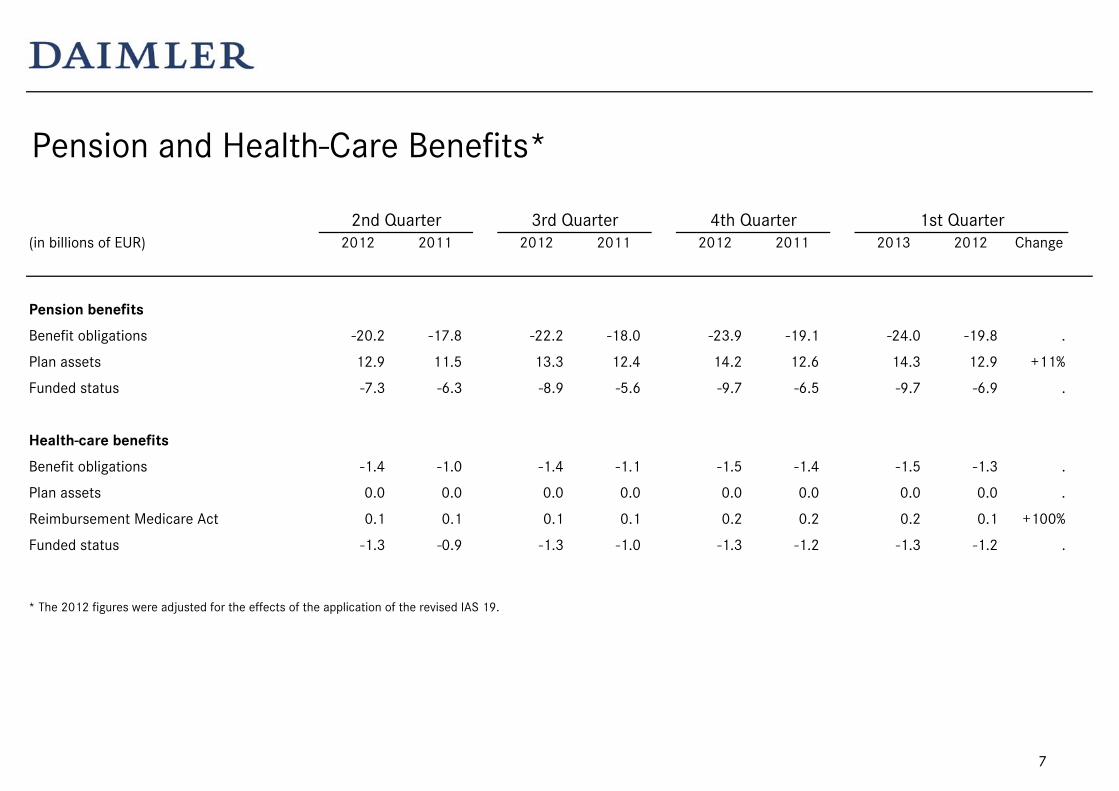
Pension and Health-Care Benefits*
2nd Quarter 3rd Quarter 4th Quarter 1st Quarter(in billions of EUR) 2012 2011 2012 2011 2012 2011 2013 2012 Change
Pension benefits
Benefit obligations -20.2 -17.8 -22.2 -18.0 -23.9 -19.1 -24.0 -19.8 .
Plan assets 12.9 11.5 13.3 12.4 14.2 12.6 14.3 12.9 +11%
Funded status -7.3 -6.3 -8.9 -5.6 -9.7 -6.5 -9.7 -6.9 .
Health-care benefits
Benefit obligations -1.4 -1.0 -1.4 -1.1 -1.5 -1.4 -1.5 -1.3 .
Plan assets 0.0 0.0 0.0 0.0 0.0 0.0 0.0 0.0 .
Reimbursement Medicare Act 0.1 0.1 0.1 0.1 0.2 0.2 0.2 0.1 +100%
Funded status -1.3 -0.9 -1.3 -1.0 -1.3 -1.2 -1.3 -1.2 .
* The 2012 figures were adjusted for the effects of the application of the revised IAS 19.
7
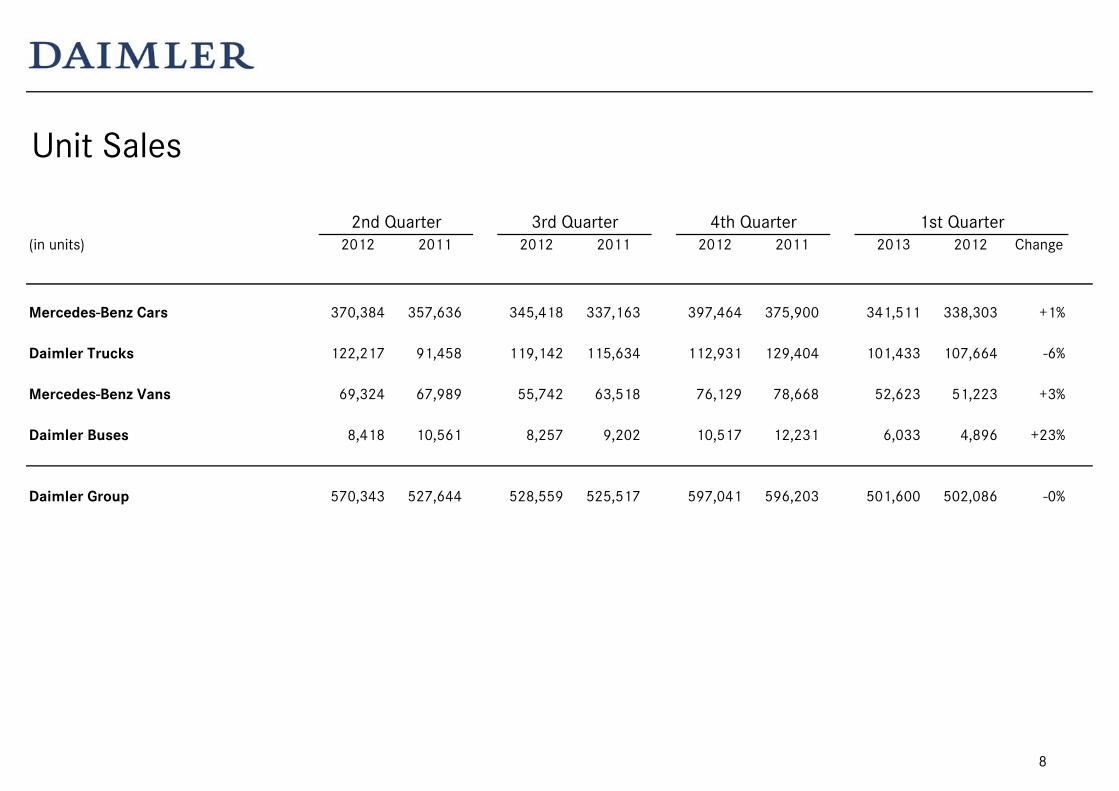
Unit Sales
2nd Quarter 3rd Quarter 4th Quarter 1st Quarter(in units) 2012 2011 2012 2011 2012 2011 2013 2012 Change
Mercedes-Benz Cars 370,384 357,636 345,418 337,163 397,464 375,900 341,511 338,303 +1%
Daimler Trucks 122,217 91,458 119,142 115,634 112,931 129,404 101,433 107,664 -6%
Mercedes-Benz Vans 69,324 67,989 55,742 63,518 76,129 78,668 52,623 51,223 +3%
Daimler Buses 8,418 10,561 8,257 9,202 10,517 12,231 6,033 4,896 +23%
Daimler Group 570,343 527,644 528,559 525,517 597,041 596,203 501,600 502,086 -0%
8
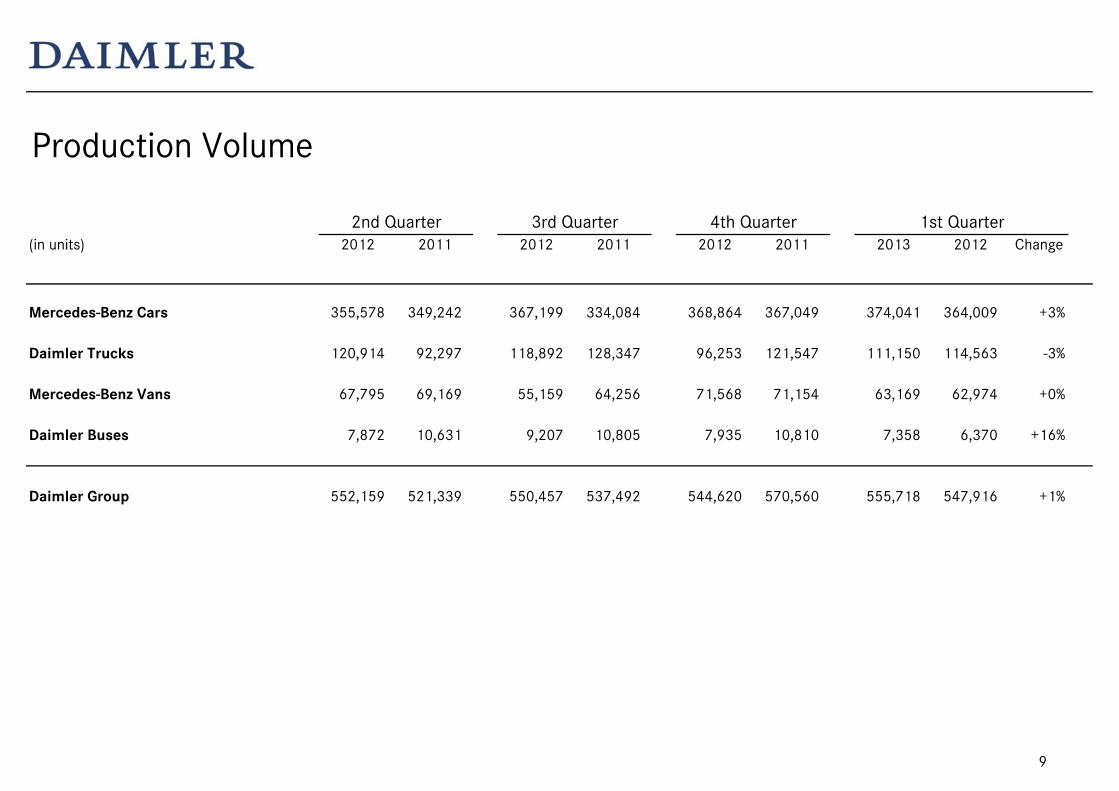
Production Volume
2nd Quarter 3rd Quarter 4th Quarter 1st Quarter(in units) 2012 2011 2012 2011 2012 2011 2013 2012 Change
Mercedes-Benz Cars 355,578 349,242 367,199 334,084 368,864 367,049 374,041 364,009 +3%
Daimler Trucks 120,914 92,297 118,892 128,347 96,253 121,547 111,150 114,563 -3%
Mercedes-Benz Vans 67,795 69,169 55,159 64,256 71,568 71,154 63,169 62,974 +0%
Daimler Buses 7,872 10,631 9,207 10,805 7,935 10,810 7,358 6,370 +16%
Daimler Group 552,159 521,339 550,457 537,492 544,620 570,560 555,718 547,916 +1%
9
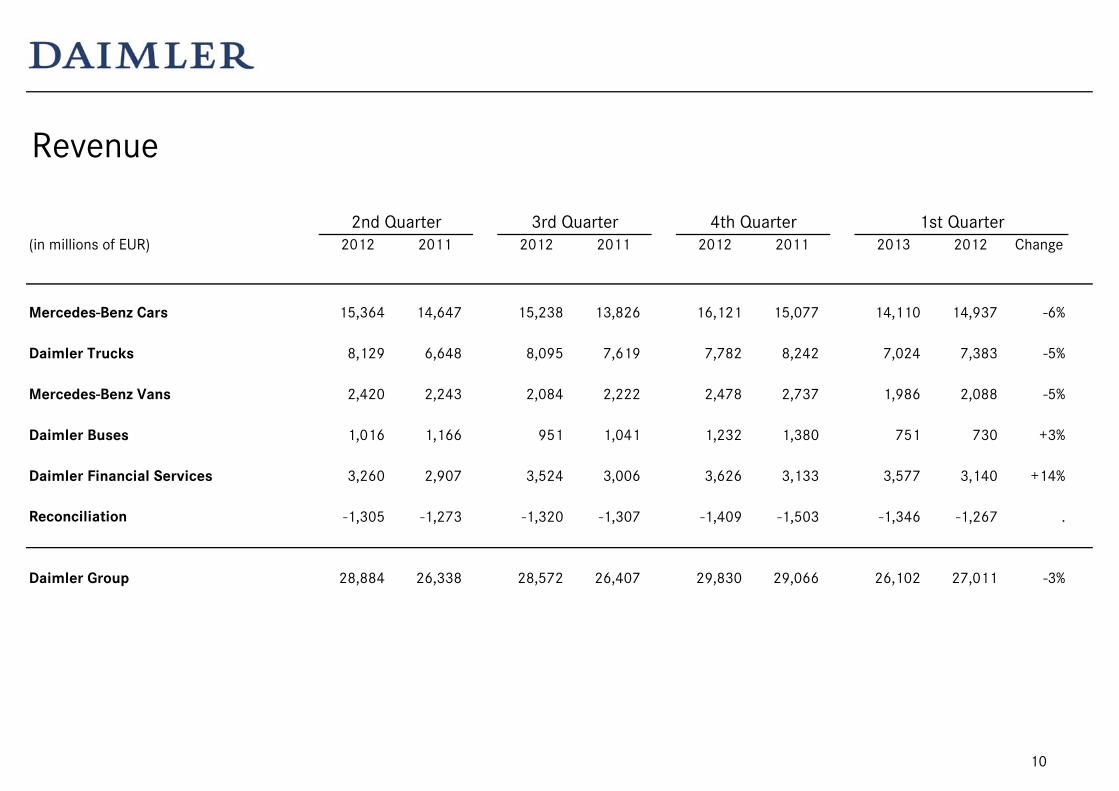
Revenue
2nd Quarter 3rd Quarter 4th Quarter 1st Quarter(in millions of EUR) 2012 2011 2012 2011 2012 2011 2013 2012 Change
Mercedes-Benz Cars 15,364 14,647 15,238 13,826 16,121 15,077 14,110 14,937 -6%
Daimler Trucks 8,129 6,648 8,095 7,619 7,782 8,242 7,024 7,383 -5%
Mercedes-Benz Vans 2,420 2,243 2,084 2,222 2,478 2,737 1,986 2,088 -5%
Daimler Buses 1,016 1,166 951 1,041 1,232 1,380 751 730 +3%
Daimler Financial Services 3,260 2,907 3,524 3,006 3,626 3,133 3,577 3,140 +14%
Reconciliation -1,305 -1,273 -1,320 -1,307 -1,409 -1,503 -1,346 -1,267 .
Daimler Group 28,884 26,338 28,572 26,407 29,830 29,066 26,102 27,011 -3%
10

Earnings Before Interest and Taxes (EBIT) and Return on Sales (RoS)*
2nd Quarter 3rd Quarter 4th Quarter 1st Quarter(EBIT in millions of EUR, RoS in %) 2012 2011 2012 2011 2012 2011 2013 2012 Change
Mercedes-Benz Cars EBIT 1,337 1,566 973 1,108 851 1,230 460 1,230 -63% RoS 8.7% 10.7% 6.4% 8.0% 5.3% 8.2% 3.3% 8.2% .
Daimler Trucks EBIT 524 486 501 555 294 422 116 376 -69% RoS 6.4% 7.3% 6.2% 7.3% 3.8% 5.1% 1.7% 5.1% .
Mercedes-Benz Vans EBIT 200 206 75 200 101 256 81 167 -51% RoS 8.3% 9.2% 3.6% 9.0% 4.1% 9.4% 4.1% 8.0% .
Daimler Buses EBIT -59 61 -36 25 -21 109 -31 -105 . RoS -5.8% 5.2% -3.8% 2.4% -1.7% 7.9% -4.1% -14.4% .
Daimler Financial Services 338 340 322 337 289 314 314 344 -9%
Reconciliation -72 -78 88 -257 795 -156 -23 86 . thereof: share of result of EADS 17 -3 105 15 747 57 34 133 -74%
Daimler Group 2,268 2,581 1,923 1,968 2,309 2,175 917 2,098 -56%
* The 2012 figures were adjusted for the effects of the application of the revised IAS 19.
** thereof gain on the sale of EADS shares: 709 million EUR.
**
11
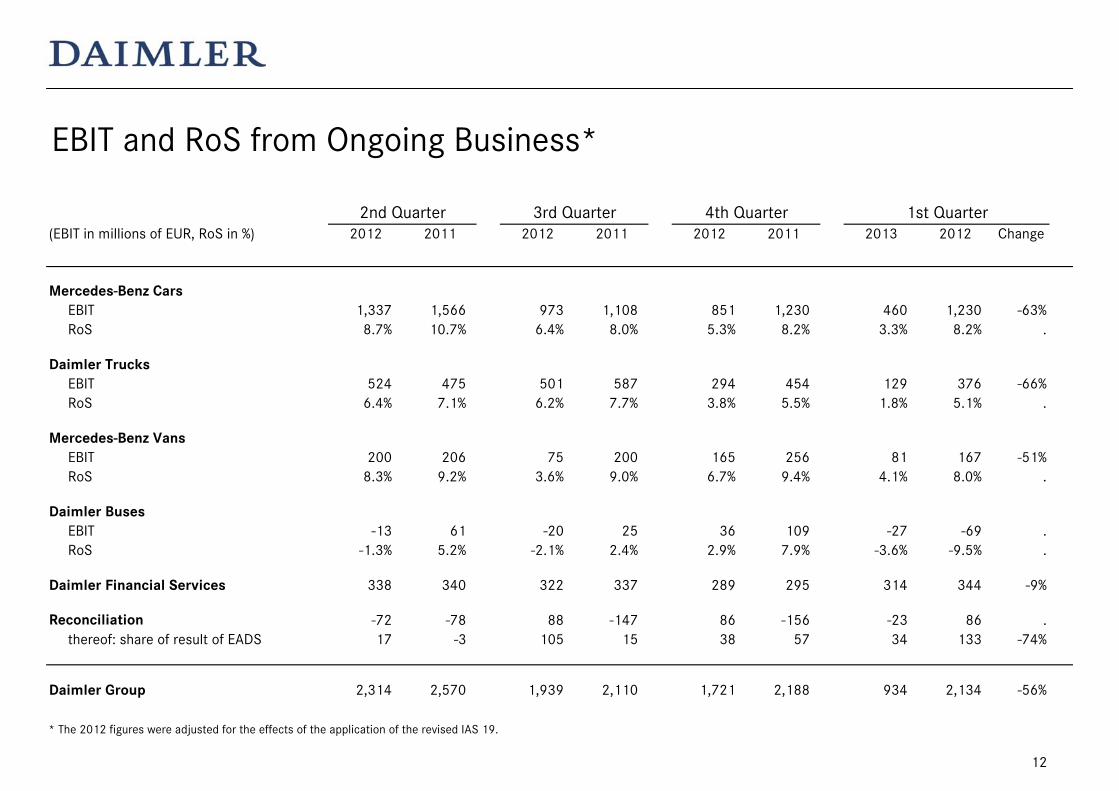
EBIT and RoS from Ongoing Business*
2nd Quarter 3rd Quarter 4th Quarter 1st Quarter(EBIT in millions of EUR, RoS in %) 2012 2011 2012 2011 2012 2011 2013 2012 Change
Mercedes-Benz Cars EBIT 1,337 1,566 973 1,108 851 1,230 460 1,230 -63% RoS 8.7% 10.7% 6.4% 8.0% 5.3% 8.2% 3.3% 8.2% .
Daimler Trucks EBIT 524 475 501 587 294 454 129 376 -66% RoS 6.4% 7.1% 6.2% 7.7% 3.8% 5.5% 1.8% 5.1% .
Mercedes-Benz Vans EBIT 200 206 75 200 165 256 81 167 -51% RoS 8.3% 9.2% 3.6% 9.0% 6.7% 9.4% 4.1% 8.0% .
Daimler Buses EBIT -13 61 -20 25 36 109 -27 -69 . RoS -1.3% 5.2% -2.1% 2.4% 2.9% 7.9% -3.6% -9.5% .
Daimler Financial Services 338 340 322 337 289 295 314 344 -9%
Reconciliation -72 -78 88 -147 86 -156 -23 86 . thereof: share of result of EADS 17 -3 105 15 38 57 34 133 -74%
Daimler Group 2,314 2,570 1,939 2,110 1,721 2,188 934 2,134 -56%
* The 2012 figures were adjusted for the effects of the application of the revised IAS 19.
12
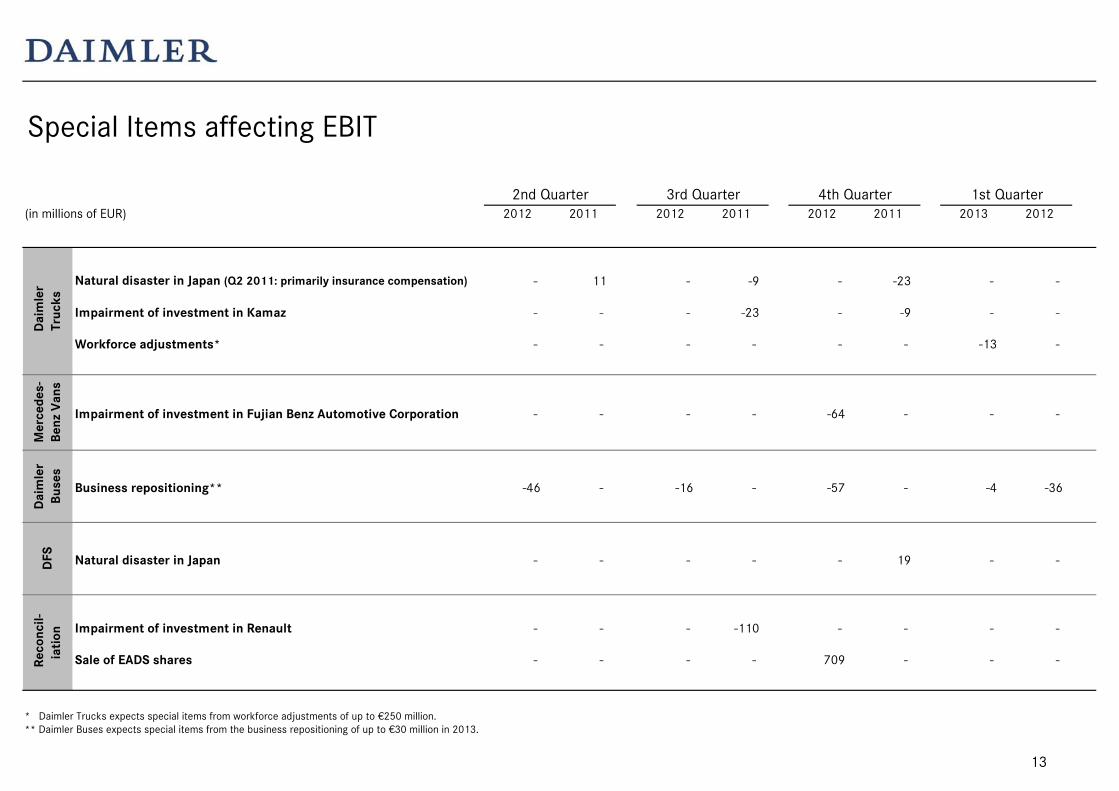
Special Items affecting EBIT
2nd Quarter 3rd Quarter 4th Quarter 1st Quarter(in millions of EUR) 2012 2011 2012 2011 2012 2011 2013 2012
Natural disaster in Japan (Q2 2011: primarily insurance compensation) - 11 - -9 - -23 - -
Impairment of investment in Kamaz - - - -23 - -9 - -
Workforce adjustments* - - - - - - -13 -
Impairment of investment in Fujian Benz Automotive Corporation - - - - -64 - - -
Business repositioning** -46 - -16 - -57 - -4 -36
Natural disaster in Japan - - - - - 19 - -
Impairment of investment in Renault - - - -110 - - - -
Sale of EADS shares - - - - 709 - - -
* Daimler Trucks expects special items from workforce adjustments of up to €250 million.** Daimler Buses expects special items from the business repositioning of up to €30 million in 2013.
Dai
mle
rTr
ucks
DFS
Reco
ncil-
iati
onD
aim
ler
Buse
sM
erce
des-
Benz
Van
s
13
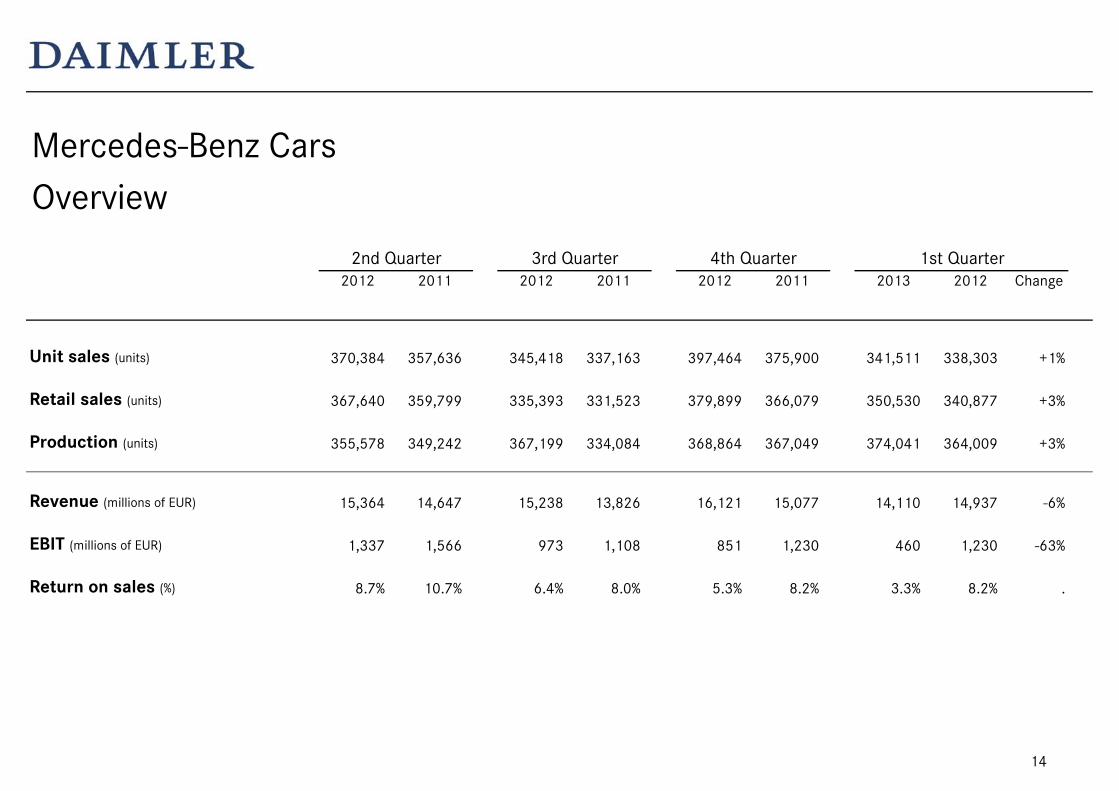
Mercedes-Benz CarsOverview
2nd Quarter 3rd Quarter 4th Quarter 1st Quarter2012 2011 2012 2011 2012 2011 2013 2012 Change
Unit sales (units) 370,384 357,636 345,418 337,163 397,464 375,900 341,511 338,303 +1%
Retail sales (units) 367,640 359,799 335,393 331,523 379,899 366,079 350,530 340,877 +3%
Production (units) 355,578 349,242 367,199 334,084 368,864 367,049 374,041 364,009 +3%
Revenue (millions of EUR) 15,364 14,647 15,238 13,826 16,121 15,077 14,110 14,937 -6%
EBIT (millions of EUR) 1,337 1,566 973 1,108 851 1,230 460 1,230 -63%
Return on sales (%) 8.7% 10.7% 6.4% 8.0% 5.3% 8.2% 3.3% 8.2% .
14

Mercedes-Benz CarsUnit Sales
2nd Quarter 3rd Quarter 4th Quarter 1st Quarter(in units) 2012 2011 2012 2011 2012 2011 2013 2012 Change
Mercedes-Benz Cars 370,384 357,636 345,418 337,163 397,464 375,900 341,511 338,303 +1%
Western Europe 169,347 176,235 143,183 149,683 162,619 159,336 149,691 156,274 -4%of which Germany 80,911 82,826 68,479 73,496 75,865 78,587 61,130 64,668 -5%
NAFTA 76,851 64,496 83,984 63,265 102,814 93,159 77,775 78,471 -1%of which USA 65,453 54,193 74,247 55,122 91,438 82,430 67,998 68,603 -1%
Asia 88,910 79,174 82,497 90,037 93,387 90,933 78,745 73,492 +7%of which China 59,686 52,498 47,127 59,270 59,163 62,430 46,412 42,518 +9%
Rest of World 35,276 37,731 35,754 34,178 38,644 32,472 35,300 30,066 +17%
15
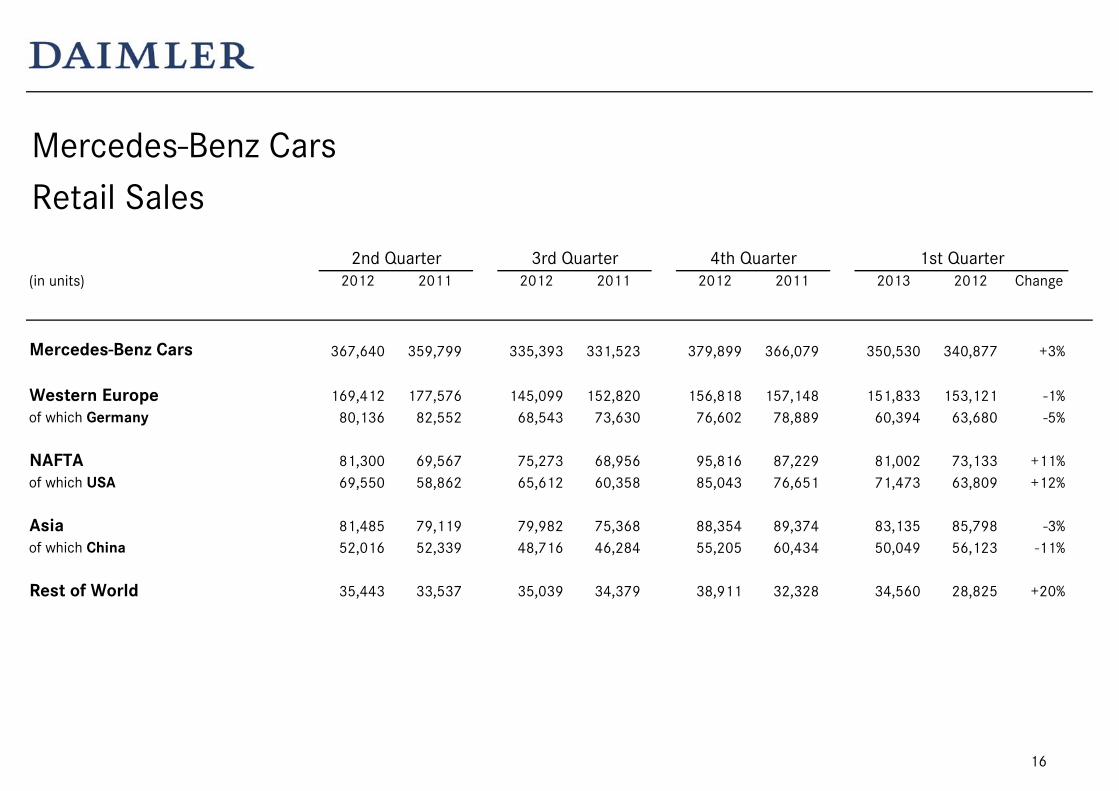
Mercedes-Benz CarsRetail Sales
2nd Quarter 3rd Quarter 4th Quarter 1st Quarter(in units) 2012 2011 2012 2011 2012 2011 2013 2012 Change
Mercedes-Benz Cars 367,640 359,799 335,393 331,523 379,899 366,079 350,530 340,877 +3%
Western Europe 169,412 177,576 145,099 152,820 156,818 157,148 151,833 153,121 -1%of which Germany 80,136 82,552 68,543 73,630 76,602 78,889 60,394 63,680 -5%
NAFTA 81,300 69,567 75,273 68,956 95,816 87,229 81,002 73,133 +11%of which USA 69,550 58,862 65,612 60,358 85,043 76,651 71,473 63,809 +12%
Asia 81,485 79,119 79,982 75,368 88,354 89,374 83,135 85,798 -3%of which China 52,016 52,339 48,716 46,284 55,205 60,434 50,049 56,123 -11%
Rest of World 35,443 33,537 35,039 34,379 38,911 32,328 34,560 28,825 +20%
16

Mercedes-Benz CarsMarket Shares*
2nd Quarter 3rd Quarter 4th Quarter 1st Quarter(in %) 2012 2011 2012 2011 2012 2011 2013 2012 Change
in % pts.
Western Europe 5.3 4.9 5.5 5.2 5.5 5.0 5.6 4.9 +0.7of which Germany 10.4 9.9 10.0 10.2 10.5 10.2 10.4 9.4 +1.0
USA 1.8 1.8 1.8 1.9 2.4 2.4 1.9 1.8 +0.1
China 1.4 1.4 1.4 1.4 1.4 1.4 1.3 1.4 -0.1
Japan 0.9 1.2 1.0 1.0 1.3 0.9 0.9 0.8 +0.1
* Based on estimates in certain markets.
17
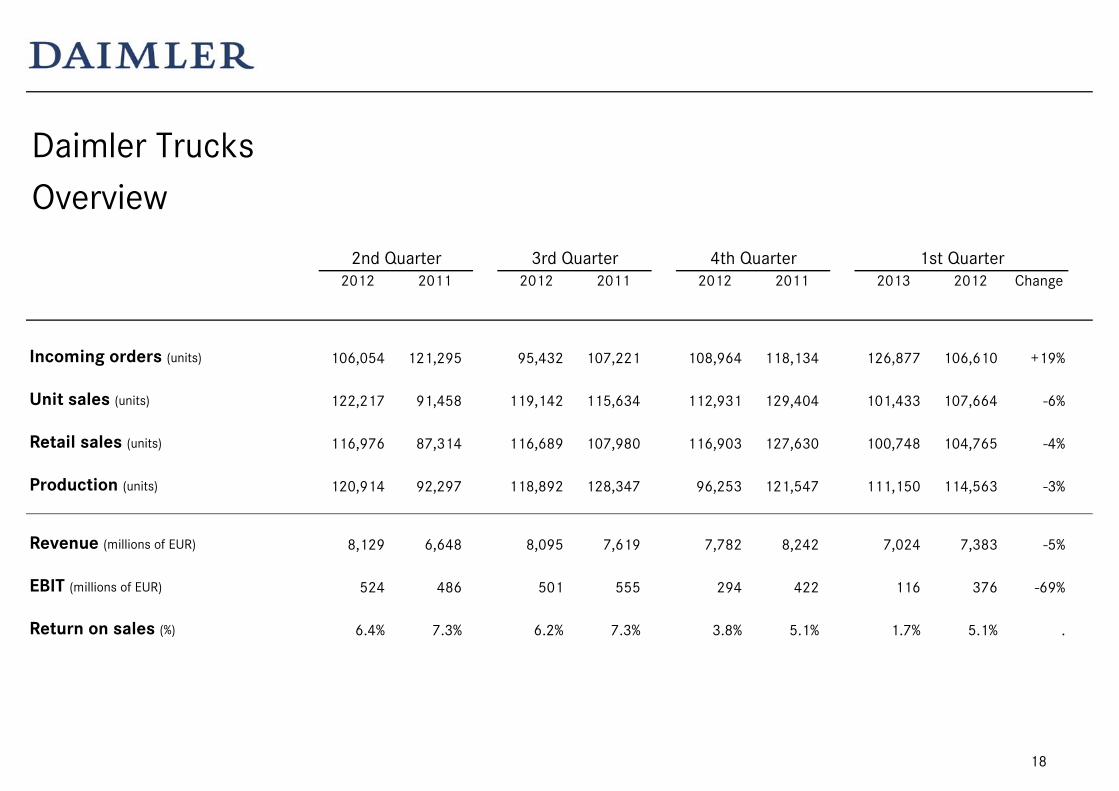
Daimler TrucksOverview
2nd Quarter 3rd Quarter 4th Quarter 1st Quarter2012 2011 2012 2011 2012 2011 2013 2012 Change
Incoming orders (units) 106,054 121,295 95,432 107,221 108,964 118,134 126,877 106,610 +19%
Unit sales (units) 122,217 91,458 119,142 115,634 112,931 129,404 101,433 107,664 -6%
Retail sales (units) 116,976 87,314 116,689 107,980 116,903 127,630 100,748 104,765 -4%
Production (units) 120,914 92,297 118,892 128,347 96,253 121,547 111,150 114,563 -3%
Revenue (millions of EUR) 8,129 6,648 8,095 7,619 7,782 8,242 7,024 7,383 -5%
EBIT (millions of EUR) 524 486 501 555 294 422 116 376 -69%
Return on sales (%) 6.4% 7.3% 6.2% 7.3% 3.8% 5.1% 1.7% 5.1% .
18

Daimler TrucksUnit Sales
2nd Quarter 3rd Quarter 4th Quarter 1st Quarter(in units) 2012 2011 2012 2011 2012 2011 2013 2012 Change
Daimler Trucks 122,217 91,458 119,142 115,634 112,931 129,404 101,433 107,664 -6%
Western Europe 15,041 15,705 14,193 15,967 15,722 18,223 11,968 13,066 -8%of which Germany 8,189 8,152 7,954 8,372 8,542 9,498 6,212 6,401 -3%
NAFTA 34,573 27,315 35,177 32,762 32,639 31,681 30,642 32,639 -6%of which USA 28,415 23,302 29,863 27,645 28,116 26,738 26,641 27,432 -3%
Latin America (excl. Mexico) 10,209 13,495 12,541 17,354 13,516 17,278 12,987 9,931 +31%
Asia 46,193 22,840 42,698 35,127 34,796 46,442 35,221 40,047 -12%of which Japan 8,812 5,120 8,167 6,821 8,218 9,447 8,862 9,778 -9%
Rest of World 16,201 12,103 14,533 14,424 16,258 15,780 10,615 11,981 -11%
BFDA - Beijing Foton DaimlerAutomotive Co. Ltd. (Auman Trucks) - - 13,308 - 18,064 - 23,001 - .
Daimler Trucks including BFDA 122,217 91,458 132,450 115,634 130,995 129,404 124,434 107,664 +16%
19
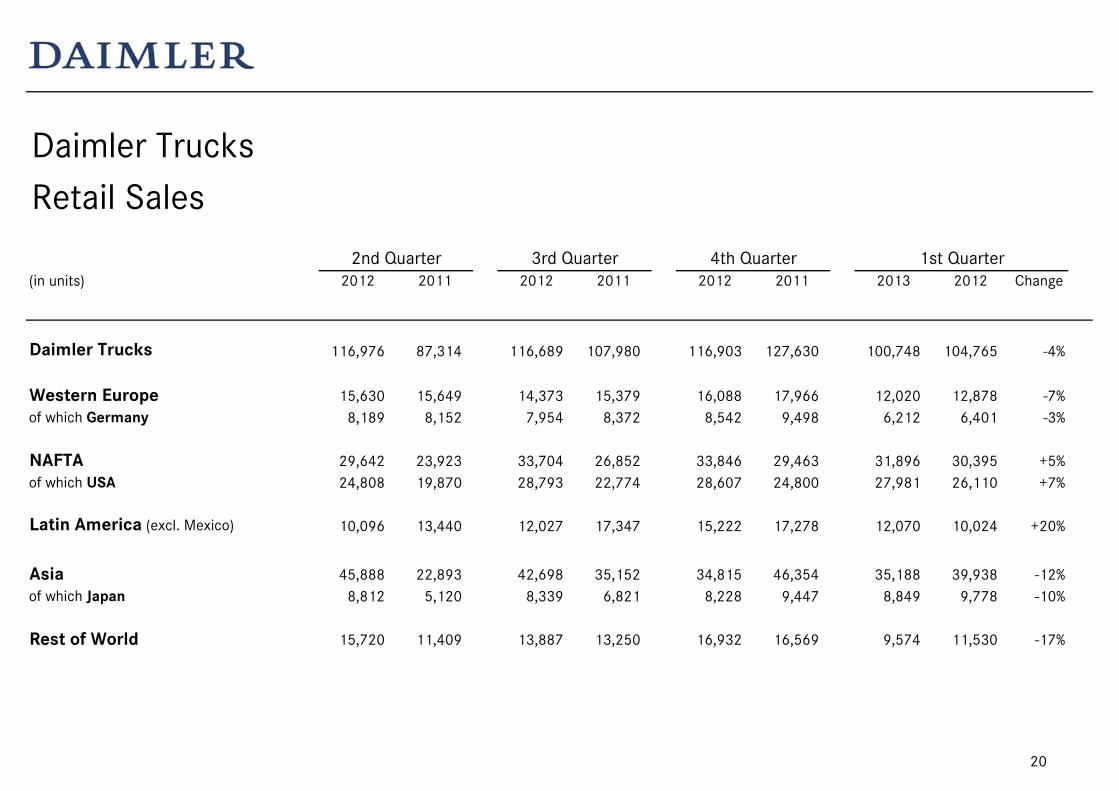
Daimler TrucksRetail Sales
2nd Quarter 3rd Quarter 4th Quarter 1st Quarter(in units) 2012 2011 2012 2011 2012 2011 2013 2012 Change
Daimler Trucks 116,976 87,314 116,689 107,980 116,903 127,630 100,748 104,765 -4%
Western Europe 15,630 15,649 14,373 15,379 16,088 17,966 12,020 12,878 -7%of which Germany 8,189 8,152 7,954 8,372 8,542 9,498 6,212 6,401 -3%
NAFTA 29,642 23,923 33,704 26,852 33,846 29,463 31,896 30,395 +5%of which USA 24,808 19,870 28,793 22,774 28,607 24,800 27,981 26,110 +7%
Latin America (excl. Mexico) 10,096 13,440 12,027 17,347 15,222 17,278 12,070 10,024 +20%
Asia 45,888 22,893 42,698 35,152 34,815 46,354 35,188 39,938 -12%of which Japan 8,812 5,120 8,339 6,821 8,228 9,447 8,849 9,778 -10%
Rest of World 15,720 11,409 13,887 13,250 16,932 16,569 9,574 11,530 -17%
20
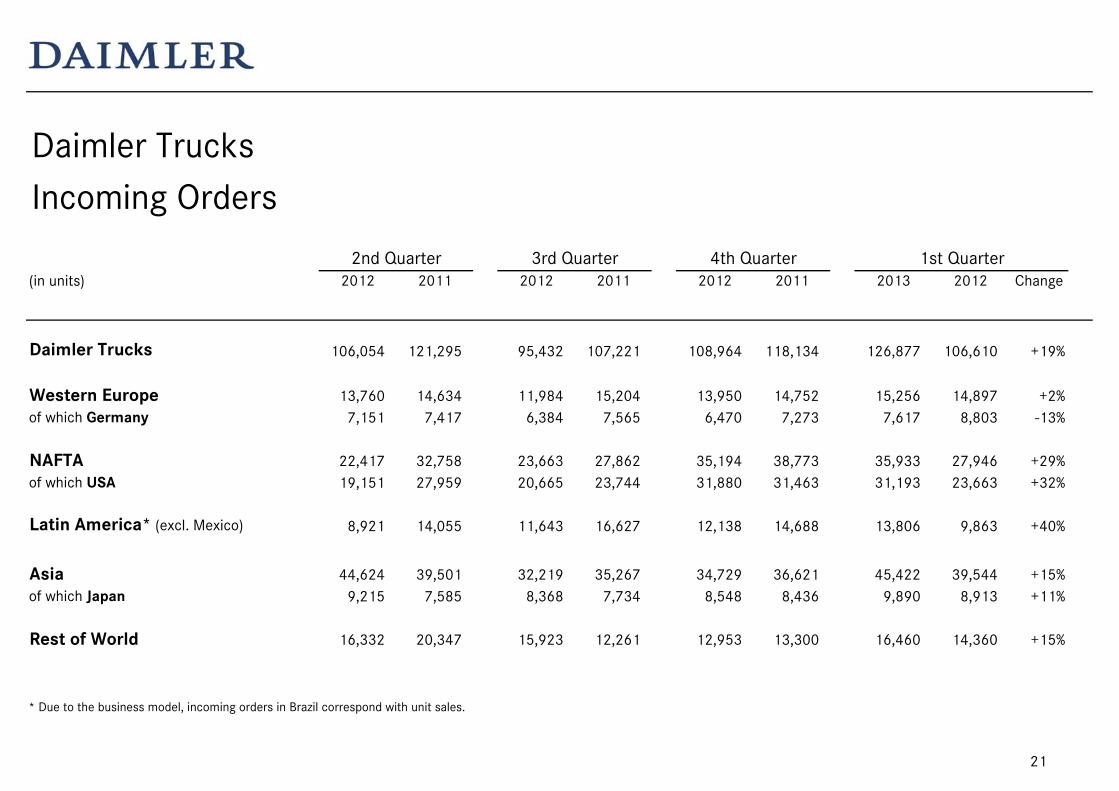
Daimler TrucksIncoming Orders
2nd Quarter 3rd Quarter 4th Quarter 1st Quarter(in units) 2012 2011 2012 2011 2012 2011 2013 2012 Change
Daimler Trucks 106,054 121,295 95,432 107,221 108,964 118,134 126,877 106,610 +19%
Western Europe 13,760 14,634 11,984 15,204 13,950 14,752 15,256 14,897 +2%of which Germany 7,151 7,417 6,384 7,565 6,470 7,273 7,617 8,803 -13%
NAFTA 22,417 32,758 23,663 27,862 35,194 38,773 35,933 27,946 +29%of which USA 19,151 27,959 20,665 23,744 31,880 31,463 31,193 23,663 +32%
Latin America* (excl. Mexico) 8,921 14,055 11,643 16,627 12,138 14,688 13,806 9,863 +40%
Asia 44,624 39,501 32,219 35,267 34,729 36,621 45,422 39,544 +15%of which Japan 9,215 7,585 8,368 7,734 8,548 8,436 9,890 8,913 +11%
Rest of World 16,332 20,347 15,923 12,261 12,953 13,300 16,460 14,360 +15%
* Due to the business model, incoming orders in Brazil correspond with unit sales.
21

Daimler TrucksMarket Shares*
2nd Quarter 3rd Quarter 4th Quarter 1st Quarter(in %) 2012 2011 2012 2011 2012 2011 2013 2012 Change
in % pts.
Trucks Europe / Latin America(Mercedes-Benz) Western Europe MDT/HDT 23.3 20.8 24.0 23.1 22.0 23.7 22.5 22.5 +0.0 Germany MDT/HDT 38.0 34.2 39.9 39.4 39.6 40.4 41.2 39.4 +1.8 Brazil MDT/HDT 26.3 24.7 25.3 24.8 24.2 25.1 22.9 27.1 -4.2
Trucks NAFTA(Freightliner/Western Star) NAFTA Class 8 29.9 31.3 32.6 28.5 34.4 30.6 42.1 35.4 +6.7 NAFTA Class 6-7 35.7 33.3 35.4 31.0 37.2 35.8 46.7 41.1 +5.6
Trucks Asia(Fuso) Japan Trucks Total 20.8 20.0 21.5 19.1 19.4 22.8 19.2 20.2 -1.0
* Based on estimates in certain markets.
22
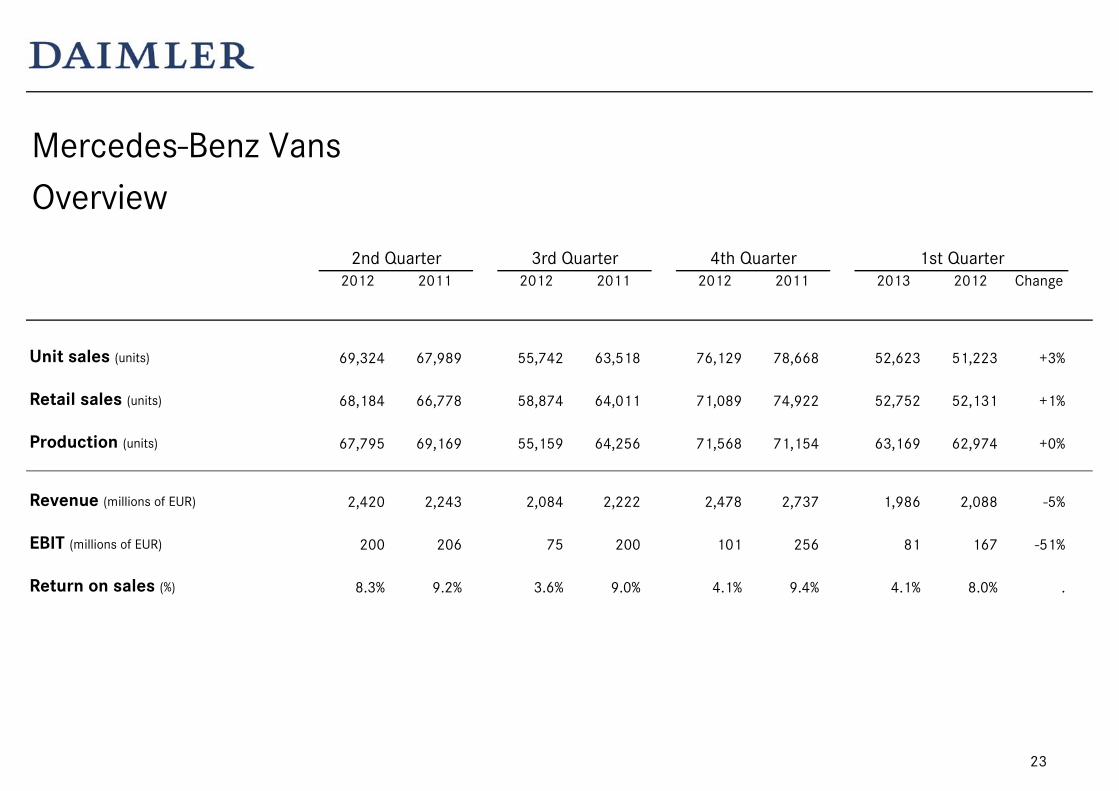
Mercedes-Benz VansOverview
2nd Quarter 3rd Quarter 4th Quarter 1st Quarter2012 2011 2012 2011 2012 2011 2013 2012 Change
Unit sales (units) 69,324 67,989 55,742 63,518 76,129 78,668 52,623 51,223 +3%
Retail sales (units) 68,184 66,778 58,874 64,011 71,089 74,922 52,752 52,131 +1%
Production (units) 67,795 69,169 55,159 64,256 71,568 71,154 63,169 62,974 +0%
Revenue (millions of EUR) 2,420 2,243 2,084 2,222 2,478 2,737 1,986 2,088 -5%
EBIT (millions of EUR) 200 206 75 200 101 256 81 167 -51%
Return on sales (%) 8.3% 9.2% 3.6% 9.0% 4.1% 9.4% 4.1% 8.0% .
23
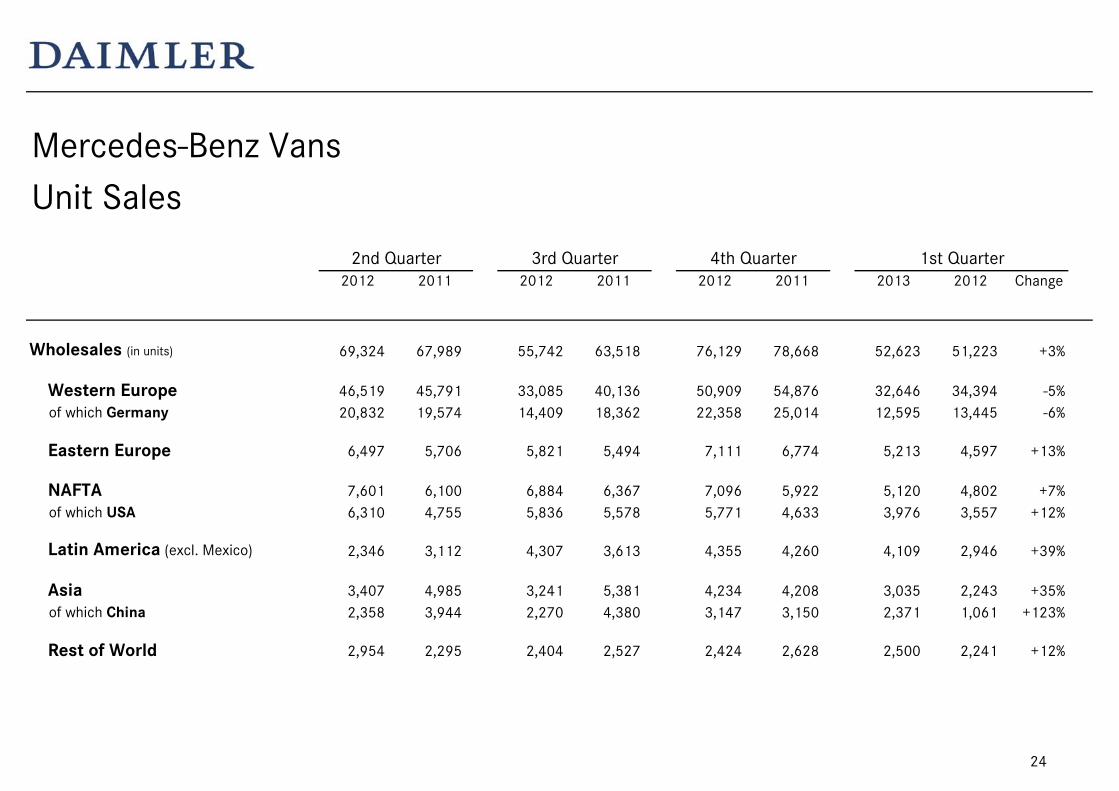
Mercedes-Benz VansUnit Sales
2nd Quarter 3rd Quarter 4th Quarter 1st Quarter2012 2011 2012 2011 2012 2011 2013 2012 Change
Wholesales (in units) 69,324 67,989 55,742 63,518 76,129 78,668 52,623 51,223 +3%
Western Europe 46,519 45,791 33,085 40,136 50,909 54,876 32,646 34,394 -5% of which Germany 20,832 19,574 14,409 18,362 22,358 25,014 12,595 13,445 -6%
Eastern Europe 6,497 5,706 5,821 5,494 7,111 6,774 5,213 4,597 +13%
NAFTA 7,601 6,100 6,884 6,367 7,096 5,922 5,120 4,802 +7% of which USA 6,310 4,755 5,836 5,578 5,771 4,633 3,976 3,557 +12%
Latin America (excl. Mexico) 2,346 3,112 4,307 3,613 4,355 4,260 4,109 2,946 +39%
Asia 3,407 4,985 3,241 5,381 4,234 4,208 3,035 2,243 +35% of which China 2,358 3,944 2,270 4,380 3,147 3,150 2,371 1,061 +123%
Rest of World 2,954 2,295 2,404 2,527 2,424 2,628 2,500 2,241 +12%
24
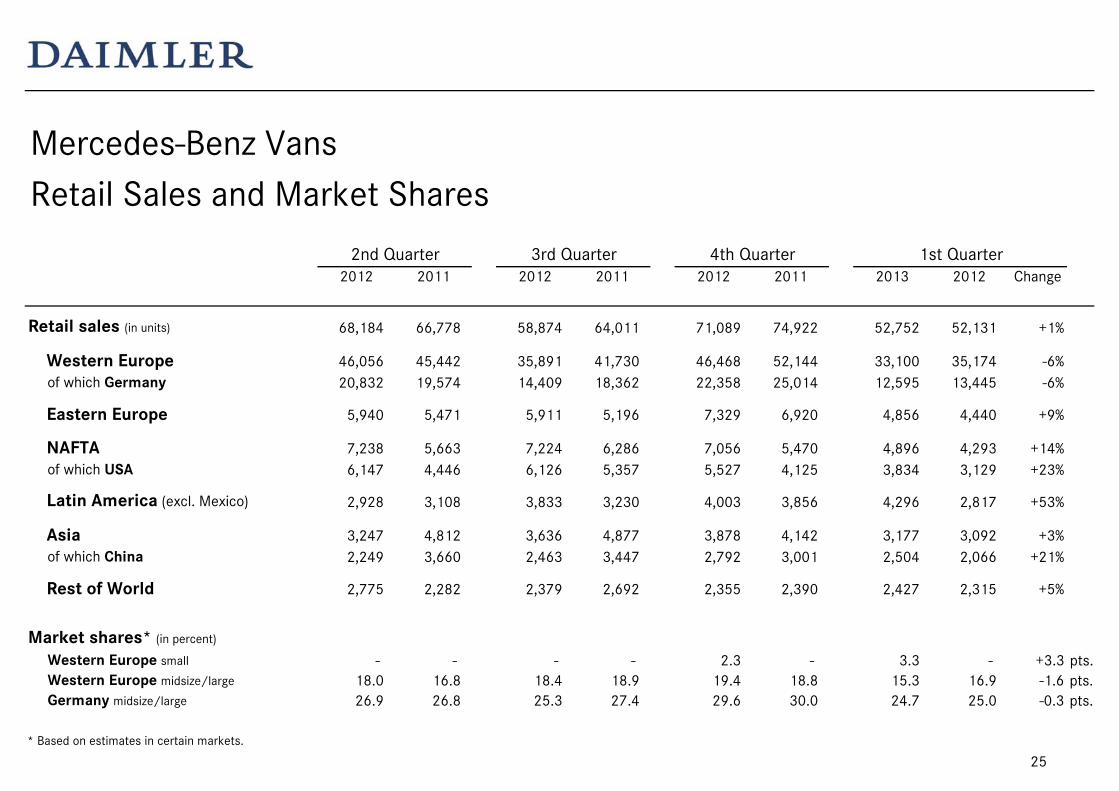
Mercedes-Benz VansRetail Sales and Market Shares
2nd Quarter 3rd Quarter 4th Quarter 1st Quarter2012 2011 2012 2011 2012 2011 2013 2012 Change
Retail sales (in units) 68,184 66,778 58,874 64,011 71,089 74,922 52,752 52,131 +1%
Western Europe 46,056 45,442 35,891 41,730 46,468 52,144 33,100 35,174 -6% of which Germany 20,832 19,574 14,409 18,362 22,358 25,014 12,595 13,445 -6%
Eastern Europe 5,940 5,471 5,911 5,196 7,329 6,920 4,856 4,440 +9%
NAFTA 7,238 5,663 7,224 6,286 7,056 5,470 4,896 4,293 +14% of which USA 6,147 4,446 6,126 5,357 5,527 4,125 3,834 3,129 +23%
Latin America (excl. Mexico) 2,928 3,108 3,833 3,230 4,003 3,856 4,296 2,817 +53%
Asia 3,247 4,812 3,636 4,877 3,878 4,142 3,177 3,092 +3% of which China 2,249 3,660 2,463 3,447 2,792 3,001 2,504 2,066 +21%
Rest of World 2,775 2,282 2,379 2,692 2,355 2,390 2,427 2,315 +5%
Market shares* (in percent)
Western Europe small - - - - 2.3 - 3.3 - +3.3 pts. Western Europe midsize/large 18.0 16.8 18.4 18.9 19.4 18.8 15.3 16.9 -1.6 pts. Germany midsize/large 26.9 26.8 25.3 27.4 29.6 30.0 24.7 25.0 -0.3 pts.
* Based on estimates in certain markets.
25
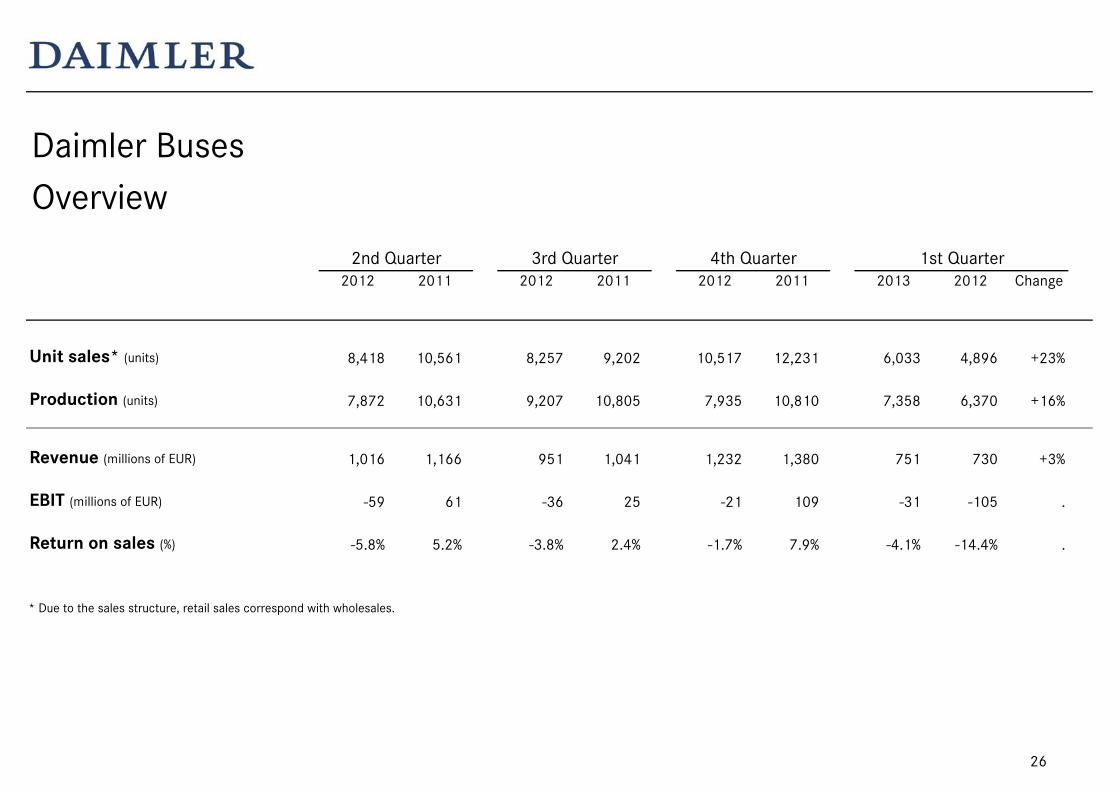
Daimler BusesOverview
2nd Quarter 3rd Quarter 4th Quarter 1st Quarter2012 2011 2012 2011 2012 2011 2013 2012 Change
Unit sales* (units) 8,418 10,561 8,257 9,202 10,517 12,231 6,033 4,896 +23%
Production (units) 7,872 10,631 9,207 10,805 7,935 10,810 7,358 6,370 +16%
Revenue (millions of EUR) 1,016 1,166 951 1,041 1,232 1,380 751 730 +3%
EBIT (millions of EUR) -59 61 -36 25 -21 109 -31 -105 .
Return on sales (%) -5.8% 5.2% -3.8% 2.4% -1.7% 7.9% -4.1% -14.4% .
* Due to the sales structure, retail sales correspond with wholesales.
26
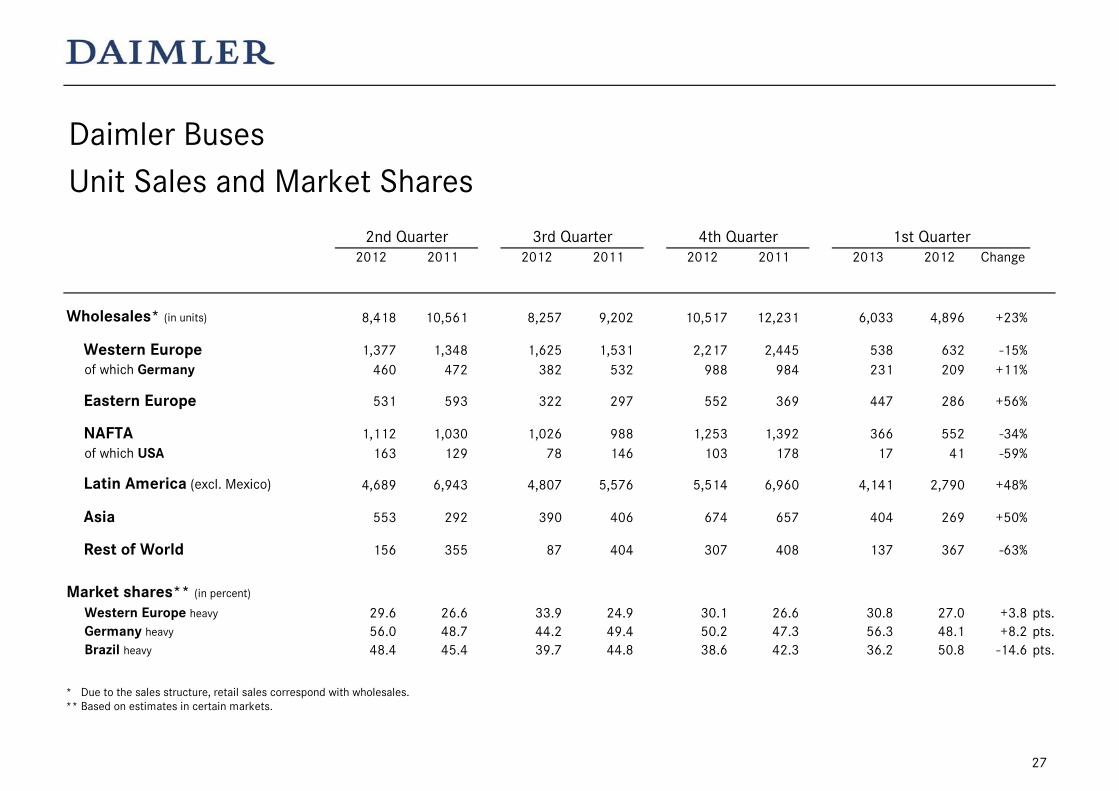
Daimler BusesUnit Sales and Market Shares
2nd Quarter 3rd Quarter 4th Quarter 1st Quarter2012 2011 2012 2011 2012 2011 2013 2012 Change
Wholesales* (in units) 8,418 10,561 8,257 9,202 10,517 12,231 6,033 4,896 +23%
Western Europe 1,377 1,348 1,625 1,531 2,217 2,445 538 632 -15% of which Germany 460 472 382 532 988 984 231 209 +11%
Eastern Europe 531 593 322 297 552 369 447 286 +56%
NAFTA 1,112 1,030 1,026 988 1,253 1,392 366 552 -34% of which USA 163 129 78 146 103 178 17 41 -59%
Latin America (excl. Mexico) 4,689 6,943 4,807 5,576 5,514 6,960 4,141 2,790 +48%
Asia 553 292 390 406 674 657 404 269 +50%
Rest of World 156 355 87 404 307 408 137 367 -63%
Market shares** (in percent)
Western Europe heavy 29.6 26.6 33.9 24.9 30.1 26.6 30.8 27.0 +3.8 pts. Germany heavy 56.0 48.7 44.2 49.4 50.2 47.3 56.3 48.1 +8.2 pts. Brazil heavy 48.4 45.4 39.7 44.8 38.6 42.3 36.2 50.8 -14.6 pts.
* Due to the sales structure, retail sales correspond with wholesales.** Based on estimates in certain markets.
27
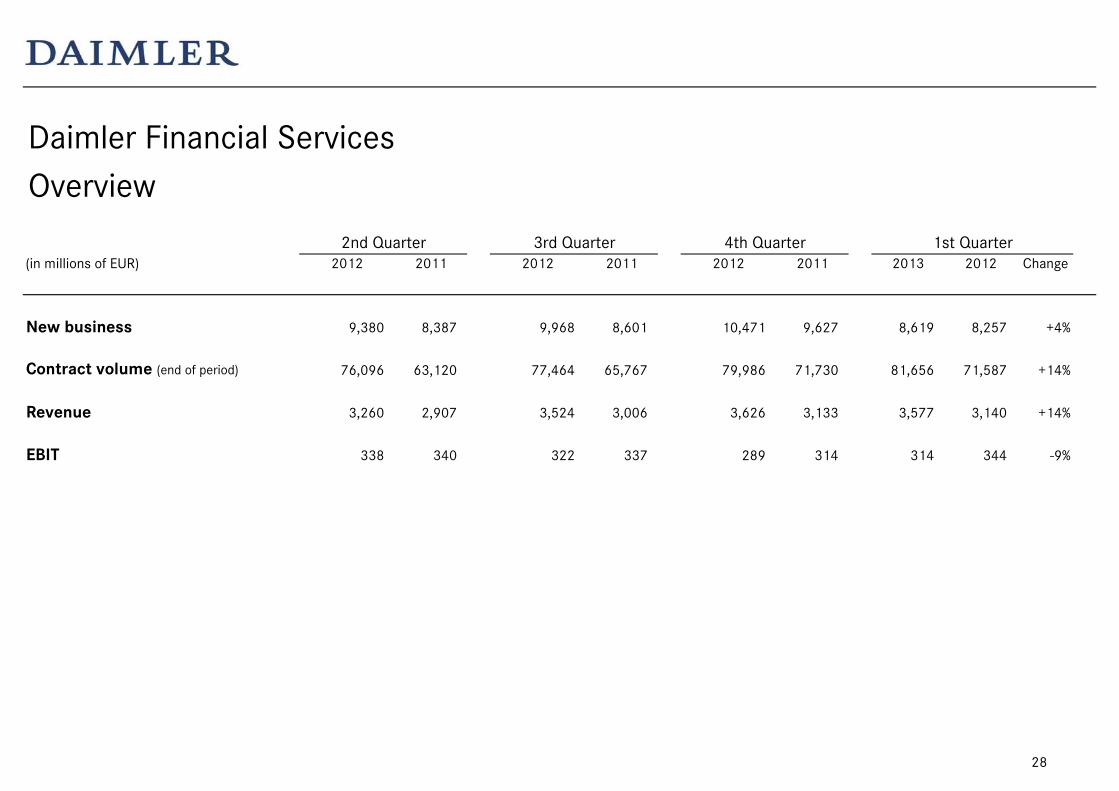
Daimler Financial ServicesOverview
2nd Quarter 3rd Quarter 4th Quarter 1st Quarter(in millions of EUR) 2012 2011 2012 2011 2012 2011 2013 2012 Change
New business 9,380 8,387 9,968 8,601 10,471 9,627 8,619 8,257 +4%
Contract volume (end of period) 76,096 63,120 77,464 65,767 79,986 71,730 81,656 71,587 +14%
Revenue 3,260 2,907 3,524 3,006 3,626 3,133 3,577 3,140 +14%
EBIT 338 340 322 337 289 314 314 344 -9%
28