daimler ag annual press conference: "full year 2014" result charts of dr. dieter zetsche
TRANSCRIPT

Draft 23.01.2015 17:00
JahrespressekonferenzAnnual Press ConferenceFebruary 5, 2015

1
Draft 23.01.2015 17:00
JahrespressekonferenzAnnual Press ConferenceFebruary 5, 2015
Dr. Dieter Zetsche
Chairman of the Board of Management
Head of Mercedes-Benz Cars

2
Contents
HIGHLIGHTS 2014
KEY FIGURES
DIVISIONAL INFORMATION
OUTLOOK
GUIDANCE
GROUP FINANCIALS
4
Mercedes-Benz C-Class
4plants
on four continents
produce the C-Class
5

3
Mercedes-Benz GLA
compact cars sold in 2014
471,748
Mercedes-Maybach S-Class
97%more S-Classes
sold in 2014
Mercedes-Maybach S500/600: Fuel consumption urban/extra-urban/combined: 16,9-11,9/8,7-7,0/11,7-8,9 l/100 km, CO2 emissions combined: 274-207 g/km.

4
smart fortwo & forfour
2.69mvehicle length
4seats,
a true smart
8
Daimler Trucks: strongest product lineup ever
6 54Daimler Trucks
brands models
9

5
Daimler Trucks North America: undisputed market leader
37.2%share of the NAFTA market
for Class 6-8
10
Daimler India Commercial Vehicles: high speed ramp-up
5 new BharatBenz
models in 2014
11

6
Mercedes-Benz Citaro: bestselling bus of all time
>40,000units sold to date
The Mercedes-Benz Vito becomes a global vehicle
drive system variants:
front-wheel, rear-wheel,
and all-wheel drive3

7
Daimler Financial Services: a great place to work
world’s best employers,
DFS is one of them
25
World champions drive Mercedes-Benz
in the Constructors’ and
Drivers’ World Championship
#1

8
Contents
HIGHLIGHTS 2014
KEY FIGURES
DIVISIONAL INFORMATION
OUTLOOK
GUIDANCE
GROUP FINANCIALS
16
Daimler 2014: sales figures
Mercedes-Benz Cars Mercedes-Benz VansDaimler Trucks
Daimler Financial ServicesDaimler Buses
in thousands of units/DFS: contract volume in bn €
1,723
+10%
496
+2%
295
+9%
33
-2%
99
+18%
percentage change vs. py17

9
Daimler 2014: key financials
Revenue
129.9
+10%
in billions of euros/dividend in euros percentage change vs. py
EBIT from ongoing business
10.1
+27%
Dividend(proposed)
2.45
+€ 0.20
18
Our most valuable asset at Daimler: the team
€ 4,350profit sharing payout for each of approx. 135,000
eligible Daimler AG employees in Germany
19

10
Draft 23.01.2015 17:00
JahrespressekonferenzAnnual Press ConferenceFebruary 5, 2015
Bodo Uebber
Member of the Board of Management
Finance & Controlling and Daimler Financial Services
Key figures– in billions of euros –
2013 2014
Unit sales (in thousands of units) 2,353.6 2,546.0
Revenue 118.0 129.9
EBIT
as reported 10.8 10.8
from ongoing business 8.0 10.1
Net profit 8.7 7.3
Free cash flow of the industrial business 4.8 5.5
Earnings per share (in euros) 6.40 6.51
Dividend per share (in euros) 2.25 2.45
21

11
Significant positive EBIT and cash flow effects from M&A transactions in 2014
• Cash inflow and EBIT effect of €0.6 billion each
• Successful partnership will be continued
• Sale of Daimler’s 50% equity interest to Rolls-Royce
• Cash inflow of €2.43 billion and EBIT effect of €0.9 billion
• Close cooperation with Rolls-Royce Power Systems to be continued
Tesla
Rolls-Royce
Power Systems
Holding
Cash inflows will be used
to strengthen Daimler’s operational business
22
Net industrial liquidity: development in 2014– in billions of euros –
Free cash flow industrial business
FY 2014: €5.5bn
Net industrial
liquidity
12/31/2013
Earnings and
other cash flow
impact
Working capital
impact
M&A(mainly RRPSH
and Tesla)
Other(mainly change in the
refinancing of Group dealers,
largely offset by FX effects)
Net industrial
liquidity
12/31/2014
Dividend
payment
Daimler AG
+3.1
+0.1 17.0
-2.4
13.8
-2.3+7.5-2.8
Contribution to German
pension fund
and North American
healthcare plan23

12
Contents
HIGHLIGHTS 2014
KEY FIGURES
DIVISIONAL INFORMATION
OUTLOOK
GUIDANCE
GROUP FINANCIALS
24
Mercedes-Benz Cars: further growth through success of attractive models
Unit sales – in thousands of units –
2013 2014
Revenue– in billions of euros –
EBIT from ongoing business– in millions of euros –
1,5661,723
2013 2014
64.3
73.6
2013 2014
4,180
5,964
25
13
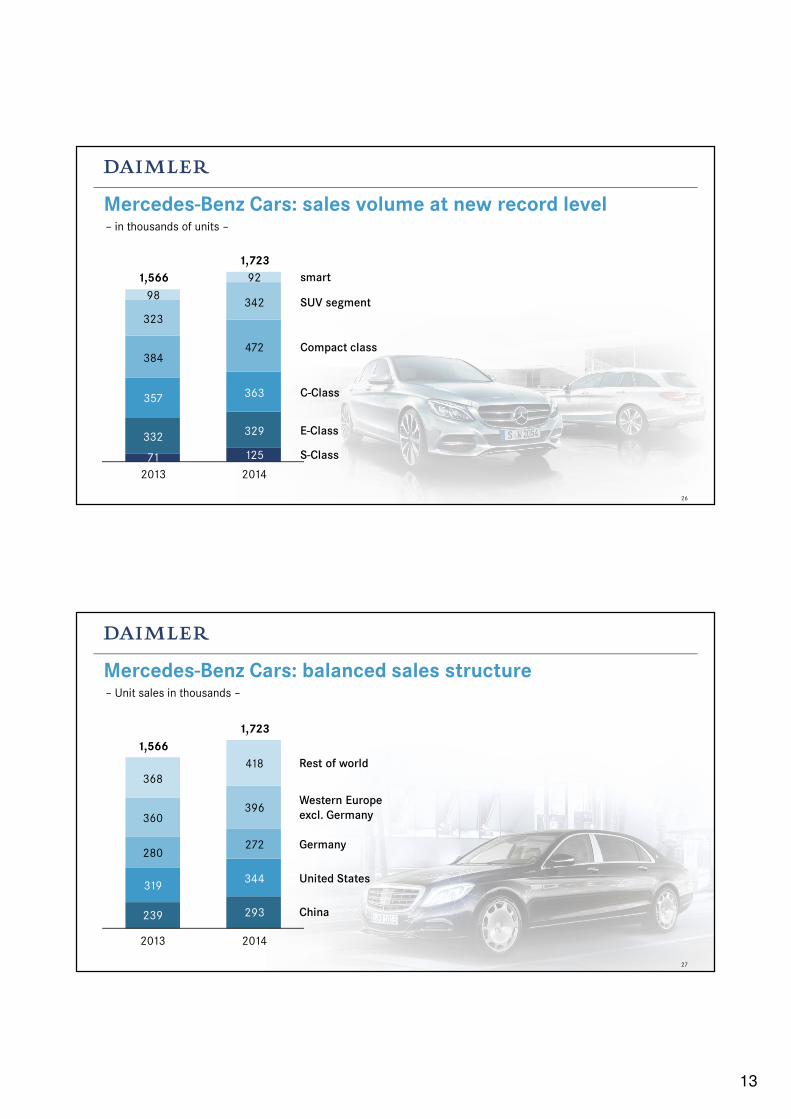
Mercedes-Benz Cars: sales volume at new record level
2013
1,566
1,723
2014
125
329
363
472
342
71
332
357
384
323
smart
C-Class
E-Class
S-Class
Compact class
SUV segment
92
98
– in thousands of units –
26
Mercedes-Benz Cars: balanced sales structure
2013
Rest of world
Germany
United States
China
1,566
Western Europe
excl. Germany
1,723
2014
293
344
272
396
418
239
319
280
360
368
– Unit sales in thousands –
27

14
Mercedes-Benz Cars: EBIT from ongoing business
EBIT 2013 EBIT 2014
4,180
5,964
+ 1,784
6.5%*
8.1%*
* Return on sales
Higher unit sales
Model mix
Net pricing
Fit for Leadership program
Higher expenses for new technologies, future products
and additional capacity
Foreign exchange rates
– in millions of euros –
28
Daimler Trucks: successful development in heterogeneous market environment
2013 2014
484 496
2013 2014
31.5 32.4
2013 2014
1,753
2,073
Unit sales – in thousands of units –
Revenue– in billions of euros –
EBIT from ongoing business– in millions of euros –
29

15
Daimler Trucks: higher unit sales in NAFTA region
2013
Rest of world
484
Asia
496
2014
57
161
47
167
64
66
135
59
163
61
Western Europe
NAFTA region
Latin America
– in thousands of units –
30
Daimler Trucks: incoming orders above prior year
498
551
55
217
46
165
68
65
143
54
170
66
Asia
Western Europe
NAFTA region
Rest of world
Latin America
2013 2014
– in thousands of units –
31

16
Daimler Trucks: EBIT from ongoing business
EBIT 2013 EBIT 2014
1,753
2,073
+ 320
5.6%*
6.4%*
* Return on sales
Higher unit sales especially in NAFTA region and Japan
Lower warranty costs
Daimler Trucks #1 program
Lower unit sales in Latin America and Europe
Foreign exchange rates
No further at-equity result from RRPSH
– in millions of euros –
32
Mercedes-Benz Vans: success in volatile markets
2013 2014
270295
2013 2014
9.410.0
2013 2014
631 638
Unit sales – in thousands of units –
Revenue– in billions of euros –
EBIT from ongoing business– in millions of euros –
33

17
Mercedes-Benz Vans: EBIT from ongoing business
EBIT 2013 EBIT 2014
631 638
+ 7
6.7%* 6.4%*
* Return on sales
Higher unit sales
Model mix
Higher research and development cost for new
products and launch cost of mid-size vans
Foreign exchange rates
– in millions of euros –
34
Daimler Buses: significant earnings improvement
2013 2014
33.7 33.2
2013 2014
4.1 4.2
2013 2014
163
211
Unit sales – in thousands of units –
Revenue– in billions of euros –
EBIT from ongoing business– in millions of euros –
35
18
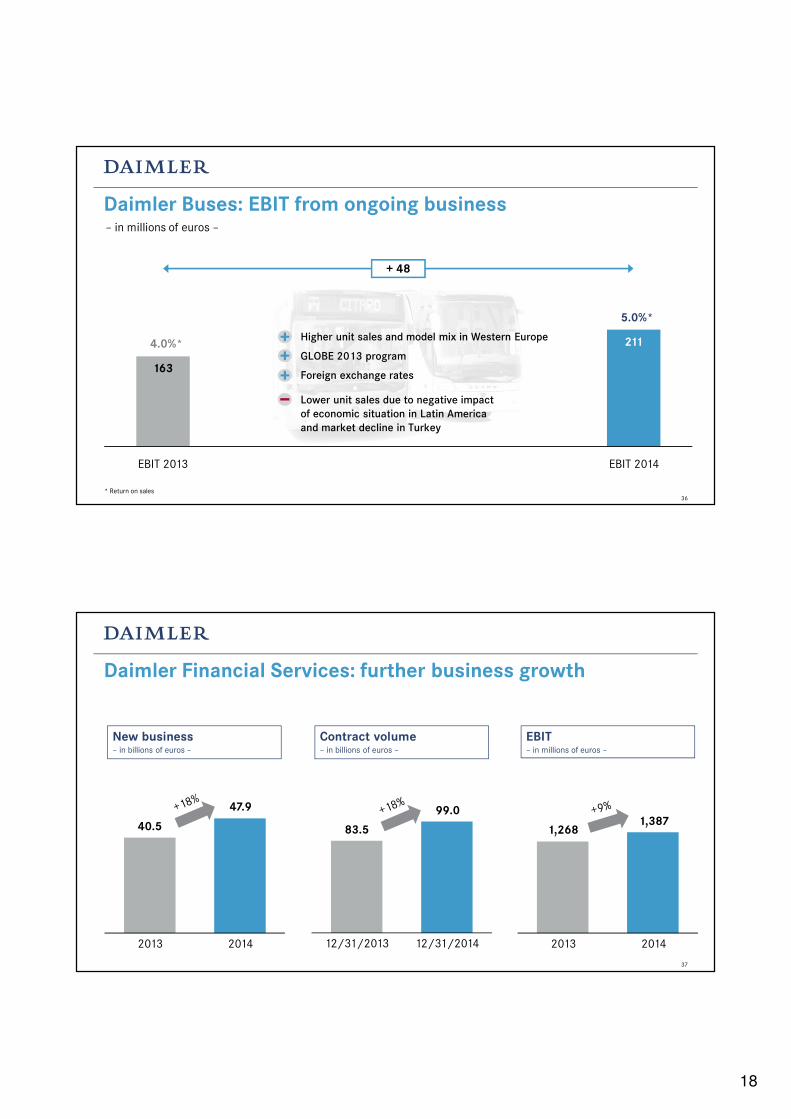
Daimler Buses: EBIT from ongoing business
EBIT 2013 EBIT 2014
163
211
+ 48
4.0%*
5.0%*
* Return on sales
Higher unit sales and model mix in Western Europe
GLOBE 2013 program
Foreign exchange rates
Lower unit sales due to negative impact
of economic situation in Latin America
and market decline in Turkey
– in millions of euros –
36
Daimler Financial Services: further business growth
2013 2014
40.5
47.9
12/31/2013 12/31/2014
83.5
99.0
2013 2014
1,2681,387
New business– in billions of euros –
Contract volume– in billions of euros –
EBIT– in millions of euros –
37

19
Daimler Financial Services: EBIT from ongoing business
EBIT 2013 EBIT 2014
1,2681,387
+ 119
19.2%*19.4%*
* Return on equity
Higher contract volume
Cost of risk
Higher expenses due to business growth
Foreign exchange rates
– in millions of euros –
38
Contents
HIGHLIGHTS 2014
KEY FIGURES
DIVISIONAL INFORMATION
OUTLOOK
GUIDANCE
GROUP FINANCIALS
39

20
Q4 2014: EBIT from ongoing business at record level
Q4 2013 Q4 2014
EBIT RoS* EBIT RoS*
Daimler Group 2,563 7.9 2,824 8.0
of which
Mercedes-Benz Cars 1,385 8.0 1,758 8.7
Daimler Trucks 578 6.8 583 6.6
Mercedes-Benz Vans 194 7.2 158 5.8
Daimler Buses 82 6.3 35 2.7
Daimler Financial Services 313 – 299 –
* Return on sales; Daimler Group excluding Daimler Financial Services
– EBIT in millions of euros; RoS in % –
40
Continued growth in EBIT from ongoing business– in millions of euros –
2,072
949
Q1 2013 Q1 2014
+118%
2,192
2,463
Q2 2013 Q2 2014
+12%
2,787
2,300
Q3 2013 Q3 2014
+21%
2,563
2,824
Q4 2013 Q4 2014
+10%
41
21
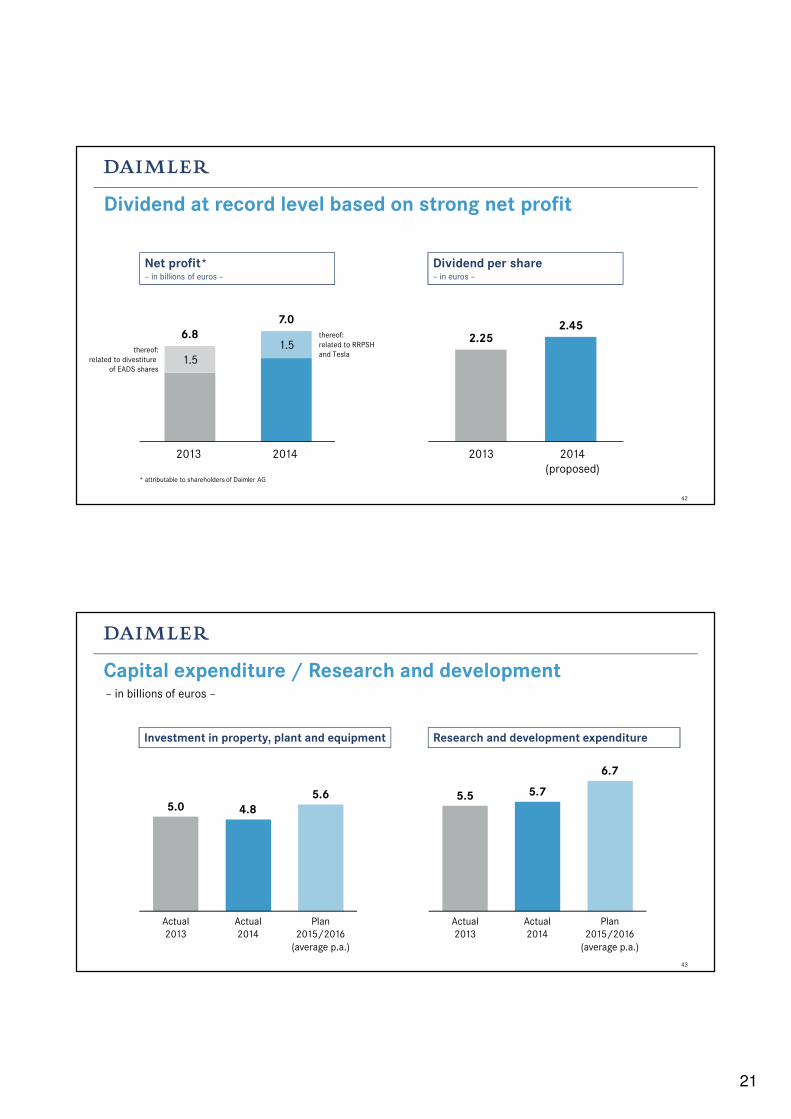
Dividend at record level based on strong net profit
Net profit*– in billions of euros –
2013 2014
6.8
7.0thereof:
related to RRPSH
and Tesla1.5
1.5thereof:
related to divestiture
of EADS shares
* attributable to shareholders of Daimler AG
2014
(proposed)
Dividend per share– in euros –
2013
2.252.45
42
Capital expenditure / Research and development
Investment in property, plant and equipment Research and development expenditure
Actual
2013
Actual
2014
5.0
Plan
2015/2016
(average p.a.)
4.8
5.6
Actual
2013
Actual
2014
5.5 5.7
6.7
Plan
2015/2016
(average p.a.)
– in billions of euros –
43

22
Development of investment and R&D expenditure
11.611.0
12.2
8.8
10.9
– in billions of euros –
Actual2010
Actual2011
Actual2012
Actual2013
Actual2014
Research and development expenditure
Investment inproperty, plantand equipment
Financial investments and other intangible assets*
* excluding capitalized development costs
Plan2015/16
(average p.a.)
13.0
44
Development of unit sales and revenue by divisions
2010
1,895
2,546
2014
Sales– in thousands of units –
Revenue– in billions of euros –
2010
97.8
129.9
2014
+34% +33%
Daimler Financial Services
Daimler Buses
Mercedes-Benz Vans
Daimler Trucks
Mercedes-Benz Cars
45

23
Development of dividend per share– in euros –
2010
2.20
2.45
2.25
1.85
2.20
2011 2012 2013 2014(proposed)
+32%
46
Attractive employer …
* related to extraordinary contributions to the German pension fund assets in 2011 and 2014
** paid out to each eligible employee of Daimler AG for the respective financial year
Fair value of pension plan assets– in billions of euros –
Profit sharing**– in euros –
12/31/2010
11.2
18.6
12/31/2014
4.0*
+66%
47
2010
3,150
4,350
2014
+38%

24
Draft 23.01.2015 17:00
JahrespressekonferenzAnnual Press ConferenceFebruary 5, 2015
Dr. Dieter Zetsche
Chairman of the Board of Management
Head of Mercedes-Benz Cars
Contents
HIGHLIGHTS 2014
KEY FIGURES
DIVISIONAL INFORMATION
OUTLOOK
GUIDANCE
GROUP FINANCIALS
49

25
Mercedes-Benz GLE Coupe
4new high-margin
Mercedes-Benz
SUVs in 2015
50
Mercedes-Benz CLA Shooting Brake
maximum load capacity1,354L

26
Mercedes-AMG GT
from zero to 100 km/h
3.8s
Mercedes-AMG GT S: Fuel consumption urban/extra-urban/combined: 12,5-12,2/7,9-7,8/9,6-9,4 l/100 km,
CO2 emissions combined: 224-219 g/km.
Our strategy towards electric mobility
10new plug-in hybrid models
by 2017
27
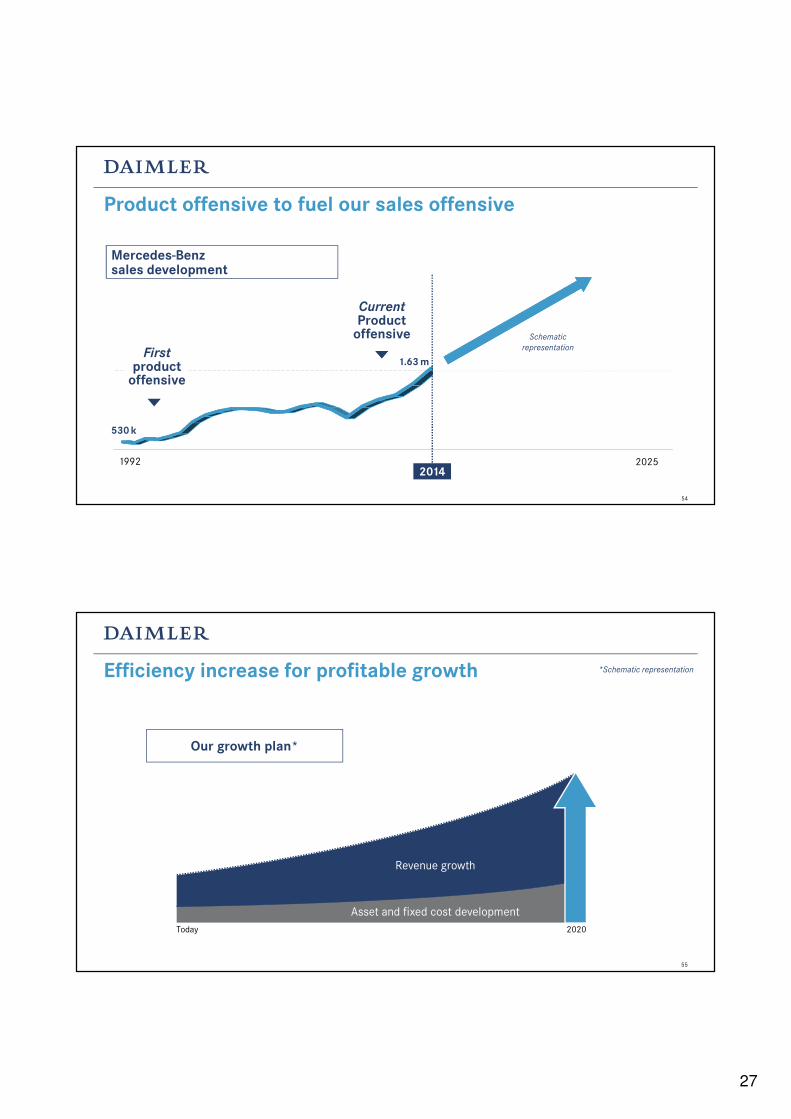
Product offensive to fuel our sales offensive
20141992 2025
Current
Product offensive
Mercedes-Benz sales development
First
product offensive
530k
1.63m
Schematic
representation
54
Efficiency increase for profitable growth *Schematic representation
2020Today
Asset and fixed cost development
Revenue growth
Our growth plan*
55

28
China: key market for our growth plans
300,0002015 units sales target
for Mercedes-Benz in China
56
Benchmark in Total Cost of Ownership
57

29
Global roll-out of Daimler Trucks platform strategy
EU LA
Today
Heavy Duty
Engine
Medium Duty
Engine
Transmission
Cabin
Electrics/
Electronics
Chassis
2020
58
One example: DT12 transmission market success
23%of our Freightliner Cascadia trucks are
sold with a DT12 transmission
59

30
Western Star 5700XE
Autonomous driving goes far beyond technology
15years from now
this car could be reality

31
Mobility services on growth path
>1,000,000 people use our mobility services
62
Structural change creates future opportunities
63

32
Contents
HIGHLIGHTS 2014
KEY FIGURES
DIVISIONAL INFORMATION
OUTLOOK
GUIDANCE
GROUP FINANCIALS
64
2015 sales outlook
• Significantly higher unit sales based on young and attractive product portfolio
• Strong momentum from full availability of new C-Class and smart models
• Launch of all-new Mercedes-Maybach, Mercedes-AMG GT, CLA Shooting Brake and GLE Coupé
• Slightly higher unit sales
• Maintain market leadership in Western Europe and Brazil
• Positive sales development mainly in non-core markets
• Significantly higher unit sales
• Strong momentum from full availability of new Vito and V-Class
• Product expansion to North and South America
• Significantly higher unit sales due to strong product portfolio
• Strong order backlog, especially in NAFTA region
• Growth potential due to new Asia Business Model
65

33
2015 outlook for EBIT from ongoing business
This guidance is based on current outlined market expectations and current exchange-rate expectations.
Significantly above the prior-year level
Significantly above the prior-year level
Significantly above the prior-year level
Slightly below the prior-year level
Slightly above the prior-year level
We expect Group EBIT for FY 2015 to increase significantly
based on the following expectations for divisional EBIT:
Daimler Financial Services
66
34
68
DisclaimerThe figures in this document are preliminary and have neither been approved yet by the Supervisory Board nor audited by the
external auditor.
This document contains forward-looking statements that reflect our current views about future events. The words “anticipate,” “assume,”
“believe,” “estimate,” “expect,” “intend,” “may,” ”can,” “could,” “plan,” “project,” “should” and similar expressions are used to identify
forward-looking statements. These statements are subject to many risks and uncertainties, including an adverse development of global
economic conditions, in particular a decline of demand in our most important markets; a worsening of the sovereign-debt crisis in the
euro zone; an increase in political tension in Eastern Europe; a deterioration of our refinancing possibilities on the credit and financial
markets; events of force majeure including natural disasters, epidemics, acts of terrorism, political unrest, industrial accidents and their
effects on our sales, purchasing, production or financial services activities; changes in currency exchange rates; a shift in consumer
preferences towards smaller, lower-margin vehicles; a possible lack of acceptance of our products or services which limits our ability to
achieve prices and adequately utilize our production capacities; price increases for fuel or raw materials; disruption of production due to
shortages of materials, labor strikes or supplier insolvencies; a decline in resale prices of used vehicles; the effective implementation of
cost-reduction and efficiency-optimization measures; the business outlook for companies in which we hold a significant equity interest;
the successful implementation of strategic cooperations and joint ventures; changes in laws, regulations and government policies,
particularly those relating to vehicle emissions, fuel economy and safety; the resolution of pending official investigations and the
conclusion of pending or threatened future legal proceedings; and other risks and uncertainties, some of which we describe under the
heading “Risk and Opportunity Report” in Daimler’s most recent Annual Report. If any of these risks and uncertainties materializes or if
the assumptions underlying any of our forward-looking statements prove to be incorrect, the actual results may be materially different
from those we express or imply by such statements. We do not intend or assume any obligation to update these forward-looking
statements since they are based solely on the circumstances at the date of publication.

Jahrespressekonferenz Annual Press Conference February 5, 2015
1
Appendix

Key balance sheet and financial figures – in billions of euros –
2
Daimler Group Dec. 31, 2013 Dec. 31, 2014
Equity ratio 24.3% 22.1%
Gross liquidity 18.1 16.3
Industrial business
Equity ratio 43.4% 40.8%
Net liquidity 13.8 17.0
Free cash flow 4.8 5.5
Appendix

Revenue by division
3
Appendix
2013 2014 % change
Daimler Group 118.0 129.9 +10
of which
Mercedes-Benz Cars 64.3 73.6 +14
Daimler Trucks 31.5 32.4 +3
Mercedes-Benz Vans 9.4 10.0 +6
Daimler Buses 4.1 4.2 +3
Daimler Financial Services 14.5 16.0 +10
Contract volume of Daimler Financial Services (at year end)
83.5 99.0 +18
– in billions of euros –

Revenue by region
Appendix
2013 2014 % change
Daimler Group 118.0 129.9 +10
of which
Western Europe 41.1 43.7 +6
of which Germany 20.2 20.4 +1
NAFTA 32.9 38.0 +15
of which United States 28.6 33.3 +16
Asia 24.5 29.4 +20
of which China* 10.7 13.3 +24
Other markets 19.5 18.7 -4
– in billions of euros –
4
* excluding revenue of not fully consolidated companies

EBIT by division
5
Appendix
2013 2014 EBIT RoS* EBIT RoS*
Daimler Group 10,815 9.2 10,752 8.2
of which
Mercedes-Benz Cars 4,006 6.2 5,853 8.0
Daimler Trucks 1,637 5.2 1,878 5.8
Mercedes-Benz Vans 631 6.7 682 6.8
Daimler Buses 124 3.0 197 4.7
Daimler Financial Services 1,268 – 1,387 –
Reconciliation 3,149 – 755 –
* Return on sales; Daimler Group excluding Daimler Financial Services
– EBIT in millions of euros; RoS in % –

Group EBIT in 2014
6
Appendix
Actual 2013
Volume/ Structure/ Net pricing
Foreign exchange
rates
Other cost changes
Reconciliation Actual 2014
Financial Services
-1,673
-2,205
10,752
+119
10,815
-501 +4,333
• Cars +4,018 • Trucks +86 • Vans +246 • Buses -17
• Cars -332 • Trucks -211 • Vans -21 • Buses +63 • Cars -1,902
• Trucks +445 • Vans -217 • Buses +1
of which: • RRPSH +948 • Tesla +617 • EU antitrust -600 • EADS -3,223
Special items affecting
EBIT
-136
– in millions of euros –

Group EBIT in Q4 2014
7
Appendix
Actual Q4 2013
Volume/ Structure/ Net pricing
Foreign exchange
rates
Other cost changes
Reconciliation Actual Q4 2014
Financial Services
-637
-548
2,138
-14 2,425
+93 +839
• Cars +934 • Trucks -42 • Vans -3 • Buses -50
• Cars +92 • Trucks -31 • Vans +3 • Buses +29
• Cars -654 • Trucks +79 • Vans -36 • Buses -26
of which: • EU antitrust -600
Special items affecting
EBIT
-20
– in millions of euros –

Special items affecting EBIT (I)
8
Appendix
Q4 Full year
Mercedes-Benz Cars 2013 2014 2013 2014
Impairment of investments in the area of alternative drive systems -80 – -174 -30
Restructuring of sales organization in Germany* – -81 – -81
Daimler Trucks
Workforce adjustments** -13 -43 -116 -149
Impairment of investment in Kamaz – -30 – -30
Restructuring of sales organization in Germany* – -16 – -16
Mercedes-Benz Vans
Reversal of impairment of investment in FBAC – – – +61
Restructuring of sales organization in Germany* – -17 – -17
* We expect expenses for the restructuring of the sales organization in Germany in a total of up to €500 million in 2015 and 2016. ** Daimler Trucks expects further expenses of up to €50 million in 2015.
– in millions of euros –

Special items affecting EBIT (II)
9
Appendix
Q4 Full year
Daimler Buses 2013 2014 2013 2014
Business repositioning -13 -3 -39 -12
Restructuring of sales organization in Germany* – -2 – -2
Reconciliation
Divestiture of EADS shares +1 – +3,223 –
Measurement of put option for Rolls-Royce Power Systems Holding -10 – -60 -118
Sale of shares in Rolls-Royce Power Systems Holding – – – +1,006
Hedge of Tesla share price -23 +106 -23 -124
Remeasurement of Tesla shares – – – +718
EU antitrust proceedings – -600 – -600
– in millions of euros –
* We expect expenses for the restructuring of the sales organization in Germany in a total of up to €500 million in 2015 and 2016.

EBIT from ongoing business in 2014
10
Appendix
2013 2014 EBIT RoS* EBIT RoS*
Daimler Group 8,004 6.5 10,146 7.7
of which
Mercedes-Benz Cars 4,180 6.5 5,964 8.1
Daimler Trucks 1,753 5.6 2,073 6.4
Mercedes-Benz Vans 631 6.7 638 6.4
Daimler Buses 163 4.0 211 5.0
Daimler Financial Services 1,268 – 1,387 –
* Return on sales; Daimler Group excluding Daimler Financial Services
– EBIT in millions of euros; RoS in % –

Assumptions for automotive markets in 2015
11
Appendix
Car markets
Global
Western Europe
Medium- and heavy-duty truck
markets
NAFTA region
Europe
Japan*
Brazil
Europe
Bus markets Western Europe
Brazil
around +4%
slight growth
around +10%
around the prior-year level
slightly below the prior-year level
around -10%
around the prior-year level
slight growth
around the prior-year level
USA slight growth
Van markets
* including light-duty trucks
Indonesia* around +10%
China significant growth

Capital expenditure / Research and development
Appendix
Investment in property, plant and equipment
Research and development expenditure
Actual 2013
Actual 2014
Plan 2015-2016
Actual 2013
Actual 2014
Plan 2015-2016
Daimler Group 5.0 4.8 5.6 5.5 5.7 6.7
of which
Mercedes-Benz Cars 3.7 3.6 4.0 3.8 4.0 4.9
Daimler Trucks 0.8 0.8 1.1 1.2 1.2 1.2
Mercedes-Benz Vans 0.3 0.3 0.3 0.3 0.3 0.4
Daimler Buses 0.1 0.1 0.1 0.2 0.2 0.2
Daimler Financial Services 0.02 0.02 0.01 – – –
– in billions of euros –
12
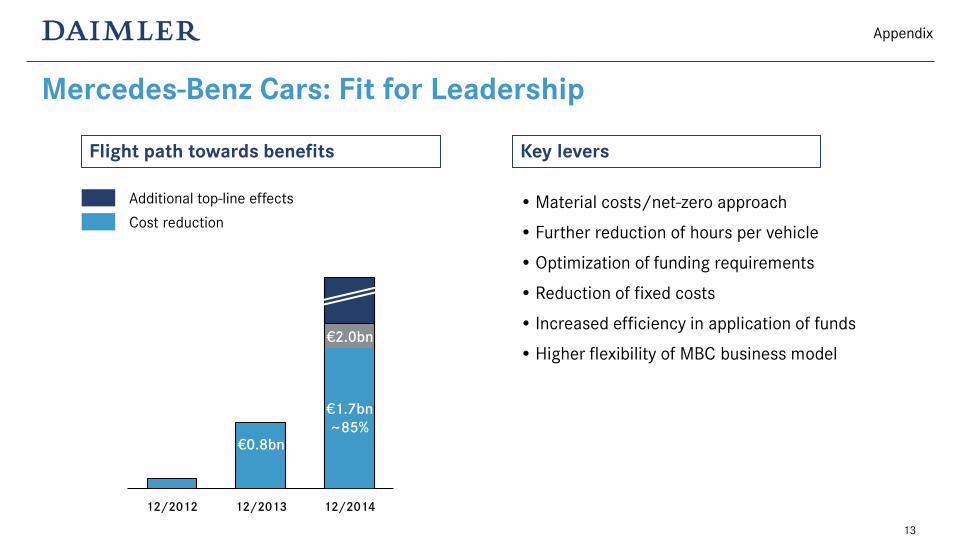
Mercedes-Benz Cars: Fit for Leadership
13
Appendix
Key levers
•Material costs/net-zero approach
• Further reduction of hours per vehicle
•Optimization of funding requirements
• Reduction of fixed costs
• Increased efficiency in application of funds
•Higher flexibility of MBC business model
Flight path towards benefits
Additional top-line effects
12/2012 12/2013 12/2014
€2.0bn
Cost reduction
€0.8bn
€1.7bn ~85%

Daimler Trucks #1
14
Appendix
Key levers
• Sales and aftersales push • Module strategy to realize global scale • Asia Business Model • Strong efficiency push in all operating units:
− Fixed costs − Material costs − Production costs − Warranty and quality costs
Flight path towards benefits
Top-line effects (30%)
12/2012 12/2013 12/2014
€1.6bn
Cost reductions (70%)
€0.5bn
€1.3bn ~80%

Mercedes-Benz Vans: higher unit sales
15
Appendix
270 295
22
60
186
22
59
166
3
V-Class
Sprinter
Vario
Vito
26 Citan
2013 2014
20
– in thousands of units –
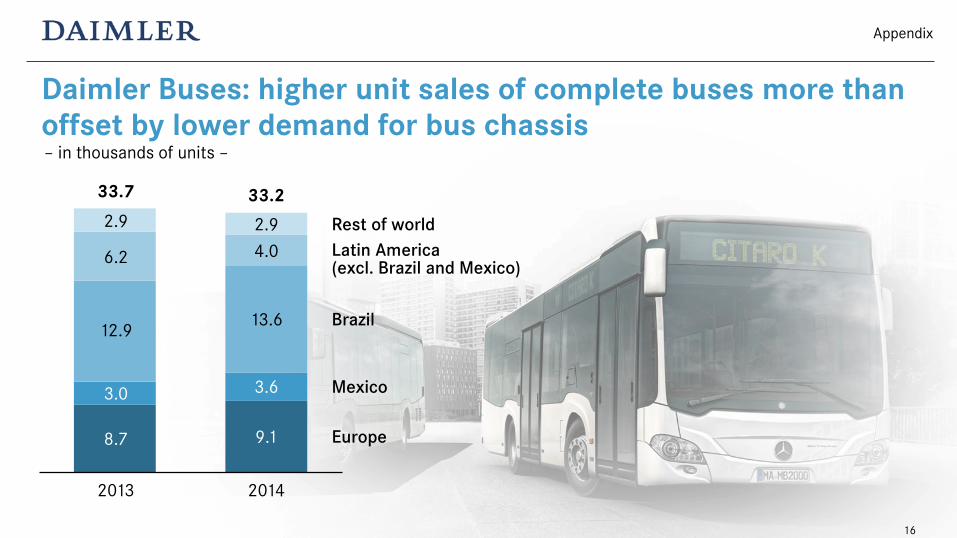
Daimler Buses: higher unit sales of complete buses more than offset by lower demand for bus chassis
16
Appendix
Europe
Mexico
Rest of world
Brazil
Latin America (excl. Brazil and Mexico)
2.9
33.7
8.7
3.0
12.9
6.2
33.2
9.1
3.6
13.6
2.9 4.0
2013 2014
– in thousands of units –

Daimler Financial Services: higher contract volume
17
Appendix
12/31/2013 12/31/2014
Europe (excl. Germany)
Americas
Africa & Asia/Pacific
Germany
83.5
18.2
19.1
34.6
11.6
99.0
18.7
21.7
43.1
15.4
– in billions of euros –

Daimler Financial Services: net credit losses* at low level
18
Appendix
0,69% 0,68%
0,50% 0,61%
0,36% 0,51%
0,89% 0,83%
0,43% 0,34% 0,37%
* as a percentage of portfolio, subject to credit risk
0.31%
2003 2004 2005 2006 2007 2008 2009 2010 2011 2012 2013 2014
Disclaimer
19
This document contains forward-looking statements that reflect our current views about future events. The words “anticipate,” “assume,” “believe,” “estimate,” “expect,” “intend,” “may,” ”can,” “could,” “plan,” “project,” “should” and similar expressions are used to identify forward-looking statements. These statements are subject to many risks and uncertainties, including an adverse development of global economic conditions, in particular a decline of demand in our most important markets; a worsening of the sovereign-debt crisis in the euro zone; an increase in political tension in Eastern Europe; a deterioration of our refinancing possibilities on the credit and financial markets; events of force majeure including natural disasters, epidemics, acts of terrorism, political unrest, industrial accidents and their effects on our sales, purchasing, production or financial services activities; changes in currency exchange rates; a shift in consumer preferences towards smaller, lower-margin vehicles; a possible lack of acceptance of our products or services which limits our ability to achieve prices and adequately utilize our production capacities; price increases for fuel or raw materials; disruption of production due to shortages of materials, labor strikes or supplier insolvencies; a decline in resale prices of used vehicles; the effective implementation of cost-reduction and efficiency-optimization measures; the business outlook for companies in which we hold a significant equity interest; the successful implementation of strategic cooperations and joint ventures; changes in laws, regulations and government policies, particularly those relating to vehicle emissions, fuel economy and safety; the resolution of pending official investigations and the conclusion of pending or threatened future legal proceedings; and other risks and uncertainties, some of which we describe under the heading “Risk and Opportunity Report” in Daimler’s most recent Annual Report. If any of these risks and uncertainties materializes or if the assumptions underlying any of our forward-looking statements prove to be incorrect, the actual results may be materially different from those we express or imply by such statements. We do not intend or assume any obligation to update these forward-looking statements since they are based solely on the circumstances at the date of publication.
The figures in this document are preliminary and have neither been approved yet by the Supervisory Board nor audited by the external auditor.