dahlke 2015 summary of process improvement tools · a quick summary of process improvement tools by...
TRANSCRIPT
1
A QUICK SUMMARY OF PROCESS IMPROVEMENT TOOLS
By Arnie Dahlke
February, 2015
1. INTRODUCTION
Process improvement (also known as quality improvement) is rooted in the systems thinking of W. Edwards Deming1 and many who have followed him who believe that most of performance effectiveness and even employee unhappiness is caused by dysfunctional systems in an organization. In fact some proponents of the “Deming method” go so far as to say that more than 95 percent of a company’s problems result from systems, processes and methods, not from people.2
Indeed, the smooth functioning of systems, processes and methods is critical to the success of any organization. However, the most important component of an organizational system is the individual employee. It is the individual employee who does or does not implement processes and methods. It is the individual employee who improves or sabotages processes and methods. Involving employees at every step of the way is a central ingredient to effective process improvement.
In June of 1950, at the request of General Douglas MacArthur, W. Edwards Deming traveled to Japan to introduce his quality improvement philosophy to a group of very powerful Japanese business-men. During that meeting and in his subsequent 26 visits to Japan, he evolved a comprehensive systems philosophy, which serves as the cornerstone of today’s process improvement programs in American organizations.
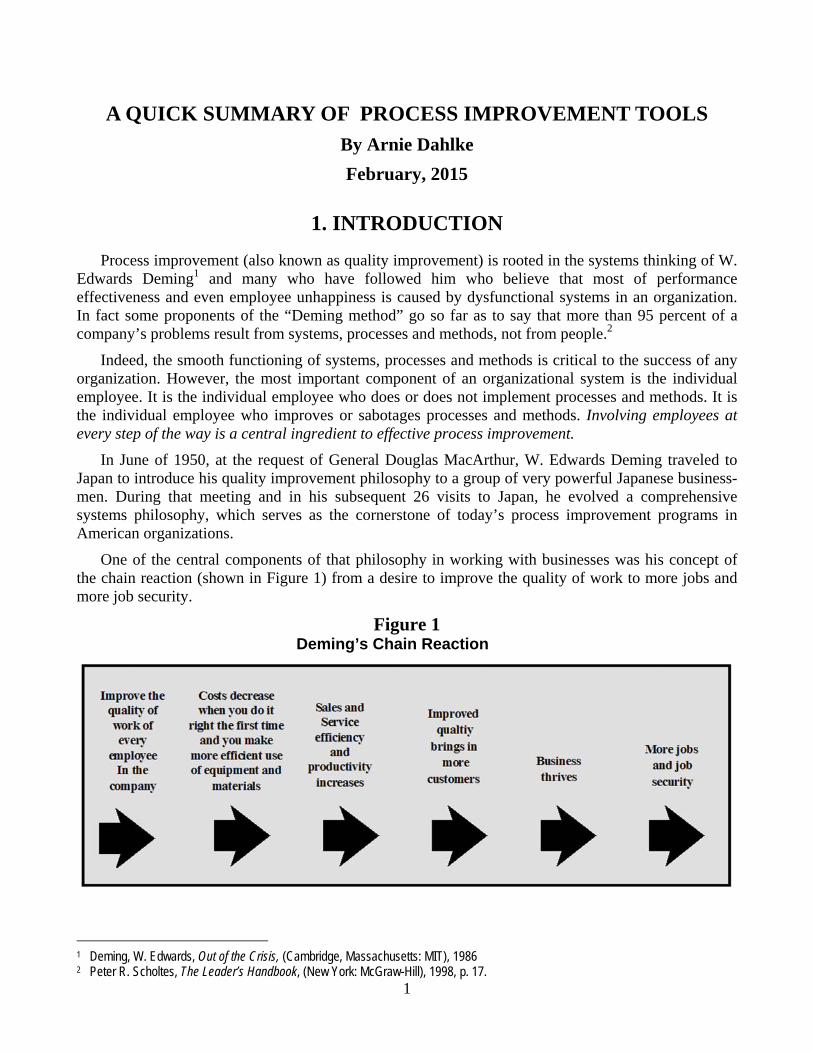
One of the central components of that philosophy in working with businesses was his concept of the chain reaction (shown in Figure 1) from a desire to improve the quality of work to more jobs and more job security.
Figure 1 Deming’s Chain Reaction
1 Deming, W. Edwards, Out of the Crisis, (Cambridge, Massachusetts: MIT), 1986 2 Peter R. Scholtes, The Leader’s Handbook, (New York: McGraw-Hill), 1998, p. 17.

2
The Japanese took Deming’s concepts very seriously. They enthusiastically put them to work:
“Within months they began to notice improvement. Within four years some of Japan’s products began to make progress on the world market. (Deming had predicted it would take five years. The Japanese proved him wrong!)”
“In the United States, we went from discounting Japanese products (“You’ll never be able to get spare parts!”) to noticing, and becoming disconcerted by, the shrinking U.S. market-share in key industries.”3
At the heart of Deming’s chain reaction is a concept the Japanese call “Deming’s Wheel.” The Deming Wheel is an ongoing, never-ending cycle of learning and improvement: Plan, Study, Do, Act (PSDA). An example of the Deming Wheel is shown in Figure 2:
Figure 2 The Deming Wheel
The basic notion behind the Deming Wheel is that we can figure out the most effective process to perform a task—the most efficient, the quickest, the easiest and the safest way. Then we can document that process and use it both as a training tool and as a way of maintaining consistent performance among employees.
The Deming Wheel has been more frequently referred to as the PCDA (Plan-Do-Check-Act) cycle. The PDCA cycle involves the same kind of logical, scientific thinking, strategies, and collection of data gathering and analysis tools used by scientists in the conduct of research. Teams of people, process improvement teams, are assembled to attack specific problems.
The purpose of this handout is to describe some most frequently used process improvement tools. Some are techniques—ways of generating ideas, uncovering causes, and picturing the way things happen—while other tools are more statistical—measuring what is happening and what improves as a result of actions taken.
3 Peter R. Scholtes, The Leader’s Handbook, (New York: McGraw-Hill), 1998, p. 7.

3
2. SOME USEFUL TECHNIQUES
Brainstorming
One of the most useful tools for generating ideas and identifying problems and solutions is Brainstorming, a technique that gets team members generating as many ideas as they can in a specified time.
Brainstorming is useful at almost any point in team discussions. It can be used to select problems or aspects of problems, to determine possible causes and/or solutions to problems, to plan the steps of a project, or to build consensus among team members when they are working toward the specification of action plans.
Using the following guidelines, a “facilitator” gets team members to list as many ideas as possible, regardless of quality or practicality, listing them on a flip chart as they are generated:
Team members quickly offer as many ideas as possible without censoring them.
Other team members don’t evaluate or criticize ideas as they are offered.
Ideas are listed immediately, without editing or worrying about spelling errors.
People can add on to, build on, combine, or free associate to ideas already listed.
Don’t stop to soon!
The facilitator records ideas on the flip chart as fast as they are offered. If the ideas are thrown out too fast to record, he or she can use another person to help. The goal is to get all ideas up on the flip charts where everyone can see them.
It is the facilitator’s job to make sure that people stick to the brainstorming guidelines, to encourage everyone to participate, and to judge when enough time has been allowed to get all ideas recorded. Don’t stop too soon. Think about it like popping corn—when you are popping corn, you wait until the popping slows down almost to a stop before you turn off the popper.
Typically, when brainstorming is finished, people will see that some of the ideas offered are really saying the same thing. At this point, the facilitator helps the group combine those ideas.
Next, the facilitator helps the group take the final list of ideas and rank them in terms of their importance to the problem, or in terms of how practical they are, or in terms of some other rationale appropriate to the process improvement team discussion.
Finally, the team considers each idea, one at a time, starting with the top ranked idea, to figure out how to put it into action, who will carry out the action and when the action will be completed.
Force Field Analysis
A second tool useful to process improvement teams is called Force Field Analysis. It’s a way of looking at a problem in terms of a “force field” in which “driving” and “blocking” forces push against each other to expedite or block a chosen solution to the problem. This tool has its origins in the early work of social psychologist Kurt Lewin in the 1930’s.4 It is particularly useful in evaluating solutions offered to address a problem.
4 Kurt Lewin, Principles of Topological Psychology, (New York: McGraw-Hill), 1935.

4
To set up a force field analysis: (1) begin by defining and stating the problem you want to solve; (2) list the goal or goals you want to result from the team work—picture what the situation would look like if the problem were solved; (3) draw a line down the middle of the page; (4) on the right side of the page, list all of the “blocking forces”—those actions, attitudes, opinions, etc. that will stop you from reaching your goal; and (5) on the left side of the page, list all of the “driving forces”—those actions, attitudes, opinions, etc. that will help you reach your goal.
An example of this five-step application of force field analysis comes from an retail sales organization in which customer satisfaction scores indicated that not all sales people were making follow-up calls to customers. The Sales Manager asked for volunteers to form a process improvement team to address the problem. The team recorded the problem, their goal, and several blocking forces on a flip chart. They then used brainstorming to generate a number of counteracting driving forces. The results are shown in Figure 3 below:
Figure 3 Example of a Force Field Analysis
Step1: Problem: Sales people are not making follow-up calls. Step 2: Goal: Get sales people to make follow-up calls.
Step 4: DRIVING FORCES Step 3: BLOCKING FORCES
Every customer is a potential referral source for new customers. I will commit more time to make sure the customer is happy—the more time, the better chance I have of getting a referral.
I don’t want to take time away from selling— selling is how I make my money. Anything else I’m asked to do detracts from my ability to sell. Once my sale is completed my work is done.
I will strive to turn complaints around, doing what’s needed to make the customer happy.
I don’t want to call because I expect the customer to complain.
I will strive to make my customer’s experience here so pleasant and attractive that they will hap-pily refer people to me.
I have little or no expectation of getting any refer-rals from customers because of the transient nature of Los Angeles customers.
I will set up a reminder system and a call sched-ule to make sure I make my follow-up calls.
I get so involved with the customers with whom I am working that I simply forget to make calls.
I will take the time to go over a mock customer satisfaction survey (filled in with 10’s) with all customers, stressing the importance of 10’s.
I don’t take the time to encourage customers to return their surveys and remind them of the im-portance of 10’s (the highest rating).
I need to convince my managers to be more con-structive in their discussions of customer complaints, to make them problem-solving sessions instead of opportunities for punishing me, so that I can learn from and be motivated by the sessions.
Although there is much talk about customer complaints, I have a negative reaction to it because it is usually presented to me in a negative context—it’s always a beef session: I hear what I am doing wrong, what not to do, instead of what to do.
After three meetings involving many spirited discussions, the team came up with a set of recommendations for action, including process changes and training.
Implementation of these recommendations led to improved customer satisfaction scores. Salespeople sharply focused more on what it takes to get high customer satisfaction scores. Managers immediately instituted ongoing customer satisfaction training. Customer complaint feedback meetings became more positive and constructive. Managers began dealing with sales people having customer satisfaction problems with a one-on-one, mutual problem-solving, coaching manager style rather than dealing with them in an authoritative, punitive manner.

5
It is important for process improvement teams to follow the five-steps for applying a force field analysis (described on page 4). These steps give a team a problem-solving focus. Concentrating first on what will block people from their goal will help them zero in on the actions that will overcome those blocks.
Most of the time when a problem is being considered by a team, the blocking forces outnumber the driving forces. Discussion then centers on how that number of blocking forces can be diminished and how the number of driving forces can be increased. The trick is to look at each blocking force and come up with driving forces that will overcome the blocking force. And then, most important of all, each driving force must be converted into ideas for action plans that will make it all happen.
Flowcharting
A third tool useful to process improvement teams is Flowcharting. This tool helps team members look at the various steps and operations associated with a problem. Team members simply draw a diagram with boxes and arrows that represents the flow of activities making up the as-is process—in other words, the process as it now exists. This is called a “flowchart.” Flowcharts allow us to identify activities that duplicate other activities, such as points in a process where decisions are made or delays occur. Identifying these, in turn, gives us the opportunity to correct, eliminate and streamline the processes.
One of the most ambitious examples of flowcharting that I have ever seen comes from an automobile dealership in Southern California in which the Service Manager and his staff decided to tackle low customer satisfaction scores. They decided to chart the steps in the entire Service operation from the time customers bring their vehicle in to the Service Department to the time they pick it up. They ended up with a large, very detailed flowchart that completely filled an eight-feet-high by seventeen-feet-long wall in their training room. The first part of their chart is shown in Figure 4 on the next page.
In this dealership, the customer-base was about 65% Hispanic. When you look in the chart at the “why?” point (after asking if the customer accepts the Service Advisor), you can easily see that a delay problem in the service write-up process occurred because customers wanted to deal with a Spanish speaking Service Writer. Jose, Juan and the Porters were the only ones who spoke Spanish. This means that if only non-Hispanic Writers were available, Hispanic customers were forced to wait.
Figure 4 Partial Flowchart of Service Drive Operation

6
The team’s solution to this particular problem was to train one of the Hispanic Porters (who had expressed a desire for advancement) to become a Service Advisor. In a very short time, the bottleneck (customer waiting time) diminished. This solution, along with changes made when the team addressed other problems in the Service Department operations uncovered by the flowchart, led to a dramatic increase in customer satisfaction scores.
Fishboning5
Another tool useful to process improvement teams is fishboning, otherwise known as “cause and effect diagrams.” The idea is to specify the problem and then figure out what factors might, to varying degrees, cause the problem by searching backward from a desired outcome in search of “root causes.”
Creating a fishbone diagram entails the following steps:
1. Identify the specific problem or outcome you wish to examine—e.g., Late Month end budget reports, too much time to get results of lab work, etc.
2. The team facilitator writes the problem on the right hand side of a flip chart, draws a box around it, and then draws a long arrow from left to right, with the arrow head resting against the side of the box. Suppose for example, that your problem is not getting end-month budget reports on time:
3. The second step is to identify the primary cause categories, which, in this case might be people, policies, systems, places, and procedures. Draw a diagonal line for each category, that intersects the main line—much like a fish skeleton
4. Next, for each category, consider the most likely causes of the problem. In some cases, team members will already have ideas about possible causes, while in other cases they will be addressing the problem for the first time—in either event, it is an ideal place to use brainstorm-ing to arrive at possible causes in each category as shown in Figure 5 at the top of the next page.
5 The example in this section is from Continuous Improvement Tools by R. Y. Chang and M. E. Niedswieki, (Irvine, CA: Robert Chang
Associates, Inc.), 1993, pages 52-53.

7
Figure 5 Example of a Fishbone Diagram
5. Finally, search each category of causes for “most likely causes.” Circle the most likely causes and then ask “Why?” for each one. This then leads the team to consider solutions and action plans.
An interesting variation of fishboning is the Why-Why Diagram.6 The root causes are reached by asking “Why?” over and over again. Figure 6 is an example using the dealership problems faced by the dealership Service Drive described in the last section (flowcharted in Figure 4).
Figure 6 A Partial Example of the Why-Why Diagram
With this technique, the question “Why?” is asked over and over again until you finally reach “root” causes.
6 Simon Majaro, The Creative Gap: Managing Ideas for Profit, (London: Longman), 1988, pp. 137-138.

8
3. SOME USEFUL MEASURING STRATEGIES
Process improvement efforts are grounded in measurements. This point cannot be stressed strongly enough. We start by measuring where we are and then, after actions have been implemented, we measure where we have come. Only by comparing such before-after measurements can we know if our implemented actions have solved the problem we were addressing.
The data that we collect must be:
1. Information recorded clearly, so people can easily understand it.
2. Accurate information that reflects what actually happened.
3. Reliable information, so it can serve as a basis for decision making.
4. Helpful information, that points to actions that can be taken.
A number of data collection tools can be used for gathering and analyzing information.
Check Sheets
A very common data gathering tool is the check sheet, an easy-to-understand form that shows how often certain events are happening. Its benefit is that it turns opinions into facts. Constructing a check sheet entails four steps:
1. Team members agree on what is to be observed, so they are all collecting data on the same event.
2. They decide on a time period during which the data will be collected, such as every morning for two weeks beginning the first Monday of next month.
3. They design an easy-to-use form in which all columns are clearly labeled and enough space is provided to enter the data.
4. They collect the data consistently and accurately, making sure that sufficient time is allowed.
Figure 7 presents the most popular type of check sheet for recording problems or errors—it identifies specific problems and records how many times they have occurred, using the problem of “too many typing mistakes” as an example.7
Figure 7 EXAMPLE CHECK SHEET:
PROBLEM: TOO MANY TYPING MISTAKES
7 From Blueprints for Continuous Improvement: Lessons from the Baldridge Winners by Richard M. Hodgetts.

9
Charts such as the “Pareto Chart” described in the next section can later be used as the basis for additional analysis. For example, the employees involved could collect data for a second week, then compare the results. It might turn out that during the week of August 16th, many regular typists were on vacation and temporary help had to be used, or the department may have been swamped with work, which drove up the number and types of errors.
Pareto Charts
The basic concept behind this analysis is the Pareto principle. Otherwise known as the 80/20 rule, this theory holds that 80 percent of all outcomes can be attributed to 20 percent of all causes—that is, a small number of problems account for a large percentage of what goes wrong. Pareto charts are typically based on information from check sheets or other information-gathering forms. The easiest way to construct one is to follow these eight basic steps:
1. Decide on the problem to be examined and the way the information will be gathered. For example, a company could decide to determine the major reasons behind customer complaints regarding field service people, or the number of accidents occurring on the factory floor over the last 12 months and the major causes.
2. Determine the unit of measurement, such as the number of times something happened or the cost of each event.
3. Select the time period to be studied, for example, all three work shifts for each of the last three weeks.
4. Gather the information, such as the number of accidents occurring in the factory during the last 12 months.
5. Compare frequencies and costs among categories. For example, it might turn out that Defect A occurred 47 times, while Defect B happened 92 times; or Defect A cost $13,375 last year, while Defect B costs $21,850.
6. List the categories from left to right on the horizontal axis in order of decreasing frequency or cost. If some categories have only a few entries, include them as “other.” An example is shown in Figure 8:
Figure 8 AN EXAMPLE OF A TABULATING THE FREQUENCIES
OF NUMBER OF COMPLAINTS REGARDING FIELD SERVICE PEOPLE

10
7. If no clear differences appear when the information is grouped, try regrouping the data according to other criteria. An example is shown in Figure 9.
Figure 9 EXAMPLE OF REGROUPING THE DATA
8. Start at the top of the tallest bar, move upward from left to right, and draw a line that displays the cumulative frequency of the categories — this line will show how much of the total problem is accounted for by each category, as shown in Figure 10 below, which is a chart of the typist data gathered in Figure 7 on page 11:
Figure 10
EXAMPLE OF A COMPLETE PARETO CHART
Notice in Figure 10 that the results line runs across the figure from left to right, culminating at 100 percent. A visual analysis of the data shows that punctuation, spelling, and underlining account for 74 percent of all errors. Thus, the company should concentrate its correction efforts on these three areas.
Scatter Diagrams
Scatter diagrams are used to examine the possible relationships between two variables. There are three steps in developing this kind of diagram:
1. Collect 50 to 100 paired samples of related data, such as the number of hours of preventive maintenance each machine received in the last month and the number of hours of downtime that each machine had.
2. Array these data on a graph, putting the causal information (hours of maintenance) on the horizontal axis and the result information (downtime) on the vertical axis.
11
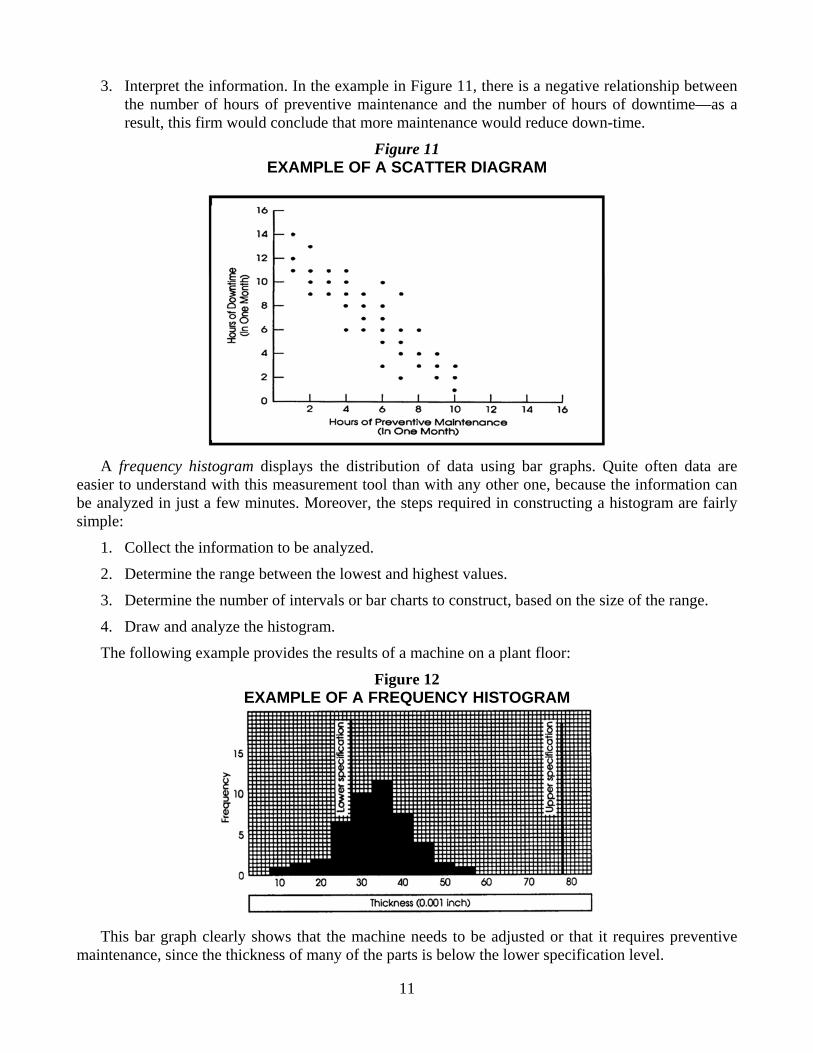
3. Interpret the information. In the example in Figure 11, there is a negative relationship between the number of hours of preventive maintenance and the number of hours of downtime—as a result, this firm would conclude that more maintenance would reduce down-time.
Figure 11 EXAMPLE OF A SCATTER DIAGRAM
A frequency histogram displays the distribution of data using bar graphs. Quite often data are easier to understand with this measurement tool than with any other one, because the information can be analyzed in just a few minutes. Moreover, the steps required in constructing a histogram are fairly simple:
1. Collect the information to be analyzed.
2. Determine the range between the lowest and highest values.
3. Determine the number of intervals or bar charts to construct, based on the size of the range.
4. Draw and analyze the histogram.
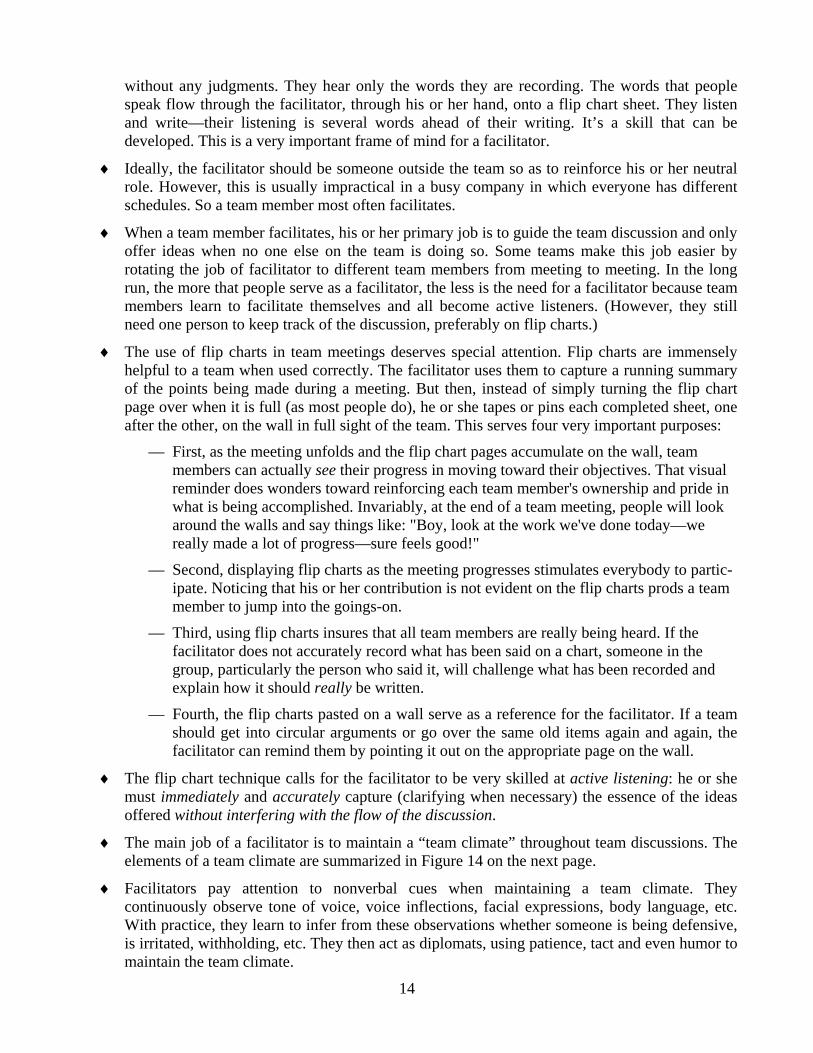
The following example provides the results of a machine on a plant floor:
Figure 12 EXAMPLE OF A FREQUENCY HISTOGRAM
This bar graph clearly shows that the machine needs to be adjusted or that it requires preventive maintenance, since the thickness of many of the parts is below the lower specification level.

12
Statistical Process Controls And Control Charts
A control chart is a special type of graph that shows the results of periodic inspections and tells an operator when to adjust a process and when to leave it alone. Unlike other tools discussed in this paper, control charts require statistical calculations that are beyond the scope of this discussion.
In simple terms, a control chart uses a running plot of the collected data. An individual or group compares these data with the upper control limit (UCL) and lower control limit (LCL) lines, which are statistically computed, to decide whether to leave things alone or take corrective action.
The example in Figure 13 on the next page shows a running chart line that remains within the UCL and LCL lines, so no adjustment would be made in this process.
Figure 13 EXAMPLE OF A CONTROL CHART
Malcom Baldrige winners commonly use control charts to help monitor their production operations, and some companies have attempted to apply these techniques to indirect labor operations. In these non-production settings, however, control charts usually have low priority, due to their relative complexity and time demands.
4. WHEN TO USE WHICH PROCESS IMPROVEMENT TOOL
Which process improvement tools are used depends on the questions being addressed. Following is an example of which problem-solving tools are most likely used to answer the specified questions:
IN ANSWERING THE QUESTION ... ... USE THIS TOOL
What goes on in the activity? Flow Chart
What are the big problems? Pareto Chart
What are the causes of the big problem? Fishbone Diagram
What does a look at past data show? Histogram
What are the cause/effect relationships Scatter Plot
What does the current data show about the activity? Control Charts
Remember that measurement is one of the most important elements of improving processes. We must know where we started from and where we are now, after instituting process changes.

13
5. FACILITATING PROCESS IMPROVEMENT TEAMS8
In the descriptions in previous sections of several of the process improvement tools, the word “facilitator” was used. It is important that a process improvement team is facilitated by one person, be it a team member or an non-team member, trained as a facilitator.
Every team benefits having someone to facilitate discussions, someone who will make sure the meetings stay focused and run smoothly. Team members bring their different personalities into a team meeting. Some are more willing to talk and express themselves, while others are quiet and have to be asked before they speak. Some become quiet and sullen when they get angry, while others get defensive or verbally attack people when they are upset. Some people come to a meeting with “hidden agendas”—personal reasons for arguing for a particular idea—and they end up not listening to fellow team members.
Most people at a meeting...are interested in the content or outcome and therefore have trouble being objective. Meeting members have a lot to do just to function as effective meeting participants. They must think through their ideas and express them so others will understand and consider them. They must hear and consider the ideas of others.
Meeting members may also have to deal with tensions resulting from "hidden agendas"—personal issues they may want to address. Some may be acutely aware of these agendas but may not feel comfortable addressing them. Others may not even be aware of their own hidden agendas, which nevertheless cloud the picture for them. Whether conscious or subconscious, hidden agendas often influence the meeting. They are usually expressed or dealt with in indirect—and often unhealthy—ways.
To further complicate the process, a meeting often becomes a place where people pursue interpersonal and political issues or vie for visibility. Most group members have trouble putting personal and political issues aside during a meeting. Someone needs to keep the group on track.9
Facilitators are catalysts to teams—they guide a group in getting its work done. They monitor team discussions so people do not violate agreed upon team rules. For example, a rule in “brainstorming” is that no one is to judge or evaluate any ideas as they are offered to the group. If a team member does start judging, the facilitator steps in to remind everyone of the rules.
Following are some useful guidelines for facilitators:
Facilitators do not get involved with the content of the team discussion because they are focused on the way people interact with each other. They act as a “third party,” striving to be unbiased and neutral. They do not focus on the content of what is being said—other than to note when people are repeating themselves, going in circles, not concentrating on the problem, etc. The biggest temptation of people acting as facilitators who are also members of the team is to want to contribute to the team, to give their own ideas for solving the problem at hand, etc. They must not focus on the content! Rather, they must focus only on the way people are interacting.
Facilitators suspend their judgments. Everything they hear is neutral. While they are facilitating, they suspend their own beliefs and assumptions. They hear only words and ideas
8 From The Whole Team: Seven On-The-Job Team Building Strategies For Building A Company-Wide Team by Arnie Dahlke,
unpublished book, 1999, pages 100-104. 9 Fran Rees, How to Lead Work Teams, (San Diego: Pfeiffer & Company), 1991, pp. 86-87.
14
without any judgments. They hear only the words they are recording. The words that people speak flow through the facilitator, through his or her hand, onto a flip chart sheet. They listen and write—their listening is several words ahead of their writing. It’s a skill that can be developed. This is a very important frame of mind for a facilitator.
Ideally, the facilitator should be someone outside the team so as to reinforce his or her neutral role. However, this is usually impractical in a busy company in which everyone has different schedules. So a team member most often facilitates.
When a team member facilitates, his or her primary job is to guide the team discussion and only offer ideas when no one else on the team is doing so. Some teams make this job easier by rotating the job of facilitator to different team members from meeting to meeting. In the long run, the more that people serve as a facilitator, the less is the need for a facilitator because team members learn to facilitate themselves and all become active listeners. (However, they still need one person to keep track of the discussion, preferably on flip charts.)
The use of flip charts in team meetings deserves special attention. Flip charts are immensely helpful to a team when used correctly. The facilitator uses them to capture a running summary of the points being made during a meeting. But then, instead of simply turning the flip chart page over when it is full (as most people do), he or she tapes or pins each completed sheet, one after the other, on the wall in full sight of the team. This serves four very important purposes:
— First, as the meeting unfolds and the flip chart pages accumulate on the wall, team members can actually see their progress in moving toward their objectives. That visual reminder does wonders toward reinforcing each team member's ownership and pride in what is being accomplished. Invariably, at the end of a team meeting, people will look around the walls and say things like: "Boy, look at the work we've done today—we really made a lot of progress—sure feels good!"
— Second, displaying flip charts as the meeting progresses stimulates everybody to partic-ipate. Noticing that his or her contribution is not evident on the flip charts prods a team member to jump into the goings-on.
— Third, using flip charts insures that all team members are really being heard. If the facilitator does not accurately record what has been said on a chart, someone in the group, particularly the person who said it, will challenge what has been recorded and explain how it should really be written.
— Fourth, the flip charts pasted on a wall serve as a reference for the facilitator. If a team should get into circular arguments or go over the same old items again and again, the facilitator can remind them by pointing it out on the appropriate page on the wall.
The flip chart technique calls for the facilitator to be very skilled at active listening: he or she must immediately and accurately capture (clarifying when necessary) the essence of the ideas offered without interfering with the flow of the discussion.
The main job of a facilitator is to maintain a “team climate” throughout team discussions. The elements of a team climate are summarized in Figure 14 on the next page.
Facilitators pay attention to nonverbal cues when maintaining a team climate. They continuously observe tone of voice, voice inflections, facial expressions, body language, etc. With practice, they learn to infer from these observations whether someone is being defensive, is irritated, withholding, etc. They then act as diplomats, using patience, tact and even humor to maintain the team climate.

15
6. GUIDELINES FOR PROCESS IMPROVEMENT TEAMS
During my years of experience of forming and implementing process improvement teams, I’ve developed a set of guidelines, which, when followed, will increase their effectiveness:
Teams must quickly focus on very specific problems that need solving—the more specific the problem, the more effective will be the team’s efforts.
Figure 14 The Team Climate
IN A TEAM CLIMATE PARTICIPANTS:
SEEK TO SOLVE PROBLEMS which focuses people on the issues at hand and increases the team’s productivity
ARE UNCRITICAL OF OTHERS which creates a safe group atmosphere and encourages people to actively participate
ACTIVELY LISTEN TO OTHERS which brings more ideas to the surface and stimulates team members to innovate
SEE PEOPLE MOST IMPORTANT which encourages people to be themselves and treat each other with respect and dignity
ARE OPEN, SELF-DISCLOSING which fosters openness among others and expands team communication
ACCEPT PERSONAL RESPONSIBILITY which cultivates honesty and sincerity and increases team integrity
HELP OTHERS TO BE EMPOWERED which nurtures feelings of ownership and pride and nourishes interdependent behavior
REWARD EACH OTHER which bolsters people’s self-esteem and makes it easy for them to take risks
SHARE INFORMATION which gives team members what they need for good decisions and effective actions
Process improvement teams are made up of people involved in or closest to the problems being addressed.
A process improvement team can be called by anyone. A manager perceives a problem and asks for volunteers to work on a team for a few sessions—however long it takes—but not endless meetings. An employee who spots a problem asks selected fellow employees to help, and they form a team to address it.
The size of a process improvement team is usually anywhere from four to six people. It should never be more than eight people. Larger teams stifle individual participation. Smaller teams get more people talking and are more effective.
Strictly limit process improvement team meetings to one hour. This keeps people actively focused on getting something done in the time allotted.
Process improvement teams make use of the kinds of tools described in earlier sections of this handout to help solve problems more systematically.
Non-team members may be invited to attend a meeting to give their input if they have information about or potential solutions for the problems under investigation.

16
Team members may interview other employees from various parts of the company to gather opinions, ideas, suggestions, and performance data relevant to their problems.
Process improvement teams are relatively short-lived. Most teams reach solutions and set up action plans and “tracking” methods in four or five meetings. A few take much longer, depending on the nature and scope of the problems addressed.
Someone “facilitates” the process improvement teams meeting. For teams composed of people who are inexperienced with process improvement meetings, it is desirable to have an experienced facilitator who is not on the team. As people become more experienced, a team member can serve as facilitator.
7. FINAL NOTE
In my experience, the more employees a company involves in process improvement teams over time, the more that they will take ownership over the new processes developed.
An investment in systematically training as many employees as possible in process improvement techniques and tools will lead to an important change in the company culture: the development of a general mind-set for continuous improvement. People throughout the company constantly will be on alert for new ways to improve processes.