d-water quality input file description
DESCRIPTION
Water Quality Input File DescriptionTRANSCRIPT

D-Water Quality
Water quality and aquatic ecology modelling suite
User Manual
Description of Input FileDRAFT

DRAFT

DRAFTD-Water Quality
Documentation of the input file
User Manual
D-Water Quality
Version: 2.00Revision: 35533
28 March 2015

DRAFT
D-Water Quality, User Manual
Published and printed by:DeltaresBoussinesqweg 12629 HV DelftP.O. 1772600 MH DelftThe Netherlands
telephone: +31 88 335 82 73fax: +31 88 335 85 82e-mail: [email protected]: http://www.deltares.nl
For sales contact:telephone: +31 88 335 81 88fax: +31 88 335 81 11e-mail: [email protected]: http://www.deltaressystems.nl
For support contact:telephone: +31 88 335 81 00fax: +31 88 335 81 11e-mail: [email protected]: http://www.deltaressystems.nl
Copyright © 2015 DeltaresAll rights reserved. No part of this document may be reproduced in any form by print, photoprint, photo copy, microfilm or any other means, without written permission from the publisher:Deltares.

DRAFT
Contents
Contents
0 A guide to this manual 10.1 Introduction . . . . . . . . . . . . . . . . . . . . . . . . . . . . . . . . . . 10.2 How to use this manual . . . . . . . . . . . . . . . . . . . . . . . . . . . . 20.3 Glossary . . . . . . . . . . . . . . . . . . . . . . . . . . . . . . . . . . . 30.4 Conventions for the input file . . . . . . . . . . . . . . . . . . . . . . . . . 4
0.4.1 Markup options . . . . . . . . . . . . . . . . . . . . . . . . . . . . 40.4.2 Convenience options . . . . . . . . . . . . . . . . . . . . . . . . . 5
1 Identification, selected substances 71.1 The first line . . . . . . . . . . . . . . . . . . . . . . . . . . . . . . . . . 71.2 Version number and output option . . . . . . . . . . . . . . . . . . . . . . . 71.3 Model title and calendar date string . . . . . . . . . . . . . . . . . . . . . . 81.4 Number of substances . . . . . . . . . . . . . . . . . . . . . . . . . . . . 91.5 Substance names . . . . . . . . . . . . . . . . . . . . . . . . . . . . . . . 9
1.5.1 Multiple copies of substances . . . . . . . . . . . . . . . . . . . . . 91.6 Finalization . . . . . . . . . . . . . . . . . . . . . . . . . . . . . . . . . . 10
2 Timers, integration, monitoring 112.1 Time factor and time strings . . . . . . . . . . . . . . . . . . . . . . . . . . 112.2 Integration procedure . . . . . . . . . . . . . . . . . . . . . . . . . . . . . 122.3 Optional keywords . . . . . . . . . . . . . . . . . . . . . . . . . . . . . . 13
2.3.1 Particle tracking . . . . . . . . . . . . . . . . . . . . . . . . . . . 152.4 Integration timers . . . . . . . . . . . . . . . . . . . . . . . . . . . . . . . 162.5 Monitoring locations and monitoring transects . . . . . . . . . . . . . . . . . 172.6 Output timers . . . . . . . . . . . . . . . . . . . . . . . . . . . . . . . . . 182.7 Finalization . . . . . . . . . . . . . . . . . . . . . . . . . . . . . . . . . . 19
3 Grid and values of the volumes 213.1 Number of computational volumes . . . . . . . . . . . . . . . . . . . . . . 213.2 Grid information . . . . . . . . . . . . . . . . . . . . . . . . . . . . . . . . 21
3.2.1 Definition of a grid . . . . . . . . . . . . . . . . . . . . . . . . . . 233.3 NOBOTTOMLAY keyword . . . . . . . . . . . . . . . . . . . . . . . . . . . 243.4 SUBSTANCE_PROCESSGRID keyword . . . . . . . . . . . . . . . . . . . 253.5 PROCESS_TIMESTEP_MULTIPLIER keyword . . . . . . . . . . . . . . . . 263.6 Printed grid layout . . . . . . . . . . . . . . . . . . . . . . . . . . . . . . . 263.7 Properties or attributes of computational volumes . . . . . . . . . . . . . . . 27
3.7.1 Constant attributes . . . . . . . . . . . . . . . . . . . . . . . . . . 283.7.2 Time variable attributes . . . . . . . . . . . . . . . . . . . . . . . . 29
3.8 Segment volumes . . . . . . . . . . . . . . . . . . . . . . . . . . . . . . . 293.9 Finalization . . . . . . . . . . . . . . . . . . . . . . . . . . . . . . . . . . 30
4 Hydrodynamic data 314.1 General . . . . . . . . . . . . . . . . . . . . . . . . . . . . . . . . . . . . 314.2 Number of exchanges . . . . . . . . . . . . . . . . . . . . . . . . . . . . . 33
4.2.1 Standard processing for irregular solvers . . . . . . . . . . . . . . . 334.2.2 Processing for solvers on regular grids . . . . . . . . . . . . . . . . 33
4.3 Number of additional dispersion and velocity arrays . . . . . . . . . . . . . . 344.4 Exchange pointers . . . . . . . . . . . . . . . . . . . . . . . . . . . . . . 344.5 Dispersions . . . . . . . . . . . . . . . . . . . . . . . . . . . . . . . . . . 35
4.5.1 Dispersion input through the input file . . . . . . . . . . . . . . . . . 354.5.2 Dispersion input through the processes library . . . . . . . . . . . . 36
4.5.2.1 The VertDisp process . . . . . . . . . . . . . . . . . . . 364.5.2.2 The VertDisper process . . . . . . . . . . . . . . . . . . 36
Deltares iii

DRAFT
D-Water Quality, User Manual
4.5.2.3 The HDisperVel process . . . . . . . . . . . . . . . . . . 364.6 The exchange areas between computational cells . . . . . . . . . . . . . . . 374.7 The flows between computational cells . . . . . . . . . . . . . . . . . . . . 384.8 Velocities . . . . . . . . . . . . . . . . . . . . . . . . . . . . . . . . . . . 384.9 Lengths . . . . . . . . . . . . . . . . . . . . . . . . . . . . . . . . . . . . 384.10 Second form of input file structure . . . . . . . . . . . . . . . . . . . . . . . 394.11 Finalization . . . . . . . . . . . . . . . . . . . . . . . . . . . . . . . . . . 39
5 Open boundary conditions 415.1 General . . . . . . . . . . . . . . . . . . . . . . . . . . . . . . . . . . . . 415.2 Identification of open boundaries . . . . . . . . . . . . . . . . . . . . . . . 425.3 Thatcher-Harleman time lags . . . . . . . . . . . . . . . . . . . . . . . . . 435.4 Concentration values . . . . . . . . . . . . . . . . . . . . . . . . . . . . . 43
5.4.1 Input blocks . . . . . . . . . . . . . . . . . . . . . . . . . . . . . . 435.4.2 Column headers and computations . . . . . . . . . . . . . . . . . . 445.4.3 Time series . . . . . . . . . . . . . . . . . . . . . . . . . . . . . . 455.4.4 Linear interpolation . . . . . . . . . . . . . . . . . . . . . . . . . . 455.4.5 Scale your input . . . . . . . . . . . . . . . . . . . . . . . . . . . 465.4.6 Data from external non-ASCII files . . . . . . . . . . . . . . . . . . 465.4.7 Multiple copies of substances . . . . . . . . . . . . . . . . . . . . . 46
5.5 Finalization . . . . . . . . . . . . . . . . . . . . . . . . . . . . . . . . . . 46
6 Loads and withdrawals 476.1 General . . . . . . . . . . . . . . . . . . . . . . . . . . . . . . . . . . . . 476.2 Number of loads and identification of loads . . . . . . . . . . . . . . . . . . 48
6.2.1 Special loads . . . . . . . . . . . . . . . . . . . . . . . . . . . . . 486.2.2 Load entry options . . . . . . . . . . . . . . . . . . . . . . . . . . 49
6.3 Concentration values . . . . . . . . . . . . . . . . . . . . . . . . . . . . . 506.3.1 A ’substance’ called FLOW . . . . . . . . . . . . . . . . . . . . . . 506.3.2 Input blocks . . . . . . . . . . . . . . . . . . . . . . . . . . . . . . 506.3.3 Column headers and computations . . . . . . . . . . . . . . . . . . 516.3.4 Time series . . . . . . . . . . . . . . . . . . . . . . . . . . . . . . 516.3.5 Linear interpolation . . . . . . . . . . . . . . . . . . . . . . . . . . 526.3.6 Scale your input . . . . . . . . . . . . . . . . . . . . . . . . . . . 526.3.7 Data from external non-ASCII files . . . . . . . . . . . . . . . . . . 526.3.8 Multiple copies of substances . . . . . . . . . . . . . . . . . . . . . 526.3.9 Useful options . . . . . . . . . . . . . . . . . . . . . . . . . . . . 536.3.10 Internal intelligence . . . . . . . . . . . . . . . . . . . . . . . . . . 53
6.4 Finalization . . . . . . . . . . . . . . . . . . . . . . . . . . . . . . . . . . 53
7 Process steering 557.1 General . . . . . . . . . . . . . . . . . . . . . . . . . . . . . . . . . . . . 557.2 Steering items . . . . . . . . . . . . . . . . . . . . . . . . . . . . . . . . 567.3 Data blocks . . . . . . . . . . . . . . . . . . . . . . . . . . . . . . . . . . 57
7.3.1 CONSTANTS . . . . . . . . . . . . . . . . . . . . . . . . . . . . . 577.3.1.1 Special constants . . . . . . . . . . . . . . . . . . . . . 57
7.3.2 PARAMETERS . . . . . . . . . . . . . . . . . . . . . . . . . . . . 597.3.3 FUNCTIONS . . . . . . . . . . . . . . . . . . . . . . . . . . . . . 617.3.4 SEG_FUNCTIONS . . . . . . . . . . . . . . . . . . . . . . . . . . 637.3.5 Multiple copies of substances . . . . . . . . . . . . . . . . . . . . . 63
7.4 Finalization . . . . . . . . . . . . . . . . . . . . . . . . . . . . . . . . . . 63
8 Initial conditions 658.1 General . . . . . . . . . . . . . . . . . . . . . . . . . . . . . . . . . . . . 658.2 Old specification . . . . . . . . . . . . . . . . . . . . . . . . . . . . . . . 66
iv Deltares
DRAFT
Contents
8.3 New specification . . . . . . . . . . . . . . . . . . . . . . . . . . . . . . . 678.3.1 Multiple copies of substances . . . . . . . . . . . . . . . . . . . . . 68
8.4 Z-layer models . . . . . . . . . . . . . . . . . . . . . . . . . . . . . . . . 688.5 Finalization . . . . . . . . . . . . . . . . . . . . . . . . . . . . . . . . . . 68
9 Model output 699.1 General . . . . . . . . . . . . . . . . . . . . . . . . . . . . . . . . . . . . 699.2 Output files . . . . . . . . . . . . . . . . . . . . . . . . . . . . . . . . . . 709.3 Additional output variables . . . . . . . . . . . . . . . . . . . . . . . . . . 729.4 Finalization . . . . . . . . . . . . . . . . . . . . . . . . . . . . . . . . . . 72
10 Statistical output 7310.1 General . . . . . . . . . . . . . . . . . . . . . . . . . . . . . . . . . . . . 7310.2 Definition of time intervals . . . . . . . . . . . . . . . . . . . . . . . . . . . 7410.3 Supported statistical procedures . . . . . . . . . . . . . . . . . . . . . . . 7410.4 Definition of statistical procedures . . . . . . . . . . . . . . . . . . . . . . . 7510.5 Statistical output files . . . . . . . . . . . . . . . . . . . . . . . . . . . . . 7610.6 Finalization . . . . . . . . . . . . . . . . . . . . . . . . . . . . . . . . . . 76
11 Annexes 7711.1 Time tokens . . . . . . . . . . . . . . . . . . . . . . . . . . . . . . . . . 7711.2 Hydrodynamic input . . . . . . . . . . . . . . . . . . . . . . . . . . . . . . 7811.3 Multiple hyd file . . . . . . . . . . . . . . . . . . . . . . . . . . . . . . . . 8111.4 Binary file that are directly read by D-Water Quality . . . . . . . . . . . . . . 82
Index 85
Deltares v

DRAFT
D-Water Quality, User Manual
vi Deltares

DRAFT
List of Tables
List of Tables
1 Groups of ASCII input data for the D-Water Quality input processor . . . . . . 22 Supported diagnostic output levels of the D-Water Quality input processor . . 5
2.1 Supported keyword steered options in the D-Water Quality input processor . . 14
3.1 Supported keywords in the grid information section . . . . . . . . . . . . . . 223.2 Properties of D-Water Quality computational volumes . . . . . . . . . . . . . 28
11.1 Dimensions mentioned in table 11.2 . . . . . . . . . . . . . . . . . . . . . . 8311.2 Documentation of the binary input files that can be read directly by D-Water
Quality . . . . . . . . . . . . . . . . . . . . . . . . . . . . . . . . . . . . 83
Deltares vii

DRAFT
D-Water Quality, User Manual
viii Deltares

DRAFT
0 A guide to this manual
0.1 Introduction
D-Water Quality is a generic mathematical model for water quality and ecology. It has twodifferent parts that work together. It solves the equations for advective and diffusive transportof substances in water on the one hand and it models the water quality kinetics of chemistry,biology and physics that influence the behavior of substances and organisms in the wateron the other hand. D-Water Quality is generally applied in waterflow of surface water andor ground water in any dimension, 1D, 2D-vertical, 2D-horizontal or 3D or a combination ofthese dimensionalities. Since it is strictly mass conserving with regard to both the transportof substance and the biological en chemical transformations between substances and organ-isms, it can be applied to compressible flows (like air) as well and a small number of theseapplications are known in the past decades. The vaste majority of applications however is inincompressible flow like water.
D-Water Quality does not compute the flow itself. It is connected to hydrodynamic flow modelsto obtain the likely flows in real life situations. Alternatively you may specify a stylistic flowfield by hand yourself. D-Water Quality has been connected to the flow models Delft1D-2D(SOBEK), Delft2D-3D, Delft-FM, Simona and Waqua and to ROMS, TELEMAC 2D and 3D,Untrim, ECOM and ShyFem. Because of its mass conserving Finite Volume principles it canbe connected to any water flow model that conserves mass. The mentioned models illustratethis. They range from Finite Difference models through Finite Volume models to Finite Elementmodels both on structured and unstructured grids and with different dimensionalityThis User Manual concerns the ASCII input processor. With this manual, the user shouldbe able to make an ASCII input file that ’works’. Additional to this ASCII input, also thehydrodynamic flow data needs to be present. This is generally done by a coupling programthat may be built into the hydrodynamic model like for Delft1D-2D (SOBEK), Delft2D-3D, Delft-FM, TELEMAC 2D and 3D and Untrim or that works on the output files of such a model. Thecoupling may act on single time steps, calling D-Water Quality as a dynamic link library (dll)or as a shared library per time step or the coupling may act on finished hydrodynamic resultsfor subsequent multiple water quality model computations. The Deltares staff supports theconstruction of these coupling programs for any mass conserving third party flow model.
Although the manual will allow you to make a D-Water Quality ASCII input file to let the model’work’, it is generally convenient to have a correct sample input file at hand to start with. Suchsample input files are produced by the Graphical User Interfaces that support the connectionwith many of the mentioned hydrodynamic modelling systems. The sample input file canthen be modified according to your needs using this manual. This is especially valuablefor those options that are not supported by the GUI yet. A warning should be given here:the input file that is described here is generally the output file of the GUI. This means thatyour modifications generally do not enter into the GUI again and any modified ASCII file willgenerally be overwritten by the GUI if you do not make the precaution to store it in a safe placeand/or under a safe name.
The ASCII input file of the D-Water Quality model can be created and/or modified using anormal text editor. Be aware however that the D-Water Quality input processor may not un-derstand tabs and word processor directives. The ASCII input of the D-Water Quality modelis divided into 10 sections that are also distinguishable in the input file itself by section sep-aration lines. Each section is called an input "group" and each input group is described in aseparate chapter of this manual. Each input group closes with the token: #n, with n the groupnumber. This closing token may start anywhere on a line like:
#4 ; this is the end of group 4If D-Water Quality does not encounter the closing token at the right location in the file, it will
Deltares 1 of 90

DRAFT
D-Water Quality, User Manual
produce an error. A summary of the subdivision into groups is given in Table 1.
Table 1: Groups of ASCII input data for the D-Water Quality input processor
Group Description
1 identification, substance IDs
2 integration options, timers, monitoring
3 cells, grids, cell properties, volumes
4 exchanges, dispersions, velocities, flows, areas, lengthes
5 open boundary conditions
6 discharges and withdrawals
7 water quality constants, parameters, functions
8 initial conditions
9 output specification
10 statistical output
0.2 How to use this manual
Editing and modification of the input file is about the last step in a whole sequence of steps toset before you can do a water quality model simulation. We assume here that you have setthe following steps before you arrive at the point that this manual becomes useful for you:
1 Make a set water flow files for water quality simulations with one of the supported hydro-dynamic models.
2 Import this hydrodynamics into the user interface and generate a simulation with defaultsubstance settings. This step should make an input file for a simulation with 1 substance‘continuity’ with initial conditions and open boundary conditions of 1.0. Check that alsowaste loads with water flow associated with it should have a concentration of 1.0 attachedto the water flow. Choose a safe integration option like option 15. Out should come1.0. This proofs the mass conservation of the underlying hydrodynamics. Deviations mayoccur due to precipitation and evaporation that will likely not be included in your first testsimulations.
3 Decide on the substances and processes to model. Try to select them through the PLCT(Process Library Control Tool). This tool produces a .sub file with the selected settings.Import this .sub file into the user interface.
4 Decide on the initial conditions, waste loads, coefficients that have no default value anddecide on the most informative output for your selection.
5 Created a ASCII .inp input file and run the first and second step and make graphs of theresults. This should give no significant problems, at least no problems where you needthis manual for.
6 Modify your input and test alternative settings using this procedure. If you can completeyour job in this way, then that is fine and you do not need this manual further more, sincethe GUI does everything for you.
7 Should you need functionality that is not supported by the GUI, then you may edit the .inp
2 of 90 Deltares

DRAFT
A guide to this manual
file manually to use that functionality. That is where this manual comes in.8 Be aware that you have to save your manually edited file under a different name and / or
at a different location the ensure that the GUI will not overwrite your edited input file. Youmay nevertheless use the GUI to run the D-Water Quality model with your edited input file.That saves you the trouble of determining the command line options to use.
9 You may easily make errors by manually editing your input file. You can inspect the correctinterpretation of your input file by scanning the .lst output file. Search for strings like‘WARNING’ or ‘ERROR’ if you find the .lst file too bulky to read it in detail.
0.3 Glossary
We include here a glossary for several reasons. First, some words will occur frequently in thetext and a quick reference guide could be useful. Second, in the D-Water Quality modellingterminology some words may have a slightly different meaning than you are used to. Hence itis important to realize their definition. Third, throughout the manual specific terms related tothe model will be introduced. These terms are compiled here for easy reference.
Substance A D-Water Quality state variable. D-Water Quality models the trans-port of active or transported substances by solving the advection-diffusion equation numerically. The concentration of inactive or pas-sive substances is not affected by advective or dispersive trans-port but only by the water quality processes. The D-Water Qual-ity processes-library contains water quality processes and additionaltransport processes. The concentration of both the transported andthe passive substances can be affected by the water quality pro-cesses.
Active (substance) Active or transported substances are substances that will be trans-ported by the flow of water, they thus consist of dissolved and partic-ulate material in the water column.
Inactive (substance) Inactive or passive substances are substances that are not trans-ported by the flow of water. Substances that are part of the waterbed or are attached to the water bed are passive substances.
Process Processes are kinetic formulations that apply to substances. Theycan be divided into water quality processes and transport processes.A water quality process is associated with the transformation of sub-stances into other substances (e.g. nitrification or mineralization) andit generates one or more fluxes between those substances. A trans-port process is associated with the redistribution of substances andit generates one or more velocities or dispersions additional to thosealready present by the movement of the water. Common transportprocesses are e.g. the sedimentation of particulates or additional dis-persive transport of e.g. fish by own swimming. A process may alsogenerate process output. Some processes only calculate processoutput, e.g. the calculation of the extinction of light. Other processesalso calculate fluxes between substances.
Process output Process output can be made available for post processing in thesame way as the substances are displayed in graphs and numericaloutput files. This is very helpful to identify the value of intermediatevariables like available light at a certain water depth or the sum of allmodeled algae expressed as chlorophyll.
Flux Many processes also compute fluxes as output. A flux is a changeof the mass of a substance per unit of time and of volume as a resultof the specific water quality process (for example the nitrification fluxis the mass of ammonium converted to nitrate per unit of time and
Deltares 3 of 90

DRAFT
D-Water Quality, User Manual
per unit of volume).Segment A segment indicates a D-Water Quality computational volume. D-
Water Quality assumes that the model area is subdivided completelyand non-overlapping in computational volumes (the Finite VolumeMethod). The word “volume” is also used for the volume in m3 of asegment, so it is preferred to have different wording to avoid ambi-guity.
Exchange The complete subdivision of the model area into volumes has asconsequence that adjacent volumes share an interface or exchangearea through which flow and mixing takes place between those ad-jacent volumes. This is called an exchange and is defined by theto and from volume number on both sides. Positive flow is from thefrom volume to the to volume. Some numerical schemes also re-quire a from-minus-1 and a to-plus-1 cell or volume number to allowfor higher order accurate numerics.
Segment related andexchange relatedinformation
Process input and process output is divided into segment/volumerelated and exchange related information. Segment related informa-tion is defined for each segment of the schematization (e.g. param-eters or concentrations). Exchange related information is known foreach exchange area of the schematization (e.g. flows or additionalvelocities).
Exchange area The contact surface of two linked computational volumes (or seg-ments).
Constant Input parameter that does not vary in time or in space.
Parameter Spatially distributed input parameter that does not vary over time.
Function Time variable function that does not vary spatially.
Segment function Spatially distributed time function (usually a large and binary file cre-ated by other software) that contains information for a spatially dis-tributed model parameter that varies over time.
Solver Part of the computational core that solves the Advection DiffusionEquation (ADE)
0.4 Conventions for the input file
We did our best to make the D-Water Quality input file as flexible as possible and allow for amarkup that is as readable as possible. You are kindly invited to signal if you see additionalways of improvement.
0.4.1 Markup options
The D-Water Quality input file is completely free formatted. This means that it does not mat-ter how you make your layout of the input file. There is however one important restriction.You should specify your input in a fixed sequential order. This seems a limitation but youwill notice that it on the contrary enhances convenience. You need not specify <keyword>. . .<end-keyword> sequences, or even nested versions of these sequences. Such construc-tions would have been necessary if the order was completely free because D-Water Qualityshould in one way or another understand what you want. D-Water Quality can now concludeintelligently from the sequence in your input, what options you are using.
The D-Water Quality input file with more or less this structure dates back to 1986 and old filesare still read with minor or no adaptations with the present input processor. Unfortunately you
4 of 90 Deltares

DRAFT
A guide to this manual
still see some option numbers in the input file as remnants from this past. They function asswitches and are not so clear. You need this manual to identify their meaning. Increasinglymore we are changing those option numbers into meaningful keywords but we also want toremain compatible with older input files. So this manual aims to document the currently mostmodern version of the input processor and many of the outdated constructs are still supported,but are not explained in this manual any more.
The following markup rules are important:
� The ASCII input items are considered to be tokens separated by one or more spaces.This means that tokens containing spaces require special care. See under characterinput below.
� You must provide at the beginning of the file among others a comment character . Thischaracter indicates that everything that follows the character on the same line is a com-ment. You can use a comment line as header for the lines that follow as a kind of columnheaders. You can also continue information with a comment on the same line to indicatewhat the row is meant for.
� You may insert any amount of blank lines you need for readability.� Character input like names/IDs can be inserted in the file without further quotes or double
quotes. Only if the character string contains embedded blanks, it should be surroundedby single or double quotes. A string variable surrounded by single quotes may containdouble quotes. A string variable surrounded by double quotes may contain single quotes.A string variable surrounded by any quotes may contain comment characters.
� Integers consist of numbers 0-9 only, optionally directly preceded by a sign.� Floating point variables may be specified e.g. as -23.48 or as 0.25E+04 or as 3.14e2.� Any keywords to steer input processing are always required in CAPITALS.
0.4.2 Convenience options� If you have to insert numerous equal data you may use e.g. 312*' ' to insert 312 blank
strings or 856*-312.456E-02 to define 856 times the real value. It is important that nospaces are allowed in between the heading count, the * and the item to be repeated. Thisfeature cannot be nested.
� If you have a bulky table, that you do not want to be contained in the input file, you canspecify INCLUDE d:\my_dir\my_file.dat at the location where the table should beincluded. If you omit the full path D-Water Quality assumes that the file is in the currentdirctory. You are also allowed to use relative paths.
� The INCLUDE directive works up to 6 levels deep, so an included file may also containINCLUDE directives. You should be aware that for relative paths, the path of the main inputfile is the starting point.
� There are several levels of diagnostic output given in Table 2. Each level will print also theitems of the levels with a lower rank number.
Table 2: Supported diagnostic output levels of the D-Water Quality input processor
Level Output
Level 0 only very basic output
Level 1 substance names
Level 2 grid layouts, dispersion IDs and fields, boundary types, waste load types,names of constants, parameters, functions, segment functions
Deltares 5 of 90

DRAFT
D-Water Quality, User Manual
Level 3 administration of monitoring locations, boundary link andministration, bound-ary names and IDs, boundary time lags, waste load names and IDs, specificinformation on cells where defaults are overridden
Level 4 any variable time step specification
Level 5 features per grid cell
6 of 90 Deltares

DRAFT
1 Identification, selected substances
This is the first group in the input file. The following example of the input for this group isproduced by the user interface and reads like:
200 132 ';' ; width of input and output, comment
; Type of DELWAQ input file:; DELWAQ_VERSION_4.91; Option for printing the report: verbose; PRINT_OUTPUT_OPTION_4
; first block: identification'd3d-waq-test021: "Friesche zeegat" area''2-Dimensional; dry cells removed''with statistical output''T0: 1990.08.05 00:00:00 (scu = 1s)'
; substances file: bod-do.sub; hydrodynamic file: E:\delft3d\testbank\d3d-waq-test001\input\com-f34.dat
2 1 ; number of active and inactive substances
; Index Name1 'OXY'2 'CBOD5'3 'SOD'
#1 ; delimiter for the first block
1.1 The first line
The first line of the D-Water Quality ASCII input file has a specific meaning. It is not parsedby the parser but it provides information to initialize the parser. It contains 3 items:
� Maximum line length in number of characters for this input file. Longer lines will be trun-cated. At the moment of this writing, this value is limited to 1000 characters.
� Line length of the diagnostic output file. Here only 2 valid numbers are possible: 80 or132. Any other number will result in the use of 80.
� A comment character. User interfaces generally produce ';' for this character, but theuser is free to select an alternative character. Everything after this character on the sameline will be interpreted as “comment” that will not influence processing. In the followingchapters of this manual we will also use ‘;’ as the comment-character.
A valid example for the first line is: 200 132 ';'
1.2 Version number and output option
Next the whole file is scanned for the presence of two strings. The strings are recognizedanywhere in the text, so also if they are not placed in group 1, but they are commonly placedaround the top of the input file. They should be placed after a comment character that isat least followed by one or more blanks.
� DELWAQ_VERSION_4.91The string is immediately followed by a version number. The version number is a real ofat most 5 characters long. If this real is higher than or equal to 4.90, the so called “newinput processing” (since 1996!) is expected in the input file. This input structure differssignificantly from the structure that was in use since 1986. Additional extensions are pro-
Deltares 7 of 90

DRAFT
D-Water Quality, User Manual
vided since, but they either are compatible with previous structures, or their presence isindicated by the presence of certain keywords that precede the new functionality. The de-fault version number is 0.0, but that will result in input file reading that deviates significantlyfrom present days input. The version number that corresponds with the contents of thismanual is 4.91.
� PRINT_OUTPUT_OPTION_4The string is immediately followed a 1 character integer that refers to the level of diagnosticoutput as was explained in table 2. The default output level is -1. This level, like level 0,only produces the most basic information.
1.3 Model title and calendar date string
The next input for the input processor should be 4 strings that form the model title. They arealso displayed on printed output and in binary files. These strings should be present, so incase you do not want to use the option you have to provide e.g. 4*' '. The strings areeach 40 characters long. If longer strings are provided, they are truncated. In the exampleat the head of this chapter it can be seen that the strings may contain embedded commentcharacters and double quotes and blanks if surrounded by single quotes.There are 2 different areas within these 4 title strings that have a special meaning:
� MASS/M2If this token is present in the character positions 34-40 of the 3rd title string, then severalprograms assume that typical waterbed related substances are expressed in mass perm2, rather than in mass per grid cell which was the unit before January 2011. You shouldnot provide this information here. You should however be prepared that the D-Water Qual-ity system overwrites the last 7 characters of your 3rd title string.
� T0= 2006-06-21 18:05:00 (scu= 1s)This string is exactly 40 characters long. It is recognized if this is the 4th title string. It linksthe zero of the D-Water Quality internal timer to this absolute calendar time offset.The D-Water Quality internal timer is an integer. Theoretically this integer has the unit:‘system time’. This could be a second or a year or any other unit of time. All dimensionsuse this time further more, so if a year is chosen, then flow is expected as ‘volume/year’.Implicitly most functionality assumes 1 second for the system time unit. models it maybe useful to have a longer unit of time than 1 second. That is why the presence of this4th string gives opportunity to define a system timer in a number of seconds longer than1. The number of seconds is given in the 8 positions from position 31-38. You can alsospecify a system timer smaller than 1 second by a negative value. So -5 indicates 1/5th
of a second or 0.2 second and a value of -1000 indicates a millisecond. In general you willuse however 1 second, like in the given example string.The string upfront indicates the calendar date and time of the zero of the system time.If the timer string is recognized, you can furthermore use absolute times in your input file.For output the system time is multiplied by the unit of system time in seconds (or divided ifthe value was negative) and then added to the calendar zero of the system time and thenused for output of calender date and time of results.CAUTION: As later will be discussed, the system time is a 32 bit signed integer at themoment, limiting the time span covered by the system time to plus or minus 64 years.This is likely to be changed in the near future, but has still to be anticipated by now.The calendar zero that you define here with the calendar time sting should be chosensufficiently ’close’ to the modeling interval to ensure that the whole modeling interval iscontained in the interval of ± 64 years from the calendar time string.If the timer string is not recognized, the times in input files are all expected in system timeonly and output times in output files are expressed in system time only.
8 of 90 Deltares

DRAFT
Identification, selected substances
1.4 Number of substances
D-Water Quality distinguishes substances that are transported with the water and substancesthat are passive. The latter are assumed to be attached to the water bed or to embankments.They are sometimes also called ’inactive’, but that is probably not the right wording, since theyare still subject to water quality processes. In the code of D-Water Quality the substances arecalled ’systems’ and the amount of transported substances is called NOSYS . The total amountof substances is called NOTOT . The difference is the amount of passive substances. Inputhere may read like:
23 ; number of transported substances6 ; number of passive substances
Note: Because the passive substances are not transported, it is impossible to compute asteady state spatial concentration pattern due to stationary transport patterns for them. Thisis why passive substances are not allowed for the few steady state solvers within D-WaterQuality. The relevant steady state solvers have numbers 17 and 18. The steady state solvers6 - 9 are obsolete and should not be use any more.
1.5 Substance names
For each substance a name should be provided. A substance name is a string of 20 char-acters that serves as the ID of the substance. The substance name / ID should be unique.If a blank ' ' is given, D-Water Quality will make the name `Substance n' with n is thesubstance number.
The processes library recognizes substances from their ID, so the ID should correspond ex-actly with the corresponding ID in the processes library. Here the use of the the GraphicalUser Interface, GUI pays. Substances selected by the user interface enter into an input filecreated by the user interface automatically with the correct ID. It is nevertheless possible toadd additional substances with different names. Because they are not recognized by the pro-cesses library, they are not subject to water quality processes, but they can e.g. be used astracers in the model.
The sample input shows a sequence number and the substance ID. The user interface willmake an input file with all substance IDs in order of the sequence number. You can changethis order, by changing the sequence numbers. You are however not allowed to use the samesequence number twice and all passive substances should have the highest sequence num-bers (the transported substances loop from 1 to NOSYS in the substances array, the passivesubstances loop from NOSYS+1 to NOTOT). Input can look like:
2 1 ; number of active and inactive substances; Index Name
2 OXY ; Oxygen in mg/l1 CBOD5 ; Carbonous BOD-5 in mg/l|3 SOD ; Sediment oxygen demand in mg/m2
You will note how the comments are used to enhance readability of the data. You will alsonote that it does not matter whether the numbers of transported and passive substances arementioned on one line or on different lines. It also does not matter where the information isplaced on the line, only the order in which the information appears matters.
1.5.1 Multiple copies of substances
Up to the year 2011 D-Water Quality substances are specified like mentioned earlier. Increas-ingly more however the need came up to model several instances of a substance separately.
Deltares 9 of 90

DRAFT
D-Water Quality, User Manual
All these instances should basically share the same processes in the processes library, al-beit with optionally different reaction coefficients. This could be done by just specifying theirIDs like above, but that becomes less practical if 100 sediment fractions are required or 57conservative tracers to monitor the fate from 57 waste fluxes or the specification of 50 algaespecies in mutual competition. For that reason a functionality has started to appear from 2011on that is called multiple substances.The input is simple:
2 1 ; number of active and inactive substances; Index Name
2 OXY ; Oxygen in mg/l1 CBOD5 *5 ; 5 instances of CBOD53 SOD *5 ; 5 instances of Suspended Sediments at the bed
Note:
� The passive substance at the water bed is the last substance.� If 2 plus 1 substances are specified respectively then only for this three substances the
ID’s need to be specified.� Their should be a space between the ID and the ‘*n’ token.� Their should be no space between ‘*’ and the 1-3 digits that specify the amount.� Due to the multiplication, 1 + 2*5 = 11 substances are finally modeled, 5 of them are
passive.� The substances turn out to be automatically named CBOD501 - CBOD505 and SOD01 -
SOD05.� If two substances share fluxes and have the same multiplicity, then it is automatically
assumed that the single substances with the same number are coupled.
1.6 Finalization
This part of the input file is finalized with the #1 end of first data group indicator.
10 of 90 Deltares

DRAFT
2 Timers, integration, monitoring
This is the second group in the input file. The input for this group may read like:
; second block of model input (timers)
; factor timer string processes timer86400 'ddhhmmss' 'ddhhmmss'5.70 ; integration option 5, sub-options .70 ;
; detailed balance optionsBAL_NOLUMPPROCESSESBAL_NOLUMPLOADSBAL_NOLUMPTRANSPORT
; ddhhmmss0123000 ; simulation start time
25123000 ; simulation stop time0 ; constant time step
0000500 ; time step size;
7 ; number of monitoring points/areas; name n= numbers
'(3,14)' 1 208'(4,14)' 1 209'(12,8)' 1 110'(18,11)' 1 165
'(7-8,5-6)' 4 57 58 73 74'(7,11)' 1 154'(11,2)' 1 8
0 ; monitoring transects not used
; start time stop time time step of; ddhhmmss ddhhmmss ddhhmmss
0123000 25123000 0123000 ; monitoring0123000 25123000 0123000 ; map, dump0123000 25123000 0003000 ; history
#2 ; delimiter for the second block
2.1 Time factor and time strings� factor between timers
D-Water Quality uses for its input processing 2 different timers. The first timer is de modeltimer and is most often expressed in seconds. The second timer is the auxiliary timer thatis used for water quality processes. This timer is generally expressed in days (a decaycoefficient in 1/day). D-Water Quality supports freedom of choice in this respect, but itis not excluded that some processes routines lean on the fact that the processes timeris generally expressed in days. Because the unit of time is free, only the factor betweenthe two timers need to be provided. This is generally 86400, the number of seconds ina day. Should you chose however a system time of days (and thus flows in m3/day) andprocesses expressed per year, then you could take 365 as factor.
� timer stringsD-Water Quality timers are integers. This helps avoiding round-off errors. It is howevermore convenient to tell D-Water Quality that it has to stop simulation ’after 31 days’, ratherthan ’after 2678400 seconds’. For this reason you may tell D-Water Quality that you willprovide input in DDHHMMSS format. This allows you to specify 31000000 for 31 days. D-Water Quality is still using 32 bits signed integers for its timers and thus you may not spec-ify a higher time then 2147 days 48 hours 36 minutes and 48 seconds, since 2147483648equals 231. This limits your specification to 5 years and 10 month. This may change
Deltares 11 of 90

DRAFT
D-Water Quality, User Manual
in near future, but you can in the mean time use the alternative of specifying times inYYDDDHH format for a maximum of 231 seconds = slightly over 68 years. You must give atimer string for both the system timer and for the auxiliary (processes) timer. Your choicewill hold for the time integers that you specify throughout the complete input file.The times that you specify this way are in system time units. If you want to know wherethey are located on the calendar, then you have to add them to the reference time asmentioned in the reference time string. Please be aware that D-Water Quality assumes365 days within one year of its system time units. The specification in system time unitscan thus mean a shift of a day per 4 years in the date and time that may be printed. Thiscan be avoided. At many locations in the D-Water Quality input file you can alternativelyprovide a calendar string instead of an integer. This only works if you also did specify areference time. D-Water Quality will then subtract the reference time and date from yourspecified time and date and use the result in seconds as the system time of you input.The following strings are valid timer strings:
� DDHHMMSS� ddhhmmss� YYDDDHH� yydddhh� ' '
The blank character indicates that just the system timer is used. If one timer string wasset to DDHHMMSS, then only ' ' or DDHHMMSS are allowed for the other string. If one timerstring was set to YYDDDHH, then only ' ' or YYDDDHH are allowed for the other string. Soif both timer strings are not blank, they should be equal.
2.2 Integration procedure
The integration procedure consists of an integer. There are at the moment 23 integrationprocedures, so the number will run from 1 to 23. The D-Water Quality user manual indicatesthe technical specification of the integration procedures.In older input files you may see the integration number be followed by a period and 1, 2 or 3digits behind the period. The information behind the period indicated settings for keywords nr.1 - 6 of table 2.1. It is advised to use those keywords furthermore, although the 3 digits arestill supported. If you want to backtrack the used options in an older file, then the followingrule applies:
� if the first digit after the period
� is 0, then none of the first three keywords is set.� is 1, then the first keyword is set.� is 2, then the second keyword is set.� is 3, then first and second keywords are set.� is 4, then the third keyword is set.� is 5, then first and third keywords are set.� is 6, then second and third keywords are set.� is 7, then all three first keywords are set.
� if there are second and/or third digits after the period then, if they both:
� form 01, then the fourth keyword is set.� form 11 or 20, then fourth and fifth keyword is set.� form 30, then fourth, fifth and sixth keywords are set.
12 of 90 Deltares

DRAFT
Timers, integration, monitoring
2.3 Optional keywords
At this location a number of optional keywords are supported. They are listed in table 2.1.
Deltares 13 of 90

DRAFT
D-Water Quality, User Manual
Table 2.1: Supported keyword steered options in the D-Water Quality input processor
Number Keyword Description
1 NODISP-AT-NOFLOW No dispersion at zero flowDISP-AT-NOFLOWa Useful to prevent dispersive fluxes towards dry
cells and to prevent dispersion through thindams.
2 NODISP-AT-BOUND No dispersion across open boundariesDISP-AT-BOUNDa Ensures a flux of concentration times flow at
boundaries without additional dispersion term.
3 LOWER-ORDER-AT-BOUND No flux correction at boundariesHIGHER-ORDER-AT-BOUNDa Only relevant for higher order schemes,very
advisable.
4 BALANCES-OLD-STYLE Set balances to onNO-BALANCESa This triggers the output of balance information.
5 BALANCES-GPP-STYLE writes GPP style balancesSwitches the SOBEK balances off.
6 BALANCES-SOBEK-STYLE writes SOBEK style balancesSwitches also the GPP balances on.
7 FORESTER Switches the Forester monotony filter onNO-FORESTERa Only of relevance for schemes with central dif-
ferences in the vertical.
8 ANTICREEP Prevents artificial creep by diffusionNO-ANTICREEPa Only relevant with integration types 19 or 20
and sigma coordinates.
9 BAL_NOLUMPPROCESSES Distinguishes all processes separatelyBAL_LUMPPROCESSESa Show all processes separately in the
balances.
10 BAL_NOLUMPLOADS Distinguishes all waste loads separatelyBAL_LUMPLOADSa Show all waste loads separately in the
balances.
11 BAL_NOLUMPTRANSPORT Distinguishes fluxes separatelyBAL_LUMPTRANSPORTa Show dispersive and advective fluxes sepa-
rately in the balances.
12 BAL_UNITAREA Makes balances per m2
13 BAL_UNITVOLUME Makes balances per m3
14 BAL_NOSUPPRESSSPACE To be documented.BAL_SUPPRESSSPACE1
1this is the default
14 of 90 Deltares

DRAFT
Timers, integration, monitoring
Number Keyword Description
15 BAL_NOSUPPRESSTIME To be documented.BAL_SUPPRESSTIMEa
16 SCHEME15_UNSTRUCTURED 3rd dimension not treated as layeredSCHEME15_STRUCTUREDa Also iterates the 3D model dimension rather
than a simple double sweep inversion.
17 ANTIDIFFUSION Option of scheme 21 and 22NO-ANTIDIFFUSIONa To be documented.
18 PARTICLE_TRACKING2 Particle tracking within D-Water Quality
From the table 2.1 it can be seen that often also the negations are generally recognized. Theyare of less importance, because they are the default setting. You may use as many of thekeywords mentioned as you need and their order of appearance is generally not important.Keywords 4, 5 and 6 are mutually exclusive like the two keywords that negate each other. Insuch a situation the last of the mutually exclusive keywords prevails.
2.3.1 Particle tracking
The PARTICLE_TRACKING functionality requires a filename as additional information. The file-name should be the name of the so-called<∗.mdp> file that is described in the D-Waq PARTmanual. The steps to be set to incorporate particle tracking into Delwaq are the following:
1 You set up a particle tracking simulation according to the specifications of the D-WaqPART manual. This simulation is invoked either by the user interface or manually by youfrom the command line by the instruction delpar.exe my-input-file.mdp. You inspect thissimulation for correct behavior.
2 You set up a D-Water Quality simulation and you take care that:
� You are using exactly the same hydrodynamic input files as you used for the particletracking simulation.
� You are using exactly the same start time and stop time of simulation as you used forthe particle tracking simulation.
� You are using exactly the same integration time step size as you used for the particletracking simulation.
The interface between D-Water Quality and D-Waq PART will check this and produce errormessages if one or more of the mentioned conditions are not fulfilled.
3 You enter the PARTICLE_TRACKING keyword followed by the name of your <.mdp> file inthe D-Water Quality input file. You will then note that D-Water Quality reads the particleinput information and adds the D-Waq PART substances as passive substances to theD-Water Quality simulation. You will also note that the remainder of the D-Water Qualityinput file can remain the same until the specification of the initial conditions.
4 You insert initial condition values for all D-Waq PART substances in group 8 of the D-WaterQuality input file. The most obvious value to enter is 0.0 here.
You will note that you can now run a joint D-Water Quality and D-Waq PART simulation. Youwill also note that the D-Waq PART substances appear in the monitoring file, the<.map> file
2upcoming functionality
Deltares 15 of 90
DRAFT
D-Water Quality, User Manual
and the <.his> file. Moreover, the D-Water Quality model concentrations are now availableto the D-Waq PART simulation and the D-Waq PART model concentrations are available tothe D-Water Quality water quality processes.You may wonder why you should model some substances with a particle tracking model andother substances with a Finite volume advection- diffusion solver in D-Water Quality. Thereason is that the grid cell, the Finite Volume, is the smallest unit that D-Water Quality distin-guishes. If you are using a grid that is not so fine, then point sources will spread immediatelyover the grid cell, whereas in reality it might take up to a day before an initially released patchof dye has grown sufficiently large that the Finite Volume ADE solver can take over the com-putation of the result. To avoid an unrealistic initial spreading you may consider to model theinitial spreading process using the particle tracking option and continue the modeling after-wards using the Finite Volume solver. For this aim the D-Water Quality take over time or delaytime that was mentioned in the D-Waq PART manual as ”no longer being supported“ is revivedagain. That works as follows:
� If you name a substance in the D-Waq PART part of the simulation exactly identical to acorresponding substance in the D-Water Quality part of the simulation, but with an addi-tional ’p’ just behind the D-Water Quality name, then the interface between both knowsthat these two substances belong to each other.
� If you specify a D-Water Quality take over time, generally in the orde of 1 day, in the D-WaqPART input file, then all particles that did stay longer than the specified take over time spanin D-Waq PART are removed from the D-Waq PART simulation and are migrated towardsthe D-Water Quality simulation as a contribution to the concentration in the grid cell wherethey were. D-Water Quality will transport this mass further with its Finite Volume solvers.
� If you add both results, you will see the advantage of the efficient and robust mid-field andfar-field modeling with D-Water Quality and you will note the sub grid patch and concen-tration patterns that are modeled with D-Waq PART for the initial period just after release.
This is just one example of the benefits of the joint simulation of D-Water Quality and D-WaqPART. Other examples are:
� model spilled oil patches with D-Waq PART and let the entrained and emulgated oil migratefrom the D-Waq PART side to the D-Water Quality side and use the results there to identifythe exposure of sensitive receivers like fish and coral reefs to the dispersed oil fractions.
� use the D-Waq PART ’time in the system’ variable per particle to determine the shift fromfish eggs to larvae and juvenile species and let the thus modeled species get their foodfrom the concentration of algae, zooplankton or other particulate organic carbon that ismodeled by D-Water Quality.
2.4 Integration timers
The D-Water Quality input processor now expects the integration timers:
� The start time of integration� The stop time of integration
The start and stop times can either appear as an integer in system units or in DDHHMMSSstyle or in YYDDDHH style. This is then taken as the time in system units after the calendaroffset string if that was present.Alternatively the start and stop times can be specified as a calendar time string e.g:
2010/07/31-12:00:00
Please be aware that an error is generated even if you only use other separation charac-ters between the digits of the date. The parser is very strict.
� The time step option switch.There are 2 values allowed:
16 of 90 Deltares

DRAFT
Timers, integration, monitoring
0 indicating a constant time step size1 indicating a time varying time step size
� The information on the time step of the integration
� In the case of a constant, an integer is required in system units or in DDHHMMSS styleor in YYDDDHH style.
� In the case of a time series the following information is expected:
◦ A positive integer indication the number of time function breakpoints◦ That many pairs of time integers. The first is the breakpoint time and the second
is the size of the time step at that breakpoint. The 2 integers are either in units ofthe system clock or in DDHHMMSS style or in YYDDDHH style.
The breakpoint times should be positive and in increasing order. At the breakpointtime the time step size changes to the value that was specified for the breakpoint. It isthe responsibility of the user to choose the breakpoint times such that it is clear whenthe time step size changes (the prescribed time may not be the start time of a newtime step) and to specify time step values in such a way that the output times, that arespecified later on, do not conflict with the way this time series is established.Because of these associated problems, a variable time step size is hardly used inD-Water Quality but it should work correctly.
2.5 Monitoring locations and monitoring transects
Once D-Water Quality produces concentrations of substances throughout the area, flexibleways for presentation of these results are required. One way is to make time series, generallywith high frequency, of the values at a certain location or through a certain transect. Inputrequired is:
� the integer total number of monitoring areasMonitoring locations can consist of a group of computational volumes, a so called moni-toring area. The single monitoring location consisting of a single grid-cell is just a specialcase of the general monitoring area. Furthermore, if the output of balances was selectedfor the model, then they are automatically produced for all monitoring areas, unless ex-plicitly switched off for specific areas.If the number of monitoring areas is non zero, then that many sets of the following infor-mation is expected:
� a string with a meaningful name of the monitoring area. This string should be uniqueand if ' ' is provided, D-Water Quality makes Observation-idnnn as name.
� an optional string NO_BALANCE to indicate that this area should be excluded from thebalances output.
� the integer number of volumes that form together this monitoring area.� That many integer sequence numbers of the computational volumes that form together
this area.
Note: The DIDO grid manipulation tool of the Graphical User Interface is able to makeASCII files with monitoring areas that can directly be included into the D-Water Qualityinput file. You may need to edit the file because it is using # as comment character whileyou may use ;.Note: A special feature is the "moving monitoring point" for which the location is not fixedin time. The monitoring point can be used to compare model data with moving measure-ment devices like drifters or vessels sailing a trajectory. This is a single segment obser-vation point with a name starting with "MOVING", if there exists a function (see processparameters) with exactly the same name then the segment number of the observationpoint will be set with the value of the function evaluated at the current time. The value of
Deltares 17 of 90

DRAFT
D-Water Quality, User Manual
the function is the segment number. Since the value is discrete one should use only blockfunctions to specify a moving monitoring point. If there is no observation for a certain pe-riod a value of 0 can be specified. For this period the output of the moving monitoring pointwill be a missing value. The segment number in the specification of the monitoring pointshould be given but is not used. To create a list of segment numbers from coordinatesis not trivial. Fortran code is available to create the function from coordinates for Delft3Dkind of grids.Example of a function to specify a moving monitoring point called MOVING_Ferrybox:FUNCTIONS MOVING_FerryboxBLOCK DATA2012/01/01-00:00:00 02012/01/22-08:24:00 22072012/01/22-08:25:00 22062012/01/22-08:26:00 2206......2012/01/22-18:21:00 20912012/01/22-18:22:00 02013/01/01-00:00:00 0
� the integer total number of monitoring transectsThe input processing also allows for the specification of monitoring transects. A transectconsists of a number of interface areas between computational volumes.If the number is monitoring transects is non zero then that many sets of the followinginformation is expected:
� a string with a meaningful name of the monitoring transect. This string should beunique and if ' ' is provided, D-Water Quality makes Transect-idnnnnnn as name.
� an integer option number to indicate how the transect information should be accumu-lated. This option number can have one of three values:
1 the net fluxes will be displayed for the transect.2 only the sum of the positive fluxes through the transect will be displayed.3 only the sum of the negative fluxes through the transect will be displayed.
The sign of the flux is relative to the ’from-’ and ’to-’ segment number of the exchange.To have both the positive and the negative fluxes displayed, mention the transect twice,once for the positive and once for the negative fluxes.
� the integer number of exchange surfaces that together form this monitoring transect.� That many integer sequence numbers of the exchange surfaces that form this transect.
Note: Unfortunately the DIDO grid manipulation tool does not support monitoring tran-sects. This may make it very tedious to specify transects, because you have no easyaccess to the values of the numbers of the interfaces between the different computationalvolumes if they are produced by a hydrodynamic model.
2.6 Output timers
D-Water Quality has 3 output timers:
1 monitoring timerThe monitoring timer is used to write the monitoring file. The monitoring is a readibleASCII file that contains all relevant run-time messages and simulation result summariesincluding area-wide mass balances. If detail balances have been switched on, then themonitoring file also contains detail balance information. The monitoring timer indicates thestart time, stop time and time step to be used for these summary statistics and readiblebalance information.
2 map-file timerThe map-file timer steers the start time, stop time and time step of the binary map file.
18 of 90 Deltares

DRAFT
Timers, integration, monitoring
This file contains all desired output on the complete model grid. This can become largeand that is why there is a separate map-file timer.
3 history timerThe history file also is a binary output file but only at the selected monitoring locations.That is why the history timer is generally selected to be more frequent than the ASCIImonitoring
Each timer consists of 3 timer entries:
1 a start timeThis can be an integer or a valid calendar time string
2 a stop timeThis can be an integer or a valid calendar time string
3 a time stepThis can only be an integer
It is the responsibility of the user to ensure that the output timers coincide with an integermultiple since start of simulation of the least common multiple of all transport and water qualitytime steps that are used. This is an integer multiple of the transport time step if that is usedalso for water quality. If (some) water quality processes are computed with a longer time step,then it is an integer multiple of the longer time step.
2.7 Finalization
This part of the input file is finalized with the #2 end of second data group indicator.
Deltares 19 of 90

DRAFT
D-Water Quality, User Manual
20 of 90 Deltares
DRAFT
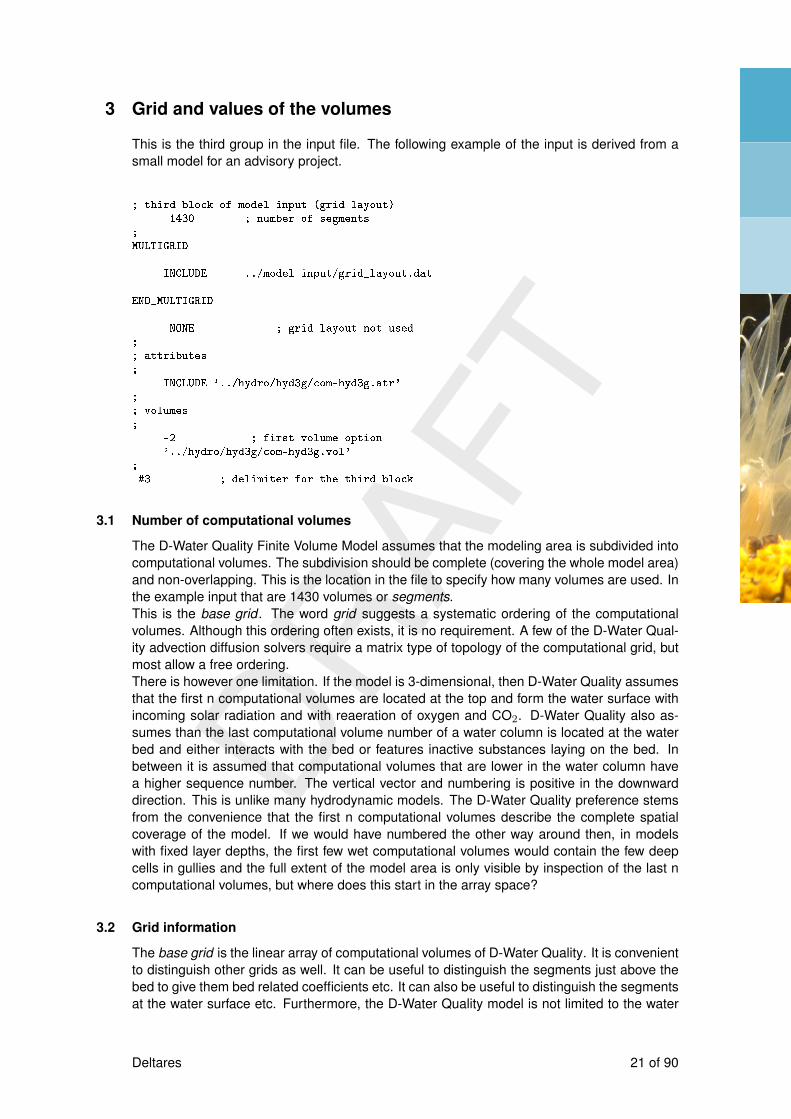
3 Grid and values of the volumes
This is the third group in the input file. The following example of the input is derived from asmall model for an advisory project.
; third block of model input (grid layout)1430 ; number of segments
;MULTIGRID
INCLUDE ../model-input/grid_layout.dat
END_MULTIGRID
NONE ; grid layout not used;; attributes;
INCLUDE '../hydro/hyd3g/com-hyd3g.atr';; volumes;
-2 ; first volume option'../hydro/hyd3g/com-hyd3g.vol'
;#3 ; delimiter for the third block
3.1 Number of computational volumes
The D-Water Quality Finite Volume Model assumes that the modeling area is subdivided intocomputational volumes. The subdivision should be complete (covering the whole model area)and non-overlapping. This is the location in the file to specify how many volumes are used. Inthe example input that are 1430 volumes or segments.This is the base grid . The word grid suggests a systematic ordering of the computationalvolumes. Although this ordering often exists, it is no requirement. A few of the D-Water Qual-ity advection diffusion solvers require a matrix type of topology of the computational grid, butmost allow a free ordering.There is however one limitation. If the model is 3-dimensional, then D-Water Quality assumesthat the first n computational volumes are located at the top and form the water surface withincoming solar radiation and with reaeration of oxygen and CO2. D-Water Quality also as-sumes than the last computational volume number of a water column is located at the waterbed and either interacts with the bed or features inactive substances laying on the bed. Inbetween it is assumed that computational volumes that are lower in the water column havea higher sequence number. The vertical vector and numbering is positive in the downwarddirection. This is unlike many hydrodynamic models. The D-Water Quality preference stemsfrom the convenience that the first n computational volumes describe the complete spatialcoverage of the model. If we would have numbered the other way around then, in modelswith fixed layer depths, the first few wet computational volumes would contain the few deepcells in gullies and the full extent of the model area is only visible by inspection of the last ncomputational volumes, but where does this start in the array space?
3.2 Grid information
The base grid is the linear array of computational volumes of D-Water Quality. It is convenientto distinguish other grids as well. It can be useful to distinguish the segments just above thebed to give them bed related coefficients etc. It can also be useful to distinguish the segmentsat the water surface etc. Furthermore, the D-Water Quality model is not limited to the water
Deltares 21 of 90
DRAFT
D-Water Quality, User Manual
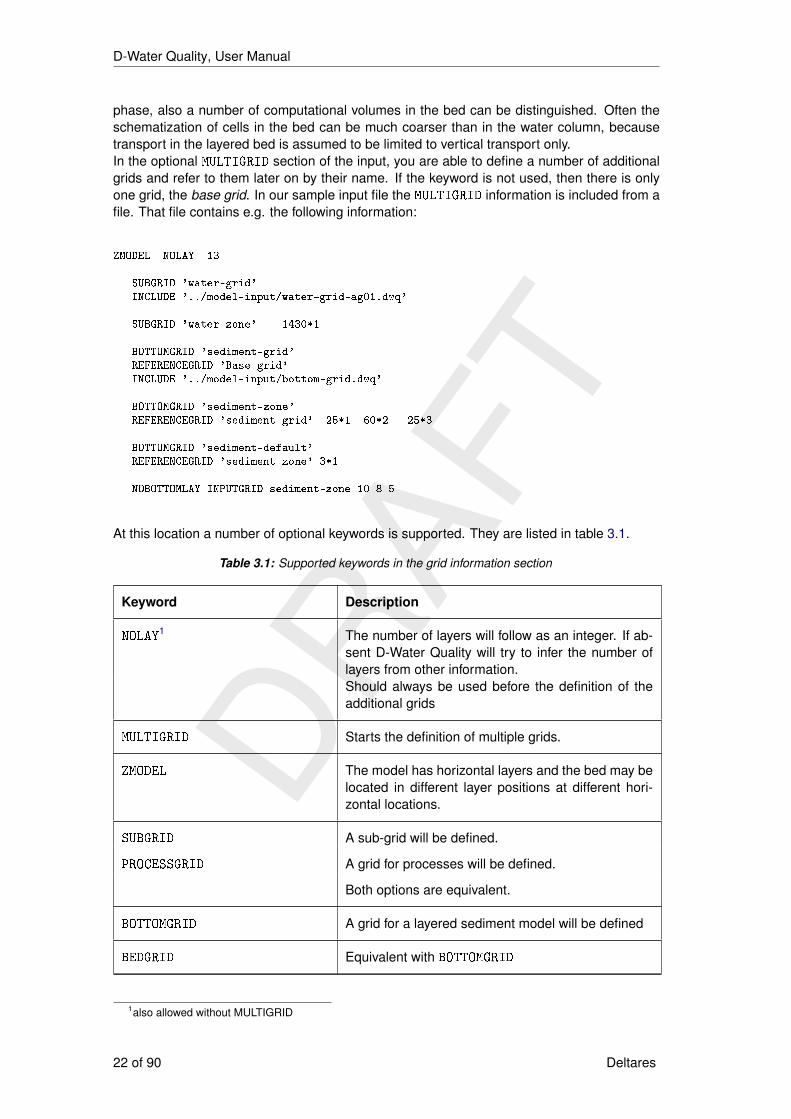
phase, also a number of computational volumes in the bed can be distinguished. Often theschematization of cells in the bed can be much coarser than in the water column, becausetransport in the layered bed is assumed to be limited to vertical transport only.In the optional MULTIGRID section of the input, you are able to define a number of additionalgrids and refer to them later on by their name. If the keyword is not used, then there is onlyone grid, the base grid. In our sample input file the MULTIGRID information is included from afile. That file contains e.g. the following information:
ZMODEL NOLAY 13
SUBGRID 'water-grid'INCLUDE '../model-input/water-grid-ag01.dwq'
SUBGRID 'water-zone' 1430*1
BOTTOMGRID 'sediment-grid'REFERENCEGRID 'Base grid'INCLUDE '../model-input/bottom-grid.dwq'
BOTTOMGRID 'sediment-zone'REFERENCEGRID 'sediment-grid' 25*1 60*2 25*3
BOTTOMGRID 'sediment-default'REFERENCEGRID 'sediment-zone' 3*1
NOBOTTOMLAY INPUTGRID sediment-zone 10 8 5
At this location a number of optional keywords is supported. They are listed in table 3.1.
Table 3.1: Supported keywords in the grid information section
Keyword Description
NOLAY1 The number of layers will follow as an integer. If ab-sent D-Water Quality will try to infer the number oflayers from other information.Should always be used before the definition of theadditional grids
MULTIGRID Starts the definition of multiple grids.
ZMODEL The model has horizontal layers and the bed may belocated in different layer positions at different hori-zontal locations.
SUBGRID A sub-grid will be defined.
PROCESSGRID A grid for processes will be defined.
Both options are equivalent.
BOTTOMGRID A grid for a layered sediment model will be defined
BEDGRID Equivalent with BOTTOMGRID
1also allowed without MULTIGRID
22 of 90 Deltares

DRAFT
Grid and values of the volumes
Keyword Description
NOBOTTOMLAY The number of bed-layers will be read
SUBSTANCE_PROCESSGRID A grid for substances and processes will be read
PROCESS_TIMESTEP_MULTIPLIER A process time step multiplier will be read
END_MULTIGRID Ends the definition of multiple grids
In the sample input file the model is defined to be a z-layer model, so it has horizontal layersat fixed depth. The number of layers is given as 13. It could be possible that D-Water Qualityis able to identify the number of layers from its own, since the layers are full in this case (13layers of 110 cells each). To avoid unambiguity it is good to define the number of layers here.Then 5 different grids are defined. Finally the numbers of layers in the bed are defined.
3.2.1 Definition of a grid
The definition of grids for different application (sub-grid, bed-grid, substance_process-grid) isbasically the same. The new grid should have a grid where it bases on. This means that thefirst additional grid that is defined (the ”water-grid“ in this case) always clones the base grid.The grid definition then gives a sequence number to each grid cell entry of the grid that itclones. In our example the base grid has 1430 computational volumes. So a grid definitionconsists of 1430 numbers that tell how the new grid is mapped on the old grid. This meansthat the new grid may be coarser than the old grid (have less cells, so the highest cell numberthen is lower than 1430 in our case), but can never be finer. Given the hydrodynamic gridas the base grid, the DIDO grid manipulation tool of the Graphical User Interface is able tomake ASCII aggregation files that can directly be used in the D-Water Quality input file as gridmapping. You may need to edit the file because it is using # as comment character while youmay use ;.To define new grids, the following information is expected in exactly this order:
� A unique string with the name / ID of the additional gridindexGrid!ID that is created� One of the following optional keywords:
� NOLAY followed by an integer.This specifies the number of layers in the grid that is created. If absent, D-WaterQuality assumes that the new grid has as much layers as the grid it is referring to.
� REFERENCEGRID followed by an ID of an already created grid.The new grid will clone this reference grid. If absent the base grid will be used as thereference grid for this new grid.
� The mapping data from the reference grid to the newly created grid in one of the followingways:
� AGGREGATIONFILE followed by a DIDO aggregation file name.The DIDO file maps the reference grid towards this new grid. Because DIDO works onthe hydrodynamic grid, the reference grid in this case will almost always be the basegrid. Since DIDO only works on one layer, it will only contain the aggregation of onelayer.
� as many integers as the reference grid has computational cells, each indicating thecell number of the newly created grid that is containing the corresponding cell of thereference grid.
Deltares 23 of 90

DRAFT
D-Water Quality, User Manual
In our mentioned example the grid definition section defines the:
� water-gridusing an include file that just contains the numbers 1 to 1430 and is thus an exact copy ofthe grid in the water phase.
� water-zoneusing 1430 times the number 1. So this grid has only 1 grid cell that contains all of thecomputational volumes of the water phase.
� sediment-gridalso using 1430 numbers. The mentioning of the reference grid is superfluous because itis the base grid that is also the default reference grid. The 1430 numbers are mostly zero(for the water phase) and 110 of them have sequence numbers for the sediment columnsthat will be located underneath the corresponding water cell.
� sediment-zoneThis grid refers to the just created sediment-grid and thus has 110 entries in our exam-ple. The first 25 are all 1, the next 60 are all 2 and the last 25 are all 3. This indicatesthat this grid has 3 cells, containing all cells with a sediment column. This grid has madea zonation of the sediment collumns into 3 zones.
� sediment-defaultThis grid refers to the just created sediment-zone and thus contains 3 entries, all being1. So this grid has only 1 cell.
We have defined 3 BOTTOMGRID grids. That is a bit much since there is only one real bottomgrid. The D-Water Quality input processor assumes that the first time a BOTTOMGRID is de-fined, that this grid should be considered as the bottom grid. It also tells so in output warningstatements. In our example this is the sediment-grid with its 110 cells, so one bed-columnunderneath each water column.
3.3 NOBOTTOMLAY keyword
Now we have to specify the number of sediment layers in the bed. This is done in one of thefollowing ways:
� the DEFAULT keywordThis keyword should be followed by an integer indicating the amount of sediment layersthat will be distinguished. This amount of sediment layers will appear underneath thewater at all of the locations of the bottom grid.
� the INPUTGRID keywordThis keyword should be followed by an existing grid name / ID.Then an amount of integer values should follow, equal to the number of grid cells in theselected input grid. Each value tells D-Water Quality that that sediment column of thatgrid cell has as many layers as that integer amounts. In our example we mentioned thesediment-zone grid as the input grid. In this way the cells from the bottom grid have beengrouped in zones, that each have an equal amount of sediment layers. In our example thezone 1 has 10 sediment layers, zone 2 has 8 sediment layers and zone 3 has 5 sedimentlayers. What D-Water Quality will do is the following:
� All cells of the INPUTGRID (3 on our case) get there value (10, 8 and 5 in our case)� Because the input grid is not the bottom grid (that is the sediment-grid in our case),
the grid that is used as reference grid of the INPUTGRID get their values (all 110 in ourcase) based on the mapping process of the input grid on to the reference grid of thatgrid.
� This procedure continues until the bottom grid is reached and then the procedurestops. So this allows also for nested zonations, that could be useful for different rea-sons.
24 of 90 Deltares

DRAFT
Grid and values of the volumes
This construction allows an easy way to:
� define the number of layers in the sediment columns for the bottom grid :use the bottom grid as INPUTGRID
� define the number of layers per zone of the bottom grid :use the sediment-zone grid as INPUTGRID
� define the number of layers equal for the whole area:use the sediment-default grid as INPUTGRID, or directly use the DEFAULT keyword.
� the ALL keywordThis directly reads all values for the bottom grid, so it is equivalent with using the bottomgrid as INPUTGRID
Note: that it is easy to create the sediment zonation using the DIDO-ASCII aggregation fileswith a graphical user interface. Once the zonation has been done, you can easily specifyfor each zone a separate value by using the zoned grid as input grid. We will meet thatconstruction also later on in the input file where process constants and other process variablesand where initial conditions have to be set, depending on a certain zonation of the model area.
3.4 SUBSTANCE_PROCESSGRID keyword
This keyword has to do with the process decomposition features in D-Water Quality. It ispossible to compute a subset of the substances on a coarser grid than on the base grid of theD-Water Quality simulation. This option will
� transport the selected substances on the finer base grid� at the time the processes should work those substances are averaged to the coarser grid� the processes will be conducted on the coarser grid� the resulting mass on the coarser grid will be subdivided over the finer base grid using
their proportional weighting before the process step� next transport step(s) will be set on the finer grid
This option is especially valuable if the water quality kinetics are expensive to compute andif they can be grouped into model zones that more-or-less behave identical with respect tothe water quality processes. The aggregation and disaggregation steps are fully mass con-serving, so the whole procedure remains fully mass conserving and the substances remaintransported on the finer base grid.The procedure is triggered by the SUBSTANCE_PROCESSGRID keyword. Then one of the fol-lowing options should come:
� the ALL keywordThis indicates that all substances will get their processes evaluated on the grid that will beselected.
� a list of substance IDsThis will select the indicated substances to operate on the grid that will be selected.
Finally the ID of an already earlier defined grid should follow. This will make the selectedsubstances to get their process kinetics on the coarseness of the selected grid. Again, it iseasy to create a zonation of the grid for this aim, using the Graphical User Interface and theDIDO tool.
Deltares 25 of 90
DRAFT
D-Water Quality, User Manual
3.5 PROCESS_TIMESTEP_MULTIPLIER keyword
This keyword has to do with the process decomposition features in D-Water Quality. It ispossible to compute a subset of the substances with coarser time steps than the selectedtransport time steps of the D-Water Quality simulation. This option will
� transport the selected substances on the finer transport timer� at the time the processes on the substances should work, they are invoked� next transport steps will be set on the finer transport time scale and so on.
This option is especially valuable if the water quality kinetics are expensive to compute andif they can be grouped to joint coarser time steps. There is also a reverse reason for usingthis procedure. It can be required to model the transport of substances with a relatively finetime step of say 10 seconds to preserve accuracy of spatial transport patterns. Water qualityprocesses can however easily be evaluated every half hour. This option does that job.
� The procedure is triggered by the PROCESS_TIMESTEP_MULTIPLIER keyword.� Then one out of the following two options should come:
� the ALL keywordThis indicates that all substances will get their processes evaluated on the coarsertime step.
� a list of substance IDsThis will select the indicated substances to operate on the coarser time step.
� Finally an integer should follow that specifies the selected multiplier on the transport timestep for the selected
D-Water Quality automatically sets the time step of the processes that act on the mentionedsubstances to the required time step for the substances. The default multiplier for the notmentioned substances is 1. This may lead to inconsistencies if the process acts betweentwo substances that have different time step multiplier. These inconsistencies have beendealt with for the two most commonly applied sets of substances on different time scales, theBLOOM module for algae species competition and the CHARON module for equilibrium chemistryminimizing Gibbs free energy. Their time step size will overwrite any specified time stepmutiplier of this section. It is generally safe to choose for all modelled substances a time stepmultiplier that is the same, e.g. 30 if you would want to model water quality with time stepsof half an hour and transport of substances with 1 minute. A common time step size for theBLOOM algae competition process is 1 day.
3.6 Printed grid layout
It is often useful for models on a detail schematization, to inspect the behavior in certain areasin more detail. D-Water Quality allows you to specify a lay-out of grid numbers. If you do so,concentration and other output are produced in an ASCII output file exactly in the order ofappearance in the specified grid layout. D-Water Quality uses the monitoring timer to producethis output. You may inspect gradients by specifying a printed grid output for a number ofnearby computational volumes. If you see artifacts in the model output, you can analyze thelikely reason for them to appear.Where is which computational volume located? That can be inspected in 2 ways. One isusing the DIDO tool. It shows the horizontal grid and allows you to inspect cell indices andcell numbers. Another one is using one of the standard graphical post-processing options andplot the grid only. You are then able by point and click to see grid cell numbers and indices atcertain locations.Specification of a printed grid layout starts with telling D-Water Quality where the grid comes
26 of 90 Deltares

DRAFT
Grid and values of the volumes
from by one of the following:
� The keyword NONE, indicating that no printed grid will be used.� The integer ’-1’ followed by an ASCII file name indicating where the description can be
found. This option is the outdated equivalent of the present INCLUDE option.� The integer ’0’ followed by a file name of a binary file that will contain the layout of grid
cells.� The integer ’1’ indication that information will follow in this file.� The integer ’2’ that is the outdated equivalent of the NONE keyword.
For the options ’-1’, ’0’ and ’1’ two integers should follow:
� nxAn integer specifying the horizontal amount of grid cells to be printed. If a zero is specified,the printed grid layout will NOT be used. If a positive integer is specified, lines with thatmany values (of 15 positions each) will be produced in the output file.
� nyAn integer specifying the vertical amount of grid cells to be printed. If nx was non zeroand ny is zero, then printed output is NOT used.
For options ’-1’ and ’1’ the following follows in the ASCII file, for option ’0’ in the binary file.
� ny lines with nx integersThe integers refer to the sequence numbers of the computational volumes. A zero in-dicates that a blank field should appear at that location in the printed grid. The samesegment number may appear multiple times in the matrix.
1 ; grid layout in this file8 6 ; the nx and ny values
212 213 214 0 0 0 0 0 ; the grid306 307 308 0 0 0 0 313400 401 0 0 0 405 406 407494 495 496 497 498 499 500 501588 589 590 591 592 593 594 595682 683 684 685 686 687 688 689
is a valid specification of a printed grid layout.
3.7 Properties or attributes of computational volumes
For D-Water Quality each computational volume is equal. They are connected with each otherthrough their joint interfaces and feature transport from one volume to the other through thoseinterfaces. For the water quality processes some computational volumes are more equalthan others. Some may be located at the water surface in a 3-dimensional model set-up andthus have reaeration of oxygen and CO2 at the water surface. Others may be located at thebed and may have sediments underneath, with associated sediment processes. These aregenerally fixed properties, although the property “has a water surface” may change duringthe simulation with the water level in models with fixed Z-layer depths. Besides the fixedproperties there may also time variable properties be specified through the D-Water Qualityinput processor. This however is seldom done and if done it is probably most useful to letthem be created by a hydrodynamic model as e.g. in the case of drying and flooding in amodel featuring tidal flats.This section describes the specification of the currently implemented properties in D-WaterQuality. It is possible to specify additional properties in the same way and to use them in yourown process routines. There is however a caution: in later versions of D-Water Quality we
Deltares 27 of 90

DRAFT
D-Water Quality, User Manual
may use the property number that you also are using. In that case you would not be able tofollow our upgrades. You can minimize that risk by using property numbers that have a higherindex number than the current maximum, because we tend to number them sequentially.Furthermore standard D-Water Quality property numbers are likely to come with a frequencyof 1 per decade, so the risks are not high. The properties are stored as decimal entries in a32 bits integer. That means that the current maximum of properties is 9 and that the range ofproperty values for all properties is from 0 to 9. The presently implemented 4 properties aregiven in table 3.2.
Table 3.2: Properties of D-Water Quality computational volumes
number values property
1 0 Volume is not part of the model (dry, land etc.)1 Volume is part of the active grid
2 0 Volume is both at top and at bottom of the water column.This holds for all volumes of a depth averaged model.
1 Volume is at top of the water column2 Volume is neither at top nor at bottom of the water column3 Volume is at the bottom of the water column
3 ? Unknown functionality associated with GEM
4 n Ownership table used for parallel computing
If the first attribute is not set, then D-Water Quality sets it at the default value of 1 for thewhole model area. If the second attribute is not set, then D-Water Quality sets it to 0 (depthaveraged cells) for the whole model area.
3.7.1 Constant attributes
The following input structure applies:
� number of blocks of inputIf zero, no further input is accepted for constant attributes.
� that many sets of:
� number of properties in this block� the property numbers of these attributes� one out of 3 possibilities:
◦ the BINARY_FILE keyword and a sting with the file name.This option expects a binary file with for each computational volume an integerindicating the property(s) for this grid cell.
◦ the DEFAULTS keyword
. the default property value that will be used for all cells
. the number of overridings
. that many pairs of a segment number and the property value to be used forthat segment / volume
◦ the direct specification of all properties of the computational volumes in the orderof their segment number.
28 of 90 Deltares

DRAFT
Grid and values of the volumes
At the moment only the properties 1 and 2 are generally provided through the input file. Sothe choice is providing them separately or providing only one of them on the one hand orproviding them jointly on the other hand. Joint properties may look like:
� 00 for inactive cells outside of the computation� 01 for active cells in a depth averaged model� 11 for cells at the water surface of a 3D model� 31 for cells at the bed of a 3D model� 21 for cells somewhere between the bed and the water surface
In general the hydrodynamic models with a supported interface with D-Water Quality all pro-duce the required property information in a file that can just be included in D-Water Qualityinput processing without further adjustments by the user. The user may edit this file if the wa-ter quality processes in almost dry cells require that these cells are manually excluded fromthe computation. Then changing of the property of those cells to zero will do to xclude thecells.
3.7.2 Time variable attributes
The following input structure applies:
� the number of time variable properties.If zero, no further input is accepted for time variable attributes.
� the property numbers of these attributes� the name of a binary file that contains these properties as a time series.
3.8 Segment volumes
D-Water Quality needs a mass conserving hydrodynamic set of volumes and flows. Theseform the coefficients in the advection equation. The diffusions, the interface areas and thecharacteristic distances between the volumes form a second set of coefficients, they completethe input for the advection - diffusion equation. It could be well argued to locate all of this inputinto one input group. That is done, they are in input group 4. For historical reasons there ishowever one exception and that are the volume values of the segments / computational cells.They are contained in this group 3. Volumes distinguish themselves from other hydrodynamicinput in a number of ways:
� There are as many volume values as there are volumes. This number is called NOSEGand is equal to the amount of active cells in the base grid. The other hydrodynamic inputhas as dimension the number of exchange surfaces between volumes. This dimension iscalled NOQ. For 1-dimensional models NOQ is generally of the same order (but generallynot equal to) NOSEG. In 2 dimensional models NOQ is generally about 2 times NOSEG and in3-dimensional models about 3 times NOSEG.
� The volumes are given at certain times. They give the exact volumetric value at that time.All other hydrodynamic input describe the average value of the coefficients during the timestep. By convention the time stamp of the records of the other coefficients is the start timeof the time step of their functioning, that runs from that value to the time stamp of the nextrecord.
� D-Water Quality can compute with time steps that are smaller than the time steps in thehydrodynamic files. Those time steps are then subdivided. To ensure mass conservationthe volumes in between two time stamps are interpolated. Because the other hydrody-namic information is assumed to count for the whole time step, they are not interpolatedbut taken constant during the hydrodynamic time step. This procedure is furthermorecalled a block function contrary to the linear interpolated volume function.
Deltares 29 of 90

DRAFT
D-Water Quality, User Manual
The volumes are read through the standard input procedure for hydrodynamic data that isdescribed in the Annexes. Per computational volume (or segment) one value is read. Onescale value applies. As seen from the sample input file at the start of this chapter, this part ofthe input is most commonly limited to ’-2’ and the name of the volumes file that was generatedby the hydrodynamic model. Also input of ’-4’ and the name of a MULTIPLE_HYD file is regularlyused. Be aware that the amount of values that is expected per time step is exactly equal toNOSEG, the number of active cells in the base grid. The value of the time token of each recordin the time varying setting should be consistent with the integration timers and output timers.
3.9 Finalization
This part of the input file is finalized with the #3 end of third data group indicator.
30 of 90 Deltares

DRAFT
4 Hydrodynamic data
This is the fourth group in the input file. This group may read like:
; fourth block of model input (transport)112000 ; number of exchanges in direction 1 (NOQ1)112000 ; number of exchanges in direction 2 (NOQ2)109200 ; number of exchanges in direction 3 (NOQ3)
0 ; number of additional dispersion arrays0 ; number of additional velocity arrays
1 ; first form of the input file structure is used
0 ; exchange pointers come from a binary file'com-Bodensee.poi' ; pointers file
1 ; dispersions follow in this file1.0 1.0 1.0 ; scale factors in 3 directions
1.0e+00 1.0e+00 ; dispersion in 1st and 2nd direction1.0e-07 ; dispersion in 3rd direction
-2 ; areas will be interpolated from a binary file'com-Bodensee.are' ; area file
-2 ; flows will be interpolated from a binary file'com-Bodensee.flo' ; flow file
1 ; spatially varying exchange lengths0 ; lengths come from a binary file
'com-Bodensee.len' ; length file
#4 ; delimiter for the fourth group of input data
4.1 General
Group 3 of the input file already contained information that is associated with the schemati-zation of the model and the water flow. It contained the number of computational volumes /cells / segments (names that are all equivalent). It also contained a description of the input ofthe (time series) of the volumes in m3 for each of these segments. Group 3 also containedinformation on the properties of these cells / segments ( dry or wet, at the top, at the waterbed or in the middle ).In group 4 of the input file this information on model schematization and hydrodynamic infor-mation is continued with flows across the exchanges and other transport related information.Most of the time, hydrodynamic input will be substantial and will be generated by hydrody-namic models. For these situations the input as given in the example at the start of thischapter is typical and it is also the minimal input required. We will run through this exampleinput here to explain the different input items. There are much more additional options perinput item than mentioned in this explanation and they are discussed in detail in the sectionsthat follow in this chapter.
� The number of exchanges in each direction
� This ’Bodensee’ model typically is a model on a structured curvilinear mesh, becauseit has exchange interfaces in three directions. This means that 2 separate horizontaldirections exist. Models with unstructured grid generally have only one total numberof exchanges for direction 1 and zero for the number of exchanges in direction 2.
� It is a 3-dimensional model. Depth averaged models have zero for the number ofexchanges in the third direction.
Deltares 31 of 90

DRAFT
D-Water Quality, User Manual
� The model is apparently using a grid that consists of a full matrix (with many zero’s atlocations in the matrix with dry entries). This can be inferred from the exactly equalnumber of exchanges in both horizontal directions. For models on matrices of gridcells with only the active cells and active exchanges mentioned, the number of activeexchange surfaces in the two horizontal directions is generally not exactly equal.
� One layer of the model apparently has 2800 grid cells. This is the difference betweenthe number of exchanges in one horizontal direction and in the vertical direction. Thereis one layer of exchanges less in the vertical, because between n layers there are onlyn - 1 interfaces.
� It is a 40 layer model because the number of horizontal exchanges in one directiondivided by 2800 is exactly 40.
D-Water Quality also makes these inferences, but it also allows for the direct specificationof the number of layers and it does not require full matrices of input, it even does notrequire a structured grid.
� The number of additional dispersion arraysD-Water Quality has constant dispersion coefficients (diffusion coefficients that accountfor the turbulent diffusion and the additional mixing at coarser grids additional to molec-ular diffusion) in the three mentioned exchange directions. You can furthermore specifyadditional spatially varying dispersion coefficients per exchange surface. You do so byspecifying a non-zero the number of additional dispersion arrays here. You might thinkthat you need to do so if you want to use the vertical diffusions that are generated by theturbulence model of the hydrodynamic model. That however is not the case. The hydro-dynamic model will produce the vertical diffusions per cell and not per exchange. In group7 of the input file you will specify the vertical diffusion file that is produced by the hydro-dynamic model. There also the ’process’ will be switched ’on’ that creates an additionaldiffusion array and puts the vertical coefficients therein. You just specify zero here.
� The number of additional velocity arraysFor additional velocity arrays the same holds, but now the information on the magnitudeof the additional velocities is most often generated by the processes library itself as e.g.settling velocity of particles. Also in that case just state zero here, because the processeslibrary will itself automatically make the necessary additional velocity arrays and put thesettling velocities in the section of the third dimension, the vertical.
� form of the input file structureThe first form of input is used here. The second form is documented in a following sec-tion. It is rarely used because it is mainly convenient for the manual specification of thehydrodynamics of relatively small models.
� exchange pointersThe number of exchanges was specified earlier. Now for all of these exchanges it shouldbe specified between which cell numbers the exchange surface is located. That happenswith this part of the input.
� dispersionsThese are the constant dispersions that will act on all transported substances and will beadded to the dispersion array values. If additional dispersion arrays were specified, theyshould be given values here. In the example this part can be absent.
� velocitiesIf additional velocity arrays were specified, they should be given values here. In the exam-ple this part can be absent.
� areasThese are the exchange surface area magnitudes in m2 that are used to compute thediffusive exchange flux in m3/s with: flux = D ·A
length.
� flowsThese are the flows across the exchange surfaces in m3/s
� lengths
32 of 90 Deltares

DRAFT
Hydrodynamic data
These are the exchanges lengths in the diffusive flux formula. They can be spatiallyconstant for a rectilinear grid, but it is most common that they are spatially variable. In allcases it is most common that the file of values is generated by the hydrodynamic modellike in this example.
In the following sections all topics are discussed in more detail.It should be mentioned again that the examples of the input generally are given in a nicelyformatted way. The positioning of the data on the input lines is however irrelevant. Only theorder of the input matters and input items should be separated by at least one blank. Thesame model result as with the example at the start of the chapter would be obtained with e.g.:
112000 112000 109200 0 0 1 0 com-Bodensee.poi 1 1. 1. 1. 1. 1. 1.e-7-2 com-Bodensee.are -2 com-Bodensee.flo 1 0 com-Bodensee.len #4
4.2 Number of exchanges
4.2.1 Standard processing for irregular solvers
D-Water Quality requires three integers here:
� The number of exchanges in the first horizontal direction: NOQ1.� The number of exchanges in the second horizontal direction: NOQ2 or zero if it does not
exist.� The number of exchanges in the third, vertical direction: NOQ3 or zero if it does not exist.
4.2.2 Processing for solvers on regular grids
Solvers 19 and 20 use a technique call ADI - Alternate Direction Implicit. They stem from theregular grid Delft3D-FLOW environment and use almost identical source code. These solversrequire a matrix topology of grid cells. The dimension of this matrix is read from the input fileat this location. Also 3 integers are required, but they have different meaning:
� the size of the fastest running (first) horizontal index of the matrix topology, called NMAX.� the size of the slowest running (second) horizontal index of the matrix topology, called
MMAX.� the size of the third index in the matrix topology, called KMAX.
Unlike the input for irregular solvers, you now must specify 1 for the 3rd direction if the modelis depth averaged, since then there is one layer of computational cells in the matrix. For asize of zero the matrix would disappear.
Deltares 33 of 90

DRAFT
D-Water Quality, User Manual
4.3 Number of additional dispersion and velocity arrays
Both for additional dispersions and velocities the following input structure holds:
� integer number of additional dispersion / velocity arrays� for each of these arrays a string of at most 20 characters giving the ID of the array� for each modeled transported substance (so not the passive substances) an integer that
indicates which array should be applied for that substance. Zero is required if no additionalarray should apply to the substance.
like:
1 ; number of additional dispersion arrays'random swimming fish'0 0 0 0 0 0 1 1 1 0 0 ; for the 11 transported substances2 ; settling velocities of particulates'v-s inorg. partic.''v-s org. partic.'0 0 0 1 2 2 0 0 0 0 0 ; for the 11 transported substances
4.4 Exchange pointers
The specification of the grid cell /segment numbers at both sides of an exchange surface isdone by the specification of four integers for each exchange surface:
1 the number of the ’from’ segment2 the number of the ’to’ segment3 the number of the ’from-1’ segment4 the number of the ’to+1’segment
The following properties can be identified:
� the selection of the ’from’ and ’to’ segment numbers also defines the positive direction offlow through the surface. Negative flow runs from ’to’ to ’from’.
� for an open boundary cell / segment one specifies −n with n the sequence number of thatopen boundary.
� for closed boundaries and connecting inactive cells you may specify zero or you mayalternatively omit the specification (and then also state that you have a lower number ofexchanges in that direction of course).
� the ’from-1’ and ’to+1’ entries are only used for some higher order scheme’s (5, 12 and14). If you do not use that solvers then you can just specify zero for these two entries.
� D-Water Quality will just skip the entry in the computation if one of the ’from’ or ’to’ numbersis zero or if both are zero and/or negative. Also the flow, area and lengths that are foundat that location in the files are neglected.
The table of 4 integers per exchange surface can be specified to D-Water Quality in severalforms. You start with an integer option number:
0 input comes from an external binary fileOptionally now UNFORMATTED and BIG_ENDIAN may be used as keywords to indicate thatthe file structure deviates from the default of BINARY and LITTLE_ENDIAN. Then the nameof the file follows. This is generally the way to couple D-Water Quality with the administra-tion of a hydrodynamic model. The file contains:
� For most solvers:NOQ1 + NOQ2 + NOQ3 groups of 4 integers. The implementation for UNFORMATTED files
34 of 90 Deltares

DRAFT
Hydrodynamic data
is such that each group of 4 integers forms a record.� For solvers on regular grids (e.g. 19 and 20):
� Seven integers (in one record for UNFORMATTED files): NMAX, MMAX, NOSEGL, KMAX,NOQ1, NOQ2, NOQ3. These seven integers are checked against earlier input to iden-tify that the file contents is compatible. NMAX, MMAX, KMAX should correspond.NOSEGL is the highest active grid cell number that will appea in the matrix andNOQ1, NOQ2, NOQ3 are the number of areas and flows that will be contained in thecorresponding hydrodynamic files.
� The complete matrix of segment numbers (or zero for inactive grid cells) of onelayer. It has the size of NMAX*MMAX and is in one record for UNFORMATTED files.
1 input comes from this ASCII input fileOptionally you may use the INCLUDE directive like everywhere in the D-Water Quality inputfile. The input now contains:
� For most solvers:NOQ1 + NOQ2 + NOQ3 groups of 4 integers, like for Venice Lagoon at unstructured grid:
1 2 0 01 3 0 02 3 0 0.. .. .. ..
2228 2256 0 02228 2255 0 0-9 2230 0 00 0 0 0
2230 -10 0 02231 2232 0 0
� For solvers on regular grids (e.g. 19 and 20):
� Four integers: NMAX, MMAX, NOSEGL, KMAX. These four integers are checked againstearlier input to identify that the file contents is compatible. NMAX, MMAX, KMAX shouldcorrespond. NOSEGL is the highest active grid cell number that will appear in thematrix.
� The complete matrix of segment numbers (or zero for inactive grid cells) of onelayer. It has the size of NMAX*MMAX.
4.5 Dispersions
4.5.1 Dispersion input through the input file
The input of dispersion coefficients as conducted by the general procedure for hydrodynamicinput data that is described in the Annexes. It should be noted that if no additional dispersionarrays are specified, then only the constant dispersion coefficients need to be read (like in theexample input at the start of the chapter). Further dispersion coefficients may be read here ifthe specified number of additional dispersion arrays is non-zero.
� If the first option number for the reading of the dispersion information is not zero, thenthe constant dispersion coefficients per direction in the grid will be added to the specifieddispersion coefficients.
� If the first option number for the reading of the dispersion information is zero, then theconstant dispersion coefficients per direction in the grid are not read and get a defaultvalue of zero.
Deltares 35 of 90
DRAFT
D-Water Quality, User Manual
4.5.2 Dispersion input through the processes library
4.5.2.1 The VertDisp process
You will have seen that the standard input as provided at the start of this chapter looks muchmore simple than the above specification. No additional dispersion arrays are specified andyet only the constant values needed to be specified per direction. Is it then common thatD-Water Quality only uses constant dispersion values in space and time? How about strat-ification? No, it is only common that D-Water Quality uses constant horizontal dispersions,but that D-Water Quality uses the outcome of the hydrodynamic turbulence model for the ver-tical dispersions. This vertical dispersion is generally specified as a segment function (seegroup 7 of the input file) with the name VertDisper. This segment function is input for theprocess VertDisp that is also switched ’on’ in that group of the input data. The process willautomatically create an additional dispersion array and will switch it ’on’ automatically for allsubstances that are transported by water. The additional dispersion array has values zero inthe horizontal directions and has the vertical diffusion coefficient that was generated by thehydrodynamic turbulence model. The constant horizontal and vertical diffusion values speci-fied in this input file are added to the values that are generated by the processes library. So inour sample case the horizontal diffusion coefficients will be 1.0m2/s and the vertical diffusioncoefficients will be 1.0E-07 + the value from the hydrodynamic model in m2/s. There is aninput item for the process VertDisp called ScaleVdisp with default value 1.0 that allows forscaling of the vertical diffusion as generated by the hydrodynamic model.We are at the advent that hydrodynamic models may produce spatially varying horizontal dis-persion coefficients using HLES (Horizontal Large Eddy Simulation) models. This developmentis induced by the use of increasingly smaller horizontal grid cells. The smaller the horizontalgrid cells are, the more important the local differences in horizontal mixing coefficients will be.Once models deliver such files for the horizontal direction with included vertical coefficients inthe vertical direction, the use of the ’-4’ and ’-2’ option of the preceding section together withthe declaration of an additional dispersion array, will do to incorporate such developments inD-Water Quality.
4.5.2.2 The VertDisper process
If the hydrodynamic model does not produce a file with the vertical diffusion coefficient ascomputed by a turbulence model, then there is an alternative. You can model salinity andtemperature, let the water density be computed and switch ’on’ the process VertDisper. Ituses the common formulae that relate density gradients and gradients in the horizontal veloc-ity to vertical diffusion coefficients and also produces the Richardson number thus obtained.
4.5.2.3 The HDisperVel process
This process is generally used for depth averaged models. The horizontal dispersion coeffi-cient should then have a strong, water flow direction dependent, component associated withthe vertical shear in horizontal velocities that are neglected due to the vertical mixing. Thisprocess tries to substitute for this and create a horizontal mixing coefficient that is dependingon the horizontal water velocity locally. It is however a very rude and inadequate solutionsince it is almost impossible to specify horizontal diffusion coefficients that run mainly alongdirections of about 45◦ with the grid lines, because decomposition in both directions then giveequal dispersion coefficients in both directions. If horizontal dispersion is important, you arestrongly advised to use a 3-dimensional model with at least 3 to 4 water layers. If you do soyou can specify zero for the horizontal diffusion coefficient because the horizontal dispersionprocess is fully modeled by the shear in velocities.
36 of 90 Deltares

DRAFT
Hydrodynamic data
4.6 The exchange areas between computational cells
The exchange areas between computational cells are used to:
1 Compute the diffusive mixing fluxThe diffusive mixing flux is computed from the dispersion coefficient D, the surface areaA of the exchange surface between two cells, the distance between the cell midpointsat both sides of the exchange are and the difference in concentrations at both sides by:Flux = − D ·A
length∆C . The flux counteracts the gradient and is often seen as a diffusive
flow of: Dflow = D ·Alength
in both directions, times the outgoing concentrations. A stepeven further is to attach a physical meaning to the length term by calling it a mixing lengthwhich is of course erroneous since it is just the distance between the midpoints of the twoadjacent cells and forms part of the concentration gradient: gradient = ∆C
length.
2 Compute velocitiesD-Water Quality can model the complete advection diffusion equation without knowing thewater velocities. That is because it is a Finite Volume (FV) model. It solves the volumet-rically integrated advection diffusion equations and uses flows rather than velocities forthat. However for a number of water quality processes it may be necessary to know thewater velocity. D-Water Quality computes this in the processes library by dividing the flowby the area where the flow goes through. To get the velocities in the cell midpoints (or thevelocities that are representative for the cell as a whole) several averaging methods existin the processes library to average values at the cell interfaces. Increasingly more how-ever hydrodynamic model using unstructured grids are used. Then the averaging processis not so trivial any more. These models generally produce velocity files that are read byinput group 7 of the input processor.
3 Compute the thickness of cellsD-Water Quality compute the thickness of cells by dividing the volume of the cell by thehorizontal surface area of the cell. This gives a time varying thickness value that is usedin processes that e.g. compute the extinction of visible light in the vertical etc.
4 Compute superficial processesD-Water Quality uses the horizontal surface area of cells to e.g. compute reaeration ofoxygen at the water surface or to compute the amount of settled sediments per m2 of thebed.
The exchange areas for aim 1 and 2 are read in this section of the input file. The horizontalareas are also contained in this dataset if the model is 3-dimensional. If however the modelis 2-dimensional depth averaged, then there are no horizontal exchange areas because thereare no vertical fluxes and transports. That is why horizontal areas for aim 3 and 4 are sepa-rately stored in a variable called SURF. This variable is generally read as parameter or segmentfunction in group 7 of the input file.The exchange areas are read through the standard input procedure for hydrodynamic datathat is described in the Annexes. Per exchange surface one value is read. One scale valueapplies. As seen from the sample input file at the start of this chapter, this part of the inputis most commonly limited to ’-2’ and the name of the areas file that was generated by thehydrodynamic model. Also input of ’-4’ and the name of a MULTIPLE_HYD file is regularlyused.
Deltares 37 of 90

DRAFT
D-Water Quality, User Manual
4.7 The flows between computational cells
The flows are essential for D-Water Quality in the solution process of the advection diffusionequation, but are also used in processes of the processes library. The input of flows is fullyidentical to the input of areas that is explained in the previous section. It also uses the standardinput processing that is described in the Annexes and will not be described here. Also for thisentry the ’-2’ and ’-4’ options are the most common options.
4.8 Velocities
If additional velocity arrays have been specified before, this is the place to specify there value,or where they will come from. Additional velocities are incorporated in the solution of theadvection diffusion equation like the additional dispersions are. They act on the substanceswhere they have been specified for. If ’0’ was specified as additional velocity array numberfor a substance then no additional velocity is applicable. Additional velocities generally play arole as settling velocities and floating velocities of particulate substances heavier than wateror lighter than water. These velocities are generally computed by the processes library bytransport processesand automatically stored in arrays and applied for the substances wherethey are ment for. So generally you then specify zero additional velocity arrays and this sectionof the input file can be fully omitted.Should you want to add additional velocity arrays yourself, then you follow exactly the sameinput procedure as for areas and flows. The only difference is that if you specify 4 additionalvelocity arrays, then you should apply the procedure for 4 values per exchange rather than forone value per exchange as done for areas and flows. There is still 1 scale value per directionNOQ1, NOQ2 or NOQ3 when present.
4.9 Lengths
The lengths between the midpoints of computational cells at both sides of interface areas areused to:
1 Compute the diffusive mixing fluxThe diffusive mixing flux is computed from the dispersion coefficient D, the surface areaA of the exchange surface between two cells, the distance between the cell midpointsat both sides of the exchange are and the difference in concentrations at both sides by:Flux = − D ·A
length∆C . The flux counteracts the gradient and is often seen as a diffusive
flow of: Dflow = D ·Alength
in both directions, times the outgoing concentrations. A stepeven further is to attach a physical meaning to the length term by calling it a mixing lengthwhich is of course erroneous since it is just the distance between the midpoints of the twoadjacent cells and forms part of the concentration gradient: gradient = ∆C
length.
2 Weigh concentrations in central schemesIf two adjacent cells differ strongly in size, one may distinguish the distance of the ’from’cell midpoint to the interface area and of the ’to’ cell midpoint to the interface area. Thisintuitive separation of two distances is also implemented in a number of higher order ’cen-tral’ numerical schemes. This approach is increasingly more considered mathematicallyquestionable and is easily eliminated by the specification of two equal half values of thetotal distance between the cell midpoints rather than the two half values of the unequalcell sizes. The latter have the same sum, but differ from each other.
Horizontal distances between cell midpoints are generally constant over time. This may pro-duce a relatively small file with one specification that will hold for the whole simulation period.In 3-dimensional models the water level change will change the vertical distances though. Toavoid huge files for this item, you can just specify vertical lengths of zero for this specification.D-Water Quality will automatically fill in the correct vertical distances from the thickness of
38 of 90 Deltares

DRAFT
Hydrodynamic data
cells as computed per time step by the cell volumes divided by the horizontal surface areas.There are two options to specify lengths to D-Water Quality
0 Lengths are constant spatially and in timeThis requires 1 scale value and 3 lengths values for the 3 dimensions. So in this caseno half lengths are specified and the third value is also required for depth averaged 2-dimensionlan models. This option would only be appropriate for a sort of test cube ofidentical small cubes as computational volumes.
1 Lengths vary spatiallyThis requires exactly the same input structure a for areas, flows and velocities with specialconsideration that 2 values are needed per interface area, the ’from’-length and the ’to’-length respectively. Per direction 1 scale values is required for ASCII input.
4.10 Second form of input file structure
This chapter up to now documented the first form of the structure of the input file. Once youhave read the information on items that are contained in this input, you will also understandthe meaning of the input items in this simple alternative second form of the input. It is a tabularinput with:
� four scale factors for:
� dispersions� areas� flow� lengthes
� NOQ1 + NOQ2 + NOQ3 rows with:
� ’from’ cell number� ’to’ cell number� ’from-1’ cell number� ’to+1’ cell number� dispersion in m2/s� exchange area in m2
� flow in m3/s� ’from’-length in m� ’to’-length in m
Like in:
1 ; information in this file1.0 1.0 1.0 1.0 ; scale factors
; from to fr-1 to+1 D A Q L-21 65 -21 66 5 1500 1500 250 250-22 81 -22 82 5 1500 1500 250 25017 18 -18 19 5 1500 1500 250 25018 19 17 20 5 1500 1500 250 25019 20 18 21 5 1500 1500 250 25020 21 19 22 5 1500 1500 250 25021 22 20 23 5 1500 1500 250 250.. .. .. .. .. .. .. .. ..
4.11 Finalization
This part of the input file is finalized with the #4 end of fourth data group indicator.
Deltares 39 of 90

DRAFT
D-Water Quality, User Manual
40 of 90 Deltares

DRAFT
5 Open boundary conditions
This is the fifth group in the input file. This group may read like:
; Open boundaries'River 1' 'River Williamsburg side ' 'River''River 2' 'River 100m from bank ' 'River'
.... .... ....'River 12' 'River Brookmarsh side ' 'River''Ocean 1' 'Ocean at Cape Cod side ' 'Ocean'
.... .... ....'Ocean 100' "Ocean at Mary's Lighthouse" 'Ocean'
1 ; Thatcher-Harleman time lags for all entries; hhmmss
12*10000 ; 1 hour for first 12 entries (River)100*3000 ; 30 min. for next 100 entries (Ocean)
ITEM River OceanCONCENTRATION Salinity DATA 0.1 34.5
ITEM 'River''Ocean'
CONCENTRATION USEFOR Continuity ContUSEFOR Oxy O2USEFOR PO4 Tot-P - Part-P MIN 0.0USEFOR AAP Part-P
TIME LINEAR DATA Cont Tot-P Part-P NO3-N O22012/01/01-12:00:00 1.0 0.15 0.1 1.7 7.5 ; river
1.0 0.05 0.03 0.5 8.4 ; sea2012/02/01-12:00:00 1.0 0.10 0.07 1.0 8.0 ; river
1.0 0.05 0.03 0.5 8.4 ; sea... ... ...
2013/01/01-12:00:00 1.0 0.15 0.1 1.5 8.5 ; river1.0 0.05 0.03 0.5 8.4 ; sea
#5 ; delimiter for the fifth group of input data
5.1 General
Open boundary conditions deal with the influence from outside of the model domain. To acertain extent also waste loads do. Open boundary conditions however distinguish in someimportant aspects from waste loads:
� Open boundary conditions are contained in the transport schematization that comes fromthe hydrodynamic model. They appear as negative integers in the ’from’-’to’ pointer tablefor exchanges between the finite volumes. An entry of e.g. -6 refers to the 6th openboundary condition. Waste loads do not have entries in the ’from’-’to’ pointer table.
� Open boundary conditions come with a flow from the hydrodynamic model. Waste loadsmay come with a flow from the hydrodynamic model, but may also be specified indepen-dent of the flow model. The latter generally happens for waste flows that are so small thatthey need not be contained in the hydrodynamic model. A city of 1 million inhabitants wille.g. generate a waste flow of about 1m3/s but that amount may be too small to influencehydrodynamic velocities in a tidal marine area.
� By default the numerical scheme is expanded across the open boundaries by having dif-fusion across open boundaries and/or having higher order flux correction terms acrossopen boundaries. If you want these effects be switched ’off’, you need to use the key-words NODISP-AT-BOUND and/or LOWER-ORDER-AT-BOUND in the group 2 section of theinput file. If diffusion across open boundaries is used, e.g. for mimicking salt intrusion witha diffusion term for 1-Dimensional rivers entering a sea, the user must be aware that the
Deltares 41 of 90

DRAFT
D-Water Quality, User Manual
constant diffusion term of group 4 of the input file acts on all open boundaries. It is thenbest to set the constant diffusion to zero and to give nonzero values where needed to anadditional diffusion array.
� It is possible to specify a ’Thatcher-Harleman’ open boundary condition that will be dis-cussed later in this section. For waste loads this option does not exist.
5.2 Identification of open boundaries
The input processor scans the ’from’-’to’ pointer table for negative entries. These negative cellnumbers refer to artificial ’open boundary cells’ with that sequence number, at the outside ofthe model domain. The input processor reports the entry with the biggest sequence numberthat it found. It also indicates all those entries within the range from 1 to the highest entry thatare not associated with an exchange surface with a model cell located within the model.Because each exchange across the open boundary is an entry, the amount of entries canbecome quite large in 3-Dimensional models. To assist somewhat with the specification ofopen boundary conditions, there is the possibility to group the open boundaries with a ’type’indicator.For each open boundary entry, also those that are not associated with a model cell, thefollowing input is required:
� A boundary-ID. The first 20 characters of the boundary-ID should be unique.� A boundary-name. This input is not used by D-Water Quality but assists the user in the
identification of the open boundary entry. The first 40 characters are echoed to the listingfile.
� A boundary-type. The first 20 characters of the boundary type are recognized and canbe used to group the open boundary entries e.g. to the type ’Northern boundary’. For allentries of a type, one identical concentration can be specified.
It is possible to specify empty strings for all entries. If there are e.g. 112 open boundaryentries, one could specify here:
336*" "
The net effect of this specification will be that D-Water Quality fills in:
'Boundary-ID 1' 'Boundary name 1' 'Boundary type 1''Boundary-ID 2' 'Boundary name 2' 'Boundary type 1'
.... .... ....'Boundary-ID 112' 'Boundary name 112' 'Boundary type 1'
This is generally not so informative and also not so convenient. In the example at the startof the chapter we distinguished a ’River’ boundary type and an ’Ocean’ boundary type. Thisgives us opportunity to define a concentration at each of the two, without having to do so forall the open boundary cells individually. Should we, for a certain substance, want to havedifferent values for the right bank and the left bank of the river and interpolate between them,then this is still possible using the ’River 1’ to ’River 12’ ID values for that substance alone.The names are not used by D-Water Quality but are helpful to identify which bank we aremeaning. Note that we used in the example at the start of the chapter double-quotes aroundthe last boundary name to enable the use of a single quote within the character string. Theidentification of open boundaries given here is also used in the output files with mass balanceinformation to enhance the identification of the mass balance terms.
42 of 90 Deltares

DRAFT
Open boundary conditions
5.3 Thatcher-Harleman time lags
In general tidal open boundary conditions show an outflow during the out-flowing tidal halfand an inflow during the inflowing tidal half. At the turn of the tide the first inflow will consistpartly of the material that flew out in the hour before. To account for this you can specify a"Thatcher-Harleman time lag" for each open boundary entry. The time lag works as a halfcosine function between the last outflow concentration at the time of last outflow (called toutand the specified boundary concentration at tout + the time lag, according to:
Cin =
{(Cout+Cbound)
2+ (Cout−Cbound)
2· cos
(t−toutlag
π)
if 0 < t < tout + lag
Cbound if t > tout + lag
For times since last outflow longer than the specified lag, the prescribed boundary concentra-tion is applied. This means that the time lag feature is switched off by selecting 0 for the timelag.You specify these time lags as integers. If you earlier specified to use DDHHMMSS format fortimes, then a time lag of 1 hour looks like 10000. If you did not specify that format, then youshould enter 3600.
You have the following three input options, they start with a âAŸswitchâAZ integer that is 0, 1or 2:
0 No time lags.1 Time lags for all entries like in the example at the start of the chapter.2 Time lags with a default value and specified exceptions:
The exceptions consist of the entry number of the exception and the value to be usedinstead of the default value, like in:
2 ; time lags with a default; mmss
3000 ; default value of 30 min.12 ; number of exceptions....
; hhmmss1 10000 ; first exception2 10000 ; second exception
........12 10000 ; twelfth exception
Note: the exception number refers to the open boundary number. The fact that the 12thexception has number 12 is coincidental here.
5.4 Concentration values
If you specify furthermore nothing, then zero will be used as open boundary concentration forall substances and all boundary entries. Everything that you specify here will fill in just theentry that you specify. If you specify the same entry and the same substance twice, then thelast specification will be used. If you first specify a high frequency sampled time series foran entry-substance combination and later on a lower frequency sampled time series for thesame entry but for a combination of that entry with other substances, then both are applied.This means that you are fully flexible. The specification of concentrations is done through anumber of input blocks, each containing the concentration values for a number of boundaryentries and a number of substances.
5.4.1 Input blocks
The input is organized in blocks. Each block consists of the definition of the entries thatare specified in the block, these are called ITEM. Furthermore the block definition consists
Deltares 43 of 90

DRAFT
D-Water Quality , User Manual
of the substances that are specified in the block, they are called CONCENTRATION. The DATAin a block consist of a (series of) matrices. If you first specified the ITEM entries, then thematrix consist of rows of concentration values. One for each item. If you first specifiedCONCENTRATION entries, then the matrix consists of rows per substance and values for theitems on the rows. Be aware that D-Water Quality reads tokens only. D-Water Quality is notaware of the layout that you use for the input file. You may put all your information on one line,or you may put every item on a subsequent line. So you cannot leave a matrix entry blankand you cannot assume that a new row starts with a new line. A new row starts if enoughdata is read for the previous row. So if there is no value available, then you may specify -999.0instead. This is interpreted by D-Water Quality as a missing entry.Character strings may be embedded in single or double quotes. Quotes / double quotes areonly required if there are embedded blanks or embedded quotes in the string.So either:
ITEM'River outflow''Northern boundary'
CONCENTRATIONSalinityContinuityOxygen
DATA ; salinity continuity oxygen16.0 1.0 7.5 ; river outflow35.0 1.0 8.4 ; northern boundary
or:
CONCENTRATIONSalinityContinuityOxygen
ITEM'River outflow''Northern boundary'
DATA ; river outflow northern boundary16.0 35.0 ; salinity1.0 1.0 ; continuity7.5 8.4 ; oxygen
Note that ’River outflow’ may be a boundary ID of a single entry, whereas ’Northern boundary’may be a boundary type consisting of many entries. Instead of a boundary ID, you may alsogive an integer value say ’i’ as ITEM. D-Water Quality will then assume that you want to specifythe boundary with sequence number ’i’. Furthermore there may be more open boundaries andsubstances in the model than those mentioned in this block. The others may be defined insubsequent other blocks. The strings behind the semi-colons are comment strings that areused here to make the table more readable.
5.4.2 Column headers and computations
Within one or more input blocks you may apply column headers that are no comments in thefollowing way:
ITEM'River outflow''Northern boundary'
44 of 90 Deltares

DRAFT
Open boundary conditions
CONCENTRATIONUSEFOR Salinity 'Sal o/oo'USEFOR Continuity ContUSEFOR Oxy O2USEFOR PO4 Tot-P - Part-P MIN 0.0USEFOR AAP Part-P
DATA'Sal o/oo' Cont Tot-P Part-P NO3-N O2
16.0 1.0 0.15 0.1 1.7 7.5 ; river outflow35.0 1.0 0.05 0.03 0.5 8.4 ; northern boundary
Now the column headersare used as an identification of the column. They need not corre-spond with the reserved names of the processes library, but they can be linked through theUSEFOR clause.
� Note that the order of the columns is not important.� Note that the NO3-N column is not used.� Note that computations are possible:
� The tokens and computational symbols should be separated by one or more blanks.� + , - , * , / , MIN and MAX are possible as computational directives.� They are evaluated in agreement with accepted math rules, i.e. * and / are evaluated
before - and +. Brackets can not be used. If you want a*(b+c), then you should specifya * b + a * c.
� Instead of a column header token also a number can be used in the computations.� The computations act on whole columns, so if your columns are items, then the com-
putations may be less useful.
5.4.3 Time series
Up to now we have assigned one concentration value for each mentioned substance to eachmentioned boundary item. It is however common to have time varying open boundary condi-tions consisting of a time series of concentrations. Time series start using the TIME keywordbefore the DATA keyword. This tells the input processor that this input block consists of a timeseries. Once you specified this keyword, D-Water Quality expects a series of matrices ratherthan a single matrix. The most simple time series consist of 2 matrices for 2 time stamps.Each matrix should be preceded by a ’time’ indication. That can be:
� An integer in DDHHMMSS format if you specified to use that format in the group 1 inputsection.
� An integer in seconds if you did not specify to use the format.� If you gave a reference time in the model ID strings in the group 1 input section, then you
can also specify calendar dates here as e.g. 2012/02/28-12:35:00. The two ’/’, the ’-’and the two ’:’ characters are required exactly in this form, otherwise the time string willnot be recognized.
D-Water Quality reads sets of a time and a matrix of data until it meets a reserved keyword(mostly ITEM or CONCENTRATION) that starts the subsequent data block. Also the #5, the endof block 5 signal, ends the processing of a time series.
5.4.4 Linear interpolation
The default processing of time series is that the specified value at a specified time is used up tothe next specified time, a so-called block wave. Then the value switches to the next specifiedvalue. For one or more of the input blocks you may alternatively want to interpolate linearlyin between two specified values at specified times. To make D-Water Quality interpolate your
Deltares 45 of 90

DRAFT
D-Water Quality, User Manual
time series linearly, you insert LINEAR after the TIME keyword and before the DATA keyword.Also the BLOCK keyword is supported, but it is superfluous since this is the default processingof time series.
5.4.5 Scale your input
If you copy and paste large amounts of data into your input file, then it is cumbersome if thedata does not have the units that are required for the simulation. If you have data in moleor in µg/l rather than the g/m3 or mg/l that is required by D-Water Quality then it isconvenient that you just scale your input. You do so by specifying the SCALE keyword beforethe DATA keyword. The SCALE keyword should be followed by as many scale factors as thereare columns in the matrices that you will provide. So you must provide 1.0 for each columnthat will not be scaled. It is also possible to scale your input using the USEFOR clause andmultiply there by the appropriate scale factor.
5.4.6 Data from external non-ASCII files
D-Water Quality supports the entry of data from non-ASCII self describing so called ODS_FILEfiles. This Deltares proprietary file format is not further documented here. The use of thisoption is to specify the ODS_FILE keyword followed by the name of the file. This specificationis used instead of the DATA keyword and the data matrices that follow that keyword.
5.4.7 Multiple copies of substances
If the feature of multiple copies of substances is used, then for each copy a boundary conditionmust be provided. This is facilitated by the input structure through e.g.:
ITEM 'My Boundary'CONCENTRATIONS
USEFOR IM101 IM1 * 0.25USEFOR IM102 IM1 * 0.25USEFOR IM103 IM1 * 0.50
TIME LINEARDATA IM11990/08/05-12:30:00 1.00e+0011990/08/06-01:00:00 1.20e+001
5.5 Finalization
This part of the input file is finalized with the #5 end of fifth data group indicator.
46 of 90 Deltares

DRAFT
6 Loads and withdrawals
This is the sixth group in the input file. This group may read like:
19 ; Number of loads and inflows8 'Ca. Bianca/Altipiano' 'Casa Bianca / Altipiano ' 'Casa '61 'Scolo Scarpion ' 'Scolo Scarpion ' 'Scolo '143 'Scolo Altipiano ' 'Scolo Altipiano ' 'Scolo '... ...... ...... ...2622 'Idrovia Veronese ' 'Idrovia Veronese ' 'Idrovia'2642 'Ca. Deriva ' 'Casa Deriva ' 'Casa '2706 'Fiume Vallio/Cle.d.V' 'Fiume Vallio/Cle de Veneto' 'Fiume '
CONCENTRATION FLOWITEM 1 2 3DATA 0.84 0.9 2.6
ITEM 'Ca. Bianca/Altipiano''Scolo Scarpion ''Scolo Altipiano '
CONCENTRATIONContinuityOxyPO4
USEFOR AAP Tot-P - PO4 MIN 0.0TIME LINEAR DATA
Continuity Tot-P PO4 Oxy2005/01/01-00:00:00 1.0 0.4 0.25 7.5 ; load 1
1.0 0.6 0.31 6.5 ; load 21.0 0.37 0.16 8.3 ; load 3
..... ..... .....2006/01/01-00:00:00 1.0 0.56 0.33 8.3 ; load 1
1.0 0.42 0.23 6.7 ; load 21.0 0.58 0.27 8.1 ; load 3
ITEM..... ......
#6 ; delimiter for the sixth group of input data
6.1 General
This is the sixth group in the input file. Waste loads are an external forcing to the systemin the form of added (or withdrawn) masses. They can be associated with point sources aswell as diffuse sources. There are similarities with open boundaries. Waste loads howeverdistinguish in some important aspects from open boundary conditions:
� Loads and withdrawals do not play a role in the numerical solution of the substancestransport. They just add (or subtract) mass from computational cells. There functioningis not contained in the âAŸfromâAZ-âAŸtoâAZ pointer table for exchanges between thefinite volumes.
� Loads and withdrawals are internally always expressed as mass/unit of time. Externallythey may be specified as a flow with a concentration, but alternatively also directly asmass/unit of time. There need not be a flow associated with the waste loads.
� If a load flow is substantial enough to be contained in the hydrodynamic model result,then it depends on the coupling program with the hydrodynamic model whether that flowbecomes available for D-Water Quality input processing. For Deltares software, the sup-ported flow modules write files with flow information from point sources or distributedsources. These files can directly be used by D-Water Quality for its input processingand only concentrations need to be attached.
� If a load flow is contained in the hydrodynamic model, but if the hydrodynamic model does
Deltares 47 of 90

DRAFT
D-Water Quality, User Manual
not make an input file for D-Water Quality to obtain that flow, then you can instruct D-Water Quality to compute the flow from the closure error in the hydrodynamics dataset atthat location. This requires that each computational cell has at most 1 waste load. If therewere more for one cell, then there is only one closure error and it is impossible for D-WaterQuality to determine which share of the error belongs to which load.
� If a withdrawal has to withdraw water with the current model concentration, then this isdone through the specification of the withdrawal flow.
� Specific options exist to support the treatment of distributed or diffuse sources.� Loads are specified for all substances, so also the non-transported, inactive substances.
Open boundary conditions are only accepted for transported, active substances
Note: The loads and withdrawals are applied explicitly for all solvers. This means that es-pecially for withdrawals a maximum time step applies to avoid instabilities at the location ofthe withdrawal. The maximum time step size should at least be less than the volume of thesegment of withdrawal divided by the withdrawn flow. In the near future it may be expectedthat for implicit solvers also the process of withdrawing water will be implemented in an implicitway in order to eliminate this stability constraint.
6.2 Number of loads and identification of loads
The first required information is the number of loads. Subsequently for each load identificationis required. The load identification consists of:
� the computational cell number where the load occurs. This cell number is generally easydetermined by clicking the cell in the Graphical User Interface.
� A load-ID. The first 20 characters of the load-ID should be unique.� A load-name. This input is not used by D-Water Quality but assists the user in the
identification of the load entry also in mass balances. The first 40 characters are echoedto the listing file.
� A load-type. The first 20 characters of the load type are recognized and can be used togroup the load entries e.g. to the type ’Agriculture’. For all entries of a type, one identicalconcentration can be specified.
It is possible to specify empty strings for all entries. The net effect of this specification will bethat D-Water Quality fills in strings for the entries itself. This is generally not so informativeand also not so convenient.
6.2.1 Special loads
Instead of a cell number you may specify one out of 3 keywords:
� SURFACEThis will produce a waste load proportional the surface of the cell, for each computationalcell that has a water surface. It is meant to support the effect of rain and/or evaporation.This special waste load requires the presence of a parameter or segment function withthe ID SURF. Specified values are /m2.
� BANKThis will produce a waste load proportional to the length of a cellâAZs embankment. It ismeant to support the effect of diffuse influxes from riparian land into rivers and estuaries.This special waste load requires the presence of a parameter or segment function withthe ID LENGTH. Specified values are /m.
� BEDThis will produce a waste load proportional to the horizontal surface area for each compu-tational cell that has a water bed underneath. It is meant to support the effect of well and
48 of 90 Deltares

DRAFT
Loads and withdrawals
sink. This special waste load requires the presence of a parameter or segment functionwith the ID SURF. Specified values are /m2.
These keywords come instead of a cell number. The consequence is that all cells that havea surface, have a bank or have a bed are affected by this waste load specification. The ID,name and type string are still required to identify the load in the further specification blocks.
6.2.2 Load entry options
You may optionally precede the waste-load-ID with one of 4 keywords:
� MASSThis indicates that the information that follows for this load is to be considered as mass/unitof time (generally g/s). Any also specified FLOW value will not be used.
� CONCThis indicates that the information that follows for this load is to be considered as concen-tration (generally g/m3). Flow information is now required to obtain waste loads otherthan zero for this option.
� RAINThis indicates that the specified concentrations should be used by D-Water Quality if theflow is positive and that zero concentrations should be used if the flow is negative (like forevaporation).
� WELLThis indicates that the specified concentration should be used if the flow is positive andthat the model concentration should be used if the flow is negative (like for groundwaterabstraction).
If the keywords are missing, then the default waste load processing of D-Water Quality applies.This default load processing consists of:
� No flow is specified or the specified flow is exactly zero:Then all values for the substances are considered to be expressed in mass/unit of time(generally g/s).
� The specified flow is positive:Then the values for the substances are used as concentrations and mass is determinedby multiplying them with this flow rate.
� The specified flow is negative:
� If concentrations are not zero, the specified concentrations are withdrawn.� If concentrations are zero, the model concentrations will be withdrawn.
This default behavior is tricky for a number of reasons. If e.g. a specified time series for theflow contains zero values then suddenly, within the time series, the specified concentrationwould be interpreted as a mass. The same type of sudden shift in behavior would appearwith withdrawals when the concentration becomes zero within a time series. Finally if flowand / or concentration values are specified as time series and are linearly interpolated, thenit becomes increasingly difficult to identify when the value becomes zero and what the actualload will be. Sometimes a small non-zero flow value of e.g. 1.0E-20 is included to force thevalues to remain concentrations rather than mass. To avoid this ambiguity, the keywords areintroduced to give the user full control. Please note that the keywords apply per waste load,so not for all together, but also not per substance or per input block.
Deltares 49 of 90

DRAFT
D-Water Quality , User Manual
6.3 Concentration values
If you specify furthermore nothing, then zero will be used as load mass or concentration forall substances and all load entries. Everything that you specify here will fill in just the entrythat you specify. If you specify the same entry and the same substance twice, then the lastspecification will be used. If you first specify a high frequency sampled time series for an entry-substance combination and later on a lower frequency sampled time series for the same entrybut for a combination of that entry with other substances, then both are applied. This meansthat you are fully flexible. The specification of concentrations is done through a number ofinput blocks, each containing the concentration values for a number of waste load entries anda number of substances.
6.3.1 A ’substance’ called FLOW
This load processing section also recognizes a substance-ID called FLOW. The informationgathered under this ID will be used as the flow associated with the load. If this FLOW informa-tion is missing for a certain load then a value of zero is used for the flow of that load. Thedimension of flow is m3/s. This means that if you specify flow for a SURFACE or BED load, thedimension becomes m/s because it is multiplied with the SURF parameter that has dimensionof m3/s. You may convert existing tabular values of rainfall data expressed in mm/day to therequired m/s unit by e.g. specifying a scale factor of 10-3 / 86400 = 1.1574E-08 in the D-WaterQuality input.As indicated earlier you may specify -999.0 to indicate a missing value. If you do so for theFLOW then something special happens. If the load is contained in the hydrodynamic dataset,then D-Water Quality will compute the flow from the closure error in the hydrodynamics of thegrid cell of the load. This requires that at most 1 load exists for a grid cell, because only oneclosure error can be computed per grid cell. If the flow is not contained in the hydrodynamicdataset then the closure error computation will automatically produce a zero value.
6.3.2 Input blocks
The input is organized in blocks. Each block consists of the definition of the entries thatare specified in the block, these are called ITEM. Furthermore the block definition consistsof the substances that are specified in the block, they are called CONCENTRATION. The DATAin a block consist of a (series of) matrix(ices). If you first specified the ITEM entries, thenthe matrix consist of rows of concentration values. One for each item. If you first specifiedCONCENTRATION entries, then the matrix consists of rows per substance and values for theitems on the rows. Be aware that D-Water Quality reads tokens only. D-Water Quality is notaware of the layout that you use for the input file. You may put all your information on one line,or you may put every item on a subsequent line. You cannot leave a matrix entry blank andyou cannot assume that a new row starts with a new line. A new row starts if enough datais read for the previous row. So if there is no value available, then you may specify -999.0instead. This is interpreted by D-Water Quality as a missing entry.Character strings may be embedded in single or double quotes. Quotes / double quotes areonly required if there are embedded blanks or embedded quotes in the string.So either:
ITEM'Amsterdam wwtp''Rotterdam harbor'
CONCENTRATIONFLOWEcoliOxygen
DATA ; flow m3/s EColi oxygen1.2 1.0E+08 7.5 ; Amsterdam wwtp
50 of 90 Deltares

DRAFT
Loads and withdrawals
3.1 0.5E+06 8.4 ; Rotterdam harbor
or:
CONCENTRATIONFLOWEcoliOxygen
ITEM'Amsterdam wwtp''Rotterdam harbor'DATA ; �Amsterdam wwtp� �Rotterdam harbor�
1.2 3.1 ; FLOW1.0E+08 0.5E+06 ; Ecoli7.5 8.4 ; Oxygen
6.3.3 Column headers and computations
Within one or more input blocks you may apply column headers that are no comments in thefollowing way:
ITEMAgricultureWoods
CONCENTRATIONUSEFOR Continuity ContUSEFOR Oxy O2USEFOR PO4 Tot-P - Part-P MIN 0.0USEFOR AAP Part-P
DATACont Tot-P Part-P NO3-N O21.0 0.15 0.1 1.7 7.5 ; Agriculture1.0 0.05 0.03 0.5 8.4 ; Woods
Now the column headers are used as an identification of the column. They need not corre-spond with the reserved names of the processes library, but they can be linked through theUSEFOR clause.
� Note that the order of the columns is not important.� Note that the NO3-N column is not used.� Note that computations are possible:
� The tokens and computational symbols should be separated by one or more blanks� + , - , * , / , MIN and MAX are possible as computational directives� They are evaluated in agreement with accepted math rules, i.e. * and / are evaluated
before - and +. Brackets can not be used. If you want a*(b+c), then you should specifya * b + a * c.
� Instead of a column header token also a number can be used in the computations� The computations act on whole columns, so if your columns are items, then the com-
putations may be less useful
6.3.4 Time series
Time series start using the TIME keyword before the DATA keyword. This tells the input proces-sor that this input block consists of a time series. Once you specified this keyword, D-WaterQuality expects a series of matrices rather than a single matrix. The most simple time series
Deltares 51 of 90

DRAFT
D-Water Quality , User Manual
consists of 2 matrices for 2 time stamps. Each matrix should be preceded by a ’time’. Thiscan be:
� An integer in DDHHMMSS format if you specified to use that format in the group 1 inputsection.
� An integer in seconds if you did not specify to use the format.� If you gave a reference time in the model ID strings in the group 1 input section, then you
can also specify calendar dates here as e.g. 2012/02/28-12:35:00. The two ’/’, the ’-’and the two ’:’ characters are required exactly in this form, otherwise the time string willnot be recognized.
D-Water Quality reads sets of a time and a matrix of data untill it meets a reserved keyword(mostly ITEM or CONCENTRATION) that starts the subsequent data block. Also the #6 end ofdata group 6 signal ends the processing of a time series.
6.3.5 Linear interpolation
The default processing of time series is that the specified value at a specified time in usedup to the next specified time. Then the value switches to the next specified value, a so-calledblock wave. For one or more of the input blocks you may alternatively want to interpolatelinearly in between two specified values at specified times. To make D-Water Quality interpo-late your time series linearly, you insert LINEAR after the TIME keyword and before the DATAkeyword. Also the BLOCK keyword is supported, but it is superfluous since this is the defaultprocessing of time series.
6.3.6 Scale your input
If you copy and paste large amounts of data into your input file, then it is cumbersome if thedata does not have the units that are required for the simulation. If you have data in moleor in µg/l rather than the g/m3 or mg/l that is required by D-Water Quality then it isconvenient that you just scale your input. You do so by specifying the SCALE keyword beforethe DATA keyword. The SCALE keyword should be followed by as many scale factors as thereare columns in the matrices that you will provide. So you must provide 1.0 for each columnthat will not be scaled. A scale factor can be especially useful for loads through rainfall if youhave rain data in mm/day whereas you have to provide your input in m/s. Also concentrationdata for coliforms (MPN/100 ml) generally need to be converted. Alternatively the USEFORwith multiplication can be used to scale the input.
6.3.7 Data from external non-ASCII files
D-Water Quality supports the entry of data from non-ASCII self describing so called ODS_FILEfiles. This Deltares proprietary file format is not further documented here. The use of thisoption is to specify the ODS_FILE keyword followed by the name of the file. This specificationis used instead of the DATA keyword and the data matrices that follow that keyword.
6.3.8 Multiple copies of substances
If the feature of multiple copies of substances is used, then for each copy a load must beprovided. This is facilitated by the input structure through e.g.:
ITEM 'Rotterdam WWTP'CONCENTRATIONS
USEFOR TColi01 Coliforms * 0.25USEFOR TColi02 Coliforms * 0.25
52 of 90 Deltares

DRAFT
Loads and withdrawals
USEFOR TColi03 Coliforms * 0.50TIME LINEARDATA Coliforms1990/08/05-12:30:00 1.00e+0091990/08/06-01:00:00 1.20e+009
6.3.9 Useful options� Use different groups for flow and concentrations
Often the flow is available as a time series with e.g. a value per day, whereas the con-centrations may be constant or have a value each month. If you put the flow in one blockand the concentrations in another block, each with there own number of time values, thenD-Water Quality will evaluate the flow and concentration independently per time step andthen multiply them at run time to obtain the load.
� Group waste load concentrations for a specific class of loadsWith the above procedure it is easy to provide e.g. the waste load concentrations for manyloads of a certain class like ’agriculture’ in one block. With the directiveINCLUDE â��..\data\agriculture.datâ��you can retrieve that information from a separate file.
� Separate time varying concentration data and constant concentration dataYou just place them in different blocks.
6.3.10 Internal intelligence
To assist you in providing the input, you can best pose yourself the question: ”how doesDELWAQ knows?”.
� If you say ITEM then D-Water Quality expects strings with items. It signals if such a stringis neither an item (a load or a load type) nor a new keyword.
� If you say CONCENTRATION then any pending procedure for item processing stops and theprocedure for substances starts. It signals if your substance entries are not recognizedas model substances and the entry is also not a new keyword. USEFOR is allowed, butshould be followed by a character token that is found as column header and optionalcomputational instructions. If a computational operator (+, -, *, /, MIN, MAX) is followed bya character token, then the new character token should either be a new column header ora recognized keyword.
� If you say DATA then data should follow. If you however specified TIME before, then firsta ’time’ stamp should be provided. That can be an integer or a calendar time string. Ifthe first time stamp is a character token that is not an absolute time string, then D-WaterQuality assumes that you started to provide column headers.
� If you specified a matrix of input data, then either an integer time or a calendar time stringshould follow, followed by the next matrix or a new keyword should follow to end the inputblock and start a new input block.
6.4 Finalization
This part of the input file is finalized with the #6 end of sixth data group indicator.
Deltares 53 of 90

DRAFT
D-Water Quality, User Manual
54 of 90 Deltares

DRAFT
7 Process steering
This is the seventh group in the input file. This input group may read like:
CONSTANTS 'ONLY_ACTIVE' DATA 1.00000e+000CONSTANTS 'ACTIVE_VarSal' DATA 1.00000e+000CONSTANTS 'ACTIVE_BLOOM_P' DATA 1.00000e+000
PARAMETERS 'SURF' ALL BINARY_FILE 'SURFACE.FIX'
FUNCTIONS 'VWIND' LINEAR DATA; dddhhmmss
000000000 3.44E+00 ; Begin year182120000 2.10E+00 ; Half way365000000 4.44E+00 ; End year
SEG_FUNCTIONS 'Temp' ALL BINARY_FILE 'hydrodyn.tem'
CONSTANTS 'Dry_THresh' DATA 0.25CONSTANTS 'NOTHREADS' DATA 0
#7 ; delimiter for the seventh group of input data
7.1 General
The water quality processes make the model to a water quality model. They are ’objects’ inthe sense of the ’Component Software’ philosophy. It is important for the user to know thatthere are 2 modes for the processes:
1 They are switched on automatically by D-Water Quality with internal inference rules.2 They are switched on by the user.
Because of unwanted side effects, method 1 is hardly used any more and this manual willassume the use of method 2.The user generally starts the PLCT (Process Library Configuration Tool). That is part of theGraphical User Interface. This is a multi-level user interface to select substances, processesand process steering that will be provided by the user rather than using the defaults for theprocess. The PLCT also enables the selection of candidate extra output variables. These aregenerally intermediate computations (like total biomass, total suspended solids etc. from thefractions). They can also be meaningful derived variables like Chlorophyll, whereas the pro-cesses library models algae as Carbon and Secchi depth whereas the model uses extinctioncoefficients.The result of the PLCT selection process is a readable ’*.sub’ file. This file is ingested by theuser interface. In the user interface the user attaches his process steering to the items thatwere selected with the PLCT. In the user interface the user also selects which of the candidateoutput variables he really wants to include in what output files. The user interface generatesa D-Water Quality input file. This documentation describes the process steering part of theD-Water Quality input file with the aim to allow the user to modify this section of the input file,using options that are not available through the user interface. It is generally very useful tohave an existing input file or a user interface produced input file as starting point. It is verytedious to construct this part of the input file without using the PLCT, because the *.sub fileas produced by the PLCT will list the processes IDs, the substance IDs and the IDs of theselected input and output variables by their reserved character string. The only alternative isto select them manually by running through the technical reference manual of the processeslibrary and copying the IDs that are mentioned there into the input file. It is advised to onlyuse the manual for details on specific processes rather than to construct this section of theinput file fully from the manual.
Deltares 55 of 90

DRAFT
D-Water Quality, User Manual
7.2 Steering items
The D-Water Quality input file distinguishes four different types of items:
� CONSTANTSThese are single values that act during the whole simulation for each computational gridcell. Constants are generally used to provide the model with coefficients like partitioningcoefficients for micropollutants. They are also used to provide the model with switches,flags and settings that may influence the computational procedure.
� PARAMETERSThese are items that retain there value during the whole simulation but that may be differ-ent per grid cell. The elevation of the bed below reference level could be an example.
� FUNCTIONSThese are items that have the same value for all grid cells, but that may vary during thecourse of the simulation. The annual pattern of solar radiatiation on the model may be anexample of this type of input.
� SEG_FUNCTIONSThese are items that vary in time and that may have different values per grid cell. Theyare called ”segment function“ in D-Water Quality terminology. This is huge informationfor a detail 3D model with many time steps. This information is generally produced byother software and attached as a file to this simulation. The temperature, salinity andsuspended sediment concentration as computed by the hydrodynamic model are of thistype, but also the vertical diffusion coefficient from the hydrodynamic model, that will beused in the D-Water Quality simulation is of this category.
It is important to realize that any steering item for process behavior can be any of these fourtypes. For one simulation the temperature can be fixed both in time and all over the place. Itwill then be among the CONSTANTS. For another simulation it can be prescribed as an annualtime function that is the same for each grid cell. It will then be among the FUNCTIONS in theinput. For yet another simulation a spatial field of temperature values can be used and youwill see it in the PARAMETERS input part. The temperature steering can also vary per timestep and per grid cell and be among the SEG_FUNCTIONS. An example for the latter is e.g.the temperature file that is computed by a 3D hydrodynamic stratification model. Which typeof input is used for a certain simulation is up to the user, the processes library automaticallydeals with any selection the user makes.A steering item can also be part of the D-Water Quality simulation, the water depth of agrid cell is an example, but also the temperature can be computed by D-Water Quality itselfrather than being provided as external steering. If this is the case the user does not needto do anything, D-Water Quality automatically attaches the model information to the process.For temperature this means that de D-Water Quality modeled temperature is used unlesstemperature is specifically provided as external steering by the user. In the latter case, theuser specification of the external steering overrules the presence as state variable.
56 of 90 Deltares

DRAFT
Process steering
7.3 Data blocks
To assist the user, it is possible to provide the model steering in data blocks. Each datablock contains just one type of data, so either CONSTANTS, PARAMETERS, FUNCTIONS, orSEG_FUNCTIONS. You can provide as many data blocks as you want, so it is possible to groupcertain functions by providing them in 1 block, or to supply them each in their own block.The order of the information in the input file does not matter. It is possible to start with ablock of segment functions to continue with a block of parameters, to provide a block of con-stants and then again to provide a block of segment functions. Because you can use theINCLUDE <filename> directive anywhere in the file, you can use a separate file with steer-ing coefficients from different sources of information, like meteorology or a certain measureddataset. In the following the 4 types of data blocks will be documented further.
7.3.1 CONSTANTS
To enter constants, you write CONSTANTS in the file. Then you write the IDs of the items thatyou want to provide as constants. The IDs must correspond exactly with the reserved namesof the processes library, but they are not case sensitive. In the most simple case a collectionof IDs is followed by the keyword DATA and then the values of the constants follow. You willfind for example input like:
CONSTANTSSWresusalgSWAdsPKdPO4AAPMaxPO4AAPRcAdPO4AAPpH
DATA1.00000e+000 ; SWresusalg0.00000e+000 ; SWAdsP1.00000e+000 ; KdPO4AAP5.00000e-003 ; MaxPO4AAP5.00000e-001 ; RcAdPO4AAP8.20000e+000 ; pH
But since you can insert an arbitrary number of data blocks, you could equally well use:
CONSTANTS SWresusalg DATA 1.00000e+000CONSTANTS SWAdsP DATA 0.00000e+000CONSTANTS KdPO4AAP DATA 1.00000e+000CONSTANTS MaxPO4AAP DATA 5.00000e-003CONSTANTS RcAdPO4AAP DATA 5.00000e-001CONSTANTS pH DATA 8.20000e+000
If the specified constants are resolved, the D-Water Quality input processor requires either akeyword that starts the next data block or the #7 to end this group of input.
7.3.1.1 Special constants
There are some special constants. Some of them are only checked for their presence, so thenthe value of the constant plays no role. Others are used to give D-Water Quality one or morevalues that are used in its simulation process without affecting the water quality processes.The special constants are listed here:
� constants that switch processes onIf the constant ONLY_ACTIVE is present in the list of constants, then D-Water Quality is
Deltares 57 of 90

DRAFT
D-Water Quality, User Manual
using only those processes that are explicitly switched on. Otherwise D-Water Qualitytries to figure out itself which processes it will switch on. This automatic procedure hashowever a number of unwanted side effects so it is hardly used any more. Processes areswitched to ’on’ furthermore by the presence of a constant ACTIVE_proc_name. It doesnot matter what value is attached to the constant. The presence of the constant alonewill switch the process ’on’. The constants in the sample input on constants are importantfor processes associated with adsorbed and soluble phosphorus (AAP and PO4). So youshould not be surprised to see in the list of constants also entries like:
CONSTANTS ONLY_ACTIVE DATA 1.0CONSTANTS ACTIVE_AdsPO4AAP DATA 1.0CONSTANTS ACTIVE_Sed_AAP DATA 1.0CONSTANTS ACTIVE_Res_AAP DATA 1.0
In most applications you will see that a data value of 1.0 is used, but the exact value doesnot matter. So also with the value of 0.0 the processes are switched to ’on’. It may begood practice for the readability of the input file, to use 1.0 for the ’on’ switching. If youwant to swicth a process ’off’ temporary but leave the entry in the input file, then you justinsert a comment character at the beginning of that line.
� closure error switchIf the hydrodynamic files are exhausted and the simulation continues, then D-Water Qual-ity automatically rewinds the hydrodynamic files. Because the model volume at the endof the dataset may not equal to the model volume at the start, an inconsistency arises.The default approach to this inconsistency is that D-Water Quality preserves mass. Thismeans that you see that the time series of concentration values make a ’hiccup’ becauseof the discontinuous volume. If the CLOSE_ERR constant is present however, the timeseries of concentration values will remain smooth and D-Water Quality adapts the massto cause a smooth concentration curve behavior. The amount of volume that has to beadded or removed at the rewind of the hydrodynamic datasets in this case is displayed inthe monitoring file. This feature may give rise to severe errors if a grid cell was temporarydry at the start and wet at the end of the hydrodynamic database or the reverse.
� constants associated with implicit solversA number of constants are associated with implicit solvers. Here they are listed togetherwith their default values.
CONSTANTS swprecond DATA 3.0 ; preconditionerCONSTANTS maxiter DATA 100.0 ; max nr iterationsCONSTANTS tolerance DATA 1.0D-7 ; toleranceCONSTANTS swscale DATA 1.0 ; row scalingCONSTANTS novec DATA 50.0 ; Krilov space sizeCONSTANTS "iteration report" DATA 1.0 ; iteration report
The default for preconditioner is "lower and upper" tridiagonal, other values are 0 for "none"and 1 or 2 for "lower" or "upper" alone. The default for row scaling is ’on’. Use 0.0 to switchit ’off’. The Krilov space size may prevent the model to fit in 2GB of memory. The valuemay then be reduced to 25. It is not advisable to reduce it further. The default for theiteration report is ’on’ and output is written to the monitoring file, but in many input you willfind this constant with the value 0.0 and then it is switched ’off’ to avoid bulky output.
� Parallel computingD-Water Quality supports parallel computing on multi core PCâAZs. This feature is gen-erally switched ’off’. If you are confident with your model, you may switch it ’on’ by giving:
CONSTANTS nothreads DATA 0.0 ; OMP-parallelism 'on'
With a value of 0.0 D-Water Quality will itself determine how many threads can be used.With a positive value you determine the number of threads. The default is -1.0 whichmeans ’off’. Implicit solvers need a Krilov space for each thread. This can become largefor e.g. 6 core PCâAZs with hyper-threading featuring 12 threads. Then you better use asmaller positive number for the number of threads than the allowed number of 12 that youwill get with a value of zero.
58 of 90 Deltares

DRAFT
Process steering
� Z-layer model processingHydrodynamic models in 3 dimensions using strictly horizontal layers, so called Z-layers,may feature a water surface that travels through layer interfaces when water level rises orfalls like in dammed lakes. You will then need:
CONSTANTS ACTIVE_Emersion DATA 1.0 ; switches process 'on'CONSTANTS ZThreshold DATA 0.01 ; threshold in m.
This switches the Emersion process on. This process joins the top layer with the layerunderneath if layer thickness is lower than ZThreshold and makes the new layer the toplayer. At flooding the reverse happens. If the thickness is over ’ZThreshold’ more than thethickness of the layer underneath, then a new top layer is formed. If you are not using thisprocess, unpredictable results may occur for incomplete water columns.
� Z-layer model initial conditionsIt is difficult, especially for bigger models, to manually specify initial conditions for bedvariables in Z-layer models, because you generally do not know at what level the first wetcell appears. The solution is to specify initial conditions for bed variables (non-transportedsubstances) in the lowest layer irrespective of whether it is below the bed or not. Further-more you specify the constant Z_Thresh with a value of e.g. 0.001. Then all cells with awaterlayer thickness of 1 mm or below will be considered located below the bed. Thosecells are set inactive, the initial condition is set to zero and the specified value is migratedupward until the first wet cell of the water column is reached.
� Drying and floodingThe way a hydrodynamic model administrates its drying and flooding is sometimes not fullyclear to D-Water Quality. To ensure some basic safety, D-Water Quality has itself also adrying and flooding detection mechanisms to ensure that the volume of its computationalcells will not fall to zero or even below zero. D-Water Quality will use a default thresholdof 0.001 m or 1 mm. Below this water level a cell is considered to have ran dry. You canchange this default value by specification of a constant with the name DRY_THRESH andgiving it a value other than 0.001. The value is multiplied with the value of the horizontalsurface area of the horizontal computational cells to obtain the threshold per water collumnlocally in m3. If no constant or segment function with the name SURF is found, then D-Water Quality cannot determine the threshold volume in m3 by multiplication with SURF.For that situation the value of the constant DRY_THRESH is directly interpreted as a value inm3 and the default value if no constant DRY_THRESH is found amounts to 1.0 m3. Pleasenote that the procedure is used for the whole water column, so not for the cell at one layer.This reflects the fact that either the water column ran dry locally or it is wet. Except forZ-models (see the item above), individual cells in a 3D model cannot run dry, the columndoes.
� Time step multiplier for the BLOOM processThe algae competition module BLOOM is generally operated on longer time spans than theremainder of the water quality processes. For many water quality processes a time stepsize of half an hour would do. A common time step size for the BLOOM process is a day.This requires:
CONSTANTS TimMultBL DATA 48.0 ! factor from 0.5 hour to a day
You should be aware that when you need this constant that you have to adapt the constantas soon as you are changing the integration time step size for the other processes.
7.3.2 PARAMETERS
The keyword PARAMETERS is followed by a list of one or more parameter IDs. The IDs mustcorrespond exactly with the reserved names of the processes library, but they are not casesensitive. If later on column headers are used and/or the parameter values are modified bycomputational instructions, then the USEFOR construct as described for boundaries and wasteloads also applies here. This list ends if a reserved keyword is met. Valid reserved keywords
Deltares 59 of 90

DRAFT
D-Water Quality, User Manual
are:
� DEFAULTS, ALL, SEGMENTS, INPUTGRIDThese keywords are associated with definition of the way the data will be attached to thecomputational cells, the segments.
� DEFAULTSWith this keyword it is expected that for each parameter one value will follow. Thisvalue will be used for all segments.
� ALLWith this keyword it is expected that for each parameter and each segment a value willbe given.
� SEGMENTSWith this keyword it is expected that a list of segment numbers will follow for which theparameter values will be specified.
� INPUTGRIDWith this keyword it is expected that the name of an earlier defined grid is mentioned.The parameter values will be given for the cells of this grid and will then be expandedto other grids when needed by D-Water Quality.
� BINARY_FILE or UNFORMATTEDThis keyword indicates that the mentioned parameters will be retrieved from a binary fileor an unformatted file (which is a binary file with special FORTRAN compiler dependingstructure of records). This keyword should be followed by the file name. The parametersare expected to be located in the file in the order of their appearance in the list that wasjust closed by the keyword. First all parameters for computational cell 1 are expected, thenall for cell 2 etc.
� BIG_ENDIANThis keyword indicates that the binary file or unformatted file has its data in BIG_ENDIANstructure. This structure is common for files on mainframe computers and on some mas-sive parallel computers. BIG_ENDIAN files are also produced by the TELEMAC hydrody-namic models.
� ODS_FILEThis is a sort of self descriptive proprietary Deltares file format that is not further docu-mented here. This keyword should be followed by the file name of the file.
� DATAThis keyword starts data entry. It will produce an error if not first the segments are definedwhere the parameters will be given for. So first one of the keywords ALL, DEFAULTS,SEGMENTS, INPUTGRID is expected with associated additional information if that isneeded for the keyword.
� For DEFAULTS, as many values are expected as there are parameters in this block.� For SEGMENTS, all parameters of this block are expected for all segments that were
mentioned by number after the SEGMENTS keyword.� For INPUTGRID, all parameters of this block are expected for all segments of the men-
tioned input grid.� For ALL, all parameters of this block are expected for all segments of the model grid.
This is the biggest file and is often produced by the hydrodynamic model or by the userinterface, but you could of course yourself also specify 2345*3.1 9380*2.8 2345*2.4for 1 parameter in a 6 layer model with 14070 grid cells.
Like with boundary conditions and loads, the data may be preceded by column headers dis-playing the names of the columns in the input file. If information comes from a binary orunformatted file, then the parameters are expected in the order in which they are mentionedin this block. First all parameters for segment 1, then all parameters for segment 2 etc.
60 of 90 Deltares

DRAFT
Process steering
A sample input for a parameters block can e.g. consist of:
PARAMETERSSurfBottomdept
ALLBINARY_FILE BIG_ENDIAN '..\data\Bodensee.par'
but also of:
PARAMETERS 'fixth' INPUTGRID 'sediment-zone'DATA 0.001 ; layer 1
0.002 ; layer 20.003 ; layer 30.006 ; layer 40.018 ; layer 50.07 ; layer 60.1 ; layer 7
PARAMETERS 'SURF'INPUTGRID 'water-grid' BINARY_FILE 'surf.par'
PARAMETERS 'SURF'INPUTGRID 'sediment-grid' DATA INCLUDE 'surf-sediment.dat'
Note that by the last 2 specifications the water-grid gets its horizontal surfaces from a filecoming through the user interface from the hydrodynamic model and that additionally thehorizontal surfaces of the much coarser sediment-grid with the layered water bed come froma readable ASCII file that is included here.
7.3.3 FUNCTIONS
The keyword FUNCTIONS is followed by a list of one or more function IDs. The IDs mustcorrespond exactly with the reserved names of the processes library, but they are not casesensitive. If later column headers are used and/or the function values are modified by com-putational instructions, then the USEFOR construct as described for boundaries and loads alsoapplies here. This list ends if a reserved keyword is met. Valid reserved keywords are:
� LINEAR, BLOCKThese keywords indicate the interpolation mechanism to be used for the functions be-tween the specified points. BLOCK is the default procedure, so that keyword is superfluous.
� HARMONICSThis keyword indicates that harmonic functions will be specified. These functions are notinterpolated, but analytically evaluated according to:
ft = faverage +n∑
i=1
(amplitudei · sin
((t
periodi− phasei
)· 2π
))� FOURIERS
This keyword indicates that Fourier functions will be used. These functions are not in-terpolated, but analytically evaluated. The analytical formula is the same as for har-monics with the distinction that there is a base period for the first component and thatperiodi = baseperiod/i with i the component number.
� TIME_DELAYThis keyword indicates that the times of the functions specified should be delayed with acertain amount of time. It is followed by the time delay value that is an integer in unitsof the system clock (generally seconds) or an integer in DDDHHMMSS or YYDDDHH format
Deltares 61 of 90

DRAFT
D-Water Quality, User Manual
if that format was previously selected for input of times. The time delay value allows theuse of unaltered datasets from other years or months for the model years or months. Thealternative would be to edit the time strings in those files to make them fit for the differentyear. It should be anticipated that a day could be lost or should be interpolated at the endof some February months.
� BINARY_FILE, UNFORMATTED, ODS_FILEThese keywords are not common for functions and they are even not allowed if the use ofHARMONICS or FOURIERS is specified.
� DATAThis keyword starts data entry. Expected is:
� optional column header strings for the columns that will follow. De input processor willthen select the appropriate columns and will skip the non used columns.
� for normal time series specified at breakpoints, the input processor expects a se-quence of:
◦ a time integer or an absolute calendar time string◦ the function values at that time in the order of the list of this block or according to
the column headers
� for HARMONICS functions, the input processor expects:
◦ the faverage values for the functions in the order of the list of this block.◦ as many sets of input as there are harmonic components with:
. a time interval integer for this harmonic component in units of the system clockgiving the periodi of harmonic component i.
. a real value between 0 and 1 or between -0.5 and +0.5 for phasei of thisharmonic component with respect to the start of simulation
. the amplitudei values of this harmonic component for the functions in theorder of the list of the block
� for FOURIERS functions, the input processor expects a sequence of:
◦ a time interval integer in units of the system clock giving the baseperiod of thisFourier series.
◦ the faverage values for the functions in the order of the list of this block.◦ as many sets of input as there are Fourier components with:
. a real value between 0 and 1 or between -0.5 and + 0.5 for phasei of thisFourier component with respect to start of simulation
. the amplitudei values of this Fourier component for the functions in the orderof the list of the block
Data entry ends when either a keyword is met that opens a new input block or when the#7 is met to end this group of input.
62 of 90 Deltares

DRAFT
Process steering
7.3.4 SEG_FUNCTIONS
The keyword SEG_FUNCTIONS is followed by a list of one or more segment-function IDs. TheIDs must correspond exactly with the reserved names of the processes library, but they arenot case sensitive. This list ends if a reserved keyword is met. Valid reserved keywords are:
� LINEAR, BLOCKThese keywords indicate the interpolation mechanism to be used for the segment-functionsbetween the specified points. BLOCK is the default procedure, so that keyword is superflu-ous.
� TIME_DELAYThis keyword indicates that the times of the functions specified should be delayed with acertain amount of time. It is followed by the time delay value that is an integer in unitsof the system clock (generally seconds) or an integer in DDDHHMMSS or YYDDDHH formatif that format was previously selected for input of times. The time delay value allows theuse of unaltered datasets from other years or months for the model years or months. Thealternative would be to edit the time strings in those files to make them fit for the differentyear. It should be anticipated that a day could be lost or should be interpolated at the endof some February months.
� BINARY_FILE, UNFORMATTED, ODS_FILEThese keywords are very common for segment-functions because these are generallygenerated by other models. These keywords are generally followed directly by the filename of the file, but it is also possible to specify BIG_ENDIAN to indicate that the file iswritten with that file structure.
� MULTIPLEHYD_FILE followed by the file name of such a file. See the annex of this manualfor the description of multiple hydfiles.
� DATAASCII input of segment-function time series specified at breakpoints is rare, because thisinformation is generally voluminous. Should it nevertheless occur then the input processorexpects a sequence of:
� a time integer or an absolute calendar time string� the function values at that time in the order of the list of this input block. Unlike e.g.
parameters, this data is required as: for all computational segments the values ofsegment function 1; for all computational segments the values of segment function 2;.... etc.
Data entry ends when either a keyword is met that opens a new input block or when the#7 is met to end this group of input.
7.3.5 Multiple copies of substances
If the feature of multiple copies of substances is used, then all process data is duplicatedautomatically. You can however also specify fraction specific steering like in:
CONSTANTS VsedIM1 DATA 1.0 ; holds for all fractions except:CONSTANTS VsedIM1*IM102 DATA 2.0 ; specific for fraction 02
7.4 Finalization
This part of the input file is finalized with the #7 end of 7th data group indicator.
Deltares 63 of 90

DRAFT
D-Water Quality, User Manual
64 of 90 Deltares

DRAFT
8 Initial conditions
This is the eighth group in the input file. This input group may read like:
0 ; initials from binary restart filelpr001_res.map ; name of the restart file
#8 ; delimiter for the eighth group of input
This is old-style input to start from a restart file. It could also be:
MASS/M2 ; The bed substances are specified in mass/m22 ; Input with defaults
23*1.0 ; Scale values; Continuity Salinity im1 im2 oxy nh4 etc.
1.00 24.00 5.00 0.00 6.50 0.15 ...2 ; number of overridings
13816 ; first overriding1.00 0.00 15.0 0.00 8.00 1.20 ...23456 ; second overriding1.00 0.00 5.0 0.00 9.00 0.40 ...
This is old-style input to start from a set of prescribed initial values with exceptions for 2 cells.It could also be new style input especially suitable for models with a layered water-bed:
MASS/M2 ; bed substances in mass/m2INITIALS Continuity Salinity im1 im2 oxy nh4 etc.INPUTGRID water-zone ; this grid was defined in input group 3DATA 1.00 24.00 5.00 0.00 6.50 0.15 ...
INITIALSContinuity Bulkvolume Salinity im1 im2 oxy nh4 etc.INPUTGRID
sediment-zone ; this grid was defined in input group 3DATA
1.00 1.00 24.00 3.44E05 2.29E05 0.05 0.01 ... ; layer 11.00 1.00 24.00 3.66E05 2.44E05 0.05 0.01 ... ; layer 21.00 1.00 24.00 3.86E05 2.57E05 0.05 0.01 ... ; layer 3
#8 ; delimiter for the eighth group of input data
8.1 General
Initial conditions should be given for all modeled substances and all computational volumes(segments). The initial conditions are given as a concentration value for all active substancesthat are transported with the water. D-Water Quality itself uses masses of the substancesas state variables and the concentrations of the state variables are derived entities for outputprocessing and for the evaluation of water quality process kinetics. This means that D-WaterQuality will multiply the initial concentration values with the volumes of the segments to initial-ize its state variables for simulation. D-Water Quality also contains inactive substances thatare not transported with the water because they are located on the water bed or because theyare part of the layered water bed. In the past the latter type of substances had to be initializeddirectly by their mass per computational volume. That was very cumbersome because com-putational volumes could differ and are largely unknown to the user. The user is just usingthe output of a hydrodynamic model for volumes, areas and flows. Not so long ago this issuewas resolved by using the unit mass/m2 as ’concentration’ unit for these non-transportedsubstances.
Deltares 65 of 90

DRAFT
D-Water Quality, User Manual
A second major change in the processing of initial conditions was a consequence of thelayered bed model. Now the user can define a layered bed underneath the water phase. Butsince the geometry of the water phase is generally determined by the hydrodynamic modelthat produces the water flows and turbulences, additional geometry needs to be defined forthe bed. That is done in group 3 of the input file by the definition of a grid within the bed thatis linked with the overlying water grid. In this group 8 of the input file we will see how variableswithin that grid in the water bed are initialized.
8.2 Old specification
This specification is not convenient for the layered bed model, but may still be convenient forsimpler models.
� The MASS/M2 directive (optional)This directive is only useful if your simulation contains also passive, non-transported sub-stances. With the directive you say that you will provide initialization for these substancesin in the form of mass/m2 rather than as mass/gridcell. The directive does not workfor binary files (see below).
� An integer file switch (obliged)This switch can have two values:
0 for an external binary fileThis external binary file can be:
� A so-called .ini fileThis is an older type of initial condition file that is no longer produced, but maystill be available as remnant from older runs. The file just contains a matrix ofreal numbers. D-Water Quality assumes that any passive substances in this fileare given asmass/gridcell because that was common when the file was written(most likely by the user interface.
� A so-called .res fileThis file is still produced as restart file by D-Water Quality | itself. It will be phasedout soon and it is advised to not use this file any more. Produced by the newer D-Water Quality releases this file will contain the passive substances as mass/m2.Produced by the older releases it contains the passive substances asmass/gridcelland is identical to the .ini file.
� The runID_res.map fileThis file is now produced. It contains information that allows you to check its con-tent with any graphical postprocessor of D-Water Quality results, because it is astandard D-Water Quality simulation result file with only one time step included: theresult at ’end-of-simulation’. This file is presently also produced by the user inter-face and it contains information that allows D-Water Quality also to identify whetherthe passive substances are initialized as mass/m2 or as mass/gridcell. Anynecessary conversion is performed automatically.
1 for the ASCII input fileThis ASCII input file will contain:
� The TRANSPOSE directive (optional)This directive allows the specification of the matrix of initial conditions in inter-changed row - column order.
� An integer switch (required)This switch can have two values:
1. for input without default valuesThis integer should be followed by a scale value for each of the substances inthe order that was mentioned in group 1 of the input data.
66 of 90 Deltares

DRAFT
Initial conditions
Then for all substances in the order that was mentioned in group 1 valuesshould be given for all segments. First all values for segment 1, then all valuesfor segment 2, ... and so on. For small models with not too many substances,this is still possible by e.g.:
1 ; Input without defaults23*1.0 ; Scale values
; Continuity Salinity im1 im2 oxy nh4 etc.1.00 24.00 5.00 0.00 6.50 0.15 ........ ..... .... .... .... .... ...1.00 24.00 5.00 0.00 6.50 0.15 ...
But for larger models with numerous grid cells, you may want to say:
TRANSPOSE1 ; Input without defaults
23*1.0 ; Scale values23764*1.00 ; Continuity23764*24.0 ; Salinity23764*5.00 ; im123764*0.00 ; im223764*6.50 ; Oxy23764*0.15 ; NH4
2. for input with default values e.g.
2 ; Input with defaults23*1.0 ; Scale values
; Continuity Salinity im1 im2 oxy nh4 etc.1.00 24.00 5.00 0.00 6.50 0.152 ; number of overridings
13816 ; first overriding1.00 0.00 15.0 0.00 8.00 1.2023456 ; second overriding1.00 0.00 5.0 0.00 9.00 0.40
8.3 New specification
The more modern approach to providing initial conditions with ASCII input may still start withthe MASS/M2 keyword to indicate that the bed substances are given in weight per m2 ratherthan in weight per grid cell. The new specification itself then starts with the INITIALS keyword.This keyword triggers similar procedures as the PARAMETERS keyword in group 7 of input datadoes. This is best illustrated with the following example from a model with layered bed:
INITIALSContinuity Salinity im1 im2 oxy nh4 etc.INPUTGRID
water-zone ; this grid was defined in input group 3DATA
1.00 24.00 5.00 0.00 6.50 0.15 ...
INITIALSContinuity Bulkvolume Salinity im1 im2 oxy nh4 etc.INPUTGRID
sediment-zone ; this grid was defined in input group 3DATA
; layer 11.00 1.00 24.00 3.44E05 2.29E05 0.05 0.01 ...
; layer 21.00 1.00 24.00 3.66E05 2.44E05 0.05 0.01 ...
; layer 31.00 1.00 24.00 3.86E05 2.57E05 0.05 0.01 ...
Deltares 67 of 90

DRAFT
D-Water Quality, User Manual
Here 2 input blocks are given, one acting for the 1 cell ’water-zone’ and a second one acting forthe 3 cell ’sediment-zone’ that were defined in group 3 of the input file. These initial conditionsare expanded automatically by D-Water Quality to all the grid cells that are contained in thementioned zones. This example illustrates why this way is more convenient especially for thelayered bed approach .Both ways are likely to be continued in future releases, because once a simulation is madeusing a layered bed model, it remains convenient to initialize the next simulation simply with:
0 ; initials from binary restart filelpr001_res.map ; name of the restart file
#8 ; delimiter for the eighth group of input
8.3.1 Multiple copies of substances
If the feature of multiple copies of substances is used, then for each copy an initial conditionmust be provided. This is facilitated by the new input structure through e.g.:
INITIALSSalinityNO3USEFOR Diat01 Diatoms * 0.25USEFOR Diat02 Diatoms * 0.25USEFOR Diat03 Diatoms * 0.50
DATA Salinity NO3 Diatoms16.0 1.0 0.5
8.4 Z-layer models
Z-layer models feature strictly horizontal layers, unlike sigma layer models that divide thewater column in a certain fixed ratio. This means that the lowest water layer in sigma modelsis always the layer where the water bed is located. In Z-layer models this depends on thelocal water depth. It is difficult to specify initial conditions that are related to the presence ofthe water bed in Z-layer models, because detail knowledge is required on where the bed islocated in every water column. To avoid problems, you just specify your initial conditions ofZ-layer models for the cells with a water bed just as if you specified the initial condition for asigma layer model, in the lowest model layer. You furthermore specify a constant Z_Threshin your group 7 input with a value for the thickness in meters below which a cell should beconsidered dry. The D-Water Quality run-time processor will then start with migrating yourprescribed values to the first wet cell from beneith in each column and zero out everythingbelow. If you specify a restart file as initial condition then this problem will not occur of course,since then the restart values are defined in the correct cell and the run-time processor neednot do anything. This automatic elevation of initial conditions is only performed for inactivesubstances.
8.5 Finalization
This part of the input file is finalized with the #8 end of eighth data group indicator.
68 of 90 Deltares

DRAFT
9 Model output
This is the ninth group in the input file. Input in this group may read like:
1 ; output information in this file2 ; all substances and extra output for the monitoring file
11 ; number of extra variables'NH3' 'volume''BOD5' 'volume''TotalDepth' 'surf''Chlfa' 'volume''SS' 'volume''DisCu' 'volume''TotN' 'volume''DIN' 'volume''TotP' 'volume''SURF' ' ''LocalDepth' 'surf'0 ; no output is required for the dump file2 ; all substances and extra output for the history file
11 ; number of extra variables'NH3' 'volume'
....'LocalDepth' 'surf'2 ; all substances and extra output
11 ; number of extra variables'NH3'......
'LocalDepth'1 ; binary history file 'on'1 ; binary map file 'on'0 ; nefis history file 'off'0 ; nefis map file 'off'
#9 ; delimiter for the ninth group of input data
9.1 General
D-Water Quality is able to produce a number of output files. The contents of some of themcan be steered with this input section. The time steps and / or time spans that are used forthe output files are given in group 2 of the input file. There the start time, stop time and timestep size of 3 types of files are given through:
� the monitoring file timer� the map file timer� the history file timer
These timers will be called mon-timer, map-timer and his-timer respectively There are moreoutput files, but they all use one of these 3 timers.This group of the input file steers the information that will be displayed in the files. By defaultall concentrations of modeled substances are part of the output in a file. The concentrationsare expressed in mass/m3 for the transported substances and in mass/m2 for the passivesubstances. It is however also possible to add information that is computed by the waterquality processes to the output files. Obviously useful extensions can be non-modeled derivedquantities like Chlorophyll (the model models individual algae species in mgC/l) or Secchidepth. Especially in the set-up phase of a water quality model it is useful to also write outputon intermediate computation results like the actual growth and mortality of the algae species,which is light and temperature dependent. This information is useful to check whether themodel acts as expected. Once production simulations have to be conducted these entries
Deltares 69 of 90

DRAFT
D-Water Quality, User Manual
can be removed from the output files if there is no specific interest for them any more. Theinformation that is added to the output files is added in exactly the same way as the modeledsubstances. In this way it is possible to make time series graphs, color contour graphs or3D graphs of added variables as if they were modeled substances. Using the PLCT to selectwater quality processes and model inputs that will be available for external steering, it is alsopossible to view and select the quantities that can be added to the output files.This is not the only location where the content of output files is determined:
� The keyword section of group 2 of the input file contains a number of directives to switch onthe production of mass balance information. These directives may trigger the productionof additional output to standard output files and the production of separate files with outputof mass balance information. Although not directly steered by the input in this group, theywill nevertheless be briefly described here.
� The monitoring area and monitoring transects section of group 2 of the input file allowsthe definition of other monitoring locations than just a simple cell. The definition of theseareas and transects determines for which spatial locations additional output of time historydata will be given. The output will be added to the monitoring file and to the history file.
� Group 10 of the input data deals with on-line statistics on variables. In this group it ispossible to define a number of statistics that have to be computed during the simulation.The results of these statistics are saved either in the regular output files or in additionaloutput files that are described in that section of the manual.
At the moment of the writing of this manual, two types of output files are produced by D-Water Quality the propiatary binary output files and the NEFIS files. The latter are a sort ofNetCDF file that stems back from a time that NetCDF did not exist yet. Deltares is now in aprocess to migrate its output to NetCDF and is also part in the active international discussionon standards in this respect. These standards are not trivial for the staggered grids; for theunstructured grids that can be both node-centered and cell centered and for the arbitraryshaped computational volumes that are supported by D-Water Quality. It is to be expectedthat D-Water Quality will be among the first products of Deltares that will shift towards NetCDFby dropping its NEFIS file output in favor of the newer standard.
9.2 Output files
D-Water Quality simulations have the following output files generated at run time:
1 the monitoring file (the .mon file)This is a user readable output file with:
� echo of simulation settings.� diagnostic run-time messages.� error messages as generated at run-time.� global system mass balance.� readable output of concentration values of state variables at the monitoring locations
and additional variables at monitoring time steps.� optional readable output of mass balances for monitoring areas. For multi cell monitor-
ing areas it is essential to have the correct weighing option set for your mass balancesvariables. The options are ’ ’ (none), ’volume’ and ’surf’. Option ’surf’ has to be usedfor output per m2, option ’volume’ has to be used for output that is expressed per m3.
The monitoring file start, stop and step timings are given values in input group 3.The monitoring areas to write concentrations and generate balances for are defined ininput group 3.
2 the grid-topology output file (the .dmp file)This is a user readable output file with concentration values of the selected substances
70 of 90 Deltares

DRAFT
Model output
printed in a user defined spatial pattern to reflect spatial phenomena.The grid-topology output file uses the start, stop and time step information of the map file.
3 the history output file (the .his file)This is a binary output file that is readable using the standard graphical post processingsoftware of D-Water Quality. It contains time series at selected monitoring areas andmonitoring transects of concentration values and additional output variables. Also for thehistory file it is important to have the correct weighing option from ’volume’ ’surf’ and none(’ ’)The history file start, stop and step timings are given values in input group 3.The monitoring areas to write concentrations and additional output variables for are givenin input group 3.
4 the map output file (the .map file)This is a binary output file that is readable using the standard graphical post processingsoftware of D-Water Quality. It contains complete fields of concentrations and additionaloutput variables for the selected time steps.The map start, stop and step timings are given values in input group 3.
5 the balances output file (the -bal.his file and the -bal.prn file)This is a user readable output file and a binary output file that is readable using the stan-dard graphical postprocessing software of D-Water Quality. They contain all mass bal-ances terms of the selected monitoring areas for the model concentrations.The balances output file uses the start, stop and time step information from the monitoringfile.
6 the NEFIS history file (the .hda and .hdf files)This file is equivalent with the binary history file and it uses the same timings. It is to besuperseded by a NetCDF file version of the history file.
7 the NEFIS map file (the .ada and .adf files)This file is equivalent with the binary map file and it uses the same timings. It is to besuperseded y a NetCDF file version of the map file.
8 the statistical output map file (the -stat.map file)This file has exactly the same structure as the binary map file. It starts to be processedat simulation start time, it stops at simulation stop time and uses the simulation time step.The file contains spatially distributed statistical data that is defined in the group 10 of theinput file. The data is computed on the fly and may result in spatial fields of exceedencefrequencies, time averaged values, standard deviations etc.
9 the statistical monitoring file (the -stat.mon file)This is a user readable output file with statistical characteristics of the simulation thatare not spatially distributed. It starts to be processed at simulation start time, it stops atsimulation stop time and uses the simulation time step.
10 the restart file (the .res file and the _res.map file discussed in the group 8 input section)It is to be expected that the writing of the _res.map file will be discontinued soon.
11 a -timers.out file that may assist in the analysis of computational performance of thesimulation.
Deltares 71 of 90

DRAFT
D-Water Quality, User Manual
9.3 Additional output variables
By default the output files 1 - 4 from above list contain the concentrations of all modeled sub-stances, either per m3 for transported substances, or per m2 for non-transported substanceslaying on the bed. It is however possible to add additional output variables to these four files.These additional output variables are defined in this ninth group of the input file. The input ofthis group consists of:
� an integer that can be:
-1 external input fileThis is a remnant from the past and is equivalent with the INCLUDE directive. Thename of an external file is expected after this ’-1’.
1 continue with this input file
If the integer is missing and directly #9 follows, then this group is absent and default outputprocessing (only modeled substances and their balances) will take place.
� for each of four output file types:
� the monitoring file� the grid topology output file� the history file� the map file
the following information is required that starts with an integer option number that can be:
0 no output is required for this file1 default action is required for this file (output of modeled substances only)2 the default output is required plus the items that are mentioned in the following listing3 only the items that are mentioned in the following listing are required
The listing that should follow for integer values 2 and 3 consists of:
� the number of additional variables� for each of the additional variables:
◦ the reserved ID of the variable (this is the ID that is also mentioned in the PLCTselection screen for output variables)
◦ ONLY for the monitoring and the history file, so the first and the third file:The string to indicate how to weigh the variable if it is aggregated for multiple cells.Valid strings are:
. an empty string ' ', no specific weighing applied.
. Volume to indicate that the aggregate should be weighed by volume. Advisedfor history files and transported substances.
. Surf to indicate that the aggregate should be weighed by horizontal surfacearea of the grid cell. Advised for history files and passive substances laying onthe bed.
� for each of the four main binary output files an integer 1 when the file should be written or0 when the file must not be written.
9.4 Finalization
This part of the input file is finalized with the #9 end of ninth data group indicator.
72 of 90 Deltares

DRAFT
10 Statistical output
This is the tenth group in the input file. This input group may read like:
version 3 minor 28
period 'annual'suffix 'ann'start-time '1997/01/01-00:00:00'stop-time 'STOP'
end-period
period 'dry season'suffix 'dry'start-time '1997/01/01-00:00:00'stop-time '1997/04/10-00:00:00'
end-period
output-operation 'STADAY'substance 'Salinity'suffix ''time-parameter 'TINIT' 'START'time-parameter 'PERIOD' '0000/00/01-00:00:00'
end-output-operation
output-operation 'STAQTL'substance 'OXY'suffix 'p10'real-parameter 'CQLEV' 10real-parameter 'NOBUCK' 20real-parameter 'CLOBND' 0real-parameter 'CUPBND' 10
end-output-operation
output-operation 'STADSC'substance 'OXY'suffix ' '
end-output-operation
output-operation 'STADPT'substance 'OXY'suffix ' '
end-output-operation
output-operation 'STAGEO'substance 'EColi'suffix 'geo'real-parameter 'THRESH' 1
end-output-operation
#10 ; delimiter for the tenth group of input data
10.1 General
It is always possible to conduct statistics with the output files of D-Water Quality simulations.You may read them and compute average values, standard deviations and percentiles of theconcentrations that you read. Besides the fact that this will necessitate you to write computerprograms yourself with all associated inconveniences, it may also be that the data in the filesare too sparse to conduct sensible statistics with. If you want to identify spatial patterns ofaverage values, standard deviations and excess percentiles, then the only suitable dataset isthe binary .map file. One complete record in the map file is already as large as the number ofsubstances and additional variables times the number of computational cells. This may be a
Deltares 73 of 90

DRAFT
D-Water Quality, User Manual
large amount and you may feel forced to limit the frequency of writing .map files. But then youalso limit the frequency of available data for statistical analysis.To support you somewhat with your statistical analysis it is possible to let D-Water Qualitycompute summary statistics on the fly, using every time step of the simulation, also those thatare not written to file. Input group 10 contains the input needed to use this facility. The inputhas two distinct parts:
� Definition of time intervals for statistical evaluations� Definition of the statistics wanted, together with for some of them the required and optional
coefficients
The statistical input may be preceded by the definition of a version number and a versionsub-number after the VERSION and the MINOR keywords respectively.
10.2 Definition of time intervals
The definition of time intervalsStatistics!intervals has to follow the following rules:
� They are enclosed by the PERIOD and the END-PERIOD keywords� Any number of time intervals may be defined, but you must be aware that all intervals are
used by all the statistics that work on intervals.� Intervals have a name that is specified immediately after the PERIOD keyword.� Intervals may have a suffix or abbreviation. This suffix is essential and should be unique
if you have multiple intervals. It is added to the name of the output variable to allowfor identification. The suffix should be brief, because otherwise the name of the outputvariable will run out of space. The suffix is specified by the keyword SUFFIX followed bythe suffix itself.
� Intervals may have a start time string following the keyword START-TIME. The defaultvalue for the start time is the start-of-simulation. This default value can also be specifiedby the user stating that the start time string is START.
� Intervals may have a stop time string following the keyword STOP-TIME. The default valuefor the stop time is end-of-simulation. This default value can also be specified by the userstating that the stop time string is STOP.
All specified intervals are applied for all the statistical procedures that work on intervals.
10.3 Supported statistical procedures
The following statistical evaluations are supported:
� Periodic averagesInvoked with the keyword STADAYThe result is a time function that is updated at the end of the period. It is saved in theD-Water Quality binary and NEFIS map and history output files.This statistic requires two TIME-PARAMETER strings:
� a TINIT with default value START� a PERIOD for the average.
These statistics are evaluated for the complete modelling period since TINIT.� Depth average, minimum and maximum
Invoked with the keyword STADPTThe resulting three statistics are added to the D-Water Quality binary and NEFIS map andhistory output files and are identical in these files for all layers.These statistics are evaluated for the complete modelling period.
74 of 90 Deltares

DRAFT
Statistical output
No further input is required.� Maximum, Minimum, Mean and Standard deviation values
Invoked with the keyword STADSCThe resulting four statistics per period are written to a separate -stat.map and -stat.monfile.These statistics are evaluated for all defined periods in this input group.No further input is required.
� Excess frequencies and Geometric means with and without threshold valueInvoked with the keyword STAGEOThe resulting three statistics per period are written to a separate -stat.map and -stat.monfile.These statistics are evaluated for all defined periods in this input group.The statistic requires a REAL-PARAMETER called THRESH, a threshold below which the dataare omitted.
� Excess frequencies and Average during excessInvoked with the keyword STAPRC.The resulting two statistics are written to a separate -stat.map and -stat.mon file.These statistics are evaluated for all defined periods in this input group.The statistic requires two parameters:
� a REAL-PARAMETER called THRESH, the excess threshold.� a LOGICAL-PARAMETER called ABOVE that can have value ’yes’ if frequency and av-
erage above threshold should be computed and value ’no’ if frequency and averagebelow threshold should be computed.
� QuantilesInvoked with the keyword STAQTLThe resulting quantile per period is written to a separate -stat.mon file.These statistic is evaluated for all defined periods in this input group.This statistic requires four REAL-PARAMETERS:
� a CLOBND followed by the expected lower bound value of the data.� a CUPBND followed by the expected upper bound value of the data.� a NOBUCK followed by the number of buckets or baskets to use between the bounds.� a CQLEV followed by the quantile level whose value is sought.
10.4 Definition of statistical procedures
The definition of statistical procedures has to follow the following rules:
� They are enclosed by the OUTPUT-OPERATION and the END-OUTPUT-OPERATION key-words.
� Any number of statistical procedures may be defined.� Statistical procedures have an ID that is one of STADAY; STADPT; STADSC; STAGEO; STAPRC
and STAQTL.� Statistical procedures have a substance ID where they work on. The substance ID is
defined after the keyword SUBSTANCE.� Statistical procedures may have a suffix or abbreviation. This suffix is essential and should
be unique if you have multiple occurrences of the substances in the statistical procedures,because it is added to the name of the output variable to allow for identification. The suffixshould be brief, because otherwise the name of the output variable will run out of space.The suffix is specified by the keyword SUFFIX followed by the suffix itself.
� Statistical procedures may have steering variables. These variables may be of the typeREAL-PARAMETER; TIME-PARAMETER or LOGICAL-PARAMETER. The type is followed by thereserved parameter name (see the section on supported statistical procedures) and bythe value of the parameter.
Deltares 75 of 90

DRAFT
D-Water Quality, User Manual
10.5 Statistical output files
The thus computed statistical information is:
� Added to the D-Water Quality binary and Nefis map and history file for
� periodic averages STADAY.They will have the 5 letter prefix TAVG_.
� depth averages STADPT.They will have the 7 letter prefix DPTAVG_, DPTMIN_, and DPMAX_
� Written to a separate D-Water Quality binary and Nefis -stat map file and the ASCIImonitoring file for
� Maximum, Minimum, Mean and Standard deviation STADSC.They will have the prefix MIN_, MAX_, MEAN_ and STDEV_.
� Excess frequencies and Geometric means with and without threshold value STAGEO.They will have the prefix T_GEO_, GEO_, ALL_GEO_ respectively.
� Excess frequencies and Average during excess STAPRC.They have NO prefix and CMN_ respectively as prefix.
� Written to a separate D-Water Quality ASCII monitoring file for
� Quantiles STAQTL.They have NO prefix.
10.6 Finalization
This part of the input file is finalized with the #10 end of tenth data group indicator.
76 of 90 Deltares

DRAFT
11 Annexes
11.1 Time tokens
You often need to specify times to D-Water Quality:
� for the start and stop time of the time integration.� for the start and stop time of writing certain output files.� for the times of breakpoints in a specified time series for:
� for time series of hydrodynamic inputs if not generated by a hydrodynamic model.� for time series of concentrations at open boundaries.� for time series of loads of substances through rivers and outfalls.� for time series of process steering functions or segment functions.
� for the start and stop times of run-time statistics evaluation.
You may also need to provide time step sizes to D-Water Quality:
� for the integration procedure.� for the writing of output files.� to specify time lags or time delays.
You can provide times to D-Water Quality in 2 ways:
� as an integer:This integer is interpreted according to the specifications in group 1 as:
� The system time (generally in seconds)� According to the DDHHMMSS format� According to the YYDDDHH format
The disadvantage of this procedure is that a year will always have 365 days.The advantage of this procedure is that it is independend of the actual calendar period ofyour model simulation and allow the input to be reused for other cases, irrespective of theactual calendar dates of the simulation.This integer input is the only way to provide time step information to D-Water Quality.
� as a string:This string should obey exact formatting rules and looks like:
2010/07/31-12:00:00
This format is only allowed if the Calendar offset in the 4th title string in group 1 is specified.D-Water Quality will convert such a title string in relative system times using the followingprocedure:
� The time string is converted to a so-called Julian date� The Julian date of the Calendar offset is subtracted from this value� The difference is converted to relative system time units
The important advantage of this procedure is that months and years have their correctamounts of days and that you can input real dates.
If other input than an integer or a valid calendar time string is provided, several things canhappen:
� If a real value is encountered then either:
� A context dependent path is chosen to interpret the real value in a sensible way, like a
Deltares 77 of 90

DRAFT
D-Water Quality, User Manual
concentration or a coefficient if the local context allows such an item to appear at thatlocation in the file.
� An error is produced stating that a real value was found whereas an integer or a stringwas expected. This happens if a real value cannot appear according to the localcontext of the file.
� If a string is encountered that does not equal to a valid calendar time string, then either:
� A context dependent path is chosen to interpret the string in a sensible way, like thename / ID of a substance or of a coefficient if the local context allows such an item toappear at that location in the file.
� An error is produced stating that the string read was not a valid calendar time string.This happens if a string value cannot appear according to the local context of the file.
Be aware that:
� the system time values are stored in a 32-bits signed integer and can thus only run from-68 years to +68 years.
� the DDHHMMSS format has a highest value of 231 = 2147483648 or 5 years of 365 days and322 days, 48 hours, 36 minutes and 48 seconds.
� the YYDDDHH format is only limited by the -68 to +68 years time window.
11.2 Hydrodynamic input� The input of hydrodynamic data for all segments (the volumes) or for all exchange surfaces
(the areas, flows, velocities and dispersions) starts with an integer option number:
-4 A so called MULTIPLE_HYD file will be used.
� optionally the keywords UNFORMATTED and BIG_ENDIAN are allowed to indicate thespecific structure of the binary files that will be used in this description.
� an integer indicating the number of lines that should be read from the multiple hydfile.
� an integer interpolation option in time, between the records in the files with 1 is nointerpolation and 2 is linear interpolation
� an identification string for this type of data like ’volumes-file’, ’areas-file’, ’flows-file’or ’vert-diffusion-file’. This string should correspond exactly with the file that is tobe used from the files that are listed in the .hyd file. Also for the salinity, temper-ature chezy coefficients, shear stresses or suspended sediments as computed bythe hydrodynamic model it is possible to follow this procedure by mentioning thecorresponding keyword from the .hyd file.
� the name of the multiple hyd file to be used.
-2 A binary external file will be used that will be interpolated between its records. This op-tion number can optionally be followed by the keywords UNFORMATTED and BIG_ENDIANand should be followed by the file name to be used.
-1 This is the same as the INCLUDE directive (its ’old-style’ predecessor) that should befollowed by and ASCII input file name to switch input processing to.
0 A binary external file will be used with one time step per record. This file will not be in-terpolated. This option number can optionally be followed by the keywords UNFORMATTEDand BIG_ENDIAN and should be followed by the file name to be used.
1 ASCII input will follow in this file.
Any other option number will result in an error message. If the option number was zero,then the input is done. The information will be read from the specified file. Input is alsodone if the option number was -4 or -2 and the subject of this reading was not dispersions.
� If dispersions are to be read, the following is required:
78 of 90 Deltares

DRAFT
Annexes
� three real values as scale factors for the dispersions in the three directions.� three real values that contain the yet unscaled values of the dispersions in the three
directions.
� ASCII input if the first option was -1 or 1This input starts with a data option number:
1 Information is constant and input will be provided without defaults:For all of the three directions that have non-zero number of exchanges the followingshould be provided:
� A scale factor for this direction.� A matrix of data with as columns (fastest running index) the number of values to be
read per volume or exchange with for each of the number of volumes or exchangesin this direction a row with the unscaled values.
The scale factor is applied to all specified values in its direction.2 Values are constant and input will be provided using default values:
For all of the three directions that have non-zero number of exchanges the followingshould be provided:
� A scale factor for this direction.� For each of the required values per volume or exchange, an unscaled default value.� A number of overridings (exceptions to the default settings) plus that many sets of:
◦ An exchange number that should be overriden with the exceptional values.◦ For each of the required values per volume or exchange an unscaled excep-
tional value.
The scale factor is applied to all specified default values and exceptional values in itsdirection.
3 Information comes as time functions:Now for all volumes or exchanges time functions are specified through ASCII inputfor all required values. This happens using the standard ’old-style’ feature for inputprocessing of time functions that is hardly used any more. The input is structured ininput blocks that all start with an integer option number:
1 Information in this block is given at breakpoints as a block function (no linearinterpolation)
� an integer giving the number of items (exchange numbers or segment num-bers for hydrodynamics) that will be contained in this input block.
� the item numbers of the items that are contained in this input block.� an integer giving the number of breakpoints� a real value for each required scale value. For hydrodynamic data generally
1 scale value is required per direction in the grid (so certainly also per inputblock).
� then for each breakpoint:
◦ either an absolute time string, or a time integer indicating the time stampof this breakpoint.
◦ a matrix with values per breakpoint.The matrix has 1 column for the reading of volumes, areas and flows.It has 2 columns for the reading of the ’from’ and ’to’ lengths and it hasas much columns as there are additional velocity and dispersion arraysspecified for the reading of additional velocities and dispersions.The rows in the matrix are the items that are contained in this input block.
2 Information in this block is given at breakpoints, interpolation will be linear.
Deltares 79 of 90

DRAFT
D-Water Quality, User Manual
The input structure and type of input information for this option is exactly equalto that of option 1.
3 Information in this block is given as a set of harmonic functions.
� an integer giving the number of items (exchange numbers or segment num-bers for hydrodynamics) that will be contained in this input block.
� the item numbers of the items that are contained in this input block.� an integer giving the number of harmonic components that will be read, ex-
clusive of the zeroth component, the average value of the series.� for each item in this block the average value of the harmonic series.� for each harmonic component:
◦ an integer period of the harmonic component (in units of the systemclock).
◦ a real value giving the phase of this component.This real value can be between -0.5 and +0.5 with no phase shift at value0.0. It can equally well be between 0.0 and 1.0 with no phase shift atvalues 0.0 and 1.0. This does not matter because the harmonic functionis cyclic and the phase shift is expressed as fraction of the period of thecomponent.
◦ a matrix with amplitude values of the component.The matrix has 1 column for the reading of volumes, areas and flows.It has 2 columns for the reading of the ’from’ and ’to’ lengths and it hasas many columns as there are additional velocity and dispersion arraysspecified for the reading of additional velocities and dispersions.The rows in the matrix are the items that are contained in this input block.
4 Information in this block is given as a Fourier series.
� an integer giving the number of items (exchange numbers or segment num-bers for hydrodynamics) that will be contained in this input block.
� the item numbers of the items that are contained in this input block.� an integer giving the number of Fourier components that will be read, exclu-
sive of the zeroth component, the average value of the series.� an integer giving the base period, the period of the first Fourier component� for each item in this block the average value of the Fourier series� for each Fourier component:
◦ a real value giving the phase of this component.This real value can be between -0.5 and +0.5 with no phase shift atvalue 0.0. It can equally well be between 0.0 and 1.0 with no phase shiftat values 0.0 and 1.0. This does not matter because the Fourier functionis cyclic and the phase shift is expressed as fraction of the period of thecomponent.
◦ a matrix with amplitude values of the component.The matrix has 1 column for the reading of volumes, areas and flows.It has 2 columns for the reading of the ’from’ and ’to’ lengths and it hasas much columns as there are additional velocity and dispersion arraysspecified for the reading of additional velocities and dispersions.The rows in the matrix are the items that are contained in this input block.
80 of 90 Deltares

DRAFT
Annexes
11.3 Multiple hyd file
It can be convenient to compose a hydrodynamic scenario from single simulations. One coulde.g. have a simulation for a typical dry monsoon sprin-neap tide period and a wet monsoonspring-neap tide period. D-Water Quality rewinds the hydrodynamic dataset if the simulationlasts longer than the dataset. At some moment the dry season may shift into a wet seasonand then one would want D-Water Quality to shift to a different input file. For this reasonthe multiple hyd file feature was developed. It allows the construction of a hydrodynamicscenario by stating from which simulation time which hydrodynamic dataset has to be usedwith which time delay, to control the phasing in tide and spring-neap cycle. The set of filesthat form together a hydrodynamic dataset are generally described in an ASCII .hyd file likeis produced by Delft3D-FLOW or Telemac. This means that a multiple hyd file just needs torefer to these .hyd files. An example is in a real-life marine application:
1.0 1996/12/02-05:00:00 1997/05/01-15:00:00 1996/12/02-07:00:00 'com-92d.hyd'0.5 1997/05/01-15:00:00 1997/05/31-17:00:00 1996/12/02-05:00:00 'com-92d.hyd'0.5 1997/05/01-15:00:00 1997/05/31-17:00:00 1996/05/31-17:00:00 'com-92w.hyd'1.0 1997/05/31-17:00:00 1997/07/30-21:00:00 1996/05/31-17:00:00 'com-92w.hyd'0.5 1997/07/30-21:00:00 1997/08/29-23:00:00 1996/12/02-05:00:00 'com-92d.hyd'0.5 1997/07/30-21:00:00 1997/08/29-23:00:00 1996/05/31-17:00:00 'com-92w.hyd'1.0 1997/08/29-23:00:00 1998/01/01-00:00:00 1996/12/02-05:00:00 'com-92d.hyd'
The example says that:
� With weight factor 1.0
� From 1996/12/02-05:00:00 to 1997/05/01-15:00:00� Files from ’com-92d.hyd’ (dry season) are used� Starting from the time in the file of 1996/12/02-07:00:00
In the first line of this example the starting point in the file is 2 hours later than the startof the file. This starting point in the file gives opportunity to adjust the periodicity suchthat e.g. a high water of the preceding period connects to a high water of the followingperiod. If the files are rewound during a period, then they are rewound towards thestart time of the file again.
� During a 30 days + 2 hour transition period in May, 0.5 * the dry season files ’92d’ and 0.5* the wet season files ’92w’ are used.
� During June and July the wet season files only are used.� During August again a transition period of both type of files with 0.5 / 0.5 weight factors is
used.� From late August to the end of the year the dry season files only are used again.
There are two special weight factors available:
-1.0 these files will linearly diminish in weight from 1.0 to 0.0 during the period.0.0 these files will linearly increase in weight from 0.0 to 1.0 during the period.
The reference to the multiple hyd file starts with 2 integers in the calling input file:
� The number of lines to be used in the multiple hyd file (would be 7 in our example).� The interpolation option that can be:
0 for block wise interpolation in time (flows and areas).1 for linear interpolation in time (volumes).2 for linear interpolation of the logarithms of the file values block wise in time (vertical
diffusions).
Deltares 81 of 90

DRAFT
D-Water Quality, User Manual
3 for linear interpolation of the logarithms of the file values both between files and intime.
A number of remarks should be made:
� It is the responsability of the user to figure out that the water level at the end of a specifiedperiod, more or less is in concert with the water level at the start of the next period. Thiscan be done by a judicious choice of the start time in the mentioned files for the nextperiod.
� Within each period, the files are rewound and reused with the same scale value if end-of-file is reached during the period.
� At the end of the period the description for the next period is used.� Should the simulation extend beyond the specification periods in the multiple hyd file, then
the whole multiple hyd file is rewound and executed again.� For a check it is strongly advised to output at several locations the time series of water
levels for inspection.� Both if rewound and if specifications change, the presence of the CLOSE_ERR constant
determines whether the concentration will show a (small) jump or whether the mass willdo.
11.4 Binary file that are directly read by D-Water Quality
Binary filesare very efficient to read. That is why D-Water Quality allows the input from bulkybinary files that are written e.g. by the hydrodynamic model that produced flow fields. Manyscientific software is written in a flavor of the FORTRAN programming language. This makes itvery likely that your binary input files for D-Water Quality are written by FORTRAN. The ANSIstandard for that language however does not support binary files. FORTRAN supports unfor-matted files. These are also very efficient to read but they have record information includedin the file. This record information is compiler specific so although a standard exists for theunformatted file in the FORTRAN language, the contents of that file may vary per implementa-tion. If you are using the same compiler for your hydrodynamic program as was used for ourD-Water Quality source code, then there are not so much problems. Before mentioning thename of your binary file in the input file you just give the keyword UNFORMATTED and D-WaterQuality will open and read the file as an unformatted file. If you are using a very recent com-piler, you may open and write your hydrodynamic files with the ACCESS = 'STREAM' optionin your source code. That is more or less equivalent with the binary files that D-Water Qualityis reading normally.
Binary files consist of bit patterns indicating the numbers rather than readable characters.There are several bit patterns around to write integer and real numbers. D-Water Quality isusing the IEEE standard with ’little endian’ layout of the bytes. That is the common layout onPC type of processors. Main frames and workstations may be equiped with processors thatuse the ’big endian’ layout of bytes. If you are facing those files you may also use the keywordBIG_ENDIAN before you specify the name of the binary file to be read by D-Water Quality.
In the following a documentation of the contents of the binary files that are directly read byD-Water Quality is given. This specification also mentions the batches of data that D-WaterQuality reads from them separately. This would normally not be of importance. As long asyou have written your data in the same order in the binary file, then it does not matter in whatchunks D-Water Quality reads them. This is however not the case for unformatted files. Theycontain record information and the chunks used for reading need to be exactly identical tothe chunks used for writing. To support you with that the specification contains the readingprocedure.
82 of 90 Deltares
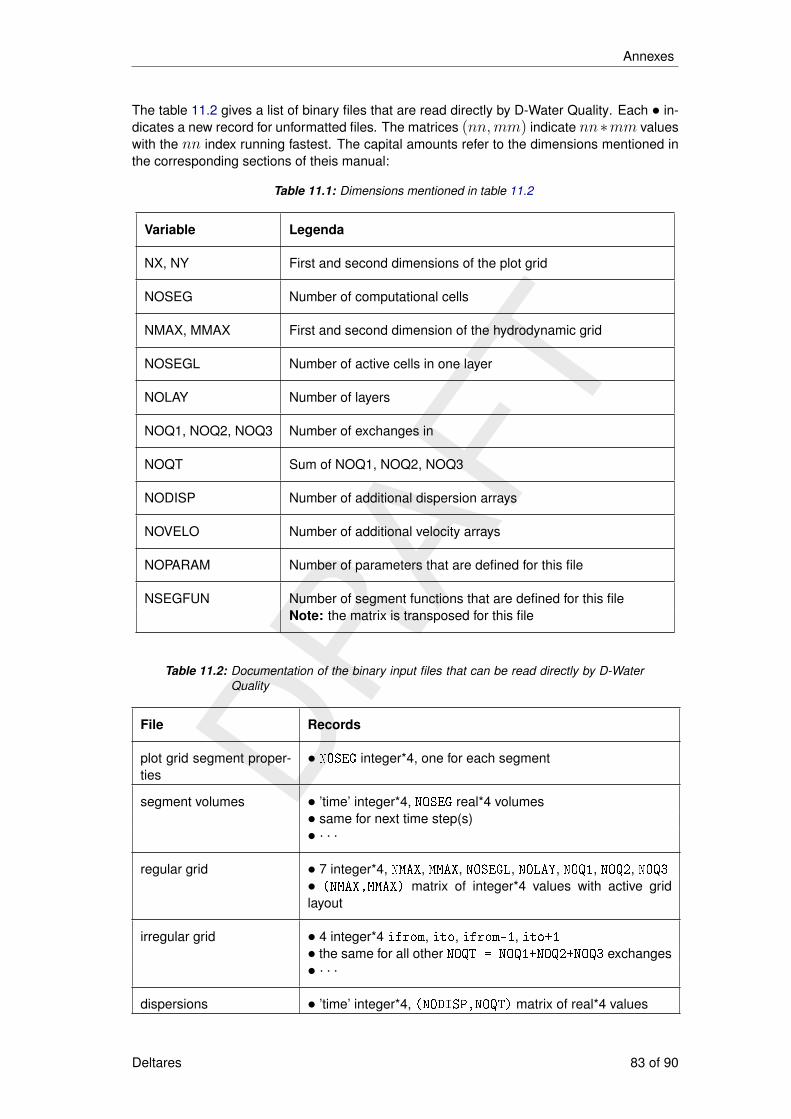
DRAFT
Annexes
The table 11.2 gives a list of binary files that are read directly by D-Water Quality. Each • in-dicates a new record for unformatted files. The matrices (nn,mm) indicate nn∗mm valueswith the nn index running fastest. The capital amounts refer to the dimensions mentioned inthe corresponding sections of theis manual:
Table 11.1: Dimensions mentioned in table 11.2
Variable Legenda
NX, NY First and second dimensions of the plot grid
NOSEG Number of computational cells
NMAX, MMAX First and second dimension of the hydrodynamic grid
NOSEGL Number of active cells in one layer
NOLAY Number of layers
NOQ1, NOQ2, NOQ3 Number of exchanges in
NOQT Sum of NOQ1, NOQ2, NOQ3
NODISP Number of additional dispersion arrays
NOVELO Number of additional velocity arrays
NOPARAM Number of parameters that are defined for this file
NSEGFUN Number of segment functions that are defined for this fileNote: the matrix is transposed for this file
Table 11.2: Documentation of the binary input files that can be read directly by D-WaterQuality
File Records
plot grid segment proper-ties
• NOSEG integer*4, one for each segment
segment volumes • ’time’ integer*4, NOSEG real*4 volumes• same for next time step(s)• · · ·
regular grid • 7 integer*4, NMAX, MMAX, NOSEGL, NOLAY, NOQ1, NOQ2, NOQ3• (NMAX,MMAX) matrix of integer*4 values with active gridlayout
irregular grid • 4 integer*4 ifrom, ito, ifrom-1, ito+1• the same for all other NOQT = NOQ1+NOQ2+NOQ3 exchanges• · · ·
dispersions • ’time’ integer*4, (NODISP,NOQT) matrix of real*4 values
Deltares 83 of 90

DRAFT
D-Water Quality, User Manual
File Records
• same for next time step(s)• · · ·
flows • ’time’ integer*4, NOQT real*4 values• same for next time step(s)• · · ·
exchange areas • ’time’ integer*4, NOQT real*4 values• same for next time step(s)• · · ·
velocities • ’time’ integer*4, (NOVELO,NOQT) matrix of real*4 values• same for next time step(s)• · · ·
exchange lengths • ’time’ integer*4, (2,NOQT) matrix of real*4 values• (1,:) = dx for left/1st cell to interface• (2,:) = dx for interface to right/2nd cell• same for next time step(s)• · · ·
parameters • (NOPARAM,NOSEG) matrix of real*4 values
segment functions • ’time’ integer*4, (NOSEG,NSEGFUN) matrix of real*4 values• same for next time step(s)• · · ·
84 of 90 Deltares

DRAFT
IndexActive
cells, 29, 32, 83exchanges, 32grid, 28, 35, 83processes, 57substances, 3, 9, 43, 48, 65
Advection-diffusion equation, 3, 29, 37Aggregation file, 23Attributes, 28
Binary files, 4, 8, 27, 34, 60, 66, 73, 78, 82,83
Blank lines, 5Block interpolation, 29, 45, 52, 61Boundary, 41
cell, 34concentrations, 43conditions, 2, 41, 48ID, 42name, 42time lags, 43type, 42
Calendardates, 45, 52offset, 8, 16, 77reference time, 8, 12, 45, 52time string, 8, 12, 53, 62, 77
Characterblank, 12comment, 5, 7, 17, 23embedded, 8, 44, 50input, 5line length, 7separation, 16string, 55token, 53
Closing token, 1Closure error, 48, 50
correction, 58Column headers, 5, 44, 51, 53, 59, 62Comment character, 5, 7, 17, 23, 58Computational
cells, 23, 29, 31, 37core, 4grid, 21performance, 71volumes, 4, 17, 21, 27, 31, 39, 65, 70
Constants, 2, 4, 5, 25, 56, 57special, 57, 82switches, 57
Dataadditional, 69
ASCII input, 2available, 74blocks, 44, 50, 57bulky table, 5constant, 79Fourier series, 80grid mapping, 23harmonic functions, 80hydrodynamic flow, 1, 30, 35interpolation, 79matrix of, 45missing, 50numerus equal, 5option, 79readability of, 9statistics, 73time function, 79
Diagnosticslevels, 5, 8output, 5
line length, 7run time, 70simulation settings, 70
DIDO grid tool, 17Dispersion, 2
across boundaries, 14additional, 3, 14, 34array, 32, 79at zero flow, 14coefficients, 35constant, 32horizontal, 36ID, 5input, 78processes, 36through process library, 36vertical, 36
Dissolved, 3Dry cells, 14, 28, 29
drying threshold, 59temporary, 58Z-layers, 59
Errorsclosure, 48, 58round off, 11run time, 70
Exchanges, 2, 4, 31area, 4areas, 37flows, 38lengths, 33number of, 33
Deltares 85 of 90

DRAFT
D-Water Quality, User Manual
pointers, 34surface, 34
File.sub, 55aggregation, 23ASCII input, 1, 4, 7, 17big endian, 34, 60binary, 34, 60history, 19include, 5, 22interpolated, 78listing, 42, 48little endian, 34map, 18monitoring, 18multiple hyd, 30ODS, 46, 60output, 3, 7, 55sample input, 1type options, 78unformatted, 34, 60
Finite Volume Method, 4Finite Volumes Method, 41, 47Floating point, 5Flows, 1, 2, 4, 14, 29, 31, 32, 38, 41, 47,
49, 50Flux, 3, 10, 14
advective, 14correction, 14, 41diffusive, 14, 33, 37, 38, 48exchange, 32net, 18vertical, 37
Free formatted, 4Function, 2, 4, 5, 56, 61, 77
block, 61breakpoints, 17Fourier, 61harmonic, 61linear, 61segment, 36, 48, 56, 63Thatcher Harleman, 43time, 56, 74
Graphical User Interface, 9, 17, 23, 48, 55Grid, 21
active, 35base, 21bottom, 22, 66cell, 6, 8, 17, 32, 50, 56, 67computational, 21definition, 23direction, 35
full matrix, 32hydrodynamic, 23input, 24, 60layered sediment, 22layers, 22layouts, 5model, 19multiple, 22printed, 26processes, 22, 23rectilinear, 33reference, 23regular, 33, 35structured, 1, 35sub-grid, 22tool DIDO, 17topology, 70unstructured, 1, 37unstuctured, 31water, 66
Group, 2
History filebinary, 71NEFIS, 71timer, 19, 69
Horizontal surface area, 59Horizontal surface area, 37, 48, 59, 72
Include, 5, 27directive, 5, 35, 57, 72, 78file, 5, 17, 22, 29, 53, 57nesting, 5
Initial conditions, 65Z-layer models, 59
INITIALS keyword, 67Input
block, 43, 49, 62, 68computations, 45, 51
Input file, 1, 4, 7, 12, 23first form, 32form, 32line length, 7second form, 39version number, 7
Input group, 1Integers, 5Integration
option, 12procedure, 12start time, 16stop time, 16time step, 16, 59
constant, 17
86 of 90 Deltares

DRAFT
INDEX
variable, 17timers, 16, 30
Interpolationblock, 29, 45, 52, 61linear, 29, 45, 49, 61
Iteration of implicit solvers, 58
Julian date, 77
Keywords, 5
Layered bed, 22, 23, 61, 65, 66, 68Lengths, 33, 38, 79Linear interpolation, 29, 45, 49, 52, 61, 78,
81
Map file, 73, 76binary, 71NEFIS, 71timer, 18, 69
Mass balancesboundaries, 42file, 71global system, 70keywords, 13, 70loads, 48readable output, 70
MASS/M2, 8, 65Midpoints of cells, 38Monitoring
areas, 17, 70locations, 6, 17transects, 18, 70
Monitoring filecontents, 70timer, 18, 69
Multiplecopies of substances, 9, 46, 52, 63, 68hyd file, 30, 37, 63, 78, 81
NOSEG, 29, 83NOSYS, 9NOTOT, 9
ODS files, 46, 52, 60Output files, 69
additional data, 69binary, 70NEFIS, 70NetCDF, 70start time, 19stop time, 19time step, 19timers, 18variables, 55
Parallel computing, 28, 58Parameters, 4, 37, 48, 56Particle tracking, 15Particulate, 3, 38Performance timers file, 71PLCT, 2, 55, 70Processes, 3, 22, 55
constants, 25, 56functions, 56, 77library, 3, 9, 10, 32, 36, 45, 51, 55output, 3parameters, 56segment functions, 56switching ’on’, 55, 57timestep, 26transport, 3, 38water quality, 3, 9, 11, 27
Quotes, 5, 8, 42, 44, 50
Repeated input, 5Restart file, 66, 71
Scale factors, 46, 52Sediment layers, 24Segment functions, 4, 36, 37, 48, 56, 83Segments, 4, 21, 29, 60, 63, 65, 78Solver, 4, 9, 21, 33, 48, 58State variables
readable output, 70Statistics, 70, 73
analysis, 74data, 73definition, 74depth, 74
average, 74min-max, 74
excess, 75average, 75frequency, 75geometric mean, 75
filebinary, 71readable, 71
intervals, 74min-max, mean, stdev., 75on the fly, 74percentiles, 73periodic average, 74quantiles, 75spatial patterns, 73version number, 74version sub-number, 74
Steady state, 9String variable, 5
Deltares 87 of 90

DRAFT
D-Water Quality, User Manual
Substances, 3, 9, 17, 23, 25, 26, 48, 50,65
active, 3, 9, 34, 43, 65column header, 45ID, 9, 75inactive, 3, 9, 21, 48, 65, 68multiple, 9, 46, 52, 63, 68names, 9particulate, 38passive, 3, 9transported, 3, 9
Surf, 37, 48, 50, 59, 70System time, 8, 11, 77Systems, 9
Tabs, 1Technical reference manual, 55Time
absolute, 8, 53, 62, 63, 79breakpoints, 17, 62, 63, 77, 79integer, 12, 17, 62, 63, 77, 79maximum value, 12, 78series, 17, 29, 43, 45, 49–51, 58, 62,
63, 70, 77, 82string, 8, 12, 45, 52, 62, 77tokens, 30, 77
Timers, 11auxiliary, 11DDHHMMSS format, 11, 77factor, 11
integration, 16, 30model, 11output, 19, 69process, 11strings, 11YYDDDHH format, 12, 77
Tokens, 1, 5, 8, 10, 30, 44, 45, 50, 53, 77TRANSPOSE directive, 66
Unformatted files, 34, 35, 60, 63, 78, 82User interface, 2, 7, 9, 55, 61, 66
Velocities, 2, 38additional, 4, 32, 34, 38, 79computed, 37in cell midpoints, 37
Volumes, 2, 4, 21, 29, 31, 39, 65, 78, 81amount of, 21, 29file, 30values, 30
Water bed, 3, 9, 10, 21, 31, 48, 65, 68Water column, 3, 68
bottom, 28top, 28
Word processor, 1
Z-layer models, 68drying and flooding, 59initial conditions, 59
88 of 90 Deltares

DRAFT

PO Box 1772600 MH DelftRotterdamseweg 1852629 HD DelftThe Netherlands
+31 (0)88 335 81 [email protected]
Photo by: Mathilde Matthijsse, www.zeelandonderwater.nlDRAFT