d ruse galactic continuum gamma rays. model … · ruse galactic continuum gamma rays. a model...
TRANSCRIPT

D
Submitted
Ruse Galactic Continuum Gamma Rays. A model compatible with EGRET data and cosmic-ray
measurements
Andrew W. Strong
Max-Planck-Institut fur extraterrestm’sche Physik, Postfach 1603, 0-85740 Garching, Germany
aws@mpe . mpg . de --__I~
\ /---- ----- Igor V. Moskalenkol I \--- 1
NASA/Goddard Space Flight Center, Code 661, Greenbelt, MD 20771
and
Olaf Reimer
Ruhr- Universitat Bochum, 0-44 780 Bochum, Germany
ABSTRACT
We present a study of the compatibility of some current models of the diffuse Galactic continuum y-rays with EGRET data. A set of regions sampling the whole sky is chosen to provide a comprehensive range of tests. The range of EGRET data used is extended to 100 GeV. The models are computed with our GALPROP cosmic-ray propagation and gamma-ray production code. We confirm that the “conventional model” based on the locally observed electron and nucleon spectra is inadequate, for all sky regions. A conventional model plus hard sources in the inner Galaxy is also inadequate, since this cannot explain the
‘Joint Center for Astrophysics, University of Maryland, Baltimore County, Baltimore, MD 21250
https://ntrs.nasa.gov/search.jsp?R=20040081223 2018-08-15T02:22:42+00:00Z

- 2 -
GeV excess away from the Galactic plane. Models with a hard electron injection spectrum are inconsistent with the local spectrum even considering the expected fluctuations; they are also inconsistent with the EGRET data above 10 GeV.
We present a new model which fits the spectrum in all sky regions adequately. Secondary antiproton data were used to fix the Galactic average proton spectrum, while the electron spectrum is adjusted using the spectrum of diffuse emission it- self. The derived electron and proton spectra are compatible with those measured locally considering fluctuations due to energy losses, propagation, or possibly de- tails of Galactic structure. This model requires a much less dramatic variation in the electron spectrum than models with a hard electron injection spectrum, and moreover it fits the y-ray spectrum better and to the highest EGRET energies. It gives a good representation of the latitude distribution of the y-ray emission from the plane to the poles, and of the longitude distribution. We show that sec- ondary positrons and electrons make an essential contribution to Galactic diffuse y-ray emission.
Subject headings: diffusion - cosmic rays - ISM: general - Galaxy: general - gamma rays: observations - gamma rays: theory
1. Introduction
Diffuse continuum y-rays from the interstellar medium are potentially able to reveal much about the sources and propagation of cosmic rays (CR), but in practice the exploitation of this well-known connection is problematic. While the basic processes governing the CR propagation and production of diffuse y-ray emission seem to be well-established, some puzzles remain. In particular, the spectrum of y-rays calculated under the assumption that the proton and electron spectra in the Galaxy resemble those measured locally reveals an excess above 1 GeV in the EGRET spectrum (Hunter et al. 1997).
The Galactic diffuse continuum y-rays are produced in energetic interactions of nucleons with gas via neutral pion production, and by electrons via inverse Compton (IC) scattering and bremsstrahlung. These processes are dominant in different parts of the spectrum, and therefore if deciphered the y-ray spectrum can provide information about the large-scale spectra of nucleonic and leptonic components of CR. In turn, having an improved under- standing of the Galactic diffuse y-ray emission and the role of CR is essential for unveiling the spectra of other components of the diffuse emission and is thus of critical importance for the study of many topics in y-ray astronomy, both Galactic and extragalactic.

, .
- 3 -
The puzzle of the “GeV excess” has lead to an attempt to re-evaluate the reaction of .Iro-production in pp-interactions. However, a calculation made using modern Monte Carlo event generators to simulate high-energy ppcollisions has shown (Mori 1997) that the y- ray flux agrees rather well with previous calculations. A flatter Galactic nucleon spectrum has been suggested as a possible solution to the “GeV excess” problem (Gralewicz et al. 1997; Mori 1997). Explaining the excess requires an ambient proton spectrum power-law index of about -2.4-2.5, compared to -2.75 measured locally (for a summary of recent data see Moskalenko et ai. 2002). Such large variations in the proton spectrum are, however, improbable. A sensitive test of the large-scale-average proton spectrum has been proposed by Moskalenko, Strong, & Reimer (1998) based on the fact that secondary antiprotons and y-rays are produced in the same ppinteractions. The secondary antiprotons sample the proton spectrum in a large region of the Galaxy, and a flatter nucleon spectrum in distant regions would lead to overproduction of secondary antiprotons and positrons. The “hard ~ucleon spectrum” hypothesis has effectively been excluded by recent measurements ‘of p / p ratio a t high energies (e.g., Beach et al. 2001). In addition, new accurate measurements of the local proton and Helium spectrum allow less freedom for deviations in the .Iro-decay component.
A “hard electron spectrum” hypothesis has been investigated by Porter & Protheroe (1997), Pohl & Esposito (1998), and Aharonian & Atoyan (2000). An essential idea of this approach is that the locally-measured CR spectrum of electrons is not a good constraint because of the spatial fluctuations due to energy losses and the stochastic nature of the sources in space and time; the average interstellar electron spectrum responsible for y-rays via IC emission (and bremsstrahlung) can therefore be quite different from that measured locally. An extensive study of this hypothesis has been made by Strong, Moskalenko, & Reimer (2000); in this model a less dramatic but essential modification of the proton and Helium spectrum (for the TO-decay component) was also required. The latter was still consistent with the locally-observed proton spectrum, as it should be since the proton fluctuations are expected to be small (Strong & Moskalenko 2001a) as the result of their negligible energy losses. The “hard electron spectrum” hypothesis suffers however from the following problems:
0 It is hardly compatible with the local electron spectrum even considering the fluctu- ations due to stochastic sources and energy losses, as shown by a 3D time-dependent study (Strong & Moskalenko 2001b);
0 The fit to the shape of the y-ray spectrum is still poor above 1 GeV (Strong et al. 2000);
0 It cannot reproduce the spectrum in the inner and outer Galaxy and intermediate/high latitudes simultaneously (Strong, Moskalenko, k Reimer 2003a);

-4-
These problems were already evident before the present study, but now we show in addition that
0 it predicts significantly higher intensities than the EGRET data above 10 GeV.
Another suggestion which has been made (Berezhko & Volk 2000) is that the y-ray spectrum contains a contribution from accelerated particles confined in SNR. The SNR proton and electron spectra, being much harder than the interstellar CR spectra, produce ro-decay and IC y-rays adding to the apparently diffuse y-rays, while the SNRs themselves are too distant to be resolved into individual sources.
A shortcoming of previous analyses was that the comparison with EGRET data was limited to particular regions, and the rich EGRET data have remained not fully exploited. Hunter et al. (1997) made an extensive comparison of the spectra near the Galactic plane Ibl < 10”. Other analyses have concentrated on particular molecular clouds: Ophiuchus (Hunter et al. 1994), Orion (Digel et al. 1999), Cepheus and Perseus (Digel et al. 1996), Monoceros (Digel et al. 2001), high latitudes (Sreekumar et al. 1998). The previous anal- ysis by Strong et al. (2000) was limited to the inner Galaxy at low latitudes, and profiles integrated over large regions of longitude or latitude. In that study, we compared a range of models, based on our CR propagation code GALPROP, with data from the Compton Gamma Ray Observatory. Relative to the work of Hunter et al. (1997) we emphasized the connection with CR propagation theory and the importance of IC emission, and less to fit- ting to structural details of the Galactic plane. The study confirmed that it is rather easy to get agreement within a factor -2 from a few MeV to 10 GeV with a “conventional” set of parameters, however, the data quality warrant considerably better fits.
In the present paper we attempt to exploit the fact that the models predict quite spe- cific behaviour for different sky regions and this provides a critical test: the “correct” model should be consistent with the data in all directions. We show that a new model, with less dramatic changes of electron and nucleon spectra relative to the “conventional” model, can well reproduce the y-ray data. The changes consist in renormalization of the intensities of the electron and proton spectra, and a relatively small modification of the proton spectrum at low energies. The model is compatible with locally observed particle spectra considering the expected level of spatial fluctuations in the Galaxy. We extend the y-ray data compar- isons over the entire sky and to 100 GeV in energy. We also exploit the recent improved measurements of the local proton, Helium, as well as antiproton, and positron spectra which are used as constraints on the proton spectrum in distant regions.
Our approach differs from that of Hunter et al. (1997) in that it is based on a model of CR propagation while Hunter et al. use CR-gas coupling and a relatively small IC component.

.
- 5 -
It is also different from Strong & Mattox (1996) in that it is based on a physical model, while that work was based on model-fitting to gas surveys to determine the y-ray emissivity spectrum as a function of Galactocentric radius.
The selection of a good model for the diffuse Galactic emission is critical to another topic, the extragalactic ?-ray background (EGRB). We have argued in Strong et al. (2000) and Moskalenko & Strong (2000) that IC from a large halo can make up a substantial fraction of the high-latitude emission and hence reduce the residual EGRB (and modify its spectrum relative to Sreekumar et al. 1998). In a companion paper (Strong, Moskalenko, & Reimer 2004) we present a comprehensive discussion of the EGRB, with a new estimate which is used in the present paper.
2. Models
The principles of the GALPROP code for CR propagation and y-ray emission have been described in Strong & Moskalenko (1998) and Strong et al. (2000). Since then the codel has been entirely re-written in C++ (Moskalenko et al. 2002, and references therein) using the experience gained from the original (fortran) version, with improvements in particular in the generation of y-ray skymaps. Both 2D (radially symmetric) and full 3D options are available, the latter allowing also explicit time-dependence with stochastic SNR source events (Strong & Moskalenko 2001b). For this paper the 2D option is sufficient since we need only kpc-scale averaged CR spectra (even if these differ from local CR measurements).
An important point to note is that even in the 2D case, the symmetry applies only to the CR distribution; for the gas-related components (.lro-decay and bremsstrahlung) of the y-ray skymaps we use 21-cm line survey data for H I and CO ( J = 1 -+ 0) survey data for Hz, in the form of column densities for Galactocentric "rings," using velocity information and a rotation curve (see Appendix A for details). In this way details of Galactic structure are included at least for the gas, at a sufficient level for the present limited state of knowledge on e.g. the relation of cosmic rays to spiral structure. The longitude range 350" < I < 10" is not included in the H I and CO survey data due to lack of kinematic information; for the analysis interpolated values are used, and this is found to be fully consistent will the y-ray data. The interstellar radiation field (ISRF) for computing IC emission and electron energy losses is the same as that described and used in Strong et al. (2000); pending a new calculation (an ambitious project) this is the best we havc available. Although the uncertainty in the ISRF is a shortcoming, note that since we fit to the y-ray data by adjusting the electron spectrum,
As usual the code and documentation is available at http://www.mpe.mpg.de/-aws/aws.html

- 6 -
inaccuracies in the ISRF spectrum will tend to be compensated.
The radial distribution of CR sources used is the same as in Strong et al. (2000), since we find this empirically-derived form still gives a good reproduction of the y-ray longitude distribution. Although flatter than the SNR distribution (e.g., Case & Bhattacharya 1998) , this may be compensated by the gradient in the CO-to-H, conversion factor whose metallicity and temperature dependences have the net effect of causing the factor t o increase with R (Papadopoulos, Thi, & Viti 2002; Israel 1997). We use a uniform value of XCO= 1 . 9 ~ 1 0 ~ ’ molecules cm-2/(K km s-l) as in Strong et al. (2000) and Strong & Mattox (1996); this is consistent with the value (1.8 f O.3)x1O2O molecules cm-2/(K km s-l) from a recent (non-y-ray) CO survey analysis by Dame et al. (2001).
The parameters of the models are summarized in Table 1. The models differ only in the injection spectra of protons (and He) and electrons, while the injection spectra of heavier nuclei are assumed to have the same power-law in rigidity, for all models. For propagation, we use essentially the same diffusion reacceleration model, model DR, as described in Mos- kalenko et al. (2002). The propagation parameters have been tuned to fit the B/C ratio (Fig. 1) using improved cross-sections (Moskalenko & Mashnik 2003). The spatial diffu- sion coefficient is taken as pDo(p/p0) ’ , where Do = 5.8 x cm s-’ at po = 4 GV, and 6 = 1/3 (Kolmogorov spectrum). The Alfvh speed is W A = 30 km s-’. The halo height is taken as zh = 4 kpc as in Strong et al. (2000), in accordance with our analysis of CR sec-, ondary/primary ratios (Moskalenko, Mashnik, & Strong 2001; Moskalenko et al. 2002, and references therein). However, values zh differing by 50% (the estimated error) with corre- sponding adjustment of Do would provide essentially similar results since the IC contribution scales mainly with the electron spectrum which is here treated as a free parameter.
The spectra are compared in the regions summarized in Table 2. Region A corresponds to the “inner radian”, region B is the Galactic plane excluding the inner radian, region C is the “outer Galaxy”, regions D and E cover higher latitudes at all longitudes, region F is “Galactic poles”. Region H is the same as in Hunter et al. (1997) and is used for comparison with results of Hunter et al. In addition to spectra, profiles in longitude and latitude are an essential diagnostic; our latitude profiles are plotted logarithmically because of the large dynamic range from the Galactic plane to the poles.
The EGRB used here is based on the new determination by Strong et al. (2004). Since this was derived for the EGRET energy bands, it is interpolated in order to produce a contin- uous spectrum for combining with the model Galactic components. The present analysis is however not sensitive to the details of the EGRB. Since our COMPTEL data do not contain the EGRB (see Section 3.2), we do not extrapolate the EGRB beyond the EGRET energy range when comparing with data.

- 7 -
The output of the GALPROP runs is in the form of FITS files; the visualization2 in the form of spectra and profiles, and comparison of the results with data involves integrations over sky regions and energy as well as convolution. The predicted model skymaps are convolved with the EGRET point-spread function as described in Strong et al. (2000). For the profiles the convolved model is directly compared with the observed intensities. For the spectra, the procedure is slightly different: the predicted (unconvolved) intensities are compared with intensities corrected for the effect of convolution as given by the model under study. This procedure has the advantage that the spectra are spatially deconvolved, allowing for more direct interpretation and also the combination of data with other experiments, such as COMPTEL, with different instrument response functions. The effect of this procedure on the spectra is only significant below 500 MeV.
3. ?-ray and cosmic ray measurements
3.1. EGRET data
We use the co-added and point-source removed EGRET counts and exposure maps in Galactic coordinates with 0.5" x 0.5" binsize at energies between 30 MeV and 10 GeV, as described in Strong et al. (2000). Apart from the most intense sources, the removal of sources has little influence on the comparison with models. For the spectra, the statistical errors on the EGRET data points are very small since the regions chosen have large solid angle; the systematic error dominates and we have conservatively adopted a range 515% in plotting the observed spectra (Sreekumar et al. 1998; Esposito et al. 1999). For longitude and latitude profiles only the statistical errors are plotted. In addition we use EGRET data in the energy ranges 10-20, 20-50 and 50-120 GeV. Because the instrumental response of EGRET determined at energies above 10 GeV is less certain compared to energies belaw 10 GeV, it is necessary to account for additional uncertainties. In particular the EGRET effective area can only be deduced by extrapolation from the calibrated effective area at lower energies (Thompson et al. 1993a). We accordingly adopt values of 0.9, 0.8, and 0.7 times the 4-10 GeV effective area, respectively. On top of the statistical and systematic uncertainties as described above we account for the uncertainties due to the uncalibrated effective area of the EGRET telescope above 10 GeV with an additional systematic error of f 5 % . However, the actual number of photons >10 GeV is small: 1091, 362 and 53 events respectively, and concentrated mainly in the inner Galaxy; hence the comparison with models above 10 GeV
*An additional program GALPLOT has been developed for this purpose, with flexible plotting options and convolution; this will be made available with future versions of GALPROP.

b
- 8 -
can only be made in this region.
At low energies the EGRET effective area includes the so-called “Kniffen factor” (Thomp- son et ai. 1993b) derived by fitting the Crab spectrum; this additional uncertainty (factor = 2 - 3.4 for 30-50 MeV and 1.2 - 1.6 for 50-70 MeV) should be borne in mind when comparing models with EGRET data.
3.2. COMPTEL data
The intensities are based on COMPTEL maximum entropy all-sky maps in the energy ranges 1-3, 3-10 and 10-30 MeV, as published in Strong et al. (1999). The intensities are averaged over the appropriate sky regions, with high latitudes being used to define the zero level. COMPTEL data is only used for the inner Galaxy spectra, since the skymaps do not show significant diffuse emission elsewhere. For this reason, the COMPTEL data shown in the figures does not include the EGRB.
3.3. Cosmic rays
In our conventional model we use the locally-observed proton, He, and electron spec- tra (solid lines in Figs. 2, 3). The nucleon data are now more precise than those which were available for Strong et al. (2000). The proton (and Helium) injection spectra and the propagation parameters are chosen to reproduce the most recent measurements of primary and secondary nuclei, as described in detail in Moskalenko et al. (2002). The error on the dominant proton spectrum in the critical (for TO-decay) 10 - 100 GeV range is now only - 5% for BESS (Sanuki et al. 2000). Relative to protons, the contribution of He in CR to the y-ray flux is about 17%, and the CNO nuclei in CR contribute about 3%. The He nuclei in the ISM contribute about 25% relative to hydrogen for the given ratio He/H = 0.11 by number. The total contribution of nuclei with 2 > 1 is about 50% relative to protons.
In our optimized model we use the proton and He high-energy spectral shape derived from the local data (dotted lines in Figs. 2, 3). We allow however for some deviations in the normalization. The antiproton (Orito et al. 2000; Beach et al. 2001) and positron data provide an important constraint (Moskalenko et al. 1998; Strong et al. 2000) on the proton spectrum on a large scale. Since the low-energy protons are undetectable in the ISM, we allow more freedom in the proton and He spectrum below 10 GeV. We introduce a break at 10 GeV which enables us to fit the y-ray spectrum while still remaining within the constraints provided by the locally-observed antiproton and positron spectra. The deviations from the

.
- 9 -
local measurements at low energies can be caused by the effect of energy losses and spatial fluctuations in the Galaxy. The modification of the low-energy proton spectrum may also be partly a compensation for errors in the models of neutral pion production at low energies (e.g., Stecker 1970), which rely on the data of 1960’s (see Dermer 1986, and references therein) and do not provide the required accuracy now. Besides, the low-energy protons are strongly affected by solar modulation; while the effect of solar modulation is not fully understood, it is essential below 10 GeV. We refer a reader to Section 8 where various aspects of the uncertainties are discussed in more detail. For electrons, the injection index near -1.8 at -1 GeV is consistent (see Strong et al. 2000) with observations of the synchrotron index /I = 2.40 - 2.55 for 22-408 MHz (Roger et al. 1999) and /3 = 2.57 f 0.03 for 10-100 MHz (Webber, Simpson, & Cane 1980).
Secondary and tertiary antiprotons are calculated as described in Moskalenko et al. (2002). Secondary positron and electron production is computed using the formalism de- scribed in Moskalenko & Strong (1998), which includes a reevaluation of the secondary &- and K*-meson decay calculations. Antiprotons, positrons, and electrons including secondary electrons are propagated in the same model as other CR species.
4. Conventional model
We start by repeating the test of the “conventional” model; the y-ray spectra in the 7 test regions are shown in Fig. 4. As required by the ‘[conventional” tag, the proton and electron spectra are consistent with the locally observed spectra (Figs. 2,3). This is the same “conventional” model as in Strong et al. (2000), with updated nucleon spectra, but because we compare with a more complete set of EGRET data than in Strong et al. (2000), the discrepancies become more explicit, and we can check whether they arise only in particular sky regions. Note that IC plays only a minor role in this type of model. As found in previous work, the GeV energy range shows an excess relative to that predicted; what is now evident is that this excess appears in all Zatitudes/Zongitude ranges. This is consistent with the results of Hunter et al. (1997) and Digel et al. (2001). It already shows that the GeV excess is not a feature restricted to the Galactic ridge or the gas-related emission. Further it is clear that a simple upward rescaling of the no-decay component will not improve the fit in any region, since the observed peak is at higher energies than the TO-decay peak. In other words, since the spectrum is very different from 7-ro-decay even at intermediate latitudes, a substantial IC component is required.
Note that this version of the [Lconventiona17’ spectrum is nevertheless in rather better agreement with EGRET data than in Strong et al. (2000), due to inclusion of secondary

- 10 -
positrons/electrons, general improvements in the model (e.g., iTTO-decay, improved gas data) and the EGRET data treatment (direct use of the count and exposure data instead of the model-fitting analysis of Strong & Mattox 1996). The improvement is especially evident in the 30-100 MeV range, where secondary positrons/electrons make a substantial contribution (see Section 7).
A test against antiproton and positron data also shows “excesses”. The conventional model with reacceleration is known (Moskalenko et al. 2002) to produce a factor of -1.5 ( ~ 2 . 5 0 ) less antiprotons at 2 GeV than measured by BESS (Orito et al. 2000). The antipro- ton spectrum for the conventional model is shown in Fig. 5. Positron data, though scattered, also show some “excess” at high energies (Fig. 6). It is thus clear that the “excesses” in GeV y-rays in all directions, in GeV antiprotons, and in positrons above several GeV found in the conventional model indicate that the average high-energy proton flux in the Galaxy should be more intense or our reacceleration model is invalid or there is a contribution from uncon- ventional sources (e.g. dark matter). For more discussion of antiproton and positron tests see Section 7.
In the “SNR source” scenario of Berezhko & Volk (2000) the y-ray spectrum in the inner Galaxy is attributed to an additional population of unresolved SNR, but this component cannot explain the excess observed at high latitudes, and hardly in the outer Galaxy3. The presence of the GeV excess in all sky regions is also a problem for the suggestion by Aharonian & Atoyan (2000) of a hard proton spectrum in the inner Galaxy. These explanations are therefore by themselves insufficient, although they could give a contribution.
5. Hard electron injection spectrum model
This model is essentially as in Strong et al. (2000), recomputed with the current GAL- PROP code. The main feature is the electron injection index of 1.9. Comparison of the spectra in the 7 sky areas (Fig. 7) show that this model reproduces the GeV excess except in the inner Galaxy (region A) where it is still too low. However the spectral shape is not well reproduced. More significant, comparing with the new EGRET data above 10 GeV in the inner Galaxy, the spectrum is much too hard. Fig. 3 compares the locally observed electron spectrum with that from the model; the deviation at high energies is much larger than expected from the 3D study by Strong & Moskalenko (2001b). As discussed in the Introduction, there are therefore a number of reasons to lead us to consider this model as after all untenable.
3Berezhko & Volk (2000) did not address the question of regions away from the inner Galaxy.

- 11 -
6. Optimized model
Since the conventional model fails to reproduce the observed y-ray spectrum, and the hard electron spectrum model is untenable, we use the diffuse y-rays themselves to obtain an optimized solution. The average interstellar electron spectrum is sufficiently uncertain that we can look for a "solution" involving a less drastic change in the electron injection spectrum than the hard electron injection spectrum model. We find that an injection spectrum of electrons with a steepening from 1.5 to 2.42 at 20 GeV (see Table 1) produces sufficient curvature in the inverse Compton spectrum to explain the observed shape of the y-ray spectrum, provided the electron spectrum is suitable normalized upwards by a factor of about 4 relative to the locally observed spectrum. The proton injection spectrum is also normalized upward, by a factor 1.8; it has the same shape as for the.electrons, as a function of rigidity, but the break energy is 10 GeV instead of 20 GeV. It has exactly the same slope above 10 GeV as the conventional proton spectrum.
The y-ray spectra in the 7 test regions are shown in Fig. 8. The fits to the observed y-ray spectra are better than for the conventional and hard electron spectrum models, both in the 1-10 GeV region and above 20 GeV. The spectra in different regions are satisfactorily reproduced and there is no longer a significant GeV excess. Hence the spectrum can now be reproduced from 30 MeV to 100 GeV. The proposed scenario implies a substantial con- tribution from IC at all energies, but especially below 100 MeV and above 1 GeV. Also IC dominates at latitudes lbl > 10" at all energies.
Longitude profiles at low latitudes are shown in Fig. 9. The agreement with the EGRET data is generally good considering that the model does not attempt to include details of Galactic structure (e.g., spiral arms), and the systematic deviations reflect the lack of an exact fit to the spectra in Fig. 8. The largest deviation (-20%) is at 2-4 GeV, but this is still compatible with the systematic errors of the EGRET data. Latitude profiles in the longitude ranges 330" < I < 30", 30" < 2 < 330" are shown in Figs. 10, 11, where the logarithmic scale is chosen given the large dynamic range and to facilitate the comparison at high Galactic latitudes. The agreement with EGRET is again good, in particular the reproduction of the high-latitude variation confirms the importance of the IC component which is much broader than the gas-related 7ro-decay and bremsstrahlung emission. In the inner Galaxy (Fig. 10) there is evidence for an excess at intermediate latitudes, perhaps related to an underestimate of the interstellar radiation field in the Galactic halo, or special conditions in the Gould's Belt. The outer Galaxy latitude profiles (Fig. 11) are in excellent agreement with the data.
The local electron spectrum (Fig. 3) is compatible with the direct measurement con- sidering fluctuations due to energy losses and stochastic sources and propagation (Strong & Moskalenko 2001b), and in addition uncertainties in solar modulation at low energies. In

- 12 -
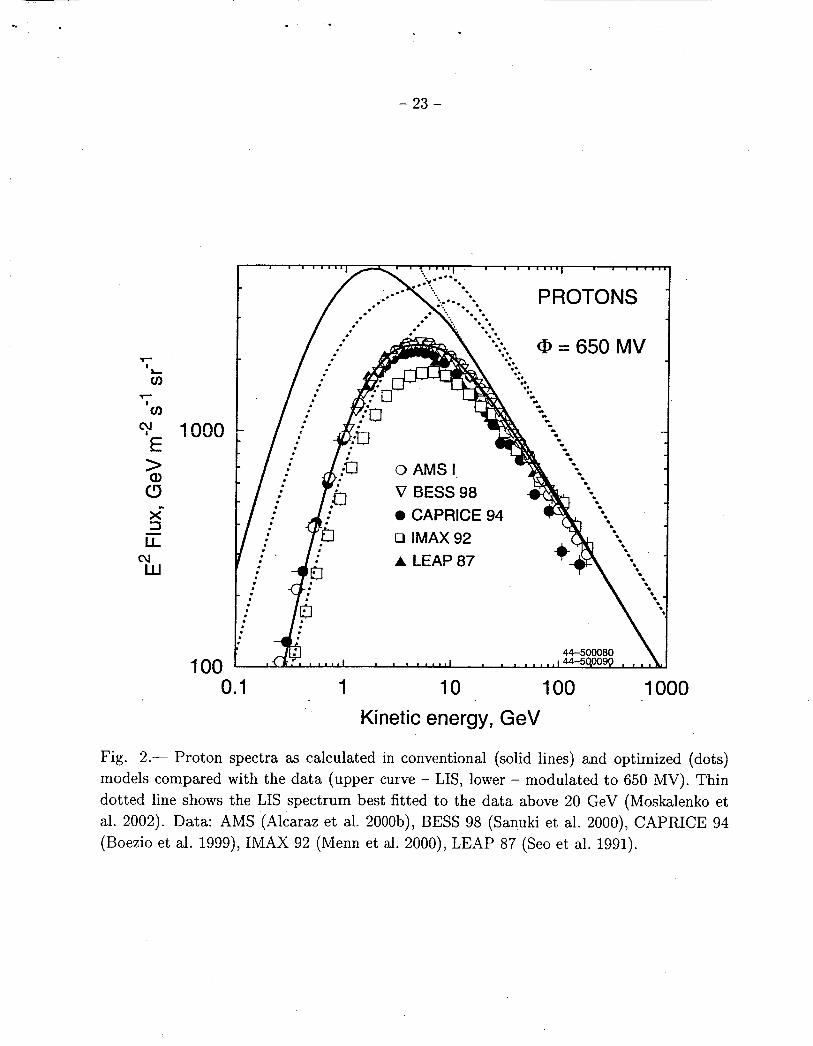
fact the agreement can be even better if we consider the uncertainty in the ISRF, which can well be a factor 2 higher than our estimate. The electron spectrum is consistent with the synchrotron spectral index data (Strong et al. 2000), since it differs from the conventional model essentially only in the normalization, and this is in turn consistent with synchrotron. The interstellar proton spectrum (Fig. 2) is also compatible with direct measurements; the factor 1.8 may be attributed to fluctuations over the Galaxy relative to the local value, and also to the uncertainty in the large-scale CR gradient.
Below 30 MeV the predicted spectrum lies about a factor 2 below the COMPTEL data, as found previously (Strong et al. 2000). There we proposed that a contribution from compact sources is the most likely explanation. Recent results from INTEGRAL (Strong et al. 2003b) indeed indicate a large contribution from sources in the hard X-ray band, and this would be consistent with the MeV region marking a transition from source-dominated to diffuse-dominated ridge emission.
7. Secondary antiprotons, positrons, electrons
7.1. Tests of the nucleon spectrum
A sensitive test of the proton spectrum using the p / p ratio has been proposed (Mos- kalenko et al. 1998) based on the fact that secondary antiprotons and y-rays are produced in the same pp-interactions. Positrons are also produced in pp-collisions and thus may be used to support the conclusions made from the antiproton test. While some deviation from the locally-observed spectrum of primary protons is acceptable, secondary antiprotons (and partly positrons) trace the primary proton spectrum on scales up to -10 kpc over the Galaxy, and hence allow us to put limits on deviations from the local measurements.
As was noted in Strong et al. (2000) and Moskalenko et al. (2003, and references therein), the “GeV excess” in y-rays and underproduction of antiprotons in the reacceleration model may indicate that the nucleon spectrum typical of large regions of the Galaxy differs mod- erately from the local measurements. The problem with secondary antiprotons in the reac- celeration model has been extensively discussed in Moskalenko et al. (2002, 2003). It is apparent that if the solution of the y-ray GeV excess can not be found in modifications of the electron spectrum alone, the required modifications in the nucleon spectrum must satisfy the constraints from both antiprotons and positrons.
Figs. 5 and 6 show the antiproton and positron fluxes as calculated in the conventional and optimized models. The modifications of the nucleon spectrum introduced in the op- timized model appear to be exactly what is required to reproduce the antiproton data !
- 13 -
This in fact supports the factor 1.8 in the proton flux required for y-rays, and the positron spectrum also agrees at high energies. At low energies the calculated positron spectrum is rather high but the solar modulation is a factor of -1000 a t these energies, and besides the scatter in the positron data may indicate large systematic errors.
7.2. Gamma-rays from secondary positrons and electrons
Secondary positrons in CR produced in interactions of energetic nucleons with interstel- lar gas are usually considered a minor component of CR. This is indeed so in the heliosphere where the positron to all-lepton ratio is small at all energies, e+/etot - 0.1. However, the secondary positron flux in the interstellar medium is comparable to the electron flux a t relatively low energies -1 GeV because of the steeper spectrum of secondary positrons.
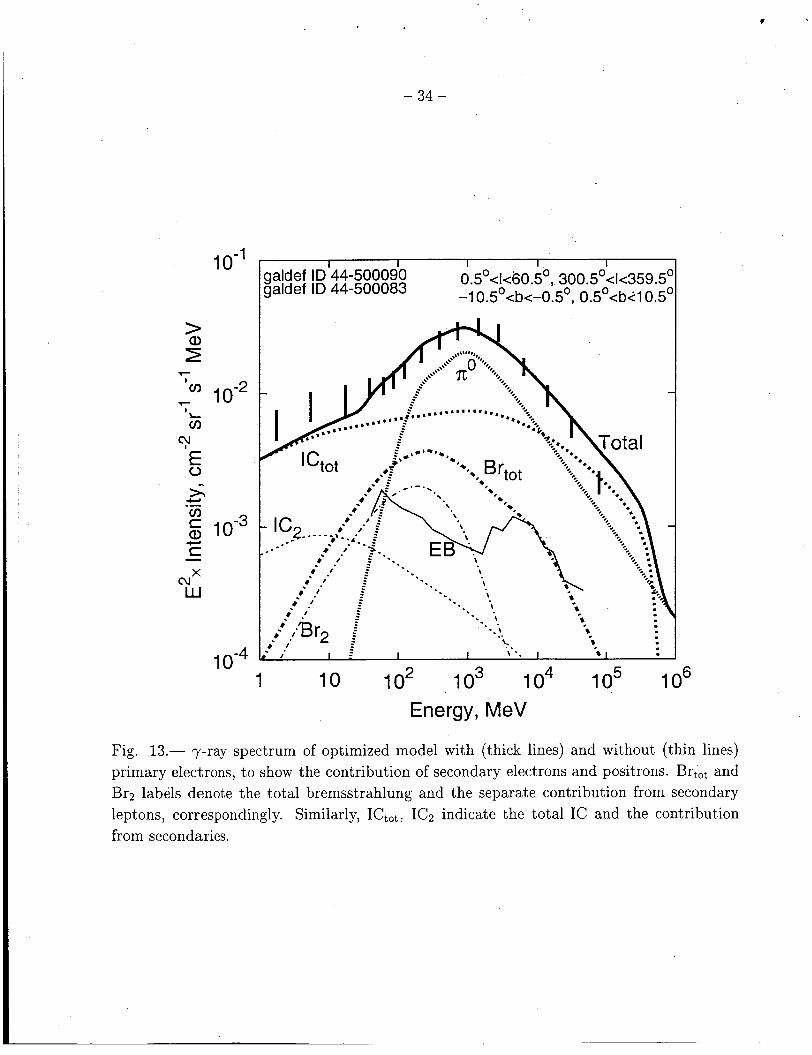
The spectrun; of secondary positrons and electrons depends only on the ambient spec- trum of nucleons and the adopted propagation model. Figs. 3, 6 show the spectra of electrons and secondary positrons for the conventional and optimized models. Secondary positrons contribute about half of the total lepton flux at -1 GeV. Secondary electrons add up another 10% (Fig. 12). This leads to a considerable contribution of secondary positrons and electrons to the diffuse y-ray flux via IC scattering and bremsstrahlung and significantly increases the flux of diffuse Galactic y-rays in MeV range. Therefore, secondary positrons (and electrons) in CR can be directly traced in y-rays!
Fig. 13 shows the contribution of secondary positrons and electrons to the IC emission and bremsstrahlung. Secondaries contribute more than 20% of the total IC in the 1-10 MeV energy range. More dramatic is the case of bremsstrahlung, where secondaries contribute about 60% of the total below -200 MeV. It is the contribution of secondaries which improves the agreement with data below some 100 MeV.
8. Discussion of uncertainties
We now discuss the uncertainties which may effectively cause the proposed deviations from the locally observed proton and electron spectra. Those most probable are the uncer- tainties in the 7ro-production in pp-collisions at relatively low energies, heliospheric modula- tion, and our evaluation of the ISRF.
Mori (1997, and references therein) has re-evaluated the .rro-production in pp-collisions using modern Monte Carlo event generators HADRIN, PYTHIA, and FRITIOF. The HADRIN code, which is designed to reproduce nuclear collisions at laboratory energies below 5 GeV

I
- 14 -
and describes the threshold and resonance behavior of inelastic hadron-nucleon interactions, shows good agreement with isobar model calculations (Stecker 1970) at proton kinetic en- ergy Tp = 0.97 GeV. The isobar model is shown to reproduce the data on the secondary To-production at low energies, in particular, at Tp = 0.56,0.65,0.97,2.0 GeV (Dermer 1986, and references therein). However, the data on To-production at GeV energies are now 40 years old, they have large statistical errors and are very scattered indicating possibly large systematic uncertainties, Given the lack of new data, the deviations from the isobar model calculations by a factor of -2 would be also consistent with the old data. However, the comparison to the Galactic diffuse y-ray emission is now rather precise, and the uncertainty in the 7rO-production at low energies may be critical. Our required flattening of the proton spectrum below 10 GeV could thus be understood as a compensation for errors in the TO-
production physics. At high energies, a comparison of Badhwar, Stephens, & Golden (1977) and Stephens & Badhwar (1981) scaling model with resuls of PYTHIA and FRITIOF shows generally a good agreement, but all of them overpredict the cross sections at high rapidities. Though it may result in systematic uncertainties of the y-ray flux above -100 GeV, this, however, is of less concern given the large error bars in the EGRET data in this energy range.
Our knowledge of the heliospheric modulation is still incomplete, and it remains the source of a large uncertainty in the propagation models. Over the last years Ulysses made its measurements at different heliolatitudes so we know more about the solar magnetic field configuration and the solar wind velocity distribution. However the modulation parameters are usually still determined based on the assumed ad hoc interstellar nucleon spectrum. Estimates of the modulation made using the simplest force-field approximation show that the modulation changes the proton intensity below 1 GeV by a factor of 10 (Fig. 2), and by a factor of 100-1000 in case of electrons and positrons (Figs. 3, 6). This makes it difficult to speculate about the reasons for deviations of the calculated spectrum from the measured one by a factor of a few at low energies.
For the calculation of the spectrum of y-rays arising from IC scattering and electron energy losses, the full ISRF as function of position and wavelength is required, which was not available in the literature. The ISRF was evaluated in Strong et al. (2000) using emissivities based on stellar populations and dust emission. Given the complicated and uncertain input in this calculation a factor of two error is quite possible. The inaccuracies in the ISRF are compensated in our model by adjustment of the CR electron flux. Therefore, if the ISRF energy density is in reality higher, it will result in lower normalization of the electron injection spectrum making it closer to the local one.
Finally, due to the random nature of SN explosions the CR spectrum fluctuates in space

- 15 -
and time (see simulations in Strong & Moskalenko 2001a). Further, since more CR sources are concentrated in the spiral arms (e.g., Case & Bhattacharya 1996), the CR intensity in the arms might be higher. Both these effects can cause the locally measured CR intensity to differ from the large-scale average by the required factor of 2-4.
9. Conclusions
We have revisited the compatibility of diffuse Galactic continuum y-ray models with the EGRET data. We confirm that the “conventional model” based on the locally observed electron spectrum is inadequate, for all sky regions. A conventional model plus hard sources in the inner Galaxy is also inadequate, since this cannot explain the excess outside of the Galactic plane. Models with a hard electron injection spectrum, while reproducing the EGRET spect,rurn in the few GeV region over much of the sky, are not compatible with the locally observed electron spectrum (the expected fluctuations are not sufficient) and are inconsistent with EGRET data above 10 GeV.
A new model, with relatively mild deviations of the electron and proton spectra from local, is shown give a good reproduction of the diffuse y-ray sky. The agreement extends from 30 MeV to 100 GeV. It also gives a very good representation of the latitude distribution of the emission from the plane to the poles, and of the longitude distribution. IC emission is a major component of the diffuse emission and dominates outside the Galactic plane and at energies below 100 MeV. The model reproduces simultaneously the y-rays, synchrotron, CR secondary/primary ratios, antiprotons and positrons. In this sense it goes a long way towards realizing our original goal, stated in Strong et al. (2000), to reproduce astronomical and directly-measured data on cosmic rays in the context of a single model of the high-energy Galaxy.
Based on the optimized model, a new EGRB spectrum has been derived (Strong et al. 2004) which is lower and steeper than found by Sreekumar et al. (1998); it is barely consistent with a power-law, and shows some positive curvature.
We would like to particularly thank David Bertsch for assistance and discussions on the subject of the events and instrumental response of the EGRET telescope above 10 GeV and Seth Digel for providing the kinematically analysed H I and CO data used in this work. A part of this work has been done during a visit of Igor Moskalenko to the Max-Planck- Institut fur extraterrestrische Physik in Garching; the warm hospitality and financial support of the Gamma Ray Group is gratefully acknowledged. Igor Moskalenko acknowledges partial support from a NASA Astrophysics Theory Program grant. Olaf Reimer acknowledges

- 16 -
support from the BMBF through DLR grant QV0002.
A. Description of H I and CO data
The H I and CO data used in this work are based on more recent surveys than those used in Strong 8~ Mattox (1996) and Strong et al. (2000). They were provided by S. Digel (private communication) who provided the following description.
The annular maps are generated for 8 ranges of Galactocentric distance on the assump- tion of uniform circular rotation with the rotation curve of Clemens (1985) parameterized for Ro = 8.5 kpc, V, = 220 km/s. Emission beyond the terminal velocity is assigned to the tangent point, and emission at slightly forbidden velocities in the outer Galaxy is assigned to the local annulus (7.5-9.5 kpc). The longitude ranges within 10" of 1 = 0 and 1 = 180" are excluded from the integrations in all annuli. The boundaries of the of Galactocentric distance annuli are 1.5, 3.5, 5.5, 7.5, 9.5, 11.5, 13.5, 15.5, 50 kpc.
The CO data are from the 115 GHz line survey of Dame et al. (1987) and the latitude range is Ibl < 25". The coverage is not complete within this latitude range but little or no significant CO emission is believed to be missed. The maps are of CO line intensity integrated over the (longitude-dependent) velocity range of each annulus and they have angular resolution 0.5" x 0.5" (set by the sampling pattern of the constituent surveys; see Dame et al. 1987). The units are velocity integrated radiation temperature (WC,), corrected to the intensity scale of Bronfman et al. (1988), in K km/s.
The H I data are a composite of several 21-cm line surveys (Table 3), which were interpolated to a uniform grid. Calibrations were checked against the Bell Labs H I horn survey of Stark et al. (1992). Brightness temperatures Tb were converted to column densities of atomic hydrogen on the assumption Tspin = 125 K uniformly. The few positions with Tb > 110 K had T b truncated to 110 K. The maps have units of column density N(H 1)/1020 atom cm-2. Angular resolution is somewhat better than 1" and the maps extend to Ibl = 40".
The WC, and N(H I) maps described above were generated in 1996 using the then best available surveys of CO and H I. Since that time, surveys with greater coverage, angular resolution, sensitivity, and improved calibration have been published, see Dame et al. (2001) and Burton et al. (1994). However these improvements would hardly affect the results presented in this paper.

- 17-
REFERENCES
Aharonian, F. A., & Atoyan, A. M. 2000, A&A, 362, 937
Alcaraz, J., et al. 2000a, Phys. Lett. B, 484, 10
Alcaraz, J., et al. 2000b, Phys. Lett. B, 490, 27
Asaoka, Y. , et al. 2002, Phys. Rev. Lett., 88, 051101
Badhwar, G. D., Stephens, S. A., & Golden, R. L. 1977, Phys. Rev. D, 15, 820
Basini, G., e t al. 1999, Proc. 26th Int. Cosmic Ray Conf. (Salt Lake City), 3, 77
Beach, A. S., et al. 2001, Phys. Rev. Lett., 87, #271101
Berezhko, E. G., & Volk, H. J. 2000, ApJ, 540, 923
Boezio, M., et al. 1999, ApJ, 518, 457
Boezio, M., e t al. 2000, ApJ, 532, 653
Boezio, M., e t al. 2001, ApJ, 561, 787
Bronfman, L., Cohen, R. S., Alvarez, H., May, J., & Thaddeus, P. 1988, ApJ, 324, 248
Burton, W. B., & Hartmann, D. 1994, Ap&SS, 217, 189
Case, G., & Bhattacharya, D. 1996, A&AS, 120, 437
Case, G. L., & Bhattacharya, D. 1998, ApJ, 504, 761
Cleary, M. N., Haslam, C. G. T., & Heiles, C. 1979, A&AS, 36, 95
Clemens, D. P. 1985, ApJ, 295, 422
Dame, T. M., Hartmann, D., & Thaddeus, P. 2001, ApJ, 547, 792
Dame, T. M., et al. 1987, ApJ, 322, 706
Dermer, C. D. 1986, A&A, 157, 223
Davis, A. J., et al. 2000, in AIP Conf. Proc. 528, Acceleration and Transport of Energetic Particles Observed in the Heliosphere (ACE-2000), eds. R. A. Mewaldt et al. (New York: AIP), 421
Digel, S. W., Aprile, E., Hunter, S. D., Mukherjee, R., & Xu, F: 1999, ApJ, 520, 196
- 18 -
Digel, S. W., Grenier, I. A., Heithausen, A., Hunter, S. D., & Thaddeus, P. 1996, ApJ, 463, 609
Digel, S. W., Grenier, I. A., Hunter, S. D., Dame, T. M., & Thaddeus, P. 2001, ApJ, 555, 12
DuVernois, M. A., Simpson, J. A., & Thayer, M. R. 1996, A&A, 316, 555
DuVernois, M. A., et al. 2001, ApJ, 559, 296
Engelmann, J. J., Ferrando, P., Soutoul, A., Goret, P., & Juliusson, E. 1990, A&A, 233, 96
Esposito, J. A., et al. 1999, ApJS, 123, 203
Gralewicz, P., Wdowczyk, J., Wolfendale, A. W., & Zhang, L. 1997, A&A, 318, 925
Grimani, C., et al. 2002, A&A, 392, 287
Heiles, C., & Habing, H. J. 1974, A&AS, 14, 1
Hunter, S. D., Digel, S. W., de Geus, E. J., & Kanbach, G. 1994, ApJ, 436, 216
Hunter, S. D., et al. 1997, ApJ, 481, 205
Israel, F. P. 1997, A&A, 328, 471
Kerr, F. J., Bowers, P. F., Kerr, VI., & Jackson, P. D. 1986, A&AS, 66, 373
Kobayashi, T., Nishimura, J., Komori, Y., Shirai, T., Tateyama, N., Taira, T., Yoshida, K., & Yuda, T. 1999, Proc. 26th Int. Cosmic Ray Conf. (Salt Lake City), 3, 61
Lukasiak, A., McDonald, F. B:, & Webber, W. R. 1999, Proc. 26th Int. Cosmic Ray Conf. (Salt Lake City), 3, 41
Menn, W. et al. 2000, ApJ, 533, 281
Mori, M. 1997, ApJ, 478, 225
Moskalenko, I. V., & Mashnik, S. G. 2003, Proc. 28th Int. Cosmic Ray Conf. (Tsukuba), 1969
Moskalenko, I. V., Mashnik, S. G., & Strong, A. W. 2001, Proc. 27th Int. Cosmic Ray Conf. (Hamburg), 1836
Moskalenko, I. V., & Strong, A. W. 1998, ApJ, 493, 694

- 19 -
Moskalenko, I. V., & Strong, A. W. 2000, ApJ, 528, 357
Moskalenko, I. V., Strong, A. W., Mashnik, S. G., & Ormes, J. F. 2003, ApJ, 586, 1050
Moskalenko, I. V., Strong, A. W., & Reimer, 0. 1998, A&A, 338, L75
Moskalenko, I. V., Strong, A. W., Ormes, J . F., & Potgieter, M. S. 2002, ApJ, 565, 280
Orito, S., et al. 2000, Phys. Rev. Lett., 84, 1078
Papadopoulos, P. P., Thi, W.-F., & Viti, S. 2002, ApJ, 579, 270 (erratum 583, 524)
Pohl, M., & Esposito, J. A. 1998, ApJ, 507, 327
Porter, T. A., & Protheroe, R. J. 1997, J. Phys. G: Nucl. Part. Phys., 23, 1765
Roger, R. S., Costain, C. H., Landecker, T. L., & Swerdlyk, C. M. 1999, A&AS, 137, 7
Sanuki, T., et al. 2000, ApJ, 545, 1135
Seo, E. S., Ormes, J. F., Streitmatter, R. E., Stochaj, S. J., Jones, W. V., Stephens, S. A., & Bowen, T. 1991, ApJ, 378, 763
Sreekumar, P., et. al. 1998, ApJ, 494, 523
Stark, A. A., Gammie, C. F., Wilson, R. W., Bally, J., Linke, R. A., Heiles, C., & Hurwitz, M. 1992, ApJS, 79, 77
Stecker, F. W. 1970, Ap&SS, 6 , 377
Stephens, S. A., & Badhwar, G. D. 1981, A&A, 76, 213
Stephens, S. A., & Streitmatter, R. A. 1998, ApJ, 505, 266
Strong, A. W., Bloemen, H., Diehl, R., Hermsen, W., & Schonfelder, V. 1999, Astrophys. Lett. Comm., 39, 677
Strong, A. W., Bouchet, L., Diehl, R., Mandrou, P., Schonfelder, V., Teegarden, B. J. 2003b, A&A, 411, L447
Strong, A. W., & Mattox, J. R. 1996, A&A, 308, L21
Strong, A. W., & Moskalenko, I. V. 1998, ApJ, 509, 212
Strong, A. W., Moskalenko, I. V., & Reimer, 0. 2000, ApJ, 537, 763 (erratum 541, 1109)

- 20 -
Strong, A. W., & Moskalenko, I. V. 2001a, Proc. 27th Int. Cosmic Ray Conf. (Hamburg), 1942
Strong, A. W., & Moskalenko, I. V. 2001b, Proc. 27th Int. Cosmic Ray Conf. (Hamburg), 1964
Strong, A. W., Moskalenko, I. V., & Reimer, O., 2003a, Proc. 28th Int. Cosmic Ray Conf. (Tsukuba), 2309
Strong, A. W., Moskalenko, I. V., & Reimer, 0.' 2004, ApJ, submitted
Thompson, D. J. et al. 1993a, ApJS, 86, 629
Thompson, D. J. et al. 1993b, ApJ, 415, L13
Weaver, H., & Williams, D. R. W. 1973, A&AS, 8, 1
Webber, W. R., Simpson, G. A., & Cane, H. V. 1980, ApJ, 236, 448
This preprint was prepared with the AAS IN$$ macros v5.2.

- 21 -
Table 1. Particle injection spectra and normalizations.
Proton spectrum Electron spectrum (cut off Q 1 TeV) Injection Break Normalizationb Injection Break Normalizationb
Model ID index' rigidity, GV Q 100 GeV indexa rigidity, GV Q 32.6 GeV
Conventional 44500180 1.98/2.42 9 5.0 x 1.60/2.54 4 4.86 x 10⁻³ Hard electron 44300181 1.98/2.42 9 5.0 x 1.90 ... 1.23 x Optimized 44500190 1.50/2.42 10 9.0 x 10⁻² 1.50/2.42 20 2.39 x
Note. - The GALPROP model IDS are given for future reference; the corresponding parameter files contain a complete specification of the models.
aBelow/above the break rigidity.
bNormalization of the local spectrum (propagated). Units are m-2 sr-l s-l GeV-'.
Table 2. Sky regions used for comparison of models with data.
Region I , deg lb), deg Description
H 300-60 0-10 Hunter et al. (1997) region A 330-30 0-5 inner Galaxy B 30-330 0-5 Galactic plane avoiding inner Galaxy C 90-270 0-10 outer Galaxy D 0-360 10-20 intermediate latitudes 1 E 0-360 20-60 intermediate latitudes 2 F 0-360 60-90 Galactic poles
Table 3. HI surveys used for annular ring maps.
Angular resolution Survey (HPBW), deg Region of Sky
~~~ ~ ~ ~
Weaver & Williams (1973) Heiles & Habing (1974) Kerr et al. (1986) Cleary, Heiles, & Haslam (1979)
36' 36' 48' 48'
lbl < lo", 1 = 10 - 250" lbl > lo", 6 > -30" lbl < lo", 1 = 240 - 350" lbl > lo", 6 < -30"

- 22 -
L
44-500080 I 1 1 , 1 V Maehl et al. 1977
I , I
Figures
0.4
0.35
0.3
0.25
0.2
0.1 5
0.1
0.05
0
I i i i
1 1 B/C ratio
Fig. 1.- B/C ratio as calculated in reacceleration model. Lower curve - LIS, upper - modulated (a = 450 MV). Data below 200 MeV/nucleon: ACE (Davis et al. 2000), Ulysses (DuVernois, Simpson, & Thayer 1996), Voyager (Lukasiak, McDonald, & Webber 1999); high energy data: HEAO-3 (Engelmann et al. 1990), for other references see Stephens & Streitmatter (1998).
- 23 -
CY E
1000
100 0.1 1 10 100 1000
Kinetic energy, GeV
Fig. 2.- Proton spectra as calculated in conventional (solid lines) and optimized (dots) models compared with the data (upper curve - LIS, lower - modulated to 650 MV). Thin dotted line shows the LIS spectrum best fitted to the data above 20 GeV (Moskalenko et al. 2002). Data: AMS (Alcaraz et al. 2000b), BESS 98 (Sanuki et al. 2000), CAPRICE 94 (Boezio et al. 1999), IMAX 92 (Menn et al. 2000), LEAP 87 (Seo et al. 1991).

- 24 -
100
10
1
0.1 V Sanriku
I I I
0.1 1 10 100 1000 Kinetic energy, GeV
Fig. 3.- Electron spectra for conventional (solid), hard electron (dashes), and optimized models (dots), compared with data (upper curve - LIS, lower - modulated to 600 MV). Data: AMS (Alcaraz et al. 2000a), CAPRICE 94 (Boezio et al. 2000), HEAT 94-95 (DuVernois et al. 2001) MASS 91 (Grimani et al. 2002), Sanriku (Kobayashi et al. 1999).

- 25 -
Fig. 4.- y-ray spectrum of conventional model (44-500180) for the sky regions described in Table 2: top row H-A-B, middle row C-D-E, bottom F. The model components are: TO-
decay (dots, red), IC (dashes, green), bremsstrahlung (dash-dot, cyan), EGRB (thin solid, black), total (thick solid, blue). EGRET data: red vertical bars. COMPTEL data: green vertical bars. NB EGRB is added to the total prediction for the EGRET energy range only.

T-
> a> (3
T- I I cn
cn 7
I
7 E X" 3 LL -
- 26 -
0.01
BESS 95-97 0 BESS 98
0.001 1 MASS 91 A CAPRICE 98
44-500080 44-500090 I L
0.1 1 10 Kinetic energy, GeV
Fig. 5.- Antiproton flux as calculated in conventional and optimized models compared with the data (upper curve - LIS, lower - modulated to 550 MV). The lines are coded as in Fig. 2. Data: BESS 95-97 (Orito et al. 2000), BESS 98 (Asaoka et al. 2002), MASS 91 (Basini et al. 1999), CAPRICE 98 (Boezio et al. 2001).

- 27 -
1 00
> a a,
I I I POSITRONS - o AMS I 0 CAPRICE 94
A MASS 91 O HEAT 94-95
Q, = 600 MV
0.1 1 10 100 Kinetic energy, GeV
Fig. 6.- Positron spectra for conventional and optimized models compared with data (upper curve - LIS, lower - modulated to 600 MV). The lines are coded as in Fig. 2. Data: AMs-I (Alcaraz et al. 2000a), CAPRICE 94 (Boezio et al. 2000), HEAT 94-95 (DuVernois et al. 2001) MASS 91 (Grimani et al. 2002).

- 28 -
L
. , - , I
,. . h ,
- .'brrmr. i . .. , i I lul ,, ,1 ,,uuul,Luvv 10. '''"1.' '
1 i o 10' io ' io ' 10' io' energy, MeV
1 IO to2 IO' IO' 10' i o ' energy. MeV
s t I
energy, MeV
Fig. 7.- y-ray spectra of hard electron spectrum model (500181); regions and coding as for Fig. 4.

- 29 -
energy. MeV
Fig. 8.- y-ray spectra of optimized model (44-500190); regions and coding as for Fig. 4.

Galactic longitude
Galactic longitude
Galactic iongilud+
- 30 -
zo.12
E q 0.1 > .) - &.w C -
0.0.
0.01
0.02
9
3 0 2
;O.lS
€0.1.
gfJ.1. * oo.12 c - a,
0.08
0.0.
OM
0.02
Gaiactic longitude
b *E0.35 0
3 0.1
20.25
- .I
- 0.1
0.11
0.1
0.01
9 G~ I~CI IC ioniitude
Galactic longitude
Fig. 9.- Longitude profiles (lbl < 5.5") for optimized
Galactic longitude
Galactic longitude
i o .1 .
L q-0.14
I >*.11
6 0.1 - - L1 - - O M
0.M
0.M
0.02
Galactic longitude
model (500190), compared with EGRET data in 10 energy ranges, 30 MeV - 10 GeV. Lines are coded as in Fig. 4.

-31 -
Galactic latitude - 8 0 4 0 - 4 0 - 2 0 0 2 0 4 0 w 80
Galactic latitude
Fig. 10.- Latitude profiles for optimized model (500190), inner Galaxy (330" < I < 30"), compared with EGRET data in 12 energy ranges 30 MeV - 50 GeV. Lines are coded as in Fig. 4.

- 32 -
-80 -60 -40 -20 0 20 40 w 80 Galactic latitude
-80 60 -40 -20 0 20 40 60 80 Galactic latitude
- 8 0 6 0 - 4 0 - 2 0 0 20 40 60 80 Galactic latitude
10.
-80 -60 -40 -20 0 20 40 W 80 Galactic latitude
- 8 0 6 0 - 4 0 - 2 0 0 20 40 w 80 Galactic latitude
-80 40 -40 -20 0 20 40 w 80 Galactlc latitude
-80 4 0 -40 -20 0 20 40 w 80 Galactic Iatltude
-80 60 -40 -20 0 . 2 0 40 60 80 Galactic Iatihlde
Fig. 11.- Latitude profiles for optimized model (500190), except inner Galaxy (30" < I < 330"), compared with EGRET data in 10 energy ranges 30 MeV - 10 GeV. Lines are coded as in Fig. 4.

- 33 -
100
cu Lu 0.1
0.01 0.1
1 I I I I
1 10 100 1000 Kinetic energy, GeV
Fig. 12.- Electron spectra for conventional (solid) and optimized models (dots). Upper curve - LIS, lower - modulated to 600 MV. Secondary electrons are shown separately for the same models.
- 34 -
I I I I I
galdef ID 44-500090 0.5°<1<60.50, 300.5°<1<359.E galdef ID 44-500083 -1 0.5'<b~-0.5~, 0.5°<bC10.Z
I 10 lo2 io3 lo4 lo5 io6 Energy, MeV
Fig. 13.- y-ray spectrum of optimized model with (thick lines) and without (thin lines) primary electrons, to show the contribution of secondary electrons and positrons. Brtot and Br2 labels denote the total bremsstrahlung and the separate contribution from secondary leptons, correspondingly. Similarly, ICtot, IC2 indicate the total IC and the contribution from secondaries.