cycling, air pollution exposure & health an overview of...
TRANSCRIPT
Cycling, air pollution exposure & health An overview of research findings
Michael Brauer, Christie Cole
The University of British Columbia
School of Population and Public Health
VeloCity 2012 June 27, 2012 Vancouver
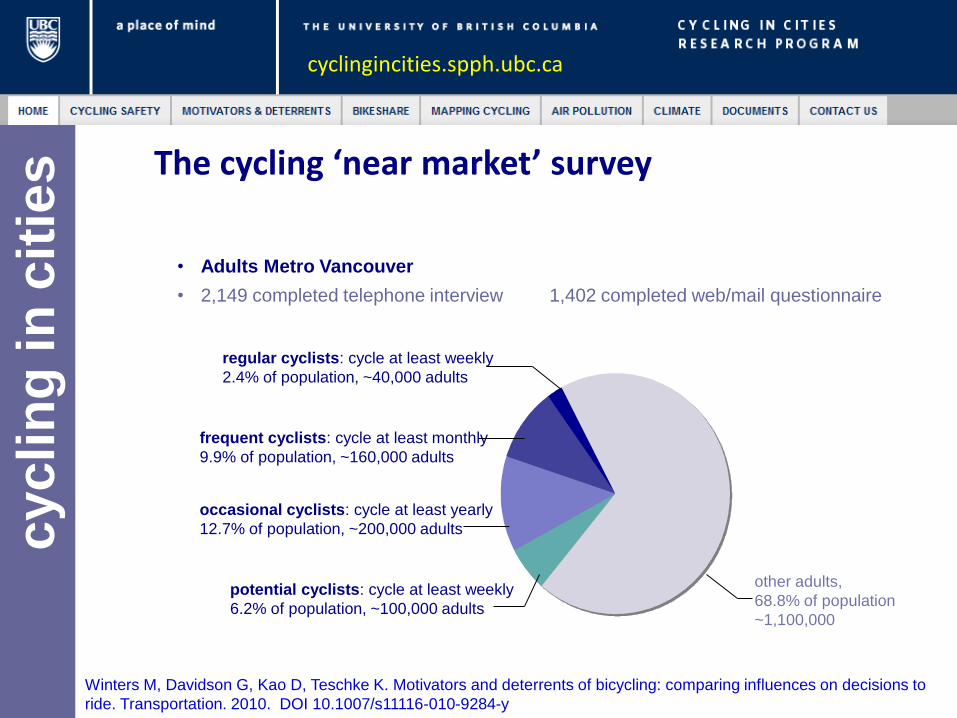
• Adults Metro Vancouver
• 2,149 completed telephone interview 1,402 completed web/mail questionnaire
cyclin
g i
n c
itie
s
The cycling ‘near market’ survey
other adults,
68.8% of population
~1,100,000
regular cyclists: cycle at least weekly
2.4% of population, ~40,000 adults
frequent cyclists: cycle at least monthly
9.9% of population, ~160,000 adults
occasional cyclists: cycle at least yearly
12.7% of population, ~200,000 adults
potential cyclists: cycle at least weekly
6.2% of population, ~100,000 adults
Winters M, Davidson G, Kao D, Teschke K. Motivators and deterrents of bicycling: comparing influences on decisions to
ride. Transportation. 2010. DOI 10.1007/s11116-010-9284-y
cyclingincities.spph.ubc.ca
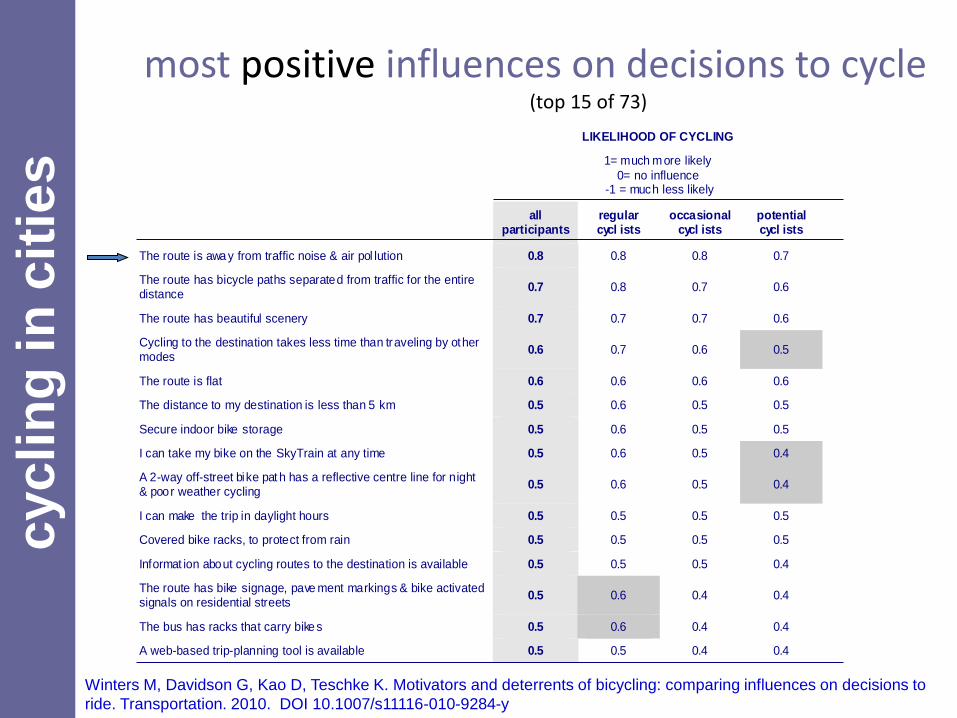
LIKELIHOOD OF CYCLING
1= much more likely
0= no influence -1 = much less likely
all participants
regular cycl ists
occasional cycl ists
potential cycl ists
The route is away from traffic noise & air pol lution 0.8 0.8 0.8 0.7
The route has bicycle paths separated from traffic for the entire distance
0.7 0.8 0.7 0.6
The route has beautiful scenery 0.7 0.7 0.7 0.6
Cycling to the destination takes less time than traveling by other modes
0.6 0.7 0.6 0.5
The route is flat 0.6 0.6 0.6 0.6
The distance to my destination is less than 5 km 0.5 0.6 0.5 0.5
Secure indoor bike storage 0.5 0.6 0.5 0.5
I can take my bike on the SkyTrain at any time 0.5 0.6 0.5 0.4
A 2-way off-street bike pat h has a reflective centre line for night & poor weather cycling
0.5 0.6 0.5 0.4
I can make the trip in daylight hours 0.5 0.5 0.5 0.5
Covered bike racks, to protect from rain 0.5 0.5 0.5 0.5
Informat ion about cycling routes to the destination is available 0.5 0.5 0.5 0.4
The route has bike signage, pave ment markings & bike activated signals on residential streets
0.5 0.6 0.4 0.4
The bus has racks that carry bikes 0.5 0.6 0.4 0.4
A web-based trip-planning tool is available 0.5 0.5 0.4 0.4
most positive influences on decisions to cycle (top 15 of 73)
cyclin
g i
n c
itie
s
Winters M, Davidson G, Kao D, Teschke K. Motivators and deterrents of bicycling: comparing influences on decisions to
ride. Transportation. 2010. DOI 10.1007/s11116-010-9284-y
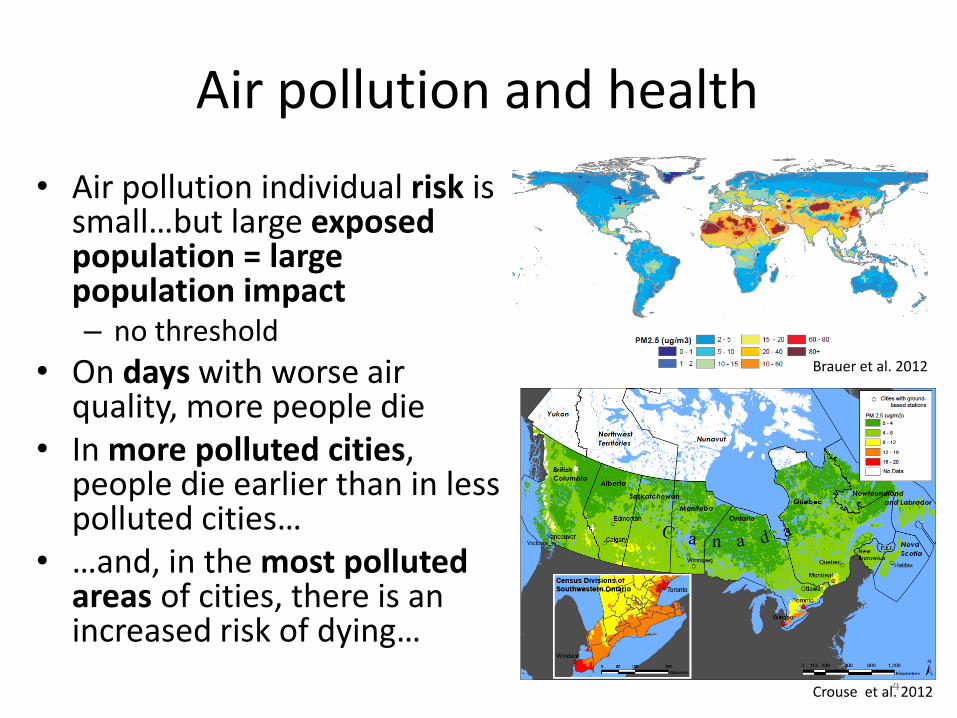
Air pollution and health
• Air pollution individual risk is small…but large exposed population = large population impact – no threshold
• On days with worse air quality, more people die
• In more polluted cities, people die earlier than in less polluted cities…
• …and, in the most polluted areas of cities, there is an increased risk of dying…
4
Brauer et al. 2012
Crouse et al. 2012

Pollution gradients
Karner et al. (2010) Environ. Sci. Technol. 44, 5334
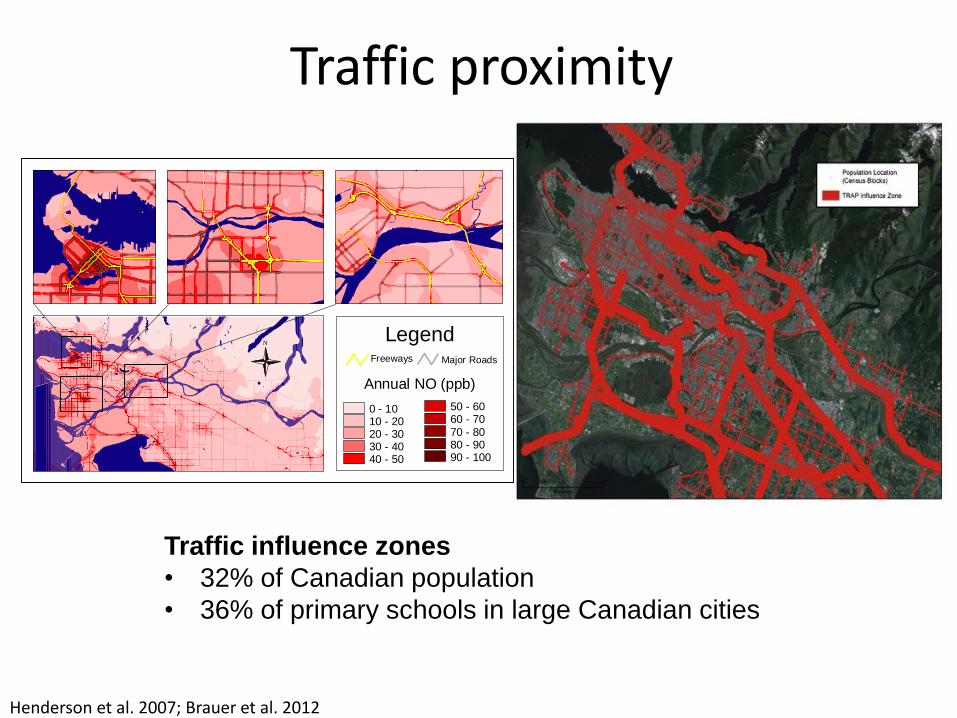
Traffic proximity
Traffic influence zones
• 32% of Canadian population
• 36% of primary schools in large Canadian cities
Henderson et al. 2007; Brauer et al. 2012
Freeways Major Roads
Legend
Annual NO (ppb)
N
0 - 1010 - 2020 - 3030 - 4040 - 50
50 - 6060 - 7070 - 8080 - 9090 - 100
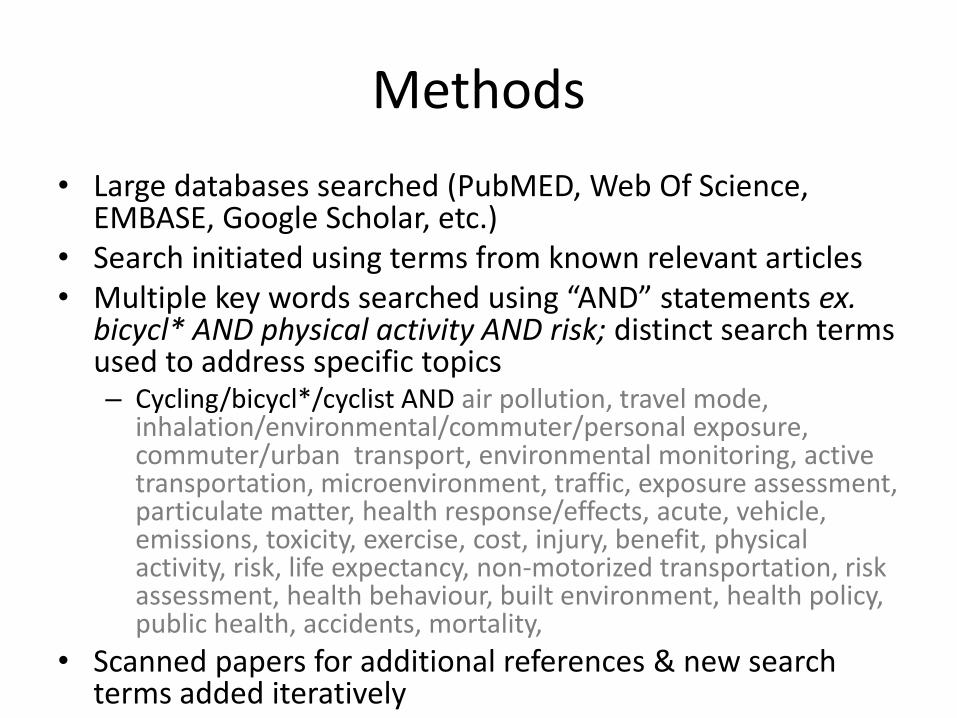
Methods
• Large databases searched (PubMED, Web Of Science, EMBASE, Google Scholar, etc.)
• Search initiated using terms from known relevant articles • Multiple key words searched using “AND” statements ex.
bicycl* AND physical activity AND risk; distinct search terms used to address specific topics – Cycling/bicycl*/cyclist AND air pollution, travel mode,
inhalation/environmental/commuter/personal exposure, commuter/urban transport, environmental monitoring, active transportation, microenvironment, traffic, exposure assessment, particulate matter, health response/effects, acute, vehicle, emissions, toxicity, exercise, cost, injury, benefit, physical activity, risk, life expectancy, non-motorized transportation, risk assessment, health behaviour, built environment, health policy, public health, accidents, mortality,
• Scanned papers for additional references & new search terms added iteratively
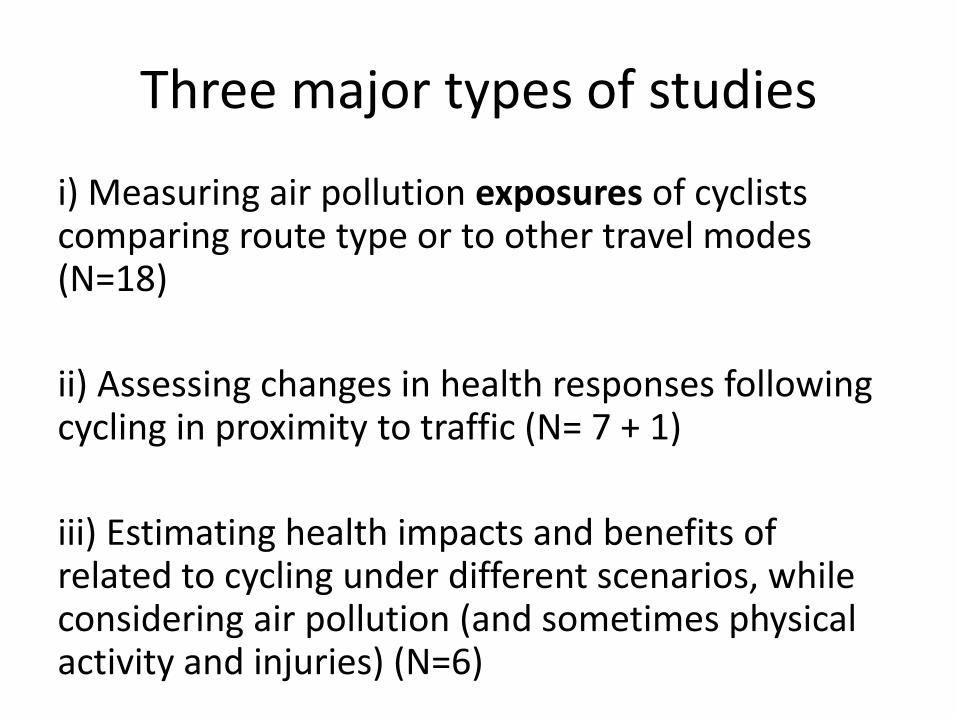
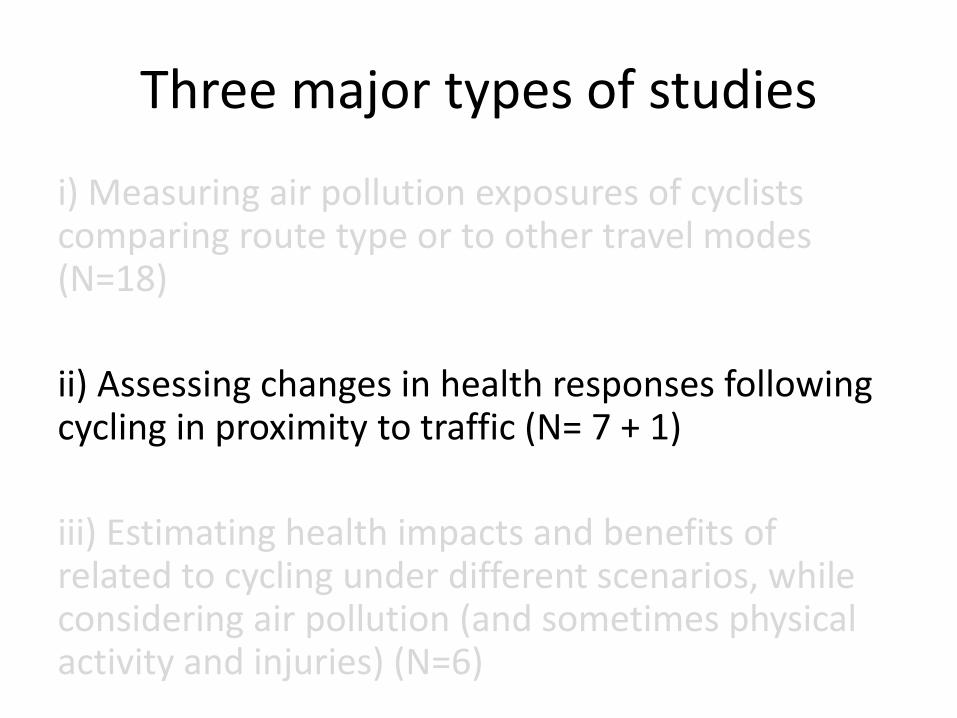
Three major types of studies
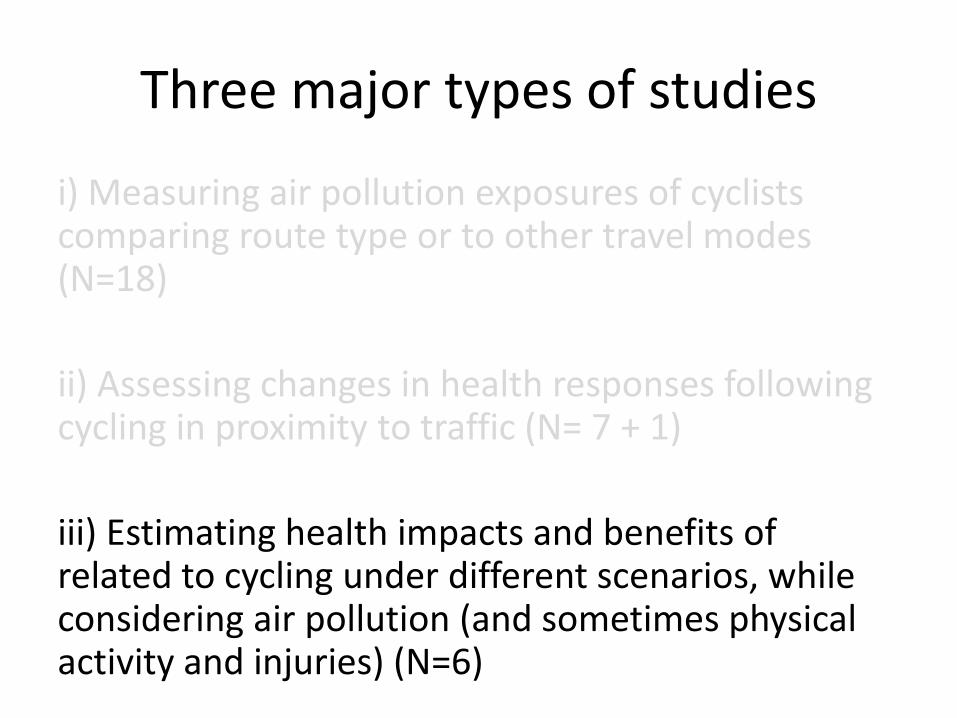
i) Measuring air pollution exposures of cyclists comparing route type or to other travel modes (N=18)
ii) Assessing changes in health responses following cycling in proximity to traffic (N= 7 + 1)
iii) Estimating health impacts and benefits of related to cycling under different scenarios, while considering air pollution (and sometimes physical activity and injuries) (N=6)
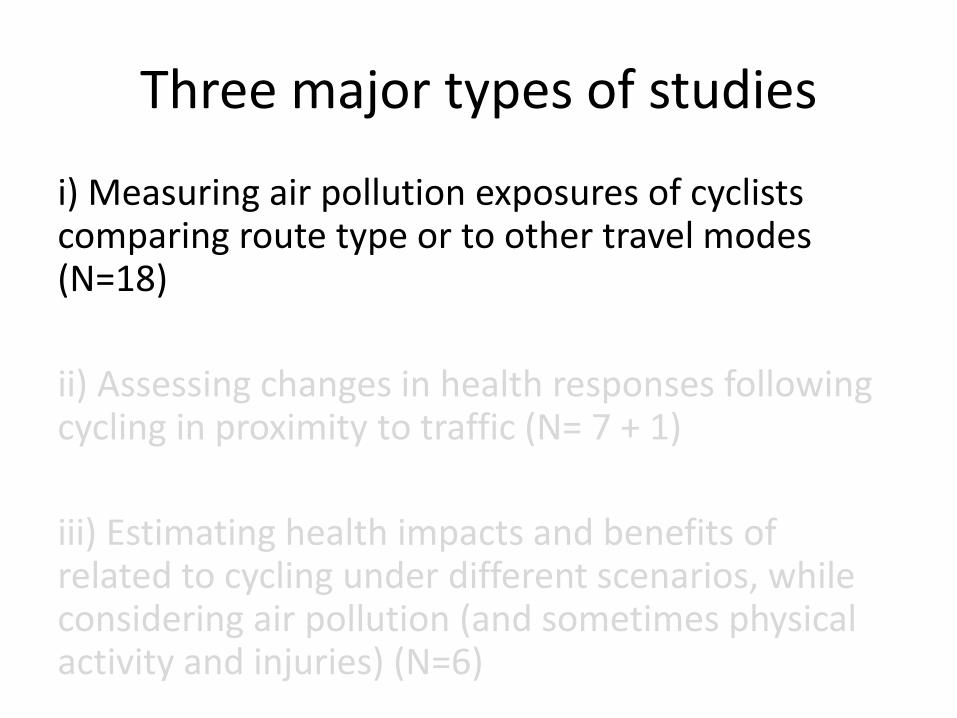
Three major types of studies
i) Measuring air pollution exposures of cyclists comparing route type or to other travel modes (N=18)
ii) Assessing changes in health responses following cycling in proximity to traffic (N= 7 + 1)
iii) Estimating health impacts and benefits of related to cycling under different scenarios, while considering air pollution (and sometimes physical activity and injuries) (N=6)
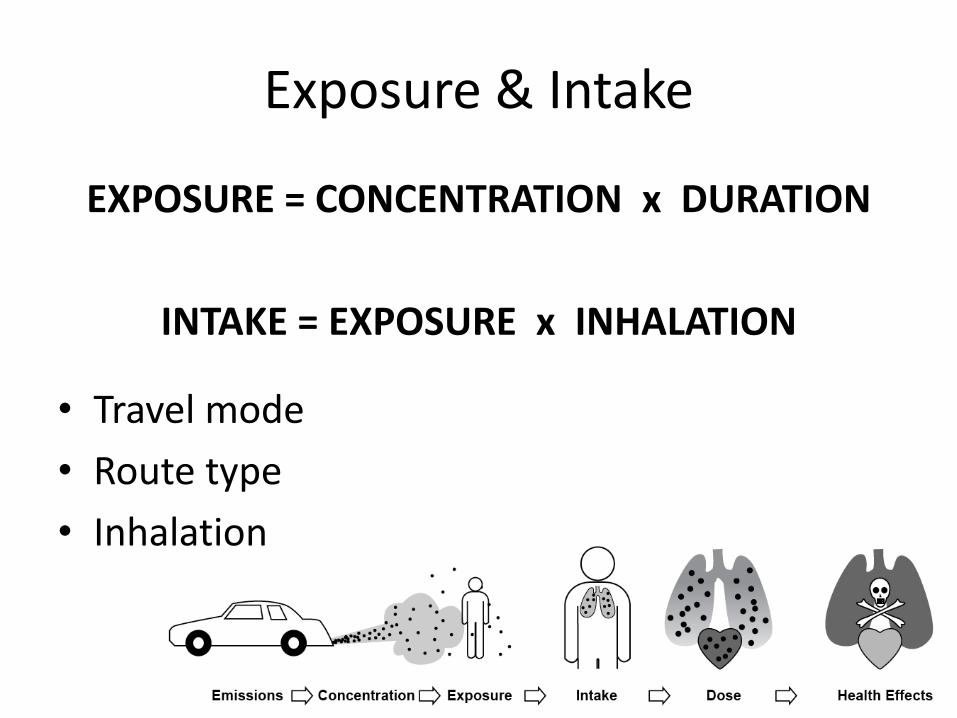
Exposure & Intake
EXPOSURE = CONCENTRATION x DURATION
INTAKE = EXPOSURE x INHALATION
• Travel mode
• Route type
• Inhalation
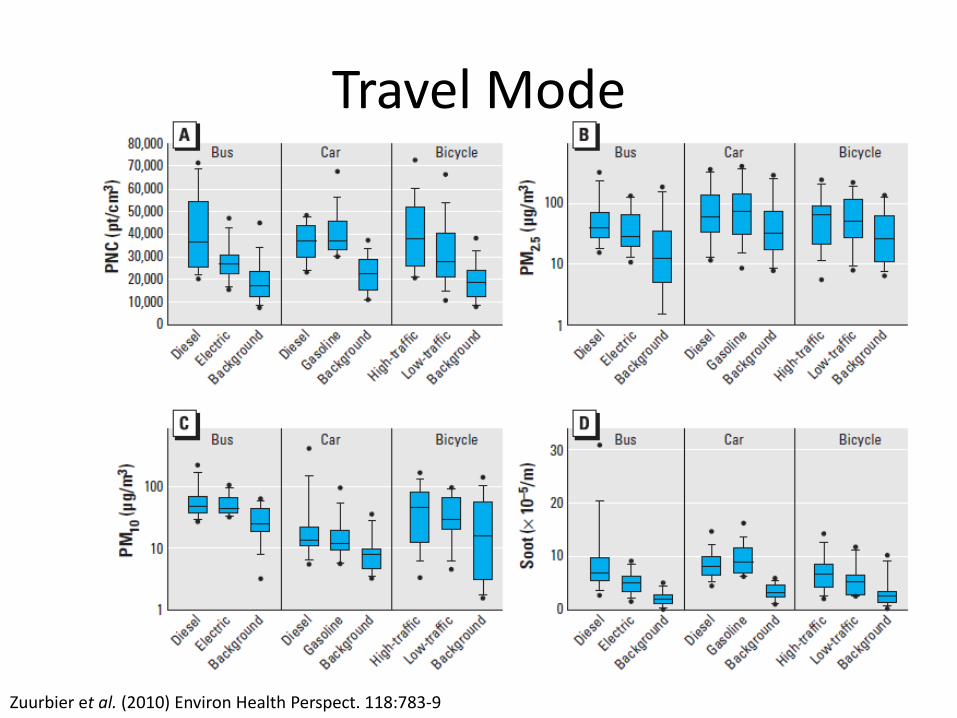
Travel Mode
Zuurbier et al. (2010) Environ Health Perspect. 118:783-9
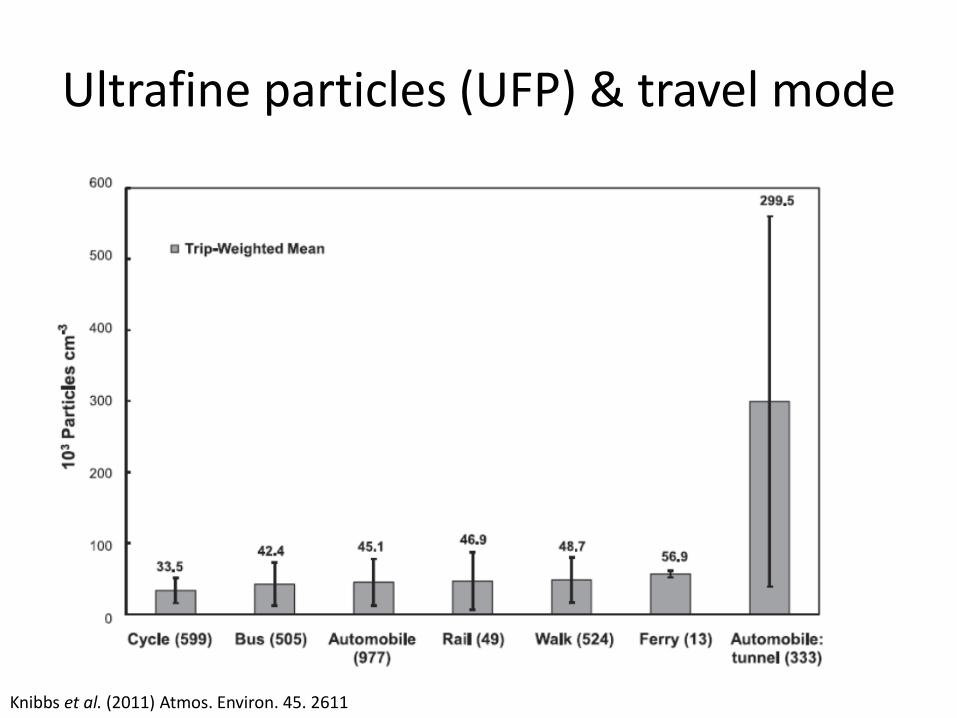
Ultrafine particles (UFP) & travel mode
Knibbs et al. (2011) Atmos. Environ. 45. 2611
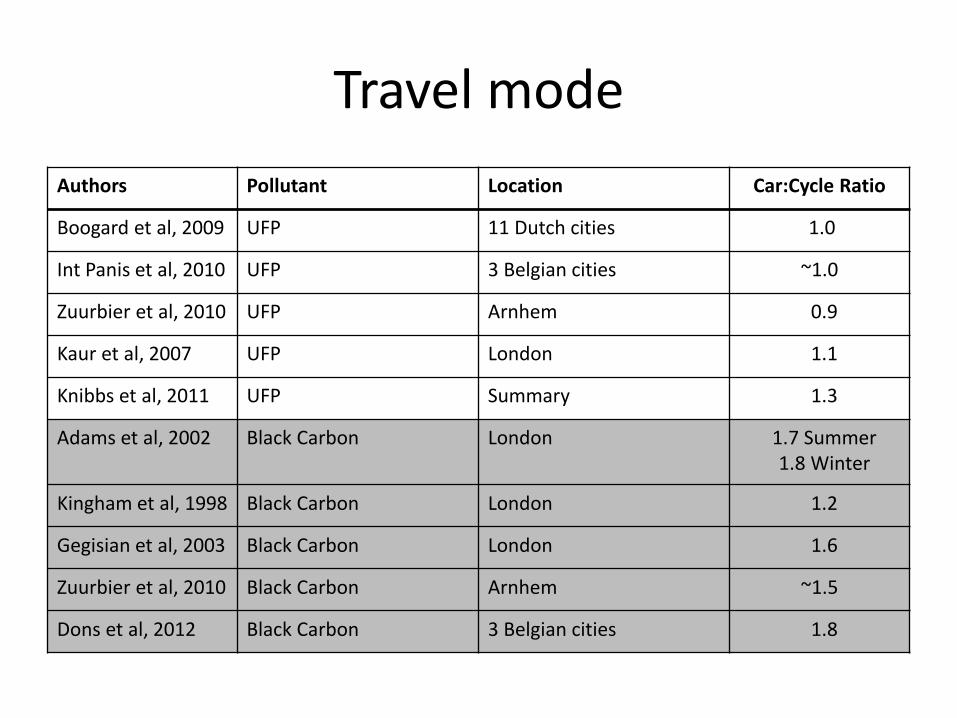
Travel mode
Authors Pollutant Location Car:Cycle Ratio
Boogard et al, 2009 UFP 11 Dutch cities 1.0
Int Panis et al, 2010 UFP 3 Belgian cities ~1.0
Zuurbier et al, 2010 UFP Arnhem 0.9
Kaur et al, 2007 UFP London 1.1
Knibbs et al, 2011 UFP Summary 1.3
Adams et al, 2002 Black Carbon London 1.7 Summer 1.8 Winter
Kingham et al, 1998 Black Carbon London 1.2
Gegisian et al, 2003 Black Carbon London 1.6
Zuurbier et al, 2010 Black Carbon Arnhem ~1.5
Dons et al, 2012 Black Carbon 3 Belgian cities 1.8
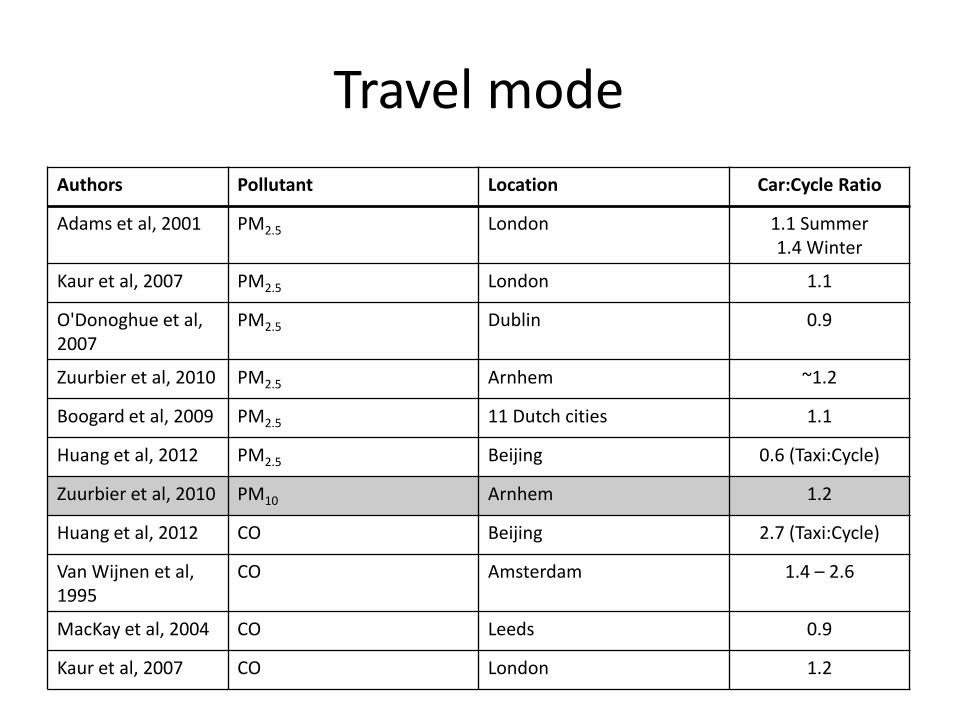
Travel mode
Authors Pollutant Location Car:Cycle Ratio
Adams et al, 2001 PM2.5 London 1.1 Summer 1.4 Winter
Kaur et al, 2007 PM2.5 London 1.1
O'Donoghue et al, 2007
PM2.5 Dublin 0.9
Zuurbier et al, 2010 PM2.5 Arnhem ~1.2
Boogard et al, 2009 PM2.5 11 Dutch cities 1.1
Huang et al, 2012 PM2.5 Beijing 0.6 (Taxi:Cycle)
Zuurbier et al, 2010 PM10 Arnhem 1.2
Huang et al, 2012 CO Beijing 2.7 (Taxi:Cycle)
Van Wijnen et al, 1995
CO Amsterdam 1.4 – 2.6
MacKay et al, 2004 CO Leeds 0.9
Kaur et al, 2007 CO London 1.2
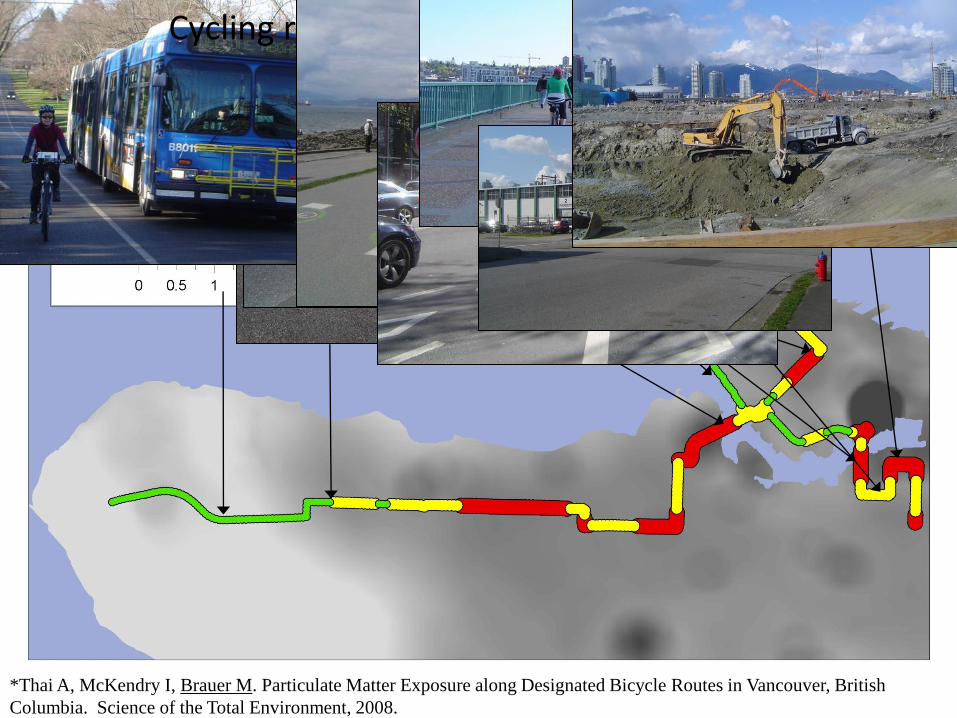
Cycling routes and air pollutant exposure
*Thai A, McKendry I, Brauer M. Particulate Matter Exposure along Designated Bicycle Routes in Vancouver, British
Columbia. Science of the Total Environment, 2008.

Route Type (traffic level) Authors Pollutant Location High:Low traffic
Route Ratio
Strak et al, 2009 UFP Utrecht, Netherlands 1.6
Zuurbier et al, 2010 UFP Arnhem, Netherlands 1.4
Kaur et al, 2007 UFP London, UK 1.4
Knibbs et al, 2011 UFP Summary ~1.3
Kingham et al, 1998 Black Carbon London 2.3
Strak et al, 2009 Black Carbon Utrecht 1.4
Zuurbier et al, 2010 Black Carbon Arnhem 1.3
Adams et al, 2001 PM2.5 London 1.2 – 1.5
Zuurbier et al, 2010 PM2.5 Arnhem 1.0
Strak et al, 2009 PM2.5 Utrecht 1.0
Zuurbier et al, 2010 PM10 Arnhem 1.0
Bevan et al, 1991 CO Southampton, UK 1.6
Bevan et al, 1991 VOCs Southampton ~2.0
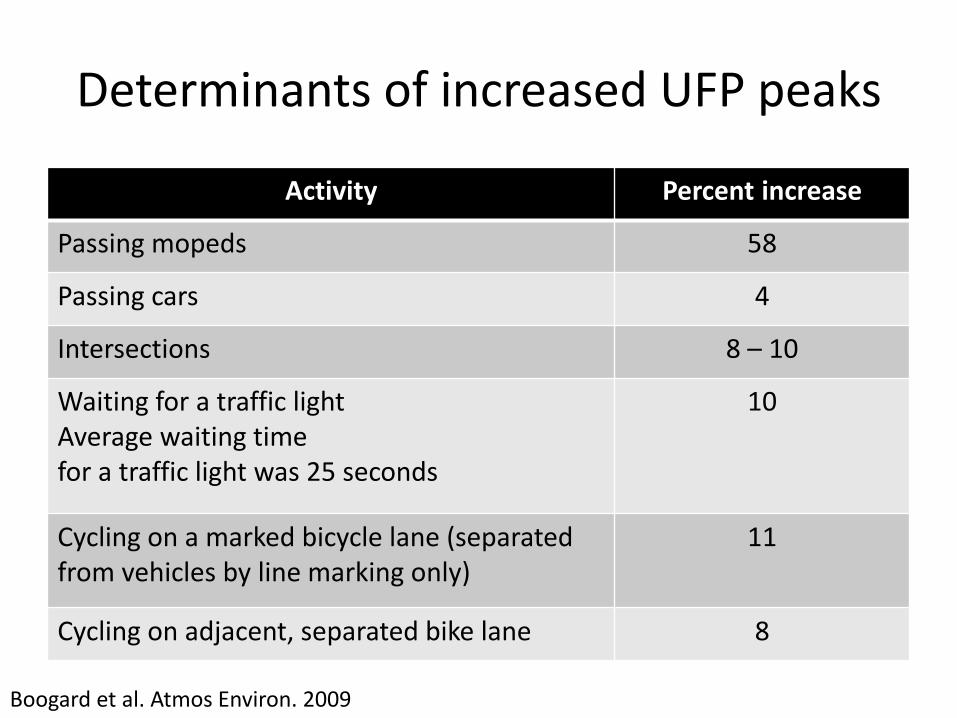
Determinants of increased UFP peaks
Activity Percent increase
Passing mopeds 58
Passing cars 4
Intersections 8 – 10
Waiting for a traffic light Average waiting time for a traffic light was 25 seconds
10
Cycling on a marked bicycle lane (separated from vehicles by line marking only)
11
Cycling on adjacent, separated bike lane 8
Boogard et al. Atmos Environ. 2009
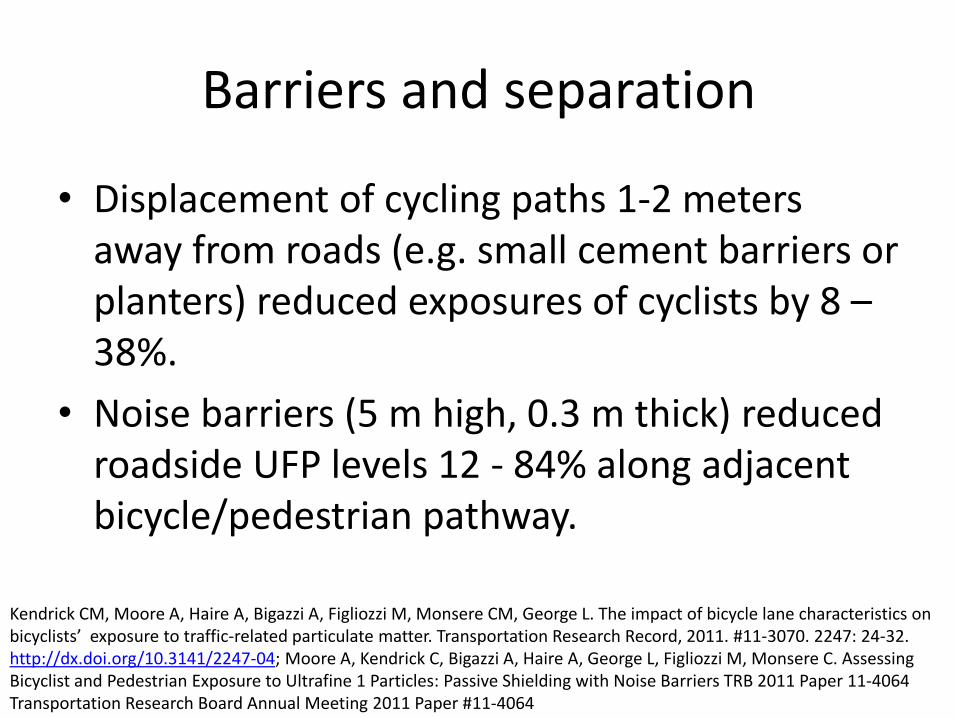
Barriers and separation
• Displacement of cycling paths 1-2 meters away from roads (e.g. small cement barriers or planters) reduced exposures of cyclists by 8 – 38%.
• Noise barriers (5 m high, 0.3 m thick) reduced roadside UFP levels 12 - 84% along adjacent bicycle/pedestrian pathway.
Kendrick CM, Moore A, Haire A, Bigazzi A, Figliozzi M, Monsere CM, George L. The impact of bicycle lane characteristics on bicyclists’ exposure to traffic-related particulate matter. Transportation Research Record, 2011. #11-3070. 2247: 24-32. http://dx.doi.org/10.3141/2247-04; Moore A, Kendrick C, Bigazzi A, Haire A, George L, Figliozzi M, Monsere C. Assessing Bicyclist and Pedestrian Exposure to Ultrafine 1 Particles: Passive Shielding with Noise Barriers TRB 2011 Paper 11-4064 Transportation Research Board Annual Meeting 2011 Paper #11-4064
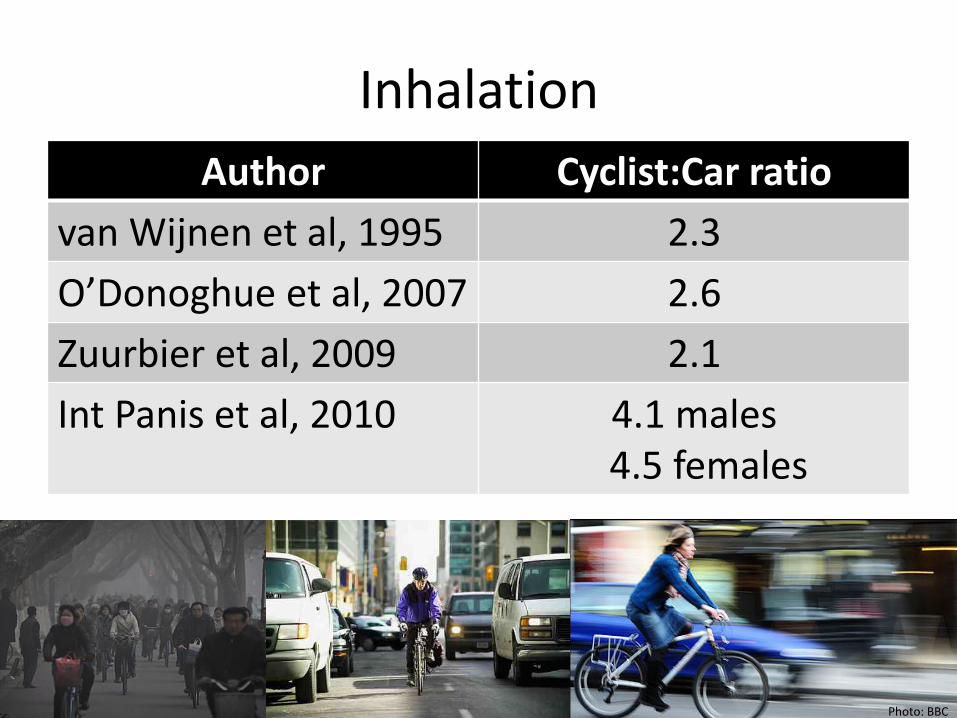
Inhalation
Author Cyclist:Car ratio
van Wijnen et al, 1995 2.3
O’Donoghue et al, 2007 2.6
Zuurbier et al, 2009 2.1
Int Panis et al, 2010 4.1 males 4.5 females
Photo: BBC
Three major types of studies
i) Measuring air pollution exposures of cyclists comparing route type or to other travel modes (N=18)
ii) Assessing changes in health responses following cycling in proximity to traffic (N= 7 + 1)
iii) Estimating health impacts and benefits of related to cycling under different scenarios, while considering air pollution (and sometimes physical activity and injuries) (N=6)
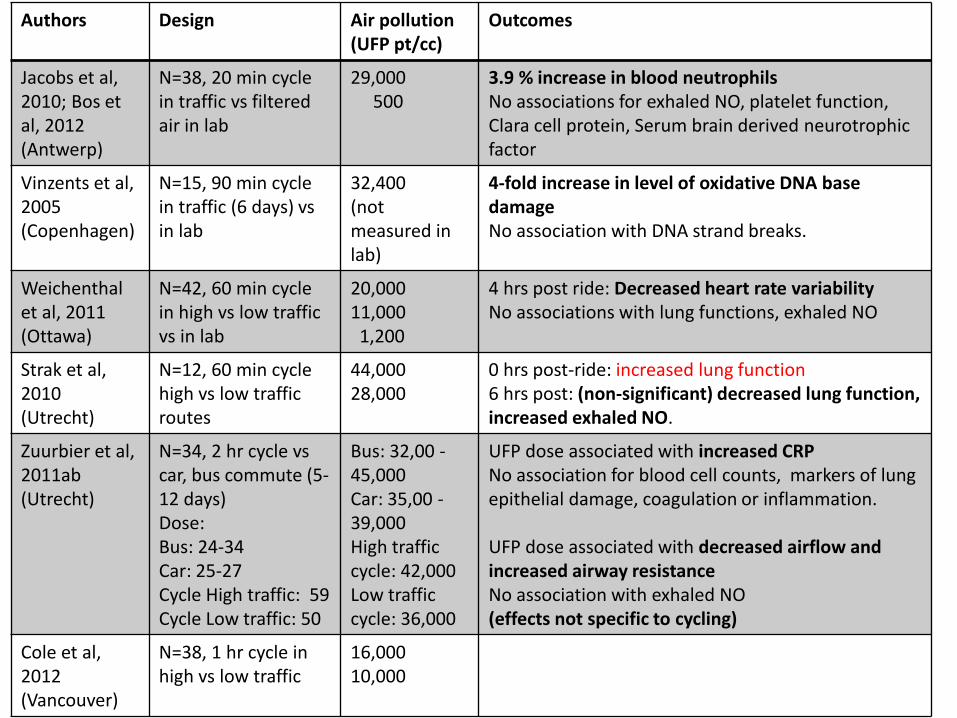
Authors Design Air pollution (UFP pt/cc)
Outcomes
Jacobs et al, 2010; Bos et al, 2012 (Antwerp)
N=38, 20 min cycle in traffic vs filtered air in lab
29,000 500
3.9 % increase in blood neutrophils No associations for exhaled NO, platelet function, Clara cell protein, Serum brain derived neurotrophic factor
Vinzents et al, 2005 (Copenhagen)
N=15, 90 min cycle in traffic (6 days) vs in lab
32,400 (not measured in lab)
4-fold increase in level of oxidative DNA base damage No association with DNA strand breaks.
Weichenthal et al, 2011 (Ottawa)
N=42, 60 min cycle in high vs low traffic vs in lab
20,000 11,000 1,200
4 hrs post ride: Decreased heart rate variability No associations with lung functions, exhaled NO
Strak et al, 2010 (Utrecht)
N=12, 60 min cycle high vs low traffic routes
44,000 28,000
0 hrs post-ride: increased lung function 6 hrs post: (non-significant) decreased lung function, increased exhaled NO.
Zuurbier et al, 2011ab (Utrecht)
N=34, 2 hr cycle vs car, bus commute (5-12 days) Dose: Bus: 24-34 Car: 25-27 Cycle High traffic: 59 Cycle Low traffic: 50
Bus: 32,00 - 45,000 Car: 35,00 - 39,000 High traffic cycle: 42,000 Low traffic cycle: 36,000
UFP dose associated with increased CRP No association for blood cell counts, markers of lung epithelial damage, coagulation or inflammation. UFP dose associated with decreased airflow and increased airway resistance No association with exhaled NO (effects not specific to cycling)
Cole et al, 2012 (Vancouver)
N=38, 1 hr cycle in high vs low traffic
16,000 10,000
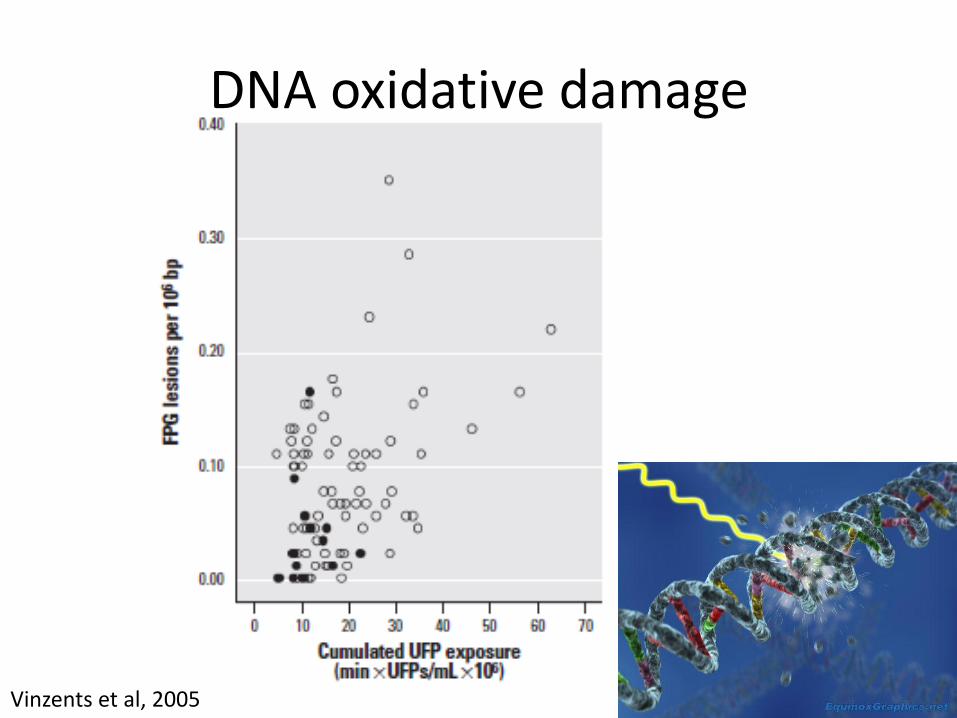
DNA oxidative damage
Vinzents et al, 2005
Three major types of studies
i) Measuring air pollution exposures of cyclists comparing route type or to other travel modes (N=18)
ii) Assessing changes in health responses following cycling in proximity to traffic (N= 7 + 1)
iii) Estimating health impacts and benefits of related to cycling under different scenarios, while considering air pollution (and sometimes physical activity and injuries) (N=6)
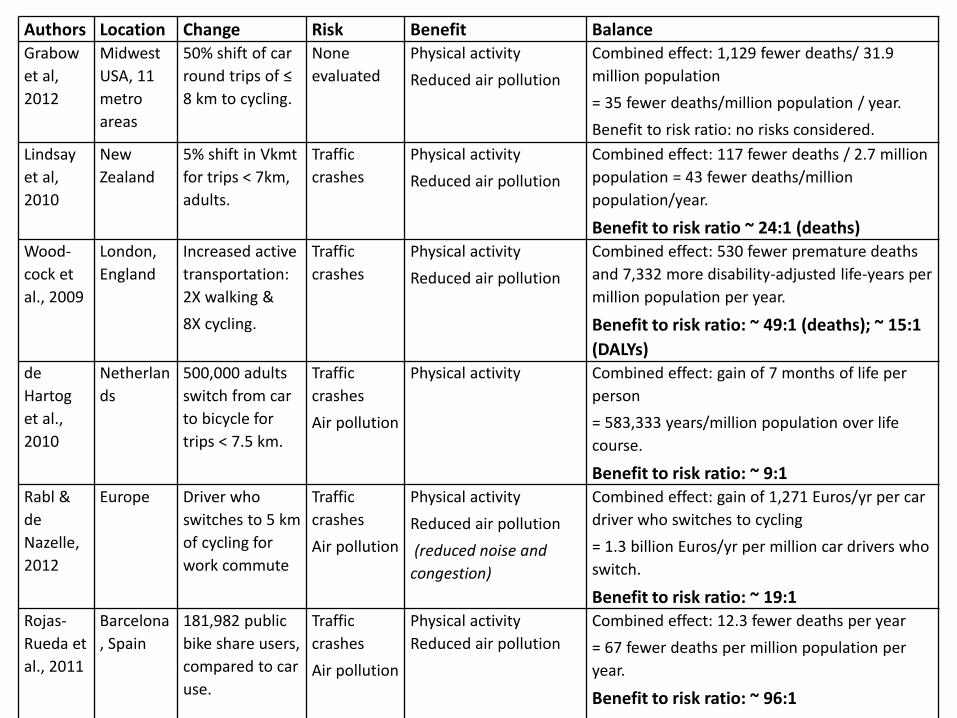
Authors Location Change Risk Benefit Balance
Grabow
et al,
2012
Midwest
USA, 11
metro
areas
50% shift of car
round trips of ≤
8 km to cycling.
None
evaluated
Physical activity
Reduced air pollution
Combined effect: 1,129 fewer deaths/ 31.9
million population
= 35 fewer deaths/million population / year.
Benefit to risk ratio: no risks considered.
Lindsay
et al,
2010
New
Zealand
5% shift in Vkmt
for trips < 7km,
adults.
Traffic
crashes
Physical activity
Reduced air pollution
Combined effect: 117 fewer deaths / 2.7 million
population = 43 fewer deaths/million
population/year.
Benefit to risk ratio ~ 24:1 (deaths) Wood-
cock et
al., 2009
London,
England
Increased active
transportation:
2X walking &
8X cycling.
Traffic
crashes
Physical activity
Reduced air pollution
Combined effect: 530 fewer premature deaths
and 7,332 more disability-adjusted life-years per
million population per year.
Benefit to risk ratio: ~ 49:1 (deaths); ~ 15:1
(DALYs) de
Hartog
et al.,
2010
Netherlan
ds
500,000 adults
switch from car
to bicycle for
trips < 7.5 km.
Traffic
crashes
Air pollution
Physical activity
Combined effect: gain of 7 months of life per
person
= 583,333 years/million population over life
course.
Benefit to risk ratio: ~ 9:1
Rabl &
de
Nazelle,
2012
Europe Driver who
switches to 5 km
of cycling for
work commute
Traffic
crashes
Air pollution
Physical activity
Reduced air pollution
(reduced noise and
congestion)
Combined effect: gain of 1,271 Euros/yr per car
driver who switches to cycling
= 1.3 billion Euros/yr per million car drivers who
switch.
Benefit to risk ratio: ~ 19:1
Rojas-
Rueda et
al., 2011
Barcelona
, Spain
181,982 public
bike share users,
compared to car
use.
Traffic
crashes
Air pollution
Physical activity
Reduced air pollution
Combined effect: 12.3 fewer deaths per year
= 67 fewer deaths per million population per
year.
Benefit to risk ratio: ~ 96:1
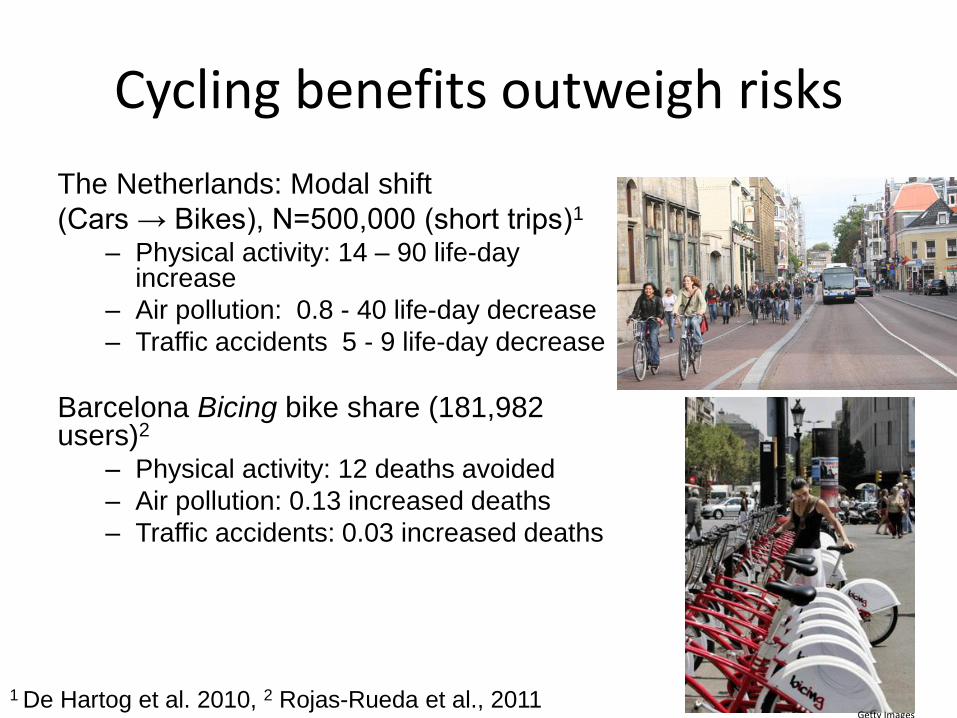
Cycling benefits outweigh risks
The Netherlands: Modal shift
(Cars → Bikes), N=500,000 (short trips)1 – Physical activity: 14 – 90 life-day
increase
– Air pollution: 0.8 - 40 life-day decrease
– Traffic accidents 5 - 9 life-day decrease
Barcelona Bicing bike share (181,982 users)2
– Physical activity: 12 deaths avoided
– Air pollution: 0.13 increased deaths
– Traffic accidents: 0.03 increased deaths
1 De Hartog et al. 2010, 2 Rojas-Rueda et al., 2011 Getty Images
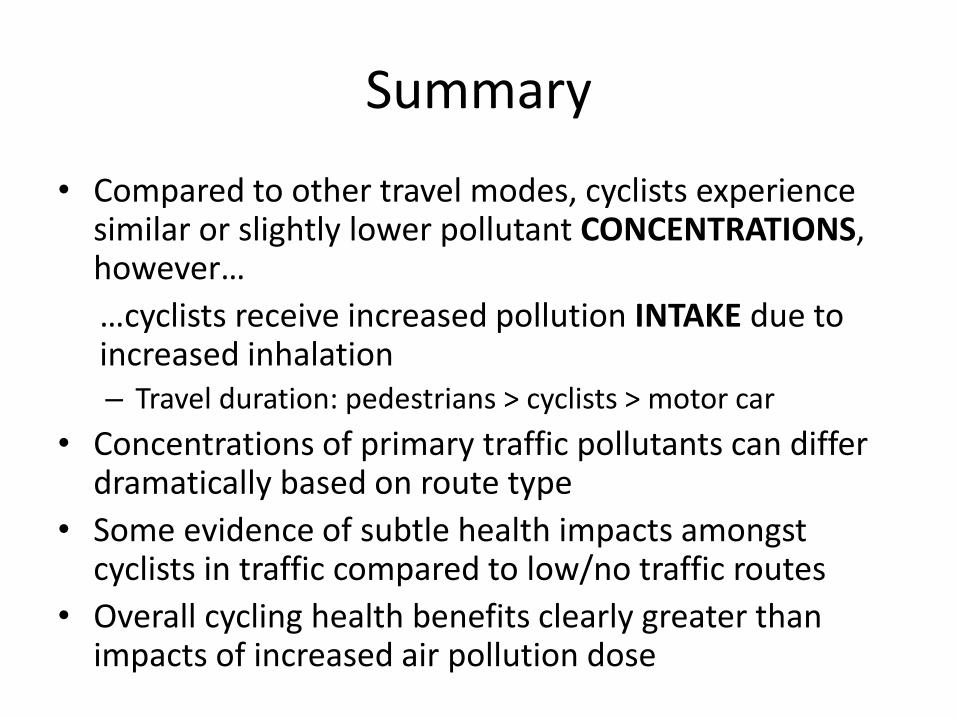
Summary
• Compared to other travel modes, cyclists experience similar or slightly lower pollutant CONCENTRATIONS, however…
…cyclists receive increased pollution INTAKE due to increased inhalation – Travel duration: pedestrians > cyclists > motor car
• Concentrations of primary traffic pollutants can differ dramatically based on route type
• Some evidence of subtle health impacts amongst cyclists in traffic compared to low/no traffic routes
• Overall cycling health benefits clearly greater than impacts of increased air pollution dose
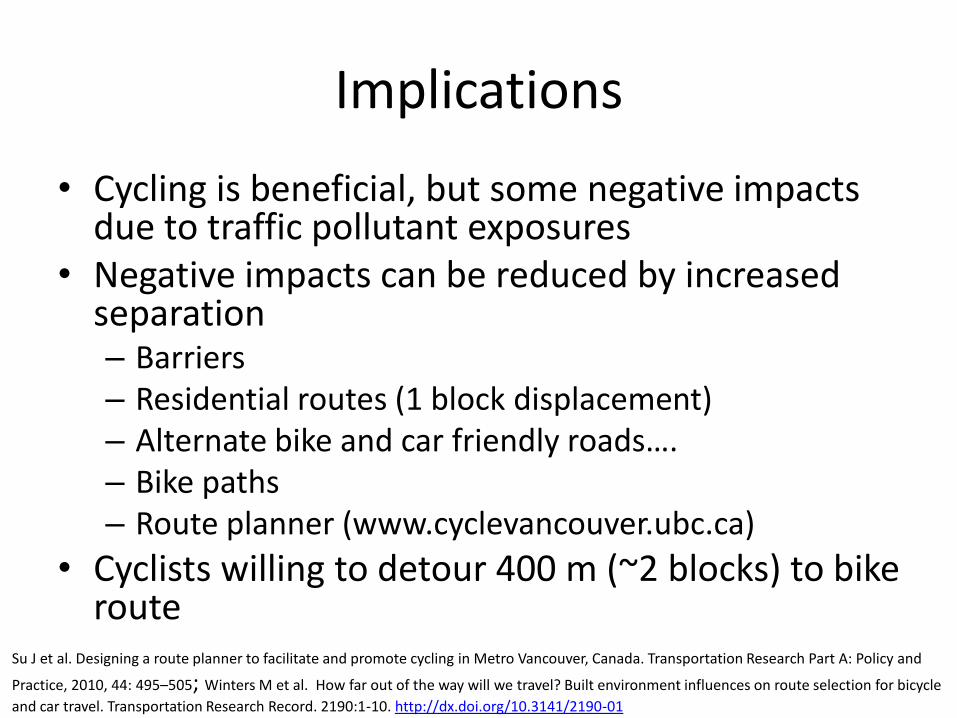
Implications
• Cycling is beneficial, but some negative impacts due to traffic pollutant exposures
• Negative impacts can be reduced by increased separation – Barriers – Residential routes (1 block displacement) – Alternate bike and car friendly roads…. – Bike paths – Route planner (www.cyclevancouver.ubc.ca)
• Cyclists willing to detour 400 m (~2 blocks) to bike route
Su J et al. Designing a route planner to facilitate and promote cycling in Metro Vancouver, Canada. Transportation Research Part A: Policy and
Practice, 2010, 44: 495–505; Winters M et al. How far out of the way will we travel? Built environment influences on route selection for bicycle
and car travel. Transportation Research Record. 2190:1-10. http://dx.doi.org/10.3141/2190-01

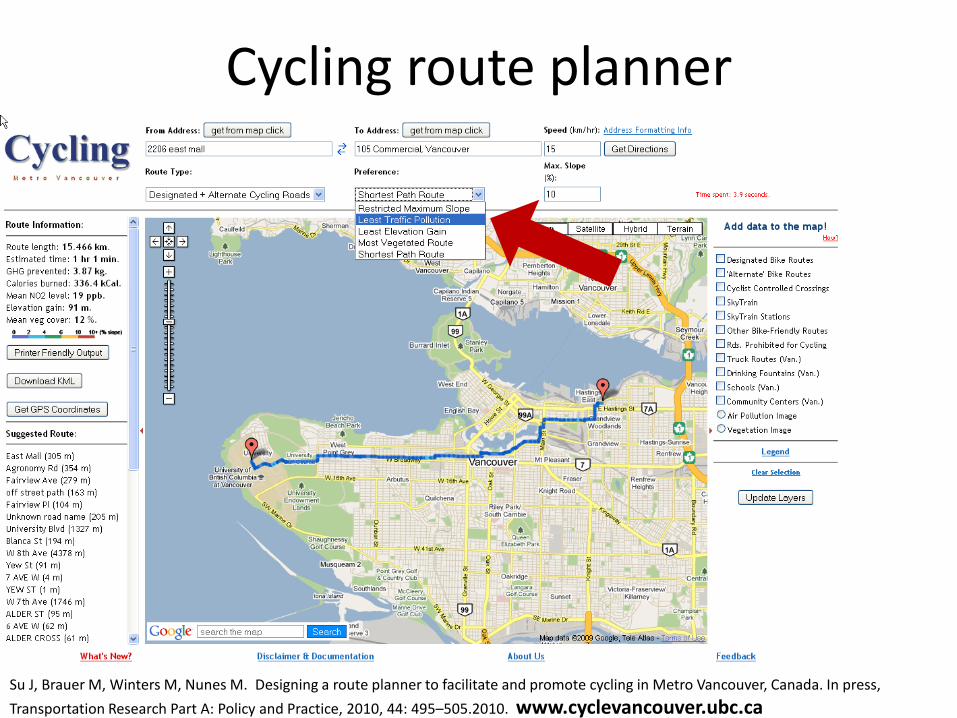
Cycling route planner
Su J, Brauer M, Winters M, Nunes M. Designing a route planner to facilitate and promote cycling in Metro Vancouver, Canada. In press,
Transportation Research Part A: Policy and Practice, 2010, 44: 495–505.2010. www.cyclevancouver.ubc.ca
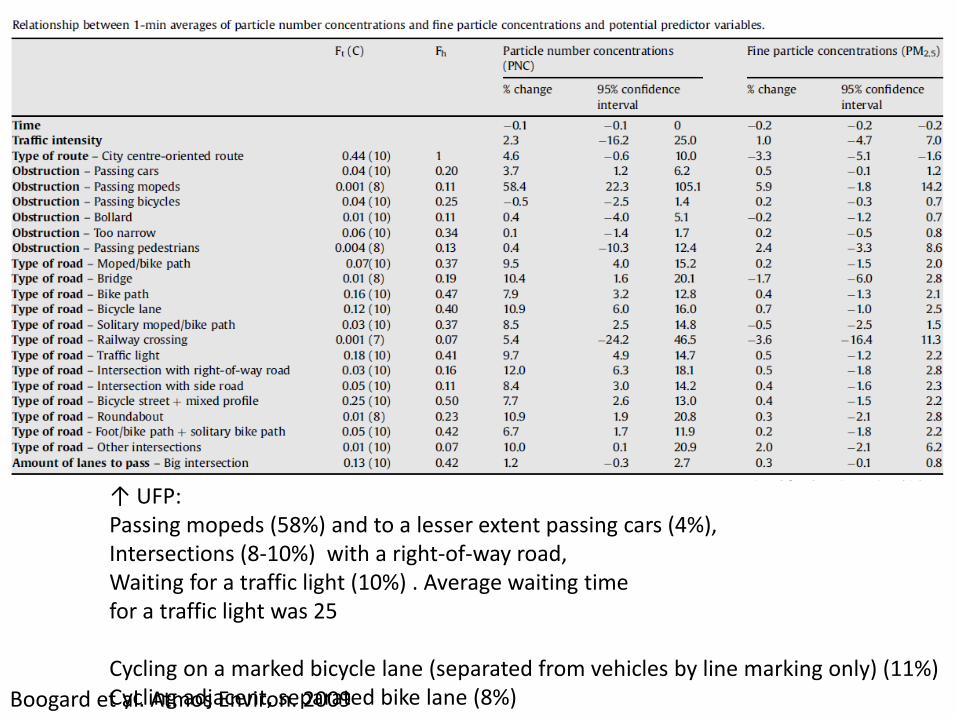
Boogard et al. Atmos Environ. 2009
↑ UFP: Passing mopeds (58%) and to a lesser extent passing cars (4%), Intersections (8-10%) with a right-of-way road, Waiting for a traffic light (10%) . Average waiting time for a traffic light was 25 Cycling on a marked bicycle lane (separated from vehicles by line marking only) (11%) Cycling adjacent, separated bike lane (8%)