customer asset protection insurance for u.s. … · industry customer asset protection insurance...
TRANSCRIPT

CUSTOMER ASSET PROTECTION INSURANCE FOR U.S. FUTURES MARKET CUSTOMERS
November 15, 2013

EXECUTIVE SUMMARY The failures of MF Global in October 2011 and Peregrine Financial Group in July 2012 prompted U.S. futures market participants and the Commodity Futures Trading Commission (“CFTC”) to implement significant changes that improve the protection of customer assets in U.S. futures markets.i Despite these recent enhancements, some industry participants and regulators contend that the creation of a customer asset protection insurance (“CAPI”) program is necessary to provide additional protection of customer assets.
Compass Lexecon was retained by the CME Group (“CME”), Futures Industry Association (“FIA”), Institute for Financial Markets (“IFM”), and National Futures Association (“NFA”) to conduct a study of how CAPI might work in the U.S. futures industry and to evaluate the economic benefits and costs of alternative CAPI approaches. The study was directed by Christopher L. Culp, who is a Senior Advisor with Compass Lexecon, an Honorarprofessor and Professor for Insurance in the Institut für Finanzmanagement at Universität Bern (Switzerland), and an Adjunct Professor of Finance at The University of Chicago’s Booth School of Business. The results of the study appear in the report that follows (the “Report”) and are summarized here.
Customer Assets at Risk
U.S. futures customers (e.g., grain elevators, cooperative associations of farmers, non-financial multinationals, proprietary trading firms, and retail traders) execute their transactions through futures commission merchants (“FCMs”). One of the foundations underlying U.S. futures markets is the protection of customer assets held by FCMs, which include assets on deposit to satisfy customer margin requirements and any customer assets on deposit with FCMs in excess of their margin requirements. Since 1974, CFTC regulations have required every FCM to segregate customer assets away from the FCM’s own funds, recognize those segregated assets as customer property, and maintain sufficient funds in customer accounts to cover all obligations to return assets to customers upon their request. In the event that those regulations are violated and an FCM’s actual segregated assets held by the FCM for its customers are less than the amount that the FCM owes to its customers, the FCM is said to be “under-segregated.”
An FCM may become under-segregated as a result of misfeasance or malfeasance (e.g., fraud, embezzlement, misappropriation of customer funds, and operational failures), as occurred at MF Global (operational failure) and Peregrine Financial (embezzlement). In addition, a shortfall in customer segregated funds may occur if one or more customers of an FCM incur significant losses and fail to honor their margin calls (known as “fellow-customer risk”). In both cases, FCM customers can realize losses arising from the failure of an under-segregated FCM. The study and Report consider the feasibility and potential benefits and costs of CAPI for covering
i This study and report focus exclusively on futures and futures options, which are collectively referred to herein as “futures” unless explicitly stated otherwise. Customer protections and insurance for users of cleared swaps are not the focus of the study or report.
Page ii

U.S. futures customers for all or a portion of the losses that might incur as a result of either of these risks.
We analyzed both private, voluntary CAPI (i.e., CAPI programs provided by private insurance or reinsurance companies to FCMs or their customers on an opt-in basis) and government-mandated, universal CAPI in the study and discuss both in the Report. Our analyses and conclusions for the two different types of CAPI programs are summarized in the sections that follow.
Private, Voluntary CAPI
In order to quantify the potential out-of-pocket costs of private, voluntary CAPI, we sought to obtain realistic indications of what such programs would cost from market participants. To compare costs consistently across different insurance industry participants, we defined several specific CAPI scenarios on which (re-)insurersii could comment:
• Scenario #1: CAPI provided by primary insurance carriers to individual futures customers; • Scenario #2: CAPI provided to customers of individual FCMs that might purchase insurance
voluntarily on behalf of all of their customers; and • Scenario #3: CAPI provided to customers of FCMs opting to participate in a risk retention
group or “FCM Captive” insurance company backed partially by reinsurance.
(Re-)insurance market participants generally considered both Scenarios #1 or #2 to be too costly. Specifically, insurers were concerned that the administrative and underwriting costs (including the analysis of customer-by-customer risks) were too high relative to the potential number of customers (and, hence, potential revenues) and risk exposures. In addition, insurers expressed concerns about the viability and economic purpose of the “first-loss retention” in both scenarios.
More specifically, virtually all commercial insurance requires the insurance beneficiary to bear some material exposure to first losses in order to mitigate “moral hazard” – i.e., the risk that the insurance coverage reduces the incentives of the insured party to manage its risk responsibly. In Scenario #1, any first-loss retention would be borne by individual customers in the form of a policy deductible. Insurers were concerned, however, that a customer-level deductible would not actually align the risk-management incentives of insurance beneficiaries with insurers. CAPI would only be triggered by the failure of an under-segregated FCM. Because the FCM and not its customers would be the entity responsible for monitoring and controlling the risk of misfeasance, malfeasance, or fellow-customer losses that might trigger a CAPI payment, imposing a deductible on customers would not significantly impact FCM-level risk management and thus would not mitigate moral hazard. Insurers were also concerned that any customer-level deductible would be unpalatable to customers, which is consistent with information we received from market participants.
Similar concerns about the first-loss retention were expressed about Scenario #2. Individual FCMs purchasing CAPI on behalf of their customers would be required to retain first-loss
ii We use the term “(re-)insurers” to refer collective to primary insurance companies and reinsurance companies.
Page iii

exposure through a deductible, which in that case (unlike Scenario #1) would properly address insurers’ concerns with alignments of incentives and mitigating moral hazard. To provide credible assurance to its customers, however, an individual FCM purchasing CAPI would likely have to pre-fund its first-loss retention (i.e., set aside assets to cover customer CAPI claims inside the deductible layer). In order to keep such funds available to honor customer CAPI claims and not become part of the bankruptcy estate following an FCM’s failure, any FCM wishing to pursue such a program likely could incur significant costs to ensure the bankruptcy remoteness of the funded first-loss retention. Insurers did not expect any such solutions to be cost-effective for FCMs (or themselves), and thus declined to pursue this scenario.
Therefore, we focused on Scenario #3 in the remainder of our analysis. In this scenario, several FCMs jointly form an FCM Captive insurance company that would provide CAPI to customers of its FCM participants. The FCM Captive would retain the first-loss risk exposure (i.e., claims in the first-loss layer would be mutualized and absorbed across participating non-failing FCMs), and reinsurance would cover claims in excess of that first-loss retention.
In order for interested reinsurers to have adequate information to respond with meaningful premium indications for Scenario #3, we performed a comprehensive empirical analysis of customer assets exposed to under-segregation risk in U.S. futures markets. Specifically, we asked various U.S. FCMs to provide customer-level position and asset data for each month-end in 2012. The analysis performed on that data included conducting stress tests (in cooperation with CME Clearing) to quantify potential customer assets at risk in the event of widespread market disruptions. We then provided summary estimates of our risk analyses to potential private CAPI reinsurers.
A consortium of eight of the reinsurers we contacted provided us with an indicative term sheet for the provision of CAPI by a proposed FCM Captive that the consortium calls the Futures Industry Customer Asset Protection Insurance Company (“FICAP”). The FICAP proposal reflects the collective pricing analysis from these eight firms, which consist of five syndicates in Lloyd’s of London and three reinsurers in Bermuda and Switzerland.
As proposed, FICAP would cover up to $300 million per year in CAPI claims by customers of Participating FCMs. The first $50 million in losses would be a first-loss deductible funded by paid-in capital from the FCM participants (and additional funding sources, as discussed in the Report). The additional $250 million in CAPI coverage above the first $50 million in losses would be funded by the reinsurance syndicate, subject to a maximum payout of $50 million per FCM.
The FICAP proposal assumes an initial group of between four and 10 Participating FCMs, most of which would have under $1 billion in customer assets (“Small FCMs”) and a few of which might have between $1 billion and $5 billion in customer assets (“Medium FCMs”). All Participating FCMs would be subject to minimum participation criteria regarding their risk profiles, management regimes, and risk-management and internal control frameworks.
The proposal indicates a cost for the reinsurance of FICAP’s CAPI coverage of between five and eight percent per annum (relative to the total $300 million facility size). A one percent annual fee would also be assessed for the FICAP Facility Manager. The total cost of the proposed program thus would be between $18 million to $27 million per year. This estimated range of premiums is
Page iv

just an initial indication of cost provided for the purpose of this study. The final price would, of course, depend on actual underwriting analyses, the specific Participating FCMs, and negotiations between FCMs and the reinsurance syndicate.
Premiums would be assessed to Participating FCMs on a pro rata basis based on the potential claims payments to customers plus an adjustment for the specific risks of Participating FCMs and their customers relative to the portfolio of risks within FICAP. Because the proposal currently limits per-FCM claims to $50 million, the pro rata allocation (ignoring a risk adjustment) would allocate premium equally to FCMs regardless of their size or number of customers. For example, with five participating Small FCMs and one participating Medium FCM, total premium costs would range from $3,000,000 to $4,500,000 at the low and high ends of the indicated premium range, respectively.
In the Report, we provide an example of how the total premium charged to Small and Medium FCMs might in turn be passed on to customers based on the amounts of assets held by those customers. Assuming customers’ CAPI premium payments are proportional to the potential CAPI payments received in the event of an FCM’s failure, customers could expect ratios of premium costs to CAPI payments in a range of about six to nine percent. For example, at the low end of the premium cost range, a customer expecting to receive $1,000 in CAPI payments would pay about $60 per year for CAPI.
The amount of CAPI payments received depends largely on the amount of the total customer asset loss at the FCM vis-à-vis the per-loss limit of $50 million. An FCM with $100 million in customer asset losses, for example, would recover at most $50 million, so all customers would receive CAPI payments covering only 50 percent of their lost assets.
Government-Mandated, Universal CAPI Coverage
The fourth scenario we considered involves government-mandated and universal CAPI coverage of U.S. futures customers. To analyze this scenario, we used one proposal indicative of this type of insurance program, although other variations may exist.iii Under this particular proposal, a Futures Investor and Customer Protection Corporation (“FICPC”) would purportedly offer protection to U.S. futures customers similar to the protection that is afforded to securities investors by the Securities Investor Protection Corporation (“SIPC”). Unlike the three private, voluntary scenarios, all FCMs and their customers would be required to participate in FICPC.
More specifically, the FICPC would provide up to $250,000 to all customers of every U.S. FCM to cover losses (with no first-loss retention) arising from the failure of under-segregated FCMs. FICPC would be funded by mandatory payments from FCMs of up to 0.5 percent of each FCM’s previous annual gross revenues related to futures trading until reaching a target funding level of not more than $2.5 billion. The proposed $2.5 billion funding target for FICPC is equivalent to the current SIPC funding target.
iii Statement of CFTC Commissioner Bart Chilton (August 9, 2012).
Page v

In 2012, the 62 FCMs reporting positive annual gross revenues from commodities to CME and NFA had average annual gross revenues of $82.3 million, and the total annual gross revenue for all FCMs was $5.1 billion. In the first year, FICPC would receive (based on 2012 gross revenue numbers) an average of $411,635 from each FCM for a total across all FCMs of $25,521,389.iv By comparison, the average of SIPC member assessments and contributions from 2008 through 2012 was about $310 per annum.
As long as revenues exceed claims, FICPC’s assets would grow over time, but the growth rate would be slow vis-à-vis the target $2.5 billion funding level even if there are no claims. For example, assuming a two percent return on FICPC’s assets each year, an annual contribution by FCMs of $25,521,389 (i.e., 2012 levels), and no CAPI claims, the FICPC Fund would not reach its target $2.5 billion funding level for 54 years.
With an annual contribution by FCMs of $25,521,389, the amount of assets in a FICPC Fund is not likely to provide much short-term comfort to U.S. futures customers without a government backstop to close the gap between actual funds available and potential customer liabilities. The first-year projected funding amount of about $25.5 million, after all, would only have covered about 12 percent of customer losses at Peregrine Financial.
In addition, FICPC is predicated on a fundamental mismatch of sources of funds and customer beneficiaries of those funds. In 2012, the customers of the 10 FCMs (of the 62 FCMs reporting positive annual gross revenues from commodities to CME and NFA) with the highest amounts of customer assets at year-end 2012 would have accounted for 44 percent of FICPC’s funding. The median value of customer assets on deposit at Large FCMs (defined as FCMs with customer assets of more than $5 billion) in 2012 was roughly $1.4 million, as compared to median customer assets on deposit at Small and Medium FCMs in 2012 of $4,434 and $5,089, respectively. The FICPC would thus disproportionally benefit the customers of Small and Medium FCMs when compared to customers of Large FCMs required to provide the greatest proportional source of funding.
The adoption of a universal, mandated FICPC solution, moreover, would likely discourage the development and implementation of market-based, private, and voluntary CAPI solutions. In U.S. securities markets, the only meaningful private CAPI offering is “Excess SIPC” insurance (discussed in the Report). Such insurance is based on the existence of SIPC as the equivalent of a first-loss protection layer. In the absence of a government-mandated, universal first-loss layer, a variety of different private, voluntary CAPI solutions might arise.
Conclusions
The objective of this study was to analyze various potential CAPI solutions for U.S. futures customers. We were not engaged to and do not provide any policy recommendations. The Report that follows thus presents the results of our analyses and does not offer any proscriptive policy recommendations.
iv Numbers may not appear to reconcile because of rounding.
Page vi

For private, voluntary CAPI, we ascertained that there is an interest and willingness on the part of reinsurers to offer CAPI to U.S. futures customers through an FCM Captive that would absorb the first-loss layer. Although the indicative terms of the specific proposed coverage by FICAP are restrictive and likely to appeal at best only to certain Small FCMs, the reinsurers backing that proposal appear to be serious and committed to the provision of a potential CAPI solution. The indicative term sheet, moreover, was provided to us specifically for this study and not to facilitate the closing of an actual deal. Any deal-specific negotiations could lead to deviations from the indicative term sheet that might be more favorable to U.S. FCMs and their customers. Thus, it now remains for potentially interested FCMs and reinsurers to ascertain whether they can agree on a mutually beneficial CAPI structure and at what cost.
For government-mandated CAPI, the empirical evidence indicates that a FICPC fund would be significantly under-funded to meet its initial target funding level. In order for FICPC to offer a credible assurance to U.S. futures customers that potential under-segregation losses arising from FCM failures are funded and covered, a significant taxpayer-backed government backstop would be necessary to supplement the envisioned paid-in capital of FICPC.
Page vii

CONTENTS Executive Summary ........................................................................................................................ ii
Customer Assets at Risk .............................................................................................................. ii Private, Voluntary CAPI ............................................................................................................ iii Government-Mandated, Universal CAPI Coverage .................................................................... v Conclusions ................................................................................................................................ vi
Contents ....................................................................................................................................... viii Index of Exhibits & Tables ........................................................................................................... xii Selected Acronyms and Abbreviations ........................................................................................ xiii I. Introduction ............................................................................................................................. 1
A. Background and Context for the Study ............................................................................. 1 B. Scope of Project and Study ............................................................................................... 1 C. Structure of the Report ...................................................................................................... 2
Part 1: U.S. Futures Markets, Customer Assets at Risk, and Customer Protections ............ 4 II. The Structure of U.S. Futures Markets and Customers ........................................................... 4
A. Futures Trading and Customers ........................................................................................ 4 B. DCOs and Clearing Risk Management ............................................................................. 6
(1) Clearing Member Structure of DCOs ........................................................................... 6 (2) Initial Margin Requirements ......................................................................................... 7 (3) Variation Margin and Resettlement .............................................................................. 8 (4) Clearing Member Default Management ....................................................................... 8
C. Customer Asset Segregation Requirements ...................................................................... 9 (1) Customer Segregated Funds ....................................................................................... 10 (2) Foreign-Secured Customer Funds .............................................................................. 11 (3) “Customer Accounts” and “Customer Assets” ........................................................... 12
III. Sources of Customer Assets at Risk ...................................................................................... 12 A. Misfeasance or Malfeasance at an FCM ......................................................................... 13
(1) MF Global................................................................................................................... 14 (2) Peregrine Financial Group .......................................................................................... 18
B. Fellow-Customer Risk ..................................................................................................... 19 (1) Pre-1980 Non-Exchange Member FCM Defaults ...................................................... 19 (2) Fellow-Customer FCM Defaults Without Fellow-Customer Losses ......................... 20 (3) Fellow-Customer FCM Defaults With Fellow-Customer Losses: Griffin Trading ... 21
IV. Recent Enhancements in Customer Asset Protections .......................................................... 21 A. Enhanced Reporting by FCMs ........................................................................................ 22 B. Enhanced Internal Controls and Early Warning Triggers on Customer Fund Transfers 23 C. Elimination of the Alternative Method for Foreign-Secured Accounts .......................... 23 D. New Disclosure Requirements to Current and Prospective Customers .......................... 24
V. Estimates of Customer Assets at Risk ................................................................................... 24 A. Types of Customers of U.S. FCMs ................................................................................. 24
(1) CME............................................................................................................................ 26 (2) NFA ............................................................................................................................ 27
B. Non-Stressed Customer Assets and Misfeasance/Malfeasance Under-Segregation Risk28
Page viii

(1) Customer Assets at Risk by FCM............................................................................... 29 (2) Per-Customer Assets at Risk ...................................................................................... 33 (3) Per-Customer Assets Across FCMs ........................................................................... 35 (4) Per-Customer Assets by Customer Size Category ..................................................... 36
C. Stressed Customer Assets and Fellow-Customer Risk .................................................... 37 (1) Margin and Fellow-Customer Risk ............................................................................ 37 (2) Stress Testing Methodology ....................................................................................... 38
(a) Definition of Price Shocks .................................................................................... 38 (b) Stressed Customer Loss Estimates........................................................................ 39
(3) Customer Default Assumptions .................................................................................. 41
Part 2: Potential Private, Voluntary CAPI Solutions .............................................................. 46 VI. Benefits and Costs of Private, Voluntary CAPI .................................................................... 46
A. Benefits vs. Costs of Insurance for Beneficiaries ............................................................ 46 B. Allocation of Costs for Private, Voluntary CAPI ............................................................ 48 C. Benefits and Costs for the U.S. Futures Industry ............................................................ 48
VII. Background on Potential Private, Voluntary CAPI Alternatives .......................................... 49 A. The Basics of Insurance .................................................................................................. 49 B. The (Re-)Insurance Trigger and Indemnified Losses ...................................................... 51 C. The Insurance Beneficiaries ............................................................................................ 52 D. Potential CAPI Underwriters ........................................................................................... 52
(1) Primary Insurance Carriers ......................................................................................... 52 (2) Captives ...................................................................................................................... 53
E. The First-Loss Retention ................................................................................................. 55 (1) Retention of the First-Loss Risk Layer ....................................................................... 55 (2) Funded vs. Unfunded First-Loss Retention ................................................................ 56
F. Policy Limits ................................................................................................................... 56 (1) Fixed Policy Limits .................................................................................................... 57 (2) Aggregate Facility Limits and “Inner Limits” ............................................................ 57
VIII. Specific Private, Voluntary CAPI Scenarios ....................................................................... 58 A. Scenario #1: CAPI Provided Directly to Individual Customers ...................................... 58 B. Scenario #2: CAPI Provided to Customers of Individual FCMs .................................... 59 C. Scenario #3: CAPI Provided to Individual Customers Through a Captive or Mutual .... 61
(1) FCM Captive .............................................................................................................. 61 (2) Customer Mutual ........................................................................................................ 62
D. Other Scenarios ............................................................................................................... 62 (1) CCC/CIC .................................................................................................................... 62 (2) CME Family Farmer and Rancher Protection Fund ................................................... 63 (3) Excess SIPC-Like Coverage for Futures .................................................................... 64
(a) Typical Excess SIPC Surety Bonds ...................................................................... 65 (b) Providers of Excess SIPC Coverage ..................................................................... 66 (c) Excess SIPC-Like Coverage for U.S. FCMs and Their Customers ...................... 68
E. Risk Finance in a Voluntary CAPI Regime .................................................................... 68 IX. Cost Estimates and Capital Availability for Private, Voluntary CAPI ................................. 70
A. Request to (Re-)Insurance Market Participants ............................................................... 70 B. Data Provided to Prospective Reinsurers ........................................................................ 71
Page ix

(1) Conditional Expected Losses and the First-Loss Retention ....................................... 71 (2) Fixed Customer Limits vs. Aggregate First-Loss Retention ...................................... 72 (3) Misfeasance and Malfeasance Under-Segregation Risk ............................................ 72 (4) Fellow-Customer Under-Segregation Risk ................................................................ 77 (5) Summary of Potential First-Loss Retentions .............................................................. 78
C. Funding for the First-Loss Layer ..................................................................................... 79 (1) Partially Funded First-Loss Retention ........................................................................ 79 (2) Fully Funded First-Loss Retention ............................................................................. 80 (3) External Resources for Funding the First-Loss Retention.......................................... 81 (4) Initial Capital vs. Subsequent Capital Requirements ................................................. 82
D. FICAP Insurance Co. ...................................................................................................... 82 (1) Capacity and Term ...................................................................................................... 82 (2) Reinsurance Syndicate ................................................................................................ 83 (3) Participating FCMs ..................................................................................................... 83 (4) Facility Manager and Board of Directors ................................................................... 83 (5) Maximum Payout Per Loss......................................................................................... 84 (6) Premium Cost ............................................................................................................. 85 (7) Funding the First-Loss Retention ............................................................................... 89 (8) Founder Group Benefits ............................................................................................. 89
E. Financing for Immediate CAPI Payments to Customers ................................................ 89
Part 3: Government-Mandated, Universal CAPI .................................................................... 91 X. Selected Examples of Government-Mandated, Universal Insurance Schemes ..................... 91
A. SIPC ................................................................................................................................. 91 (1) SIPC Coverage and Claims Experience ..................................................................... 92 (2) SIPC’s Claims-Paying Resources ............................................................................... 93
B. Canadian Investor Protection Fund ................................................................................. 95 (1) CIPF Coverage and Claims Experience ..................................................................... 96 (2) CIPF’s Claims-Paying Resources ............................................................................... 97
C. Natural Catastrophe State Insurance Programs ............................................................... 99 (1) California Earthquake Authority ................................................................................ 99 (2) Citizens Property Insurance Corporation ................................................................... 99 (3) Natural Catastrophe State Insurance Programs and Insurance-Linked Securities ... 100
XI. Potential Government-Mandated, Universal CAPI Programs for U.S. Futures Customers 100 A. FICPC ............................................................................................................................ 101 B. Analysis of FICPC ......................................................................................................... 101
(1) Adequacy of Funding Over Time ............................................................................. 101 (2) Alternative Funding Sources .................................................................................... 103 (3) Crowding Out Private CAPI Solutions ..................................................................... 104 (4) Mismatch of Funding Sources and Main FICPC Beneficiaries ............................... 104
Part 4: Appendices .................................................................................................................... 106 Appendix 1: Compass Lexecon Project Team ............................................................................ 106 Appendix 2: The SPAN Margin Model ...................................................................................... 107 Appendix 3: Recent Enhancements to Customer Protections in U.S. Futures Markets ............. 108
A. The Initial Recommendations ....................................................................................... 108 (1) Enhanced Customer Funds Disclosure ..................................................................... 109
Page x

(2) Enhanced Customer Funds Reporting ...................................................................... 109 (3) Enhanced Internal Controls ...................................................................................... 109
B. CME and NFA Rules Implementing Task Force Recommendations ........................... 111 (1) Enhanced Customer Funds Disclosure and Reporting ............................................. 111 (2) Enhanced Internal Controls ...................................................................................... 112
C. Foreign Futures and Foreign Options Secured Amount ................................................ 112 D. Protections for Customer Assets Involving Cleared Swaps .......................................... 113 E. CFTC Enhanced Customer Protection Rules ................................................................ 114
Page xi

INDEX OF EXHIBITS & TABLES Exhibit 1: The Structure of the U.S. Futures Industry .................................................................... 5 Exhibit 2: Total U.S. Futures Customer Assets at FCMs, January 2005 – June 2013 ................. 17 Exhibit 3: Total U.S. Futures Customer Assets at FCMs, October 2011 – June 2013 ................. 18 Exhibit 4: Customer Types at FCMs Reporting to CME as DSRO .............................................. 27 Table 1: Customer Types at FCMs Reporting to NFA as DSRO ................................................. 28 Exhibit 5: Customer Assets Held at U.S. FCMs in December 2012 (Large) ............................... 30 Exhibit 6: Customer Assets Held at U.S. FCMs in December 2012 (Medium) ........................... 31 Exhibit 7: Customer Assets Held at U.S. FCMs in December 2012 (Small) ............................... 32 Table 2: Customer Assets in U.S. FCMs Across All Month-Ends in 2012 .................................. 33 Table 3: 2012 Financial Characteristics of the Contributing FCMs ............................................. 34 Table 4: Number of Customers at Contributing FCMs in 2012 ................................................... 35 Table 5: Assets per Customer at Contributing FCMs (by FCM Size) in 2012 ............................. 35 Table 6: Assets per Customer at Contributing FCMs (by Customer Size) in 2012 ...................... 36 Table 7: Maximum Aggregate Net Customer Losses Under Stressed Loss Scenarios ................ 40 Table 8(a): Stressed Customer Defaults and Potential Fellow-Customer Losses – Large FCMs 42 Table 8(b): Stressed Customer Defaults and Potential Fellow-Customer Losses – Medium FCMs
.................................................................................................................................................. 43 Table 8(c): Stressed Customer Defaults and Potential Fellow-Customer Losses – Small FCMs 44 Table 8(d): Stressed Customer Defaults and Potential Fellow-Customer Losses – All Six FCMs
.................................................................................................................................................. 45 Exhibit 8: Industry FCM Captive ................................................................................................. 53 Table 9: Per-FCM CELs from Under-Segregation Risk ............................................................... 73 Table 10: Potential Under-Segregation CELs for FCM Captive Based on Varied FCM
Participation Rates – Proportion of Unrecoverable Losses = 100% ........................................ 74 Table 11: Potential Under-Segregation CELs for FCM Captive Based on Varied FCM
Participation Rates – Proportion of Unrecoverable Losses = 50% .......................................... 75 Table 12: Per-FCM Under-Segregation Risk Based on 1986 NFA Report Assumptions ............ 76 Table 13: Per-FCM Under-Segregation CELs Based on 1986 NFA Report Assumptions .......... 76 Table 14: Potential Fellow-Customer CELs for FCM Captive Based on Varied FCM
Participation Rates ................................................................................................................... 78 Table 15: Estimated First-Loss Layer Exhaustion Points by AEP and FCM Captive Participation
Scenario for Under-Segregation and Fellow-Customer Risk................................................... 78 Table 16: Excess Adjusted Net Capital Available for FCM Captive by Participation Scenario .. 81 Table 17: Indicative Allocation of FICAP Premiums to Participating FCMs .............................. 86 Table 18: Potential Allocations of CAPI Benefits and Costs to FCM Customers – 5 Small FCMs
and 1 Medium FCM Participating in FICAP ........................................................................... 88 Exhibit 9: Number of SIPA Claims Per Year, 1971-2012 ............................................................ 92 Table 19: Net Advances from SIPC Fund, 1970 – 2012 .............................................................. 93 Table 20: SIPC Total Fund Size and Gross Revenues by Source, 2008-2012 ............................. 94 Exhibit 10: Value of SIPC Fund, 1971-2012 ................................................................................ 95 Table 21: CIPF Total Fund Size and Gross Revenues by Source, 2008-2012 ............................. 97 Exhibit 11: Projected Value of FICPC Fund, 2013-2067 ........................................................... 102
Page xii

SELECTED ACRONYMS AND ABBREVIATIONS AEP Annualized Exceedance Probability AIG American International Group ANC Adjusted Net Capital BASIC Background Affiliation Status Information Center (NFA) CAPCO Customer Asset Protection Company CAPI Customer Asset Protection Insurance CBOT Chicago Board of Trade CCA Comex Clearing Association CCC Commodity Customer Coalition CCP Central Counterparty CEA Commodity Exchange Act CEL Conditional Expected Loss CFTC Commodity Futures Trading Commission CIC Commodity Insurance Corporation (CCC) CIPF Canadian Investor Protection Fund CME CME Group, Inc. COMEX New York Commodity Exchange COT Commitments of Traders (CFTC) CPIC Citizens Property Insurance Corporation CPO Commodity Pool Operator CSA Canadian Securities Administrators CTA Commodity Trading Advisor DCM Designated Contract Market DCO Derivatives Clearing Organization DSRO Designated Self-Regulatory Organization ESF Expected Shortfall FCM Futures Commission Merchant FF&RPF Family Farmer and Rancher Protection Fund (CME) FIA Futures Industry Association FICAP Futures Investor Customer Protection Insurance Co. FICPC Futures Investor and Customer Protection Corporation IB Introducing Broker ICE IntercontinentalExchange, Inc. IFM Institute for Financial Markets IIROC Investment Industry Regulatory Organization of Canada ILS Insurance-Linked Securities IT Information Technology JAC Joint Audit Committee KCBOT Kansas City Board of Trade LBIE Lehman Brothers International (Europe) LSOC Legal Segregation with Operational Commingling LGD Loss Given Default MFG MF Global Holdings, Ltd., and its affiliates NFA National Futures Association
Page xiii

NYMEX New York Mercantile Exchange P&C Property and Casualty PCC Protected Cell Company PFG Peregrine Financial Group RRG Risk Retention Group SEC Securities and Exchange Commission SIDR Segregated Investment Detail Report SIPA Securities Investor Protection Act of 1970 SIPC Securities Investor Protection Corporation S&P Standard & Poor’s SPAN Standard Portfolio Analysis of Risk margin model SRO Self-Regulatory Organization VI Volume Investors Corp.
Page xiv

I. INTRODUCTION
A. Background and Context for the Study
The failures of MF Global in October 2011 and Peregrine Financial Group in July 2012, and the resulting losses and disruptions experienced by customers of those firms, have had widespread consequences for the U.S. futures industry.1 As a result of these events, market participants in the U.S. futures industry – and the industry’s primary regulator, the Commodity Futures Trading Commission (“CFTC”) – have responded by implementing a number of important changes in how customer assets at Futures Commission Merchants (“FCMs”) are protected and monitored. In addition to those improvements in market practices, some industry participants and regulators have proposed the creation of an insurance scheme that would provide customers with some degree of financial protection in the event that the insolvency of one or more FCMs results in a loss of customer assets. Several specific proposals already have been made for either government-mandated, universal coverage regimes, or for private, voluntary insurance. We refer to this type of risk protection generally as customer asset protection insurance (“CAPI”).
As with any insurance product, the benefits of CAPI must be weighed carefully against the costs of providing CAPI. In other words, the objective of enhanced customer protection through insurance cannot be viewed in isolation and must be evaluated in the broader context of other protections offered (including the numerous recent enhancements) and the potential market impacts (both positive and negative) of CAPI. For example, the benefits of CAPI might provide significant assurances to existing and prospective customers that increase U.S. futures volumes, reduce transaction costs, and facilitate greater liquidity and market depth. On the other hand, if CAPI provides only limited benefits at relatively high costs distributed across numerous market participants (not all of which might benefit from CAPI), the costs of providing CAPI might lead to a reduction in customer trading activity. In turn, less liquidity would result in lower-quality execution, higher transaction costs, and less ease of unwinding or hedging problem trades.
B. Scope of Project and Study
In 2012, the CME Group (“CME”), Futures Industry Association (“FIA”), Institute for Financial Markets (“IFM”),2 and National Futures Association (“NFA”) (collectively, the “Sponsors”) distributed a Request for Proposals for a study to explain how CAPI might work in practice and to evaluate the benefits, costs, and feasibility of adopting a government-backed, industry-based,
1 Throughout this report, references to the “futures industry” and “futures customers” include participants in transactions involving futures and options on futures occurring on designated contract markets (as defined by the Commodity Futures Trading Commission). We thus intend to include customers engaged in transactions involving options on futures in our references to “futures” but do not explicitly state that for expositional expediency. 2 IFM, a 501(c)(3) nonprofit educational foundation, gratefully acknowledges the Clearing Corporation Charitable Foundation whose endowment allows the IFM to fund independent research studies.
Page 1

or private CAPI scheme in the U.S. futures industry. Compass Lexecon was selected by the Sponsors to undertake this study.
Our work proceeded in four distinct phases. First, we defined several specific CAPI scenarios for which we would seek to obtain or generate feasibility and cost assessments. Second, we collected data on customer assets both from FCMs and for individual customers at FCMs. Third, we worked with CME Clearing to implement stress tests of customer-level data in order to analyze potential customer assets at risk under potential “worst-case” market conditions. Finally, we analyzed and summarized the data and presented our analyses to 10 (re-)insurance market participants in order to estimate the potential costs of privately provided CAPI products.3 We also analyzed the potential costs of a government-mandated, universal CAPI coverage scheme.
The study was directed by Christopher L. Culp, who is a Senior Advisor with Compass Lexecon, an Honorarprofessor and Professor for Insurance at Universität Bern (Switzerland) in the Institut für Finanzmanagement, and an Adjunct Professor of Finance at The University of Chicago’s Booth School of Business. Short biographies of Dr. Culp and the other members of the project team that performed this study for Compass Lexecon are provided in Appendix 1.
Dr. Culp was compensated for his time at his standard hourly rate of $1,250. Compass Lexecon and its contractors were also compensated for their time and were reimbursed for out-of-pocket expenses. No one’s compensation is contingent upon any of the conclusions presented here or the outcome of this study.
Although the Sponsors provided considerable assistance to us by providing data, information, and analytical capabilities (i.e., CME Clearing’s assistance in performing customer asset stress tests), the analyses and conclusions presented herein reflect the independent work of Compass Lexecon and the project team, and the views expressed herein do not necessarily reflect the views of the Sponsors.
C. Structure of the Report
The body of the report following this introduction is divided into three distinct parts. Part 1, which consists of Sections II-V, provides an introduction and background on U.S. futures markets, the risk exposures of customers in those markets, and the institutional mechanisms in place to reduce those customer risk exposures. Specifically, Section II reviews the structure of U.S. futures markets and customers of futures products. Section III discusses sources of customer asset risks. Section IV reviews recent enhancements in customer asset protections that have been instituted since the failure of MF Global Holdings, Ltd., and its affiliates (collectively “MFG”) in 2011. Section V then presents an empirical overview of the amounts and distribution of customer assets at risk across FCMs.
In Part 2 of the study, which consists of Sections VI-IX, we analyze potential private, voluntary CAPI solutions for customers of U.S. futures markets. In particular, Section VI provides a
3 We use the term “(re-)insurance” to refer collectively to primary insurance and reinsurance. When the distinction between the two is important, we refer instead either to insurance or reinsurance (and, similarly, either to insurers or reinsurers).
Page 2

general discussion of the potential benefits and costs of private, voluntary CAPI. Section VII provides background information on how various private CAPI product offerings might work in practice. Section VIII describes three specific private, voluntary CAPI scenarios that we developed in order to facilitate a consistent analysis of the benefits and costs of different CAPI products. Section IX then presents the capital availability and cost estimates we received for one of those specific CAPI scenarios.
Part 3 of the study consists of Sections X and XI, and analyzes a government-mandated, universal coverage CAPI fund. In Section X, we review several comparable government-backed customer protection funds for comparison purposes. In Section XI, we analyze the single specific scenario that has been advanced to date for a government-mandated, universal CAPI offering to all U.S. futures market customers.
Part 4 contains three appendices to our study.
Page 3

PART 1: U.S. FUTURES MARKETS, CUSTOMER ASSETS AT RISK,
AND CUSTOMER PROTECTIONS
II. THE STRUCTURE OF U.S. FUTURES MARKETS AND CUSTOMERS
A. Futures Trading and Customers
In order to understand how CAPI can benefit U.S. futures customers, it is important to understand how the futures markets function and the different types of customers that use these markets. In the United States, futures contracts trade on and are subject to the rules of organized exchanges registered with the CFTC as designated contract markets (“DCMs”). Futures transactions are generally executed by or through a CFTC-registered FCM and submitted to a member of a central counterparty (“CCP”) to be cleared and settled. A CCP is a clearinghouse that interposes itself as the counterparty of record for all transactions and is registered with the CFTC as a derivatives clearing organization (“DCO”).
A wide variety and large number of institutions (and some individuals) trade futures as customers of an FCM (rather than as direct exchange members). Typical futures customers include the following:
• Commercials/Hedgers: Commercial market participants often use futures and options to manage the risks associated with their production, distribution, supply chain, and inventory management activities. Commercial customers may include corporations (e.g., grain elevators, integrated energy producers, non-financial multinationals, etc.), cooperatives (e.g., cooperative associations of ranchers), and government-sponsored enterprises.
• Asset Managers and Institutional Investors: Managed funds, pension funds, and other asset managers (e.g., hedge funds) are often active futures traders. Their uses of futures may include hedging existing or anticipated exposures, synthetic asset allocation, and more.
• Commodity Pool Operators (“CPOs”): CPOs are CFTC-regulated investment vehicles, including certain hedge funds and investment companies, in which multiple customers invest money that is in turn invested, at least partly, in futures on a pooled and commingled basis. Each customer has a pro rata claim on the returns of the commingled pool, and has its liability limited to the amount of its investment in the CPO.
• Proprietary Trading Firms: Firms that trade futures in an attempt to profit from arbitrage, speculate on the directional evolution of prices, or engage in high-frequency, algorithmic, or spread trading are known as proprietary trading firms. Many such firms are exchange members, but those which are not must execute their transactions as customers of FCMs.
• Retail Customers: Individual investors or small firms that trade futures through FCMs for their own investment purposes are considered to be retail investors.
Page 4

We explore the various types of customers in U.S. futures markets in more detail in Section V.A below.
Exhibit 1 shows a simplified version of the relations between futures customers, FCMs, and certain other futures industry participants. Customers that are not exchange members are shown at the top.
Exhibit 1: The Structure of the U.S. Futures Industry
Customers generally open accounts directly with one or more FCMs (which may be either non-clearing or clearing member FCMs, as Exhibit 1 illustrates and as explained further in Section
Page 5

II.B.1) and deposit funds with the FCM’s designated financial intermediary (i.e., for U.S. customers of U.S. FCMs, at banks, trust companies, DCOs, or other FCMs).
Certain customers choose to open accounts through Introducing Brokers (“IBs”). IBs specialize in customer relationship management, but the actual trade execution, post-trade processing, and reporting is performed by an FCM with which the customer opens an account. IBs do not have direct access to their customers’ funds. Instead, customers deposit funds directly with an FCM selected either by the customer or the IB as the manager of customer trading activities, or IBs accept funds from customers and forward them to the FCM.
In either case, customers may grant trading authorization to a CFTC-registered Commodity Trading Advisor (“CTA”). CTAs offer advisory services regarding investments in futures and options on futures. Such services often include active account management in which the CTA trades a particular strategy on behalf of the customer through a designated FCM (which may be an affiliate of the CTA). CTAs do not themselves have access to their customers’ funds. Instead, the funds deposited by the customer are sent to a designated FCM (or its depository agent) that executes trades as directed by the CTA.
B. DCOs and Clearing Risk Management
Because trading participants whose transactions are cleared and settled by a DCO are essentially exchanging the credit risk of their original counterparties for the credit risk of the DCO, the DCO must maintain financial resources and risk management policies and procedures sufficient to preserve the confidence of their members as well as market stability and the integrity of the global payment system. In addition, shareholder-owned DCOs have equity investors that seek to avoid catastrophic losses.4 For all of these reasons, DCOs clearing and settling futures have historically maintained relatively conservative risk management practices.
DCOs typically rely on a multi-tiered system of risk controls, policies, and procedures designed to manage the credit exposure of the DCO and its participating clearing members.
(1) Clearing Member Structure of DCOs The ultimate performance of all transactions executed on DCMs is guaranteed by the DCO affiliated with the DCM. Specifically, “clearing members” of DCOs need not concern themselves with the credit risk of their trading counterparties because the performance obligations to which their trades gives rise (i.e., either additional required margin or variation margin payments, as discussed in the next two subsections) are based on the credit risk of the DCO and not the actual original trading counterparty. In the event that a clearing member of a DCO cannot honor all of its open obligations to one or more DCOs, the DCOs step in and guarantee to make good on all amounts owed to other clearing FCMs of the DCOs.
“Non-clearing FCMs” have no direct contractual relationships with DCOs. All trades executed by a non-clearing FCM, however, must be guaranteed by a clearing member of the relevant
4 DCOs that are not shareholder-owned have an incentive to avoid catastrophic losses, although the incentive for managers of such DCOs is more in the form of reputation than explicit financial claims on the DCO’s earnings.
Page 6

DCO(s). In addition, customers of either clearing or non-clearing FCMs also have no direct relationship to any DCO – their only relationship is indirect via the FCM that executes their trades and/or the clearing member that guarantees those trades. Customers thus are not exposed to the credit risk of the DCO, but rather are exposed to the credit risk of the FCM that executes their transactions and holds their assets.
Because DCOs do not bear credit risk directly to non-clearing FCMs or futures customers, they concentrate their risk-management and monitoring efforts on the clearing FCMs to which they do have direct credit exposures. Indeed, DCOs generally cannot monitor end-customer risk exposures (except for certain types of products as discussed in Appendix 3.D).5
(2) Initial Margin Requirements All U.S. DCOs require clearing members to collateralize their risk by posting margin as a performance bond for all new and open positions. Initial margin is posted for any newly established positions, and all open positions must satisfy minimum margin requirements on an ongoing basis. DCOs have strict policies regarding the types of collateral that can be used to satisfy these margin requirements. These margin requirements are intended to ensure that, in the event of a clearing member failure following significant adverse price movements, sufficient liquid funds will be available to cover the losses on its open positions.6
FCMs are obliged to post margin for their house accounts (i.e., accounts in which the firm is trading on its own behalf rather than on behalf of customers) and for the aggregate positions in their customer accounts. Current CFTC regulations require that customer margin be posted to the DCO on a gross basis.
The amounts of assets required to satisfy margin requirements at clearing FCMs are determined by DCOs based on margin models, most of which are based on the Standard Portfolio Analysis of Risk (“SPAN”) margin system or some variant of SPAN.7 SPAN is a margin model that measures the risk exposures of clearing members and their customers and assigns margin requirements based on those risks. Margin rates for non-clearing participants must be at least as high as margin requirements imposed by DCOs on clearing members (and usually are higher). The SPAN margin model is summarized in Appendix 2.
5 DCOs can and do monitor exposures of customers that meet the CFTC’s definitions of “large traders,” as well as participants trading cleared OTC derivatives (see Appendix 3.D). In addition, the introduction of gross customer margin requirements in 2013 has enhanced the ability of DCOs to monitor individual customers’ positions and margin requirements. 6 Although the terms “failure” and “default” have different legal and contractual definitions, we use these two terms synonymously in this study. 7 DCOs often use approaches different from SPAN to determine initial margin for OTC-cleared derivatives (that are not the subject of this study or CAPI). These alternative approaches include Monte Carlo simulation, value-at-risk, and multi-factor models.
Page 7

(3) Variation Margin and Resettlement At least once (and at most DCOs twice) each day, all open positions of clearing members (both customer and proprietary) are marked to current market prices by DCOs to determine profits and losses. Losses on any accounts must be settled with a DCO in cash or cash-equivalent securities such as Treasury bills, or, in some cases, with excess margin on deposit.8,9 In this manner, the DCO ensures that its exposure to the risk of a clearing member failure is limited by the time between mark-to-market intervals, and the time it takes to close out the positions of a failing clearing member. The payments and collections that result from marking open positions to market are known as “variation margin” flows.
(4) Clearing Member Default Management If the financial resources of a clearing member are inadequate to cover any unsettled obligations to the DCO, the clearing member may be declared in default by the DCO. The clearing member default could arise either from losses in the clearing member’s house account or from customer defaults (including accounts of non-clearing FCMs).
If a default arises from a clearing member’s house account, the clearing member’s customer accounts are typically transferred to other non-defaulting clearing members (usually with limited disruption, as history has demonstrated). Following a clearing member default, the DCO assumes any net unsettled obligations and open positions from the defaulting clearing member. Most DCOs then attempt to hedge or liquidate those positions in a timely and non-destabilizing manner.
If a clearing member fails because of its inability to cover the obligations of one or more customers (rather than as a result of losses in its house account), the assets of non-defaulting customers of the FCM may be at risk if the other assets at the failing FCM over which the DCO has control (e.g., any positive balances in house accounts, margin on deposit, guarantee fund contributions, DCO equity shares, memberships) are insufficient to cover the failing clearing member’s remaining obligation to the DCO. If those other assets are insufficient, the DCO can liquidate the open positions of non-defaulting customers and use those proceeds (as well as the margin and excess equity of non-defaulting customers held by the DCO) to help cover the defaulting clearing member’s open obligations to the DCO. As a result, customers of FCMs are exposed to “fellow-customer” risk – i.e., the risk that losses incurred by one customer of an FCM can impose losses on the FCM’s other customers following an FCM default.
In addition, DCOs maintain pre-funded mutualized guarantee funds to which all clearing members must contribute. In general, the total size of a DCO’s clearing default fund must be
8 Clearing members generally maintain excess funds in their margin accounts to avoid the risk of becoming under-margined. 9 Some DCOs allow certain members to cover only losses that cause an account to fall below a specified maintenance margin level, where the maintenance margin is below the initial margin requirement. If the value of the account falls below the maintenance margin level, sufficient funds must be paid to the DCO to cover the losses and restore the value of the account back to the initial margin requirement.
Page 8

large enough to cover losses arising from the default of the biggest clearing member in the DCO during extreme but plausible market conditions. Some DCOs opt for more conservatism and require that the default guarantee fund cover the default of the largest clearing member plus one or more additional defaults (e.g., the simultaneous default of the largest clearing member and two or three clearing members with relatively small risk exposures). In addition, a report issued in April 2012 jointly by the Bank for International Settlements Committee on Payment and Settlement Systems and the International Organization of Securities Commissions explicitly recommends that systemically important DCOs maintain financial resources to cover the default of the two largest clearing members.10 Each individual clearing member’s required contribution to the clearing default guarantee fund is determined by a DCO based on the amount of risk to which the DCO is exposed as a result of the clearing member’s trading activities.
If a defaulting clearing member’s losses exceed its margin and other assets held by the DCO (including the defaulting clearing member’s contribution to the DCO’s clearing default guarantee fund), any remaining DCO losses are covered by some combination of the DCO’s retained earnings (or a portion thereof), the remainder of the guarantee fund (which consists of the contributions of the non-defaulting clearing members), and (at some DCOs) post-loss assessments on non-defaulting clearing members. These layers of protection are referred to as the clearinghouse’s waterfall, and the types and order of these protections may differ from DCO to DCO.
DCOs in the past also have purchased insurance to provide loss-absorbing “synthetic capital” as a supplement to the clearing guarantee fund and post-loss assessments on non-defaulting clearing members. These synthetic capital facilities largely disappeared in the aftermath of the credit crisis that began to affect global markets in August 2007 (and which adversely affected certain parts of the insurance industry beginning in 2008). There is renewed interest in the (re-)insurance industry to provide (re-)insurance that supplements clearing default guarantee funds and renewed interest by DCOs seeking such synthetic capital. Yet, for the purpose of this study, such policies are not relevant (despite the potentially beneficial role that such programs may offer to DCOs) because they are designed to help the DCO cover losses arising from the failure of a clearing member that would otherwise be absorbed by the DCO itself (and the remaining non-defaulting clearing members). In other words, synthetic capital (re-)insurance policies are not designed to provide a direct payment to futures customers and thus should not be confused with CAPI.
C. Customer Asset Segregation Requirements
FCMs must treat the funds and assets of customers held for their futures trading activities as the property of those customers. Segregation requirements are monitored by both the CFTC and an FCM’s Designated Self-Regulatory Organization (“DSRO”).11 Among other things, segregation
10 Committee on Payment and Settlement Systems and Technical Committee of the International Organization of Securities Commissions, Principles for Financial Market Infrastructures (Bank for International Settlements and IOSCO, April 2012). 11 The Joint Audit Committee (“JAC”) has assigned every U.S. FCM to either CME (including its affiliates) or NFA as its DSRO. The JAC is a committee comprised of representatives from the Audit and Financial Surveillance
Page 9

requirements oblige FCMs to ensure and report that the net liquidation value of the assets they hold on behalf of their customers (i.e., the FCM’s required assets) is equal to or greater than the minimum segregation requirements. An FCM that fails to maintain sufficient assets to satisfy these segregation requirements is said to be “under-segregated,” which essentially means that if the FCM failed and had to liquidate assets, it would be unable to satisfy all of its customer liabilities.
For customer accounts related to the trading of futures, the regulations and market practices in place prior to 2012 treated customer monies at FCMs differently depending on the location of the trading activity. The regulations for transactions executed on U.S. and non-U.S. exchanges are discussed in the sections below.
(1) Customer Segregated Funds The Commodity Exchange Act (“CEA” or “Act”) requires all FCMs to maintain separate accounts for cash, securities, and other assets deposited by customers. These accounts must be segregated away from the FCM’s own funds, and must be titled for the benefit of the customers (i.e., recognized as the customer’s property). They may be deposited with a bank, trust company, DCO, or another FCM.12 Similarly, all monies and equities received by or accruing to an FCM on behalf of a customer as a result of futures trading also are considered the property of the customer.13 These customer-segregated funds are often referred to as “§4d” funds (based on the relevant section of the CEA).
An FCM’s liabilities to its customers is calculated using the “Net Liquidating Equity Method” and is equal to the cash funds and liquidation value of any securities on deposit (e.g., Treasury bills), plus any net unrealized gains on open futures positions, plus the market value of open option positions. The total amount of customer-segregated funds held by an FCM must be sufficient to meet all of the FCM’s obligations to its customers. Any deficit in a particular customer’s segregated funds can be offset with the current value (less any applicable haircut) of readily marketable securities held for that same customer’s account.14
Notwithstanding the prohibition on the commingling of customer funds with FCM funds, FCMs are permitted to deposit their own funds into §4d customer-segregated accounts as a residual interest. FCMs maintain these residual interest balances within customer-segregated accounts largely to reduce the risk that customer accounts will inadvertently become under-segregated.
departments of U.S. futures exchanges and regulatory organizations. To reduce regulatory overlap and duplication, the JAC assigns a DSRO as “lead regulator” to common members. The DSRO is primarily responsible for the financial surveillance of its allocated members. In general, if an FCM is a clearing member of one of the CME exchanges, the JAC will designate that CME affiliate as the FCM’s DSRO. If the FCM is not a clearing member of any of the exchanges, the JAC will designate NFA as the FCM’s DSRO. 12 7 U.S.C. §6d(a)(2). See 17 CFR §1.20 (2013). In addition, except as provided by CFTC Rule 1.49, customer segregated funds must be held in the United States. See 17 CFR §1.49 (2013). 13 17 CFR §1.21 (2013). 14 17 CFR §1.32 (2013).
Page 10

This can provide customers with an added degree of confidence about the safety of their assets, and also can give the FCM flexibility in how often it collects variation margin from customers. The FCM funds held as residual interests in customer-segregated accounts, moreover, are interest-bearing if the funds are invested in interest-bearing assets. Funds comprising the residual interest must be separately accounted for and may be withdrawn by the FCM as long as the withdrawal does not result in under-segregation of the customer funds.15 (See Section IV.B for some recent changes in the treatment of FCM residual interests in customer accounts.)
In principle, §4d customer-segregated funds receive priority in the event of a bankruptcy filing by an FCM. If the actual amounts in customer accounts are insufficient to return all property to customers following the insolvency of the FCM, the funds are distributed to customers on a pro rata basis. The remaining unpaid amounts do not receive priority under the Bankruptcy Code, and the customers have the same priority as claims of the FCM’s unsecured creditors. A recent court decision, however, has given rise to questions about the treatment of customer funds in a bankrupt FCM, which has raised concerns among market participants and regulators.16
(2) Foreign-Secured Customer Funds An FCM must maintain a sufficient amount of funds to cover all of its obligations arising from its customers’ trading on or through foreign board of trades. Known as the “foreign-secured amount” or “§30.7” funds (named after the CFTC regulation on which the rules are based),17 the assets must be kept in a separate account from the FCM’s own funds and may not be commingled with customer-segregated funds.
Like U.S. customer-segregated funds, FCMs may deposit foreign customer funds at U.S. banks and trust companies, CFTC-regulated FCMs, or DCOs. FCMs also may choose to deposit customer monies at a foreign bank or trust (with $1 billion or more in regulatory capital), a member of a foreign board of trade, a foreign clearinghouse, or a depository selected by the member of a foreign board of trade or clearing organization.
Whereas §4d customer-segregated funds requirements are determined based on the Net Liquidating Equity Method, minimum amounts of foreign-secured funds could in the past (see Section IV.C for recent changes) have been computed using the “Alternative Method.” Only a handful of FCMs opted to use the Alternative Method,18 and as of 2012 it was no longer permitted. Nevertheless, because of the role played by this Alternative Method in the MFG failure, a brief description is warranted.
15 17 CFR §1.23 (2013). 16 In re Griffin Trading Company, 245 B.R. 291 (Bankr. N.D. Ill. 2000). 17 17 CFR §30.7 (2013). 18 Including MFG, only five of the 55 FCMs with foreign-secured funds used the Alternative Method in 2011. One of those firms switched to the Net Liquidating Equity Method in November 2011 following the collapse of MFG. The remaining three switched from the Alternative Method to the Net Liquidating Equity Method in January and February 2012. See Staff Report, Prepared for Rep. Randy Neugebauer, Chairman, Subcommittee on Oversight & Investigations, Committee on Financial Services, U.S. House of Representatives (November 15, 2012), p. 26.
Page 11

Specifically, under the Alternative Method, total foreign-secured funds must have been greater than or equal to (i) the margin requirement on open futures positions plus or minus (ii) any unrealized gains or losses on open futures positions plus (iii) funds representing premiums payable or received on foreign option transactions (including additional funds required to secure such options plus or minus any unrealized gains). In particular, the minimum foreign-secured funds requirement under the Alternative Method did not treat any cash deposited in excess of maintenance margin requirements as a customer liability of the FCM. For example, an FCM with a customer that deposited $1 million in cash but that did not yet have any open futures positions would have a zero foreign-secured requirement under the Alternative Method. The Net Liquidating Equity Method, by contrast, would require that same FCM to show $1 million in assets to meets its corresponding $1 million customer liability.
U.S. FCMs also are permitted to maintain residual interests in their §30.7 foreign-secured funds and to make withdrawals up to the amount of their residual interest, provided such withdrawals do not result in a deficiency relative to the minimum required §30.7 secured funding level.
(3) “Customer Accounts” and “Customer Assets” In this report, we henceforth refer to customer-segregated and foreign-secured accounts collectively as “customer accounts.” The assets in those two types of customer accounts are collectively referred to as “customer assets.”19 Unless otherwise noted, customer assets include “required assets” (i.e., assets at an FCM that satisfy segregation requirements) and “excess assets” (i.e., customer assets at an FCM above segregation minimums).
III. SOURCES OF CUSTOMER ASSETS AT RISK For many decades, the reputation of the U.S. futures industry for the protection and safekeeping of customer assets was largely unblemished. In particular, no customer funds were lost and no DCO was required to tap into a clearing guarantee default fund to cover the obligations of failing firms, even including the spectacular failures of Drexel Burnham Lambert, Barings, Refco, and Lehman Brothers. Nevertheless, customers have in the past several years experienced major losses arising from the failures of MF Global and Peregrine Financial.
Customers of failing FCMs can only experience losses if the FCM fails when it is under-segregated.20 If an FCM fails because of losses in its proprietary/house accounts that the FCM cannot cover with its own assets, the FCM will be in default either to its clearing FCM (if it is a non-clearing FCM) or its DCO(s) (if it is a clearing FCM). Similarly, an FCM may fail for reasons unrelated to its futures trading activities. In either situation, the customer accounts of the
19 FCMs also hold assets on behalf of customers trading cleared over-the-counter derivatives. Those assets are not considered eligible for CAPI in this study, and so we exclude any such assets from our estimates and analyses of customer assets. In this document and for the purposes of CAPI, customer assets refer exclusively to customer-segregated and foreign-secured assets. 20 Futures trading customers can, of course, experience losses of assets arising from adverse market movements that generate trading losses and corresponding payment obligations. CAPI, however, is not contemplated to cover customer losses arising from market risk. As such, all references in this study to customer asset losses refer to losses arising from the failure of the FCM and not purely as a result of losses arising from market risk.
Page 12

defaulting FCM will be transferred to non-defaulting FCMs or liquidated, and customers should experience no losses or disruptions in their trading activities provided the FCM’s customer assets are properly segregated.
More specifically, customers can experience a loss of assets when an under-segregated FCM fails for either of two reasons: (i) misfeasance or malfeasance; and (ii) fellow-customer risk. In the sections below, we discuss these two risks in more detail and briefly review the historical record of customer losses that have actually been realized over time for these reasons.
A. Misfeasance or Malfeasance at an FCM
Customers may experience losses following the failure of an FCM if that FCM is under-segregated at the time of its failure as a result of misfeasance or malfeasance. Under-segregation resulting from misfeasance is principally attributable to operational failures. For example, if an FCM has a poor information technology (“IT”) infrastructure and its systems report a larger amount of the FCM’s own funds (i.e., residual interest) in its §4d or §30.7 customer asset pools, the FCM might transfer funds out of those pools for its own uses without realizing it is tapping into customer monies. Similarly, a failure by the FCM to enter and track intra-day cash transfers could give rise to an inaccurate estimate of its available cash balances and could result in a transfer of customer funds that the FCM believes are its own funds.21 Under-segregation arising from malfeasance, by contrast, involves deliberate misappropriations of customer-segregated assets (i.e., a conversion of customer funds to funds used by the FCM and/or its principals), fraud, embezzlement, and the like.
Losses of property by customers of FCMs resulting from under-segregation have until recently been relatively small. From 1974 – the year that the CFTC was established as the U.S. federal regulator of futures markets – through 1977, three FCMs failed with an average under-segregation amount of $136,670 and an average actual loss to customers of $83,337. From 1978 through 1980, a total of 22 FCMs failed with an average under-segregation amount of $747,273 and an average ultimate loss to customers of $413,364.22
All of the FCMs that failed in the period between 1978 and 1980 had one thing in common – namely, none of the defaulting FCMs were exchange members.23 As such, they had minimal requirements for reporting their required versus actual customer segregation amounts. As a fairly typical example, in 1980 the president and several other insiders of the FCM Chicago Discount Commodity Brokers, Inc. were caught using customer funds to cover their own proprietary
21 Both of these situations have been postulated as reasons (among others) for MFG’s inappropriate customer funds transfers. See MGF Trustee Report, op. cit., §VII.C. 22 See National Futures Association, Customer Account Protection Study (November 20, 1986) (hereinafter “NFA CAPI Study”), op. cit., p. 14. 23 NFA CAPI Study, op. cit., pp. 37-38.
Page 13

trading losses. The president of the firm was convicted and sentenced to prison. Customer losses amounted to a total of $2.5 million.24
To address the risk of under-segregation at non-exchange member FCMs, in late 1980 the CFTC began contacting non-exchange member FCMs by telephone on a daily basis to obtain information on required customer assets, actual customer assets, and any under-segregated amounts. Those non-exchange member FCMs were required to submit a written report to confirm that data on a weekly basis.25
When NFA began operations in October 1982 as the first independent, non-exchange-affiliated self-regulatory organization for the U.S. futures industry, it became the DSRO for non-exchange member FCMs and assumed responsibility for evaluating their actual and required segregation amounts. Presumably as a result of heightened CFTC surveillance and the creation of the NFA, FCM defaults from 1981 through 1985 fell back to their historical lows – i.e., only four FCMs failed with an average under-segregation amount of $132,182 and an average actual customer loss of $13,636.26
Two recent examples, however, illustrate that under-segregation risk still exists and can result in customer losses.27 Indeed, these two recent incidents are a significant reason that the study was commissioned.
(1) MF Global On October 31, 2011, MFG filed for bankruptcy as a result of losses sustained on a $6.3 billion investment position on European sovereign debt held by the firm’s proprietary trading division. Specifically, MFG purchased European sovereign bonds and used those bonds as collateral for long-term repos in an effort to try and benefit from what MFG’s traders apparently believed would be a long-term recovery (or bailout) of several European countries. In repo transactions, counterparties can demand additional margin from the borrower if the value of the underlying collateral falls or the creditworthiness of the borrower is in question. In the case of MFG, both events occurred – i.e., the prices of sovereign debt instruments fell, and MFG’s credit rating was downgraded by the major rating agencies in October 2011.
For its foreign-secured accounts, MFG used the Alternative Method (see Section II.C.2) to calculate its required minimum foreign-secured account balance. As of October 2011, the apparent excess of foreign-secured funds vis-à-vis the regulatory minimum was about $1 billion
24NFA CAPI Study, op. cit., p. 31. 25 NFA CAPI Study, op. cit., p. 38. 26 NFA CAPI Study, op. cit., p. 14. 27 The failure of Sentinel Management Group in August 2007 also involved losses of customer funds. Sentinel, however, was not a traditional FCM but rather was registered as an FCM so that it could hold other FCMs’ customer funds. Sentinel thus was more similar in its operations to an investment company than an FCM. As such, Sentinel is not discussed here in any detail.
Page 14

on average.28 As liquidity strains mounted at the firm, MFG sought increasingly to rely on that regulatory excess in the foreign-secured customer funds pool as a source of overnight and intraday financing for its proprietary European sovereign debt trades. The surplus foreign-secured funds computed using the Alternative Method, however, was lower than the Net Liquidating Equity of those customer accounts. As of the close of business on October 21, 2011, for example, MFG reported $847.4 million in excess foreign-secured funds according to the Alternative Method, whereas under the Net Liquidating Equity Method MFG had a deficit of $371.6 million – i.e., had all of MFG’s foreign customers demanded all of their funds, MFG would have been short $371.6 million.29
Before October 2011, MFG’s withdrawals of funds from the foreign-secured accounts were generally less than MFG’s residual interest in those funds – i.e., MFG was essentially withdrawing its own funds, and foreign customers were not substantially at risk.30 But in the last week of October 2011, MFG was plagued by a negative earnings announcement, growing public concerns about MFG’s European sovereign debt exposure, and a downgrade in its credit rating.
From October 26-31, 2011, MFG experienced a severe liquidity crisis. Customers sought to withdraw their funds, derivatives counterparties demanded higher amounts of collateral, and repo counterparties increased haircuts and in some cases refused to accept MFG’s securities as collateral on new short-term repos. MFG scrambled to raise funds by selling billions of dollars of securities, drawing down credit lines, and engaging in various inter-company transfers. Some of those transfers involved funds taken from both §4d customer-segregated funds and foreign-secured §30.7 funds.
MFG became under-segregated on October 26, 2011, and remained out of compliance with the segregation requirements imposed by the CFTC and the CME (in its capacity as MFG’s DSRO) until its bankruptcy filing on October 31, 2011.31 By the morning of October 31, 2011, MFG’s customer accounts were reportedly deficient by about $900 million. Following an investigation, the estimated value of the missing customer funds (both §4d segregated and §30.7 foreign-secured) was revised upward to $1.6 billion.
MFG had 36,000 futures clients (some of which consisted of farmer’s cooperatives with as many as 35,000 individual farmers) and 318 securities customers at the time of its bankruptcy. The effects of the bankruptcy were wide-ranging and impacted numerous futures customers. After MFG’s bankruptcy filing, the Securities Investor Protection Act (“SIPA”) Trustee began liquidation proceedings for MFG, and over 150,000 customer accounts with a total value of $5.45 billion in customer-segregated funds were frozen. CME oversaw the transfer of client
28 Report of the Trustee’s Investigation and Recommendations, In re MFG, Inc., Case No. 11-2790 (MG) SIPA (June 4, 2012), p. 11 (hereinafter “MGF Trustee Report”). 29 MFG Trustee Report, op. cit., p. 97. 30 MFG Trustee Report, op. cit., p. 13. 31 MFG Trustee Report, op. cit., pp. 14-15. The CFTC and CME have both stated that they were unaware of the deficiency MFG’s in segregated funds until October 31, 2011. Indeed, there was significant confusion within MFG itself about its segregated and secured funds levels. See MFG Trustee Report, op. cit., pp. 97-123.
Page 15

accounts from the failed FCM to non-defaulting FCMs, but the process was delayed by the need to confirm the actual amounts of collateral available in each account. To facilitate the distribution of assets back to customers, CME provided a $250 million guarantee (later increased to $550 million) to MFG’s SIPA Trustee.
As of this writing, MFG’s FCM customers have received about 98 percent of their segregated funds and about 74 percent of their §30.7 foreign-secured funds.32 On November 5, 2013, moreover, the bankruptcy judge approved a plan that will complete the transfer of customer funds and return 100 percent of the property owed to former MFG customers.33 Nevertheless, the loss of access to customers of their own funds that were used by MFG to satisfy the liquidity demands of its proprietary trading operations has caused widespread concerns amongst end users and customers in U.S. futures markets. In addition, customers have reported disruptions and problems related to the length of time (i.e., nearly two years) during which their funds have been tied up in the bankruptcy proceeding.
Total customer assets are tracked by FCMs and reported daily to their DSROs and the CFTC. Exhibit 2 shows total customer assets by month from January 2005 through June 2013 reported by FCMs to their DSROs. Exhibit 3 shows total customer assets between October 2011 (the month that MF Global failed) and June 2013. As Exhibits 2 and 3 indicate, customer assets at FCMs declined following the failure of MFG in October 2011. Most believe that at least some of this decline was a result of a loss of futures trading participants’ confidence in protections for their customer assets at FCMs.34
32 See, e.g., “MF Global Trustee Plans to Return More Customer Funds (Corrected),” Reuters (October 3, 2013). 33 The plan allows for the bankruptcy trustee to access funds from the MFG general estate. Combined with funds the trustee is already holding, it is possible to return the outstanding $689 million that customers are owed. See B. Protess, “MF Global Customers Will Recover All They Lost,” New York Times (November 5, 2013). 34 Other factors (e.g., the languishing U.S. economy) could, of course, also account for the decline in customer usage of U.S. futures markets in that same time period.
Page 16

Exhibit 2: Total U.S. Futures Customer Assets at FCMs, January 2005 – June 2013
$0
$50
$100
$150
$200
$250
Jan-05
Apr-05
Jul-05
Oct-05
Jan-06
Apr-06
Jul-06
Oct-06
Jan-07
Apr-07
Jul-07
Oct-07
Jan-08
Apr-08
Jul-08
Oct-08
Jan-09
Apr-09
Jul-09
Oct-09
Jan-10
Apr-10
Jul-10
Oct-10
Jan-11
Apr-11
Jul-11
Oct-11
Jan-12
Apr-12
Jul-12
Oct-12
Jan-13
Apr-13To
tal C
usto
mer
Ass
ets
($ b
illio
ns)
SOURCES: CME & NFA. NOTES: Total customer assets include all assets held by customers in segregated or foreign secured accounts at U.S. FCMs as reported to CME or NFA as DSROs.
October 2011 (MF Global)
Page 17

Exhibit 3: Total U.S. Futures Customer Assets at FCMs, October 2011 – June 2013
(2) Peregrine Financial Group Fraud at Peregrine Financial Group (“PFG”) was discovered shortly after PFG’s chief executive Russell Wasendorf, Sr., was found attempting to commit suicide on July 9, 2012. Mr. Wasendorf subsequently revealed that he had misappropriated customer funds, violated customer segregation requirements, and falsified information regarding the amounts of funds in customer-segregated accounts. He covered up his fraud by providing forged documents, including bank statements and bank account balance confirmations, and submitting bogus daily segregation reports to PFG’s regulators.
The fraud was discovered by NFA when it changed its method for obtaining bank confirmations to a web-based e-confirmation process. At the close of business on July 6, 2012, PFG reported that the firm was holding approximately $380 million in total customer funds. On July 8, 2012, Mr. Wasendorf provided the apparent required authorization necessary to initiate the e-confirmation process. Yet, on July 9, 2012, PFG’s records showed that about $225 million was on deposit with U.S. Bank in PFG’s §4d customer-segregated funds account, when, in fact, the
219.41
205.08
200.01
204.74 204.57
197.80 196.27
191.10 189.71
195.52
199.48 197.92
196.33
191.47 191.09
194.11 193.82
196.10 197.93
192.83 193.68
$170
$175
$180
$185
$190
$195
$200
$205
$210
$215
$220
$225
Oct-11
Nov-11
Dec-11
Jan-12
Feb-12
Mar-12
Apr-12
May-12
Jun-12
Jul-12
Aug-12
Sep-12
Oct-12
Nov-12
Dec-12
Jan-13
Feb-13
Mar-13
Apr-13
May-13
Jun-13To
tal C
usto
mer
Ass
ets
($ b
illio
ns)
SOURCES: CME & NFA. NOTES: Total customer assets include all assets held by customers in segregated or foreign secured accounts at U.S. FCMs as reported to CME or NFA as DSROs.
Page 18

actual account balance was only about $5 million.35 As of August 8, 2013, the bankruptcy Trustee for PFG estimates that a total loss of $215 million in §4d customer-segregated funds at PFG.36
B. Fellow-Customer Risk
As discussed in Section II.B.4, an FCM may become insolvent if losses on one or more of its customer accounts exceed customers’ assets on deposit, the customer or customers with losses default on their net payment obligation to the FCM, and the FCM lacks sufficient financial resources of its own (including any gains in its house trading accounts) to cover the net open obligation to DCOs (if the FCM is a clearing FCM) or to its clearing FCM(s) (if the FCM is a non-clearing FCM). In that situation, the failure of one or more customers of the FCM to honor their margin calls causes the FCM to become under-segregated.
When an FCM fails to make its required payments to its clearing FCM or DCO, the clearing FCM or DCO may liquidate the positions of non-defaulting customers at the FCM and use those proceeds (plus, in the case of the DCO, the margin and excess assets of non-defaulting customers held at the DCO37) to cover the defaulting FCM’s unsatisfied payment obligation. The risk that non-defaulting customers could experience losses as a result of the failure of one or more other customers of the FCM to pay what they owe to the FCM is known as fellow-customer risk.
Although fellow-customer risk is an oft-cited and significant concern amongst some U.S. futures customers, the reality is that only one situation has arisen since 1981 in which the inability or unwillingness of one or more customers to cover their open payment obligations to an FCM has caused the FCM to fail and resulted in fellow-customer losses for other customers of the defaulting FCM.
(1) Pre-1980 Non-Exchange Member FCM Defaults As noted in Section III.A, 22 FCMs failed between 1978 and 1980, all of which were non-exchange members.38 As such, they had minimal requirements for reporting their required versus actual customer segregation amounts. Three of those FCMs failed as a result of customers that did not remit their required payments to the FCMs: Bengal Trading Corp. (1980), Comvest, Inc. (1979), and Incomco, Inc. (1980). Losses sustained by non-defaulting customers of Bengal and
35 See, e.g., CFTC v. Peregrine Financial Group Inc. and Russell Wasendorf, Sr. (N. D. Ill. July 10, 2012). 36 PFG Trustee’s Status Report as of August 8, 2013, http://omnimgt.com/CMSVol/CMSDocs/ pub_46535/426771_Trustee's%20Status%20Report%20of%20August%208%202013.pdf (last visited October 26, 2013). 37 Excess customer assets held at the DCO are available for the DCO to apply to the defaulting FCM’s open payment obligation. Excess customer assets held at the defaulting FCM, however, are considered part of the bankruptcy estate and are thus available to the bankruptcy trustee to allocate as it sees fit. 38 NFA CAPI Study, op. cit., pp. 37-38.
Page 19

Incomco totaled $2.7 million. Comvest was under-segregated by about $500,000, but actual realized customer losses remain unknown.39
Two of the defaulting FCMs that failed as a result of unpaid customer obligations (i.e., Comvest and Incomco) had agreements with their customers that guaranteed that customers’ initial investments were their only assets at risk and that the FCMs would not make margin calls for additional funds from their customers. So, when losses on their customer accounts resulted in margin calls from clearing FCMs, the two defaulting FCMs had contractually eliminated their ability to obtain those funds from their customers and lacked the independent financial resources to cover the net customer payment obligations. The FCMs thus defaulted, and their non-defaulting customers realized fellow-customer losses.
Largely as a result of these two FCM failures, the CFTC adopted Regulation 1.56 in December 1981 that prohibits FCMs from guaranteeing their customers against losses or representing to customers that required margin amounts will not be collected.40
(2) Fellow-Customer FCM Defaults Without Fellow-Customer Losses There have been several occasions since 1981 when the failure of one or more customers of an FCM to meet a margin call has caused the FCM to fail but has not resulted in fellow-customer losses. In most such situations, the defaulting firm’s principals and/or the exchange on which the trades occurred subsequently covered the open unpaid obligations of its defaulting customers, thereby preventing other customers of such FCMs from experiencing actual fellow-customer losses.
For example, Volume Investors Corp. (“VI”) was a member of the New York Commodity Exchange (“COMEX”) and Comex Clearing Association (“CCA”) in 1985. As a result of the failure of three customers to meet margin calls by VI totaling $28 million arising from open positions in (short) gold contracts, VI was in default with the CCA.41 The total unpaid obligations of VI arising from its defaulting customers’ obligations were satisfied with funds from VI’s house trading account, VI’s contribution to the CCA default guaranty fund, and positive balances in VI’s non-defaulting customer accounts.42 The latter gave rise to a total of $3.6 million in potential fellow-customer losses. Nevertheless, non-defaulting customers ultimately did not realize any such losses because of subsequent recoveries by the receiver from the defaulting customers and because VI’s chief executive Charles Federbush agreed to pay $1.3 million to cover the non-defaulting customer funds deficit.43
39 NFA CAPI Study, op. cit., pp. 28-31. 40 NFA CAPI Study, op. cit., p. 39, and 17 CFR §1.56. 41 See, e.g., CFTC, Release 2586-86, Docket #85-25 (July 29, 1986), at http://www.nfa.futures.org/BasicNet/Case.aspx?entityid=0002121&case=85-25&contrib=CFTC. 42 NFA CAPI Study, op. cit., pp. 76-77. 43 CFTC, Release 2586-86, Docket #85-25 (July 29, 1986), at http://www.nfa.futures.org/BasicNet/Case.aspx?entityid=0002121&case=85-25&contrib=CFTC.
Page 20

The several historical instances of FCM failures resulting from customers’ inability to honor margin calls is illustrative of the nature of fellow-customer risk, but not particularly informative with regard to the amounts of non-defaulting customer assets exposed to fellow-customer risk. Because in most such historical incidents non-defaulting customers have been fully reimbursed for fellow-customer losses, non-defaulting customers have incurred essentially no actual fellow-customer losses in these situations.
(3) Fellow-Customer FCM Defaults With Fellow-Customer Losses: Griffin Trading The sole exception and single incident of actual fellow-customer risk-related losses that we have identified since 1981 was the failure of Griffin Trading (“Griffin”) in 1998. Specifically, in December 1998 John Ho Park began trading bond futures on Eurex as a customer of Griffin, which was a non-clearing FCM of Eurex that used MeesPierson as its clearing FCM. Mr. Park’s positions with Griffin generated a $10 million loss overnight, which generated corresponding margin calls by Eurex to MeesPierson and by MeesPierson to Griffin. Mr. Park represented (counter-factually) that he could cover his losses, and Griffin transferred funds to MeesPierson from Griffin’s customer accounts to cover Mr. Park’s losses. As Mr. Park’s positions incurred further losses later the same day that Griffin was unable to cover, Griffin filed for bankruptcy on December 30, 1998. As a result, Griffin’s non-defaulting customers experienced losses resulting from Griffin’s inability to cover the losses of its customer Mr. Park.44
All of the fellow-customer losses incurred by Griffin’s non-defaulting customers were in Griffin’s §30.7 foreign-segregated accounts. All of Griffin’s §4d customer-segregated accounts were successfully transferred to other non-defaulting FCMs with no resulting losses to those customers.
IV. RECENT ENHANCEMENTS IN CUSTOMER ASSET PROTECTIONS In the aftermath of the MFG bankruptcy, market participants began to implement certain changes in customer funds protection policies, procedures, and processes that are intended to help restore customer confidence and enhance the integrity of the process by which customer assets are safeguarded. For example, CME and NFA made significant and important changes in reporting and compliance monitoring of the FCMs for which they are responsible as DSROs. The CFTC has subsequently proposed codifying most of the changes initiated by CME and NFA, as well as proposing some additional changes to existing regulations that also are intended to enhance customer asset protection. The CFTC finalized its proposed rules on October 31, 2013 (hereinafter the “CFTC Customer Protection Rules”).45 In addition, the industry has undertaken significant educational outreach efforts to keep customers and other market participants (as well
44 In Re: Griffin Trading Company, 245 B.R. 291 (Bankr. N.D. Ill. 2000), and In Re: Griffin Trading Company (7th Federal District, Northern Illinois), No. 10-3607 (June 25, 2012). 45 Enhancing Protections Afforded Customers and Customer Funds Held by Futures Commission Merchants and Derivatives Clearing Organizations, Federal Register (forthcoming).
Page 21

as regulators) apprised of these changes.46 These enhanced customer protections are summarized below, and a more detailed discussion of those changes appears in Appendix 3.
A. Enhanced Reporting by FCMs
CFTC rules require each FCM to compute as of the end of each business day the amount of funds held, and required to be held, in segregation and to maintain detailed records of the investment of customer funds held. The information contained in these reports, however, had not previously been made available to the CFTC or self-regulatory organizations (“SROs”) on a routine basis.47
Revised CME and NFA rules now require each FCM to submit through WinJammer48 daily segregation reports and twice monthly Segregated Investment Detail Reports (“SIDRs”). SIDRs must include information identifying the sectors (e.g., cash, government securities, money market mutual funds) in which the FCM invests its customers’ funds, the amount of customer funds invested in each sector, and the weighted average maturity of the assets held in each sector. The revised CME and NFA rules apply to §4d customer funds and §30.7 funds.49
In addition, CME and NFA rules require that depositories holding customer funds for FCMs to report daily to CME or NFA the balances in the FCM’s customer funds account(s) held at the depository in the form and manner prescribed by CME and NFA.50 Recognizing that this information is also important to prospective customers conducting a due diligence review of an FCM through which the customer may choose to clear, NFA has added new sections to its Background Affiliation Status Information Center (“BASIC”) system that provide summary reports of the financial information filed with NFA.
Section B of Appendix 3 provides a more detailed discussion of the enhancements to FCM disclosure reporting requirements made by CME and NFA following the MFG and PFG failures.
In addition, the CFTC proposed in November 2012 that FCMs must maintain “at all times” a residual interest in §4d and §30.7 funds an amount sufficient to exceed the sum of all customer
46 See, e.g., Futures Industry Association, Protection of Customer Funds – Frequently Asked Questions, 2nd ver. (June 2012). 47 CME and NFA had adopted rules requiring those FCMs for which it is the DSRO to file with NFA a copy of each daily segregation calculation and a monthly report identifying the sectors in which the FCM invests customer funds, the amount of customer funds invested in each sector, and the weighted average maturity of the assets held in each sector. 48 The WinJammerTM Online Filing System is the futures industry standard for futures firms to enter and transmit FOCUS, 1FR-FCM, Segregated Investment Detail Reports (SIDR), notice filings and other financial statements. 49 The rules also apply to cleared swaps customer accounts that are required to be segregated in accordance with section §4d(f) of the CEA and Part 22 of the CFTC’s rules. 50 NFA Financial Requirement Section 4 is applicable to all FCMs; CME Rule 971 imposes a similar requirement on its clearing member FCMs.
Page 22

margin deficits.51 The final CFTC Customer Protection rules were adopted on October 30, 2013, and require that FCMs compute their residual interest balances to indicate compliance with this rule based on a phased-in schedule. No later than a year after the final publication of the rule in the Federal Register, FCMs must be able to calculate their residual interest requirement by 6pm Eastern Time on the date following the final settlement of flows of funds (i.e., one day after the corresponding value date). No later than 30 months later, the CFTC will further articulate the feasibility of moving that deadline earlier.
B. Enhanced Internal Controls and Early Warning Triggers on Customer Fund Transfers
As noted in Section II.D, an FCM has historically been permitted to make withdrawals from §4d and §30.7 customer funds up to the amount of its own money (i.e., residual interest) in those two types of commingled customer pools. Following MFG, both CME and NFA adopted a rule that requires FCMs to notify their regulators immediately if they withdraw more than 25 percent of their excess segregated funds in a single day.
Furthermore, CME and NFA rules provide that the chief executive officer, chief financial officer or a “financial principal” (in the case of NFA) or “authorized representative” (in the case of CME) is required to approve in writing any withdrawal of a portion of the FCM’s residual interest, not for the benefit of customers, in excess of 25 percent of the residual interest reflected in the FCM’s most recent daily segregation calculation. Such written approval is required before the withdrawal is made, followed by immediate notice to the FCM’s DSRO.
In addition, both CME and NFA have adopted rules implementing certain enhancements to FCM internal controls. For example, NFA Financial Requirements Section 16 requires each FCM to document its policies and procedures for determining the appropriate targeted residual interest for each customer funds account. In addition, NFA worked closely with CME to develop internal control requirements for FCMs in areas such as separation of duties, customer funds, and capital compliance.
The CFTC Customer Protection Rules codify the CME and NFA regulations by requiring FCMs to maintain written rules and policies governing the maintenance of excess funds and to obtain pre-approval by senior management prior to the withdrawal of 25 percent or more of the FCM’s residual interest in §4d customer-segregated and §30.7 foreign-secured accounts. The CFTC Customer Protection Rules also require FCMs to notify the CFTC and the FCM’s DSRO immediately after making any such management-approved withdrawals.
C. Elimination of the Alternative Method for Foreign-Secured Accounts
By the Spring of 2012, the CFTC had informed any FCMs still using the Alternative Method for computing minimum levels of foreign-secured customer funds to stop using that method and switch to the Net Liquidation Equity Method. As of September 1, 2012, NFA formally instructed
51 CFTC, “Enhancing Protections Afforded Customers and Customer Funds Held by Futures Commission Merchants and Derivatives Clearing Organizations: Proposed Rule,” Federal Register Vol. 77, No. 220 (November 14, 2012).
Page 23

its FCM members that the Alternative Method could no longer be used to compute minimum levels of foreign-secured funds. CME implemented a similar change in its DSRO capacity. At present, only the Net Liquidation Equity Method may be used by FCMs to compute minimum segregation requirements for both §4d customer-segregated funds and §30.7 foreign-secured funds.
D. New Disclosure Requirements to Current and Prospective Customers
The CTFC Customer Protection Rule also requires that FCMs clearly disclose to customers that their funds are not covered by insurance in the case of an FCM bankruptcy, that customer funds are commingled, and that every customer is exposed to fellow-customer risks.
In addition, FCMs must disclose more information about their business activities, their businesses on behalf of customers, and their policies and procedures concerning their choices of bank depositories, custodians, and other counterparties. FCMs also must disclose the material risks they face and how those risks may impact customers, as well as any material enforcement actions pending or taken within the last three years against the FCM.
V. ESTIMATES OF CUSTOMER ASSETS AT RISK In this section, we describe and summarize the findings of the empirical analyses we undertook to estimate the sizes and locations of U.S. futures customer assets that are potentially at risk and that could potentially be protected (in whole or in part) by a CAPI program. We begin in Section V.A with a brief description of the different types of customers that maintain accounts at clearing and non-clearing FCMs in the United States. In Section V.B, we review customer assets at risk on a non-stressed basis (i.e., total customer assets without taking into account simulated market movements). In Section V.C, we rely on a sample of actual customer-level data to estimate customer assets at risk under stressed market conditions.
A. Types of Customers of U.S. FCMs
Classifying and reporting data on the numbers and proportions of “types of U.S. futures customers” is often problematic and can result in estimates that are difficult to interpret and compare. For example, the primary report prepared by the CFTC that reports trader-level data by trader type is the Commitments of Traders (“COT”) report. Prior to September 4, 2009, the COT reported a breakdown of the open interest for futures markets in which 20 or more traders held positions equal to or above CFTC-defined minimum reporting thresholds (“reportable positions”). Traders were classified as “commercial” or “non-commercial.”
On September 4, 2009, the CFTC began publishing a Disaggregated COT report that now classifies reportable positions into four categories of traders:
• Producer/Merchant/Processor/User: “[A]n entity that predominantly engages in the production, processing, packing or handling of a physical commodity and uses the futures
Page 24

markets to manage or hedge risks associated with those activities.”52
• Swap Dealer: “[A]n entity that deals primarily in swaps for a commodity and uses the futures markets to manage or hedge the risk associated with those swaps transactions. The swap dealer’s counterparties may be speculative traders, like hedge funds, or traditional commercial clients that are managing risk arising from their dealings in the physical commodity.”53
• Money Manager: “[A] registered commodity trading advisor (CTA); a registered commodity pool operator (CPO); or an unregistered fund identified by CFTC. These traders are engaged in managing and conducting organized futures trading on behalf of clients.”54
• Other Reportables: “Every other reportable trader that is not placed into one of the other three categories is placed into the ‘other reportables’ category.”55
The classification of a trader into one of the above categories is based on what traders report on Form 40 (and its Schedule 1) that reportable traders must file with the CFTC at least every two years (or any time upon request by the CFTC). The CFTC also takes into account any other information it may consider relevant in classifying a trader in the above taxonomy. The CFTC data and classifications, however, are only relevant for traders with reportable positions – i.e., positions in excess of size minimums as defined by the CFTC.56 Customers that might be classified as small or retail do not generally have reportable positions and thus are not included in these numbers.
An alternative popular taxonomy of customer types is based on the classifications of customer account types by an FCM’s DSRO. Because CME is the DSRO for clearing members of CME and NFA is the DSRO for non-clearing FCMs, the two DSROs classify customer accounts of their reporting FCMs differently.57 We summarize the two approaches and provide examples of recent data for the two DSROs in the following two sections.
For both CME and NFA, we emphasize that the DSROs’ classifications of customers by type is purely for informational purposes. Numerous factors affect the DSROs’ decisions regarding how and what to review at a given FCM during an examination, and classifications of customers by type play a limited role in informing examination priorities and monitoring activities of DSROs.
52 CFTC, Explanatory Notes on Disaggregated Commitments of Traders Report, http://www.cftc.gov/ucm/groups/ public/@commitmentsoftraders/documents/file/disaggregatedcotexplanatorynot.pdf (last visited October 16, 2013). 53 Id. 54 Id. 55 Id. 56 See 17 CFR §15.03 (2013). 57 CME follows the standard programs approved by JAC, of which NFA is also a member. NFA chose recently to expand its own data collection efforts.
Page 25

The classifications, moreover, are essentially self-reported by FCMs to the DSROs and are not systematically reviewed by either organization.58 In other words, the data concerning customer types (and the resulting data) reported in the next two sections was collected by the DSROs as part of their regulatory activities but is not essential for their discharge of those regulatory activities.
(1) CME As a DSRO for FCMs that are clearing members of a CME exchange, CME’s classification of customers of its reporting FCMs is partially based on the relationship between the customer account(s) and the CME as an exchange and CCP. Specifically, CME classifies customers at a broad level into four types:
• Hedge/Commercial: Customers that have represented to their FCM and to CME that their futures market activities are generally related to the management of risks in their primary physical commodities or financial business activities.
• Members: Customer transactions at reporting FCMs executed by customers that are members of any CFTC-regulated DCM.
• Customer Omnibus Accounts: Customer accounts that reflect the aggregate positions and trades of multiple customers executed by a different FCM that are cleared through the reporting clearing FCM. For example, many non-clearing FCMs that have NFA as a DSRO will have positions that show up in CME’s reporting FCMs as customer omnibus accounts.
• “Speculative” Accounts: The “speculative” classification refers to customer accounts at clearing FCMs reporting to CME as a DSRO that do not fall into any of the other three classifications. Speculative accounts thus might include CME non-members trading through the clearing FCM on a retail basis, non-member algorithmic or high-frequency traders, non-member asset managers that do not otherwise classify themselves as Hedge/Commercial traders, and the like.
In August 2013, 48 FCMs reported to CME as their DSRO. Exhibit 4 below shows the number of accounts (and their relative proportions) for each of the four customer types for all 48 FCMs as reported on the most recent CME examination of those FCMs as of August 2013.59
58 Because these classifications are not a critical variable in determining the risk or examination priority of an FCM, they do not a priori need to be audited. 59 Because some customers have more than one account, numbers of customers are more informative than numbers of accounts. FCM position-keeping and reporting systems, however, are generally configured so that account-level information can be extracted and reported quickly, whereas consolidated customer-level position takes longer to compile and summarize. As such, FCMs often report account-level data instead of customer-level data.
Page 26

Exhibit 4: Customer Types at FCMs Reporting to CME as DSRO
Although the information reflected in Exhibit 4 suggests that about 38 percent of customer accounts are Commercial/Hedge and 59 percent are Speculative, it is worth noting that the Speculative category is a catch-all category and does not necessarily mean that all customers in that category are using futures to take directional or spread positions in an effort to make a profit (as opposed to using futures to manage their risks). As noted, these customer types are based on self-reported classifications, which in turn are driven significantly by regulatory considerations, especially with regard to what customers can be considered “bona fide Hedgers.”
For example, an asset manager that is not a member of a CME exchange could use futures to increase its exposure to an equity index market synthetically and might also use futures to hedge its equity price exposure on an existing portfolio of stocks. Depending on the relative frequency of the two types of futures transactions, that customer might not be comfortable reporting itself as a bona fide Hedger and thus would be classified as a Speculator. Nevertheless, a potentially significant proportion of that asset manager’s futures and options transactions could in fact be risk-reducing hedge transactions.
(2) NFA NFA collects relatively granular information from its constituent non-clearing FCMs regarding classifications of their customers and the nature of their trading activities. As is the case with
Hedge/Commercial Accounts97,576
38.14%
Member Accounts7,449
2.91%
Speculative Customer Accounts150,292 58.74%
Customer Omnibus Accounts533
0.21%
SOURCE: CME NOTES: Data is as-of the most recent examination or firm profile date by CME through August 2013. All data reflects the aggregate of all 48 reporting FCMs.
Page 27

CME, information provided to NFA by FCMs is self-reported. Such information is provided as a part of the examination process.
Unlike CME, NFA’s customer classifications are not intended to reflect a single, comprehensive classification of all customer accounts. Instead, NFA collects information about certain specific attributes of the customer accounts at its non-clearing FCM constituents. A snapshot of the characteristics of customers at FCMs reporting to NFA as their DSRO appears in Table 1. The information in Table 1 is based on data provided to NFA by each FCM as of its most recent examination date up through October 2013.
Table 1: Customer Types at FCMs Reporting to NFA as DSRO
Total Number of Reporting FCMs:a 18 Total Number of Accounts:b 306,498 Domicile:c U.S. Customers 77% Foreign Customers 23% Size/Type:c Individual Accounts 83% Institutional Accounts 17% Trading Frequency:c Day Traders 37% Position Traders 63% Bona Fide Hedgers:d 12% Algorithmic Traders:d 13% a: Based on most recent NFA examination date for each FCM through October 2013. Excludes FCMs whose examinations were still underway or whose reports were being finalized. b: Excludes FCMs with unreported values as a result of ongoing examinations or unreported exam results. c: Percentages are calculated relative to the total number of accounts reported for both categories. d: Percentages are calculated relative to the total number of active customer accounts reported by the FCM. Source: NFA.
Of the 18 FCMs underlying the information reported in Table 1, 17 would be considered “Small FCMs” based on the nomenclature defined below in Section V.B – i.e., only one of the 18 FCMs had customer assets in excess of $1 billion, and the remaining 17 had customer assets of under $1 billion. As such, the summary statistics presented in Table 1 are not broadly representative of the U.S. futures industry as a whole, but are good indicators of the customer types at Small FCMs.
B. Non-Stressed Customer Assets and Misfeasance/Malfeasance Under-Segregation Risk
In this Section, we present snapshots of total customer assets (using 2012 as a sample period) that could be subject to under-segregation losses arising from misfeasance or malfeasance. We focused on 2012 largely because of the numerous changes that have occurred in recent years, including MFG’s failure, the customer protection enhancements implemented in 2011 and 2012, and other regulatory changes to the global derivatives marketplace. Relying on earlier time
Page 28

periods thus would, in our view, misrepresent the likely customer asset exposures in the near and longer-term future.60
Because the underlying causes of under-segregation arising from misfeasance or malfeasance (e.g., fraud, misappropriation of customer funds, operational failures) are not necessarily caused by or coincident with extreme market movements that will affect the values of lost customer assets, the analysis in this section is exclusively on “non-stressed” customer assets at U.S. FCMs. Throughout this section, moreover, we assume that all customer assets are potentially at risk of loss. We address alternative loss scenarios later in Section IX.B.3.
(1) Customer Assets at Risk by FCM Exhibits 5 – 7 show snapshots of where customer assets were located by FCM at the end of December 2012, as reported to the CFTC.61 The purple, red, and blue bars represent “Large,” “Medium,” and “Small” FCMs (in terms of total customer assets held), respectively. Note that these figures reflect aggregate customer assets at FCMs and provide no insight on the size of individual customer exposures. (We explore per-customer exposures in the other parts of this Section V.B). Exhibit 5 shows customer assets at FCMs of all sizes at the end of December 2012. Exhibit 5 emphasizes customer assets held at “Large” FCMs, which we define here and henceforth as FCMs with more than $5 billion of customer assets. Of the 69 FCMs shown, 10 have customer assets in excess of $5 billion, as indicated by the purple bars. Total customer assets held at Large FCMs at the end of December 2012 amounted to nearly $150 billion. Goldman Sachs & Co. was the largest FCM in December 2012, with $28.9 billion in reported customer assets. The smallest FCM in the Large FCM category was Citigroup Global Markets, Inc., which held $9.09 billion in customer assets at the end of December 2012. The average amount of customer assets held at Large FCMs in December 2012 was $14.97 billion. In its last available CFTC filing in August 2011, MFG reported about $8 billion in customer assets to the CFTC and thus would have been considered a Large FCM.
60 As Exhibit 2 demonstrates, total customer assets in 2012 were not as high as in earlier periods. Nevertheless, because those earlier periods were prior to the implementation of recent regulatory changes, we and other market participants that we consulted still prefer to focus on 2012 as a more representative regime. 61 We exclude all FCMs that reported zero customer assets at the end of December 2012.
Page 29

Exhibit 5: Customer Assets Held at U.S. FCMs in December 2012 (Large)
Exhibit 6 focuses on displaying customer assets held at “Medium” FCMs, which we define as FCMs with more than $1 billion but less than or equal to $5 billion of customer assets. Note that the range of the y-axis in Exhibit 6 is from $1 billion to $5 billion to depict clearly assets held by Medium FCMs, as indicated by red bars. Total customer assets held at these 15 Medium FCMs at end-December 2012 were $31.5 billion. The largest Medium FCM in December 2012 was R.J. O’Brien & Associates LLC with $4.17 billion in customer assets, and the smallest Medium FCM in December 2012 was Macquarie Futures USA LLC which held $1.13 billion of customer assets. The average total customer asset amount across the 15 Medium FCMs in December 2012 was $2.1 billion.
$0
$5
$10
$15
$20
$25
$30
ABN AM
RO CLEARIN
G CHICAG
O LLC
ADM IN
VESTOR SERVICES IN
CADVAN
TAGE FU
TURES LLC
ALPARI (US) LLC
AMP G
LOBAL CLEARIN
G LLC
BARCLAYS CAPITAL INC
BNP PARIBAS PRIM
E BROKERAG
E INC
BNP PARIBAS SECU
RITIES CORP
BNY M
ELLON
CLEARING
LLCCAN
TOR FITZGERALD &
COCHS H
EDGIN
G IN
CCITIG
ROU
P GLO
BAL MARKETS IN
CCREDIT SU
ISSE SECURITIES (U
SA) LLCCRO
SSLAND LLC
CUN
NIN
GHAM
COM
MO
DITIES LLCCX CAPITAL M
ARKETS LLCDAIW
A CAPITAL MARKETS AM
ERICA INC
DEUTSCHE BAN
K SECURITIES IN
CDO
RMAN
TRADING
LLCE D &
F MAN
CAPITAL MARKETS IN
CEAG
LE MARKET M
AKERS INC
ENSKILDA FU
TURES LTD
FCSTON
E LLCFRIEDBERG
MERCAN
TILE GRO
UP IN
CFRO
NTIER FU
TURES IN
CG
AIN CAPITAL G
ROU
P LLCG
H FINAN
CIALS LLCG
OLDM
AN SACHS &
COG
OLDM
AN SACHS EXECU
TION
& CLEARIN
G LPHSBC SECU
RITIES USA IN
CIN
TERACTIVE BROKERS LLC
IRON
BEAM IN
CJEFFERIES BACHE LLCJP M
ORG
AN CLEARIN
G CO
RPJP M
ORG
AN SECU
RITIES LLCKN
IGHT CAPITAL AM
ERICAS LLCLEK SECU
RITIES CORPO
RATION
LINN
GRO
UP THE
MACQ
UARIE FU
TURES U
SA LLCM
AREX NO
RTH AMERICA LLC
MCVEAN
TRADING
& IN
VESTMEN
TS LLCM
ERRILL LYNCH
PIERCE FENN
ER & SM
ITHM
ERRILL LYNCH
PROFESSIO
NAL CLEARIN
G CORP
MID CO
COM
MO
DITIES INC
MIZU
HO
SECURITIES U
SA INC
MO
RGAN
STANLEY &
CO LLC
MO
RGAN
STANLEY SM
ITH BARNEY LLC
NEW
EDGE U
SA LLCN
OM
URA SECU
RITIES INTERN
ATION
AL INC
OPPEN
HEIMER &
CO IN
CO
PTION
SXPRESS INC
PHILLIP FUTU
RES INC
PION
EER FUTU
RES INC
RAND FIN
ANCIAL SERVICES IN
CRBC CAPITAL M
ARKETS LLCRBS SECU
RITIES INC
RJ OBRIEN
ASSOCIATES LLC
ROSEN
THAL COLLIN
S GROU
P LLCSAN
TANDER IN
VESTMEN
T SECURITIES IN
CSTATE STREET GLO
BAL MARKETS LLC
STRAITS FINAN
CIAL LLCTD AM
ERITRADE INC
TIMBER HILL LLC
TRADESTATION
SECURITIES IN
CU
BS FINAN
CIAL SERVICES INC
UBS SECU
RITIES LLCVELO
CITY FUTU
RES LLCVISIO
N FIN
ANCIAL M
ARKETS LLCYO
RK BUSIN
ESS ASSOCIATES LLC
Tota
l Cus
tom
er A
sset
s ($
bill
ions
)
Small
Medium
Large
SOURCE: CFTC. NOTES: Total customer assets include all assets held by customers in segregated or foreign secured accounts at U.S. FCMs as reported to CME or NFA as DSROs.
Page 30

Exhibit 6: Customer Assets Held at U.S. FCMs in December 2012 (Medium)
The remaining 44 FCMs have total customer assets of less than or equal to $1 billion dollars, as highlighted in Exhibit 7, where the y-axis goes from zero to $1 billion. We henceforth refer to these FCMs as “Small” FCMs, as indicated by blue bars. These 44 Small FCMs held a total of $9.87 billion in customer assets in December 2012. The largest Small FCM in December 2012 was McVean Trading & Investments LLC, which reported $951.6 million in customer assets that month, and the smallest Small FCM was Eagle Market Makers, Inc., with $591,169 in customer assets in December 2012. The average total customer assets held by Small FCMs was $224.3 million. For comparison purposes, note that Peregrine Financial reported $410 million in customer assets in its last CFTC filing in May 2012, and would, therefore, have been classified as a Small FCM.
$1.0
$1.5
$2.0
$2.5
$3.0
$3.5
$4.0
$4.5
$5.0
ABN AM
RO CLEARIN
G CHICAG
O LLC
ADM IN
VESTOR SERVICES IN
CADVAN
TAGE FU
TURES LLC
ALPARI (US) LLC
AMP G
LOBAL CLEARIN
G LLC
BARCLAYS CAPITAL INC
BNP PARIBAS PRIM
E BROKERAG
E INC
BNP PARIBAS SECU
RITIES CORP
BNY M
ELLON
CLEARING
LLCCAN
TOR FITZGERALD &
COCHS H
EDGIN
G IN
CCITIG
ROU
P GLO
BAL MARKETS IN
CCREDIT SU
ISSE SECURITIES (U
SA) LLCCRO
SSLAND LLC
CUN
NIN
GHAM
COM
MO
DITIES LLCCX CAPITAL M
ARKETS LLCDAIW
A CAPITAL MARKETS AM
ERICA INC
DEUTSCHE BAN
K SECURITIES IN
CDO
RMAN
TRADING
LLCE D &
F MAN
CAPITAL MARKETS IN
CEAG
LE MARKET M
AKERS INC
ENSKILDA FU
TURES LTD
FCSTON
E LLCFRIEDBERG
MERCAN
TILE GRO
UP IN
CFRO
NTIER FU
TURES IN
CG
AIN CAPITAL G
ROU
P LLCG
H FINAN
CIALS LLCG
OLDM
AN SACHS &
COG
OLDM
AN SACHS EXECU
TION
& CLEARIN
G LPHSBC SECU
RITIES USA IN
CIN
TERACTIVE BROKERS LLC
IRON
BEAM IN
CJEFFERIES BACHE LLCJP M
ORG
AN CLEARIN
G CO
RPJP M
ORG
AN SECU
RITIES LLCKN
IGHT CAPITAL AM
ERICAS LLCLEK SECU
RITIES CORPO
RATION
LINN
GRO
UP THE
MACQ
UARIE FU
TURES U
SA LLCM
AREX NO
RTH AMERICA LLC
MCVEAN
TRADING
& IN
VESTMEN
TS LLCM
ERRILL LYNCH
PIERCE FENN
ER & SM
ITHM
ERRILL LYNCH
PROFESSIO
NAL CLEARIN
G CORP
MID CO
COM
MO
DITIES INC
MIZU
HO
SECURITIES U
SA INC
MO
RGAN
STANLEY &
CO LLC
MO
RGAN
STANLEY SM
ITH BARNEY LLC
NEW
EDGE U
SA LLCN
OM
URA SECU
RITIES INTERN
ATION
AL INC
OPPEN
HEIMER &
CO IN
CO
PTION
SXPRESS INC
PHILLIP FUTU
RES INC
PION
EER FUTU
RES INC
RAND FIN
ANCIAL SERVICES IN
CRBC CAPITAL M
ARKETS LLCRBS SECU
RITIES INC
RJ OBRIEN
ASSOCIATES LLC
ROSEN
THAL COLLIN
S GROU
P LLCSAN
TANDER IN
VESTMEN
T SECURITIES IN
CSTATE STREET GLO
BAL MARKETS LLC
STRAITS FINAN
CIAL LLCTD AM
ERITRADE INC
TIMBER HILL LLC
TRADESTATION
SECURITIES IN
CU
BS FINAN
CIAL SERVICES INC
UBS SECU
RITIES LLCVELO
CITY FUTU
RES LLCVISIO
N FIN
ANCIAL M
ARKETS LLCYO
RK BUSIN
ESS ASSOCIATES LLC
Tota
l Cus
tom
er A
sset
s ($
bill
ions
)
Small
Medium
Large
SOURCE: CFTC. NOTES: Total customer assets include all assets held by customers in segregated or foreign secured accounts at U.S. FCMs as reported to CME or NFA as DSROs.
Page 31

Exhibit 7: Customer Assets Held at U.S. FCMs in December 2012 (Small)
Table 2 provides a more detailed summary of customer assets in U.S. FCMs across all month-ends during the 2012 calendar year. Panel (a) reports summary statistics for the average of total customer assets on deposit at Small, Medium, and Large FCMs over all months in 2012.62 The various “Percentile” statistics in Table 2 show the average total customer assets across FCMs equal to or below the stated percentile within each FCM size category. For example, the 25th Percentile for Small FCMs in Panel (a) of $12,342,504 can be interpreted to mean that 25 percent of the 52 reporting Small FCMs had average total customer assets in 2012 of $12,342,504 or less. Similarly, the 95th Percentile for Small FCMs in Panel (a) of $660,981,165 can be interpreted to mean that 95 percent of all 52 Small FCMs had average total customer assets across all months in 2012 of $660,981,165 or less. Panels (b) and (c) of Table 2 distinguish between the required and excess customer assets held by the various FCMs (averaged across all month-ends in 2012). Table 2, Panel (d) shows the
62 Note that Table 2 shows 52 Small FCMs, as compared to the 44 Small FCMs shown in Exhibit 7. This occurs because Exhibit 7 reports assets for FCMs with non-negative asset balances only for December 2012, whereas Table 2 includes all FCMs with non-negative asset balances in any month during all of 2012. The number of FCMs shown in Table 2 thus is larger than that reflected in Exhibit 7.
$0.0
$0.1
$0.2
$0.3
$0.4
$0.5
$0.6
$0.7
$0.8
$0.9
$1.0
ABN AM
RO CLEARIN
G CHICAG
O LLC
ADM IN
VESTOR SERVICES IN
CADVAN
TAGE FU
TURES LLC
ALPARI (US) LLC
AMP G
LOBAL CLEARIN
G LLC
BARCLAYS CAPITAL INC
BNP PARIBAS PRIM
E BROKERAG
E INC
BNP PARIBAS SECU
RITIES CORP
BNY M
ELLON
CLEARING
LLCCAN
TOR FITZGERALD &
COCHS H
EDGIN
G IN
CCITIG
ROU
P GLO
BAL MARKETS IN
CCREDIT SU
ISSE SECURITIES (U
SA) LLCCRO
SSLAND LLC
CUN
NIN
GHAM
COM
MO
DITIES LLCCX CAPITAL M
ARKETS LLCDAIW
A CAPITAL MARKETS AM
ERICA INC
DEUTSCHE BAN
K SECURITIES IN
CDO
RMAN
TRADING
LLCE D &
F MAN
CAPITAL MARKETS IN
CEAG
LE MARKET M
AKERS INC
ENSKILDA FU
TURES LTD
FCSTON
E LLCFRIEDBERG
MERCAN
TILE GRO
UP IN
CFRO
NTIER FU
TURES IN
CG
AIN CAPITAL G
ROU
P LLCG
H FINAN
CIALS LLCG
OLDM
AN SACHS &
COG
OLDM
AN SACHS EXECU
TION
& CLEARIN
G LPHSBC SECU
RITIES USA IN
CIN
TERACTIVE BROKERS LLC
IRON
BEAM IN
CJEFFERIES BACHE LLCJP M
ORG
AN CLEARIN
G CO
RPJP M
ORG
AN SECU
RITIES LLCKN
IGHT CAPITAL AM
ERICAS LLCLEK SECU
RITIES CORPO
RATION
LINN
GRO
UP THE
MACQ
UARIE FU
TURES U
SA LLCM
AREX NO
RTH AMERICA LLC
MCVEAN
TRADING
& IN
VESTMEN
TS LLCM
ERRILL LYNCH
PIERCE FENN
ER & SM
ITHM
ERRILL LYNCH
PROFESSIO
NAL CLEARIN
G CORP
MID CO
COM
MO
DITIES INC
MIZU
HO
SECURITIES U
SA INC
MO
RGAN
STANLEY &
CO LLC
MO
RGAN
STANLEY SM
ITH BARNEY LLC
NEW
EDGE U
SA LLCN
OM
URA SECU
RITIES INTERN
ATION
AL INC
OPPEN
HEIMER &
CO IN
CO
PTION
SXPRESS INC
PHILLIP FUTU
RES INC
PION
EER FUTU
RES INC
RAND FIN
ANCIAL SERVICES IN
CRBC CAPITAL M
ARKETS LLCRBS SECU
RITIES INC
RJ OBRIEN
ASSOCIATES LLC
ROSEN
THAL COLLIN
S GROU
P LLCSAN
TANDER IN
VESTMEN
T SECURITIES IN
CSTATE STREET GLO
BAL MARKETS LLC
STRAITS FINAN
CIAL LLCTD AM
ERITRADE INC
TIMBER HILL LLC
TRADESTATION
SECURITIES IN
CU
BS FINAN
CIAL SERVICES INC
UBS SECU
RITIES LLCVELO
CITY FUTU
RES LLCVISIO
N FIN
ANCIAL M
ARKETS LLCYO
RK BUSIN
ESS ASSOCIATES LLC
Tota
l Cus
tom
er A
sset
s ($
bill
ions
)
Small
Medium
Large
SOURCE: CFTC. NOTES: Total customer assets include all assets held by customers in segregated or foreign secured accounts at U.S. FCMs as reported to CME or NFA as DSROs.
Page 32

maximum amounts of total customer assets on deposit at FCMs across all month-ends in 2012, by size category. The last column of Table 2, Panel (d) reports various descriptive statistics for Large FCMs in 2012. The median observation of about $14.094 billion indicates that five of the 10 Large FCMs had maximum total customer assets during 2012 of roughly $14.094 billion or less. Similarly, the maximum of about $31.852 billion indicates that the largest amount of total customer assets in any month of 2012 across the 10 Large FCMs was about $31.852 billion.
Table 2: Customer Assets in U.S. FCMs Across All Month-Ends in 2012a FCM Size Category:b Small Medium Large
Number of FCMs:c 52 15 10 Panel (a): Total Customer Assets (2012 Averages)
25th Percentile $12,342,504 $1,559,009,192 $10,131,796,674 Median $88,700,139 $2,121,980,154 $12,355,868,290 75th Percentile $260,328,122 $2,566,631,778 $21,397,231,886 95th Percentile $660,981,165 $3,616,950,952 $26,789,696,551 Maximum $955,368,017 $4,108,999,639 $29,644,285,919
Panel (b): Required Customer Assets (2012 Averages) 25th Percentile $10,767,788 $1,122,854,992 $9,674,509,935 Median $78,189,052 $1,860,862,038 $11,413,645,064 75th Percentile $264,269,547 $2,322,512,159 $19,484,640,279 95th Percentile $623,162,042 $3,316,236,387 $25,614,645,048 Maximum $911,468,990 $3,966,596,170 $28,556,146,226
Panel (c): Excess Customer Assets (2012 Averages) 25th Percentile $1,690,027 $116,244,711 $699,431,341 Median $5,245,372 $235,812,324 $959,061,733 75th Percentile $18,104,734 $354,697,717 $1,236,040,218 95th Percentile $106,878,500 $684,622,852 $1,859,349,065 Maximum $215,621,869 $722,454,881 $2,273,460,885
Panel (d): Total Customer Assets (2012 Maximums) 25th Percentile $34,050,250 $1,841,473,617 $10,997,069,931 Median $119,420,190 $2,344,943,681 $14,093,776,998 75th Percentile $435,980,608 $2,880,552,940 $22,014,146,719 95th Percentile $789,109,947 $3,960,416,178 $29,451,377,684 Maximum $1,128,040,953 $4,514,351,283 $31,851,751,905 a: Customer assets are averaged across all month-ends in 2012. As a result, Panels (a)-(d) do not necessarily reconcile – e.g., the 25th percentile total customer assets in Panel (a) is not equal to the sum of the 25th percentile required customer assets in Panel (b) with the 25th percentile excess customer assets in Panel (c). b: Small FCMs are defined as FCMs that had average total customer assets of less than or equal to $1 billion in 2012. Medium FCMs are defined as FCMs that had average total customer assets of between $1 billion and $5 billion in 2012. Large FCMs are defined as FCMs that had average total customer assets of $5 billion or more in 2012. c: FCMs reporting zero customer assets in any month during 2012 were excluded from this analysis. Sources: CFTC, CME, & NFA.
(2) Per-Customer Assets at Risk Because of the significant disparity in the asset sizes of different futures trading customers, not all customers can be viewed in the same way when contemplating the feasibility of CAPI coverage. Yet, customer-specific assets on deposit are not reported on a customer-by-customer basis regularly to DSROs. Because of the clearing member-centric structure of DCOs, even DCOs do not have access to detailed information about individual customers of FCMs. In order
Page 33

to summarize customer-level assets at risk of under-segregation losses, we thus reviewed a sample of what we and the Sponsors consider to be “representative” FCMs – i.e., FCMs that collectively provide what we consider to be a typical reflection of customer asset exposures in the U.S. futures industry.
We contacted various U.S. FCMs ranging from very large banking institutions to small, specialized FCMs and requested customer-level data for each month-end in 2012. Specifically, we requested data on all open positions at each month-end in 2012 for all customers of each FCM, as well as data detailing the margin requirements, customer assets in excess of margin requirements, and net liquidating equity values associated with each of its customers. To preserve the propriety of FCM and customer data, we did not request any identifying information about individual customers, although we asked each FCM to associate a unique identifier with each customer so that we could aggregate positions and assets held by the same customer across multiple accounts held with the same FCM. The anonymous nature of our request and FCM responses, however, means that we cannot identify customers with accounts at multiple FCMs. Accordingly, all of our analysis reflects assets at the customer (not the account) level for each specific FCM, but does not consider assets and exposures across multiple FCMs. Of the FCMs we initially contacted, six FCMs ultimately provided the requested data in a form that was usable.
Table 3 provides a summary of the financial characteristics of the six FCMs that provided usable data (henceforth, the “Contributing FCMs”). To preserve the proprietary nature of the data the Contributing FCMs provided, we do not identify these FCMs by name and do not provide specific financial information that would facilitate the identification of these firms through an analysis of publicly reported data. Instead, we have classified the Contributing FCMs into the same size categories defined in Section V.B.1 – i.e., Large FCMs have total customer assets of $5 billion or more; Medium FCMs have total customer assets between $1 billion and $5 billion; and Small FCMs have total customer assets of $1 billion or less. Two Contributing FCMs in each size category provided us with data, and we thus refer to the Contributing FCMs as Large 1 and 2, Medium 1 and 2, and Small 1 and 2.
Table 3: 2012 Financial Characteristics of the Contributing FCMs All 2012 At Year-End 2012
Contributing FCM
Annual Gross Revenues from Futuresa
Adjusted Net Capital (ANC)b
Total Customer Assetsc
Large 1 $215,868,926 Greater Than $1bn Greater Than $5bn Large 2 $918,039,885 Greater Than $1bn Greater Than $5bn
Medium 1 $252,987,298 Between $100mn and $1bn Between $1bn and $5bn Medium 2 $392,312,040 Between $100mn and $1bn Between $1bn and $5bn
Small 1 $15,113,638 Less Than $100mn Less Than $1bn Small 2 $4,690,912 Less Than $100mn Less Than $1bn
a: Gross revenues from futures are based on monthly reports submitted to CME and NFA (as DSROs) and do not include any gross revenues from futures options. (Futures options revenues are included with other non-futures options revenues on the 1-FR, FOCUS II, and FOCUS II CSE forms used by FCMs for certain DSRO reporting purposes. Because we could not disaggregate futures options revenue from these reported numbers, we excluded all options revenues.) b: ANC is the amount of the FCM’s regulatory capital that is used to assess the FCM’s compliance with minimum capital requirements (as further explained in CFTC Regulation 1.17). To preserve the proprietary nature of the data, ANC amounts have been reported as a range. c: Total Customer Assets reflect the sum of (i) assets required to satisfy minimum margin requirements for customer accounts and (ii) any excess assets on deposit from customers as of December 2012. To preserve the proprietary nature of the data, Total Customer Asset amounts are reported as ranges. Sources: CFTC, CME, and NFA.
Page 34

The number of customers at the Contributing FCMs fluctuates on a month-by-month basis as new customers are added and some customers close their accounts. Table 4 provides a summary of the total number of customers at each of the six Contributing FCMs in 2012 based on the number of months in which customers had open accounts.
Table 4: Number of Customers at Contributing FCMs in 2012 # of Customers
Present in All 12 Months
# of Customers Present in 10-11
Months
# of Customers Present in 8-9
Months
# of Customers Present in 6-7
Months
# of Customers Present in 5 or Fewer Months
Max # of Customers in Any Month
Large 1 561 72 93 77 310 899 Large 2 1,536 158 123 164 316 2,020 Medium 1 18,408 1,905 1,322 1,794 4,636 23,935 Medium 2 40,251 4,336 5,109 4,283 12,365 54,673 Small 1 n/aa n/aa 2,292 29 40 2,361 Small 2 369 30 29 55 119 516 a: FCM “Small 1” only provided data from April 2012 through December 2012.
(3) Per-Customer Assets Across FCMs Table 5 summarizes the required customer assets on deposit at the Contributing FCMs (by size category) across all month-ends in 2012. The customer asset values summarized include the average customer assets across all FCMs within each of the three size categories across all 12 month-ends in 2012, as well as the median, maximum, and several other percentiles. Unlike Table 2, in which various measures of customer assets at all reporting FCMs were summarized across FCMs based on averages or maximums in 2012, Table 5 summarizes customer assets for the two Contributing FCMs in each size category across time in 2012.
Table 5: Assets per Customera at Contributing FCMs (by FCM Size) in 2012b
Small FCMs Medium FCMs Large FCMs Average $98,684 $106,967 $24,867,263 25th Percentile $571 $743 $179,375 Median $4,434 $5,089 $1,385,989 75th Percentile $18,775 $23,255 $8,104,733 95th Percentile $280,469 $215,619 $73,916,661 Maximum $59,437,590 $239,842,270 $8,153,930,919 a: Assets per Customer reflect all required customer assets on deposit with each Contributing FCM by any single customer (regardless of the number of accounts held by that customer) subject to CFTC segregation requirements. Customers are analyzed at each FCM in isolation; the exposures shown do not reflect aggregated amounts on deposit by the same customer across multiple Contributing FCMs. Customers with negative or zero balances are excluded from all reported statistics for the months in which balances were zero or negative. b: Summary statistics are calculated within each Contributing FCM size category across all month-ends in 2012.
Table 5 shows that there is a strong positive relation between the size of the FCM and the size of the customers of Small and Large FCMs. For Small FCMs, 25 percent of all customer accounts contained $571 or less, whereas 25 percent of all customer accounts at Large FCMs contained $179,375 or less. These same disparities are evident in all of the summary statistics – e.g., the largest customer of the two Small Contributing FCMs in all month-ends during 2012 had $59.4 million of assets on deposit, whereas the largest customer in 2012 at the two Large Contributing FCMs had an $8.2 billion account balance. Table 5 also shows that there is very little difference between the sizes of customer assets held at Small and Medium FCMs with the exception of the largest customer in each FCM category.
Page 35

(4) Per-Customer Assets by Customer Size Category Customers of U.S. FCMs can generally be classified into size categories based on the amount of assets they have on deposit with Contributing FCMs in each month. It is important to stratify customers based on their sizes because relatively small customers account for a disproportionately large percentage of U.S. FCM customers, yet account for a disproportionately small percentage of aggregate customer assets at risk.
We stratified the Contributing FCMs’ customers into three size categories:
• Small: Customers with median assets of $50,000 or less in 2012; • Medium: Customers with median assets of between $50,000 and $250,000 in 2012; and • Large: Customers with median assets of $250,000 or more in 2012.
Table 6 summarizes customer assets by size category at the Contributing FCMs in 2012. For example, the median row of Table 6 tells us that across all month-ends in 2012, half of all Small, Medium, and Large customers had median asset balances of less than or equal to $3,221, $92,152, and $879,923, respectively. Table 6 also indicates that customers in the assigned size categories at times had assets on deposit that were well outside their defined size category thresholds. For example, in one month during 2012 a customer engaged in very active trading and had assets totaling $178.4 million at one of the Large FCMs. That customer’s 2012 median asset size, however, was below $50,000 for all of 2012, so the customer is classified as Small despite the single month in which that customer would otherwise be considered Large. This was for the most part an aberration; we did not perceive significant migration across size categories like this for most customers over the 2012 sample period.
Table 6: Assets per Customera at Contributing FCMs (by Customer Size) in 2012b
Small Customers Medium Customers Large Customers # of Observations 776,937 98,618 61,395 Avg # of Customers per Month 64,745 8,218 5,116 Average Assets $11,000 $115,809 $13,119,180 25th Percentile Assets $435 $61,516 $406,496 Median Assets $3,221 $92,152 $879,923 75th Percentile Assets $11,518 $144,986 $3,251,626 95th Percentile Assets $38,284 $253,853 $31,344,821 Maximum Assets $178,405,220 $13,711,543 $8,153,930,919 a: Assets per Customer reflect all customer assets on deposit with each Contributing FCM by any single customer (regardless of the number of accounts held by that customer) within each customer size category and across all FCMs. Customers are analyzed at each FCM in isolation; the exposures shown do not reflect aggregated amounts on deposit by the same customer across multiple Contributing FCMs. All calculations exclude monthly observations for which customers have zero or negative asset balances. b: Summary statistics are calculated within each customer size category across all month-ends in 2012.
Table 6 reveals a significant difference in customer account sizes for Small and Medium customers as compared to Large customers. Looking at the average assets of customers for 2012,63 Medium customers had assets about 10 times greater than Small customers, and Large
63 The “average” is actually a double average. First, each customer’s assets are averaged across all months in 2012. Second, the average of those averages is taken across all customers by size category.
Page 36

customers’ average assets were over 100 times larger than Medium customers (and, hence, 1,000 times higher than Small customers). Table 6 also shows that the number of Small customers significantly exceeded the number of Large customers in 2012. The number of Medium customers lies in between the Small and Large extremes. This is particularly noteworthy because calls for CAPI have come primarily from Small and Medium customers. Although there are a large number of these customers, the total assets of these customers are relatively low compared to the total assets of Large customers. Based on data underlying the summary statistics in Table 6, a $250,000 per customer policy limit would cover 99 percent of the assets held by Small customers and 94 percent of the assets held by Medium customers. Yet, a $250,000 per customer policy limit would cover only eight percent of Large customers’ assets.64
C. Stressed Customer Assets and Fellow-Customer Risk
As explained in Section III.B, an FCM failure arising from fellow-customer risk is highly unlikely to result in losses for non-defaulting customers except during extremely stressed market conditions. To analyze the potential benefit of CAPI for U.S. futures customers exposed to fellow customer risk (and to quantify the potential exposure for prospective CAPI providers), we simulated potential customer gains and losses during a period of market stress.
Potential fellow-customer losses do not depend entirely on the stressed values of individual customer positions. In the event of one or more failures of an FCM’s customers to make a required margin payment, the FCM must use its own financial resources to cover as much as possible of the defaulting customers’ obligations. Those financial resources that an FCM is able to dedicate to cover an open customer payment obligation are a function of that FCM’s capital, liquid assets, short-term gains in house trading accounts, and more.
Many FCMs, however, are private firms with non-published financial statements, which makes it difficult to analyze the short-term funds available to cover obligations to DCOs or clearing FCMs arising from unpaid customer obligations at such firms. Instead of making arbitrary assumptions about available financial resources to cover customer default-related obligations to DCOs or clearing members, we assume throughout that all FCMs have no assets to cover such shortfalls. We realize this is unrealistic and biases our loss estimates upward, but assuming zero contributions from FCMs is the most neutral way to approach the analysis of fellow-customer losses below.
(1) Margin and Fellow-Customer Risk Even without any stress testing, margin requirements (and the customer assets deposited to satisfy those requirements) are already set at conservative levels based on potentially extreme price and volatility changes – see Sections II.B.2 and II.B.3 above. In the absence of a stress scenario or market meltdown, customer assets deposited to meet initial margin requirements
64 Specifically, the 8th percentile for Large customers is $245,917.
Page 37

already reflect potential significant market movements, which makes it unlikely that a large debit in excess of those margin deposits could arise at the same time the customer with that debit could not make its required payment and the FCM could not step in and cover the remaining open obligation to DCOs and/or its clearing FCMs. Fellow-customer risk thus arises only in very extreme market scenarios.
(2) Stress Testing Methodology Because fellow-customer risk-related losses can only arise if one or more customers at one or more FCMs have large net losses (i.e., losses well in excess of the initial margin and excess assets, some of which may be on deposit at the DCO), we worked with CME Clearing to define extreme stress scenarios that could lead to large net customer losses.65 If one or more customers with large net losses failed to honor their commitment to pay and the FCM’s own financial resources (presumed to be zero for this analysis, as noted in the previous section) were inadequate to cover the open obligation to the DCO, the FCM would default. The non-defaulting customers’ positions then would be liquidated, and the proceeds of those liquidations together with the assets of those other customers would be applied to the open obligation to the DCO (if the defaulting FCM is a clearing member) or the clearing FCM (if the defaulting FCM is a non-clearing member).
We provided CME Clearing with data collected from the six Contributing FCMs of all of their customers’ positions and assets66 by month for 2012. All accounts held by the same customer at each FCM were consolidated. CME Clearing then computed stressed gains and losses for these positions by customer and product type in a manner described in Section V.C.2.a below. In Section V.C.2.b, we explain how we analyzed those stressed customer-level losses by commodity group and FCM. Section V.C.3 then summarizes how we estimated potential fellow-customer losses.
(a) Definition of Price Shocks For all products held by customers of the six Contributing FCMs, we first calculated the historical price returns of the front-month (i.e., closest-to-expiration) futures contract or the historical spot market price returns (whichever data set was cleaner). For products with sufficiently long and high-quality price histories, we used a sample period of daily price changes dating back to 1987. For more recent products or products with infrequent or problematic data, we used the longest-available clean time series as the sample period. As a measure of the price shock for each product, CME Research then computed the 99.9th percentile expected shortfall (“ESF”) for the underlying commodity or product over the
65 CME Clearing performed a number of the calculations discussed in this section under our direct supervision. Uses of the first-person plural pronoun “we” in this section thus usually refer to both CME Clearing and Compass Lexecon. 66 Assets included required customer assets in the customer-segregated and foreign-secured accounts. See Section II.D.3.
Page 38

underlying sample period.67 The 99.9th percentile ESF is the average of all daily price changes in the interval between the 99.9th percentile and the 100th percentile (i.e., absolute worst-case) price change. In other words, the ESF measures the average of all of the 0.1 percent worst-case price changes in the sample price history. The ESF is a common measure of extreme or “tail” risk that is preferred by many market participants and regulators, and the choice of the 99.9th percentile as the basis for the ESF calculation is extremely conservative. The positions held by the six Contributing FCMs were not exclusively CME-traded futures and options. For non-CME products that are either identical to or very similar to CME-listed products, the price shocks were computed in the same manner (described above) as for CME-listed products. For non-CME products with no comparable CME product, CME Clearing obtained data where possible to compute the ESF in the same manner as explained above. In a very small number of cases for non-CME products, approximations were used. The ESF-based price shocks for each product were then used to calculate Stressed-Down and Stressed-Up estimated profits and losses for all positions held by customers of the Contributing FCMs.68
(b) Stressed Customer Loss Estimates SPAN margin requirements take into account correlations, both within related products and across commodity groups. For the purpose of this study, however, we made the significantly more conservative assumption of 100 percent correlation for products within commodity groups (e.g., all types of Agricultural products experience extreme losses at the same time) and 100 percent correlation across worst-case losses in all commodity groups (e.g., worst-case losses are realized in both the Agricultural group and the Metals group at the same time regardless of actual correlations across those groups).
As such, for each Contributing FCM and each commodity group, we calculated the total gross customer gain or loss (i.e., losses before applying customers’ margin and any excess assets) for both the Stressed-Down and Stressed-Up scenarios. We then chose the higher (in absolute value) of the two loss estimates as the Stressed Loss Scenario for that particular commodity group.69 We repeated this procedure for all of the other commodity groups at each FCM.
An example may help illustrate. Suppose that when all the product-specific price shocks are applied to all products in the Metals commodity group, all customers at a given FCM experience overall gains of $50 million under the Stressed-Up scenario and overall losses of $150 million under the Stressed-Down scenario. The Stressed-Down scenario would then be the relevant
67 The ESF also is known as a conditional value-at-risk or “CVaR.” See C. L. Culp, “The ‘At-Risk’ Metrics and Measures,” in Alternative (Re)insurance Strategies, 2nd ed., M. Lane, ed. (London: Risk Books, 2012). 68 No explicit shock to implied volatility was assumed. Large losses arising from delta-neutral exposures to gamma and vega thus are not reflected in this analysis. Nevertheless, because the price shocks are themselves so conservative, the impact on option prices is reflected in the estimated profits and losses through delta. 69 Note that not all customers experience gross losses in the Stressed Loss Scenario. On the contrary, the large price shocks that generate large potential gross losses for some customers also generate large potential gross gains for other customers.
Page 39
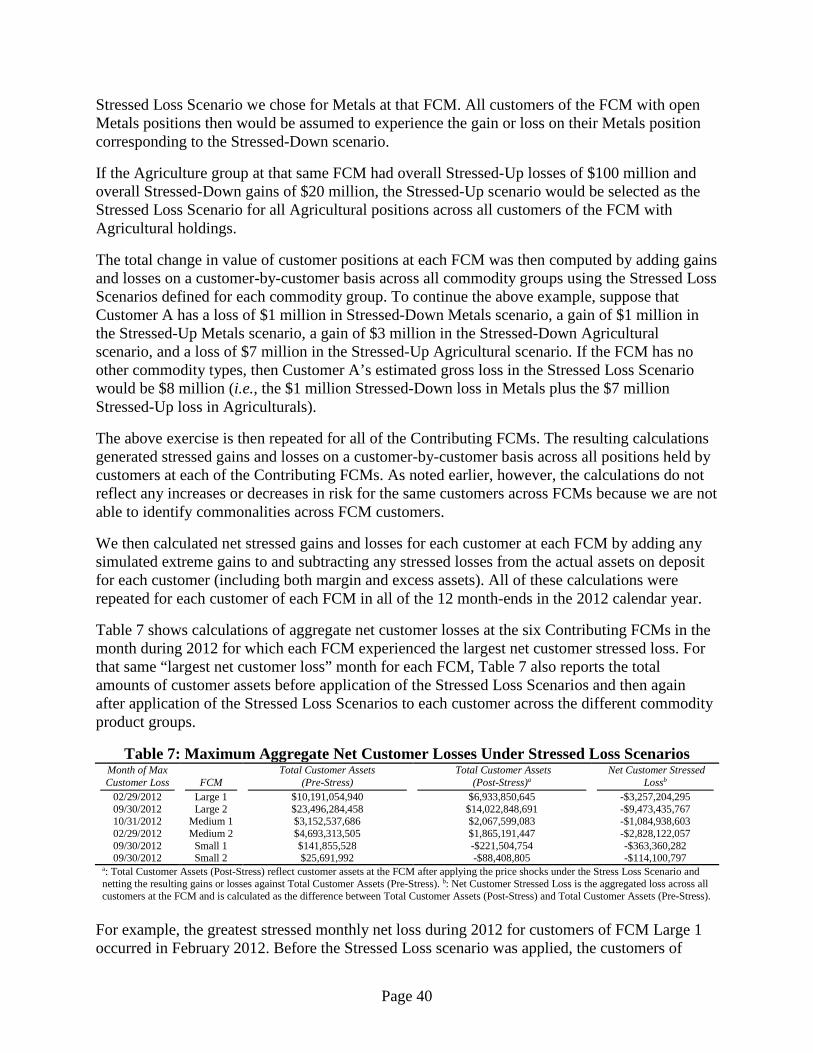
Stressed Loss Scenario we chose for Metals at that FCM. All customers of the FCM with open Metals positions then would be assumed to experience the gain or loss on their Metals position corresponding to the Stressed-Down scenario.
If the Agriculture group at that same FCM had overall Stressed-Up losses of $100 million and overall Stressed-Down gains of $20 million, the Stressed-Up scenario would be selected as the Stressed Loss Scenario for all Agricultural positions across all customers of the FCM with Agricultural holdings.
The total change in value of customer positions at each FCM was then computed by adding gains and losses on a customer-by-customer basis across all commodity groups using the Stressed Loss Scenarios defined for each commodity group. To continue the above example, suppose that Customer A has a loss of $1 million in Stressed-Down Metals scenario, a gain of $1 million in the Stressed-Up Metals scenario, a gain of $3 million in the Stressed-Down Agricultural scenario, and a loss of $7 million in the Stressed-Up Agricultural scenario. If the FCM has no other commodity types, then Customer A’s estimated gross loss in the Stressed Loss Scenario would be $8 million (i.e., the $1 million Stressed-Down loss in Metals plus the $7 million Stressed-Up loss in Agriculturals).
The above exercise is then repeated for all of the Contributing FCMs. The resulting calculations generated stressed gains and losses on a customer-by-customer basis across all positions held by customers at each of the Contributing FCMs. As noted earlier, however, the calculations do not reflect any increases or decreases in risk for the same customers across FCMs because we are not able to identify commonalities across FCM customers.
We then calculated net stressed gains and losses for each customer at each FCM by adding any simulated extreme gains to and subtracting any stressed losses from the actual assets on deposit for each customer (including both margin and excess assets). All of these calculations were repeated for each customer of each FCM in all of the 12 month-ends in the 2012 calendar year.
Table 7 shows calculations of aggregate net customer losses at the six Contributing FCMs in the month during 2012 for which each FCM experienced the largest net customer stressed loss. For that same “largest net customer loss” month for each FCM, Table 7 also reports the total amounts of customer assets before application of the Stressed Loss Scenarios and then again after application of the Stressed Loss Scenarios to each customer across the different commodity product groups.
Table 7: Maximum Aggregate Net Customer Losses Under Stressed Loss Scenarios Month of Max Customer Loss FCM
Total Customer Assets (Pre-Stress)
Total Customer Assets (Post-Stress)a
Net Customer Stressed Lossb
02/29/2012 Large 1 $10,191,054,940 $6,933,850,645 -$3,257,204,295 09/30/2012 Large 2 $23,496,284,458 $14,022,848,691 -$9,473,435,767 10/31/2012 Medium 1 $3,152,537,686 $2,067,599,083 -$1,084,938,603 02/29/2012 Medium 2 $4,693,313,505 $1,865,191,447 -$2,828,122,057 09/30/2012 Small 1 $141,855,528 -$221,504,754 -$363,360,282 09/30/2012 Small 2 $25,691,992 -$88,408,805 -$114,100,797
a: Total Customer Assets (Post-Stress) reflect customer assets at the FCM after applying the price shocks under the Stress Loss Scenario and netting the resulting gains or losses against Total Customer Assets (Pre-Stress). b: Net Customer Stressed Loss is the aggregated loss across all customers at the FCM and is calculated as the difference between Total Customer Assets (Post-Stress) and Total Customer Assets (Pre-Stress).
For example, the greatest stressed monthly net loss during 2012 for customers of FCM Large 1 occurred in February 2012. Before the Stressed Loss scenario was applied, the customers of
Page 40

FCM Large 1 had total customer assets of about $10.2 billion. In the Stressed Loss scenario, total customer assets decline by about $3.3 billion. So, the FCM’s total customer assets would have been about $6.9 billion after the stress test. Thus, about $6.9 billion of customer assets would have been available in February 2012 to cover any losses arising from the failure of one or more of FCM Large 1’s customers to pay and FCM Large 1’s inability to cover that payment obligation (and, hence, FCM Large 1’s default).
(3) Customer Default Assumptions With the individual customer net gains and losses estimated under stress scenarios at each of the FCMs, we then analyzed potential fellow-customer losses. In that regard, it does not make economic sense to assume that all customers of a defaulting FCM with a net loss (i.e., a net obligation to pay additional monies after taking into account existing margin and excess assets on deposit) would fail to honor (eventually) their payment obligations. As discussed earlier, we do not consider a delay in payment to be synonymous with a failure to pay.
So, we assume that only certain customers of an FCM cannot and do not pay their obligations and that the FCM cannot cover the resulting payment obligation to its clearing member (for non-clearing FCMs) or to the DCO (for clearing member FCMs). Specifically, we consider three different customer default scenarios:
(i) The single customer with 99th percentile stressed net losses – i.e., the defaulting customer’s stressed losses are greater than the stressed losses of 99 percent of the FCM’s other customers (in a net loss position) but less than the customers in the highest 1 percent loss category – defaults on its obligation to the FCM;
(ii) All customers with stressed net losses in the 99th to the 99.5th loss percentile default; and (iii) All customers with stressed net losses in the 98th to the 99.5th loss percentile default.
For example, in default scenario (iii) we are assuming that 1.5 percent of customers’ net losses at an FCM are not paid to the FCM as required. In particular, the 1.5 percent of losses that are not paid are the losses of customers whose stressed losses are greater than 98 percent of all other stressed customer losses and less than only the worst-case 0.5 percent losses.70
We emphasize that the percentiles we analyzed are not based on probability distributions or any assumptions about likelihoods of customer defaults to the FCMs. We are instead making specific assumptions about the particular customers (and the amounts they owe but cannot pay) to a defaulting FCM for scenario-analysis purposes.
Tables 8(a) through 8(d) summarize the results of our stressed loss analysis under these default scenarios. Tables 8(a), 8(b), and 8(c) report monthly stressed losses for the Large, Medium, and Small FCMs, respectively and Table 8(d) reports monthly stressed losses for all six Contributing FCMs by month for the 2012 calendar year. All four tables also report the maximum customer default-related loss across the twelve month-end dates.
70 Given the inherent conservatism (from a reinsurer’s perspective) already built into this exercise, we considered it unduly onerous to assume that the very worst-case customer stressed assets were also in default, so we excluded stressed losses in between the 99.5th and 100th percentiles.
Page 41

For example, Table 8(d) reports stressed losses per month assuming that customers default to all six of the Contributing FCMs. If the customer of each FCM with the 99th percentile loss defaults, total net losses (i.e., amounts owed to the FCM after applying the margin and excess assets of the 99th percentile customer presumed to default on its payment obligation) range from between $300.7 million to $572.9 million.
Losses become considerably higher when multiple customers (with relatively larger net payment obligations) are presumed to default at the same time across all six FCMs. If all customers with net losses anywhere in the 98th to the 99.5th percentiles at each of the six Contributing FCMs simultaneously fail to make their required payments, the total loss across all FCMs ranges from $8.0 billion to $13.4 billion.
Table 8(a): Stressed Customer Defaults and Potential Fellow-Customer Losses – Large FCMs
Month-End Date Contributing
FCM 99th Percentile Onlya Total 99th to 99.5th
Percentileb Total 98th to 99.5th
Percentilec
1/31/2012 Large 1 -$57,361,976 -$323,608,890 -$579,120,206 Large 2 -$386,058,672 -$5,663,405,203 -$9,988,105,055
2/29/2012 Large 1 -$68,432,831 -$398,696,743 -$636,237,676 Large 2 -$345,505,001 -$6,814,002,522 -$11,533,567,316
3/31/2012 Large 1 -$62,297,104 -$379,742,390 -$582,937,564 Large 2 -$425,025,323 -$6,835,365,845 -$11,677,331,363
4/30/2012 Large 1 -$16,951,630 -$145,916,314 -$251,123,139 Large 2 -$550,000,000 -$6,953,807,713 -$12,631,168,763
5/31/2012 Large 1 -$10,128,473 -$85,281,543 -$149,942,955 Large 2 -$381,893,385 -$5,163,919,638 -$10,469,149,744
6/30/2012 Large 1 -$19,577,964 -$136,682,899 -$244,639,853 Large 2 -$437,907,325 -$5,233,134,091 -$10,813,087,790
7/31/2012 Large 1 -$20,991,288 -$114,192,629 -$220,465,790 Large 2 -$324,505,001 -$4,506,401,006 -$8,266,467,524
8/31/2012 Large 1 -$11,830,327 -$131,547,518 -$192,527,092 Large 2 -$378,284,880 -$5,950,270,914 -$10,176,011,878
9/30/2012 Large 1 -$20,731,636 -$108,736,052 -$215,775,884 Large 2 -$359,822,725 -$5,406,941,462 -$9,608,736,187
10/31/2012 Large 1 -$25,040,581 -$137,456,346 -$275,140,236 Large 2 -$306,477,052 -$4,419,490,288 -$8,361,133,415
11/30/2012 Large 1 -$32,077,629 -$185,615,768 -$353,341,756 Large 2 -$293,677,434 -$4,370,845,472 -$7,815,050,665
12/31/2012 Large 1 -$23,387,029 -$141,145,414 -$270,326,907 Large 2 -$273,413,534 -$3,890,350,519 -$7,218,673,091
Max Loss: -$550,000,000 -$6,953,807,713 -$12,631,168,763 a: Default by the single FCM customer with a stressed loss equal to the 99th percentile ranked loss. b: Defaults by all FCM customers with stressed losses from 99th percentile through the 99.5th percentile ranked stressed losses. c: Defaults by all FCM customers with stressed losses from 98th percentile through the 99.5th percentile ranked stressed losses.
Page 42

Table 8(b): Stressed Customer Defaults and Potential Fellow-Customer Losses – Medium FCMs
Month-End Date Contributing
FCM 99th Percentile Onlya Total 99th to 99.5th
Percentileb Total 98th to 99.5th
Percentilec
1/31/2012 Medium 1 -$335,791 -$71,680,117 -$110,529,930 Medium 2 -$352,442 -$209,177,973 -$357,995,945
2/29/2012 Medium 1 -$379,286 -$79,089,013 -$124,629,787 Medium 2 -$389,200 -$228,130,500 -$395,829,428
3/31/2012 Medium 1 -$340,622 -$79,536,253 -$119,529,132 Medium 2 -$307,998 -$198,686,206 -$334,826,884
4/30/2012 Medium 1 -$280,153 -$63,009,068 -$96,987,960 Medium 2 -$326,056 -$199,113,195 -$337,847,130
5/31/2012 Medium 1 -$231,305 -$50,310,770 -$74,700,974 Medium 2 -$313,233 -$180,722,701 -$314,282,448
6/30/2012 Medium 1 -$377,427 -$76,200,494 -$120,972,890 Medium 2 -$310,094 -$182,129,992 -$316,998,949
7/31/2012 Medium 1 -$373,273 -$75,640,754 -$120,338,335 Medium 2 -$290,684 -$176,655,943 -$297,033,435
8/31/2012 Medium 1 -$323,524 -$68,883,147 -$107,482,197 Medium 2 -$357,634 -$203,918,639 -$354,430,881
9/30/2012 Medium 1 -$363,769 -$88,479,037 -$129,638,276 Medium 2 -$373,096 -$214,389,677 -$373,014,266
10/31/2012 Medium 1 -$389,752 -$85,529,017 -$125,551,843 Medium 2 -$386,147 -$213,588,490 -$371,803,206
11/30/2012 Medium 1 -$300,566 -$61,608,586 -$99,184,453 Medium 2 -$427,750 -$244,973,379 -$414,233,865
12/31/2012 Medium 1 -$235,139 -$52,572,152 -$80,434,020 Medium 2 -$368,915 -$209,342,945 -$348,083,692
Max Loss: -$427,750 -$244,973,379 -$414,233,865 a: Default by the single FCM customer with a stressed loss equal to the 99th percentile ranked loss. b: Defaults by all FCM customers with stressed losses from 99th percentile through the 99.5th percentile ranked stressed losses. c: Defaults by all FCM customers with stressed losses from 98th percentile through the 99.5th percentile ranked stressed losses.
Page 43

Table 8(c): Stressed Customer Defaults and Potential Fellow-Customer Losses – Small FCMs
Month-End Date Contributing
FCM 99th Percentile Onlya Total 99th to 99.5th
Percentileb Total 98th to 99.5th
Percentilec
1/31/2012 Small 1 n/ad n/ad n/ad Small 2 -$1,867,034 -$4,634,558 -$11,722,524
2/29/2012 Small 1 n/ad n/ad n/ad Small 2 -$2,395,903 -$5,520,411 -$14,287,360
3/31/2012 Small 1 n/ad n/ad n/ad Small 2 -$4,464,203 -$9,192,373 -$25,683,187
4/30/2012 Small 1 -$2,179,017 -$33,411,174 -$63,098,733 Small 2 -$3,175,138 -$7,208,620 -$18,926,603
5/31/2012 Small 1 -$1,354,013 -$24,418,268 -$45,340,460 Small 2 -$2,076,165 -$4,663,110 -$11,638,770
6/30/2012 Small 1 -$2,203,826 -$32,120,558 -$61,480,085 Small 2 -$2,937,472 -$6,660,975 -$17,189,885
7/31/2012 Small 1 -$2,235,883 -$34,137,525 -$65,681,943 Small 2 -$3,726,821 -$7,931,002 -$21,443,174
8/31/2012 Small 1 -$2,714,178 -$44,127,595 -$80,715,674 Small 2 -$3,293,095 -$8,234,512 -$21,816,003
9/30/2012 Small 1 -$3,329,957 -$59,452,520 -$111,761,612 Small 2 -$5,588,534 -$12,397,220 -$33,755,072
10/31/2012 Small 1 -$22,741 -$569,980 -$815,312 Small 2 -$332,608 -$994,810 -$1,893,017
11/30/2012 Small 1 -$1,670,498 -$27,934,742 -$52,019,148 Small 2 -$2,206,599 -$4,702,473 -$13,049,874
12/31/2012 Small 1 -$1,377,574 -$22,408,375 -$42,967,385 Small 2 -$1,885,632 -$4,152,230 -$12,222,952
Max Loss: -$5,588,534 -$59,452,520 -$111,761,612 a: Default by the single FCM customer with a stressed loss equal to the 99th percentile ranked loss. b: Defaults by all FCM customers with stressed losses from 99th percentile through the 99.5th percentile ranked stressed losses. c: Defaults by all FCM customers with stressed losses from 98th percentile through the 99.5th percentile ranked stressed losses. d: FCM “Small 1” only provided data from April 2012 through December 2012.
Page 44
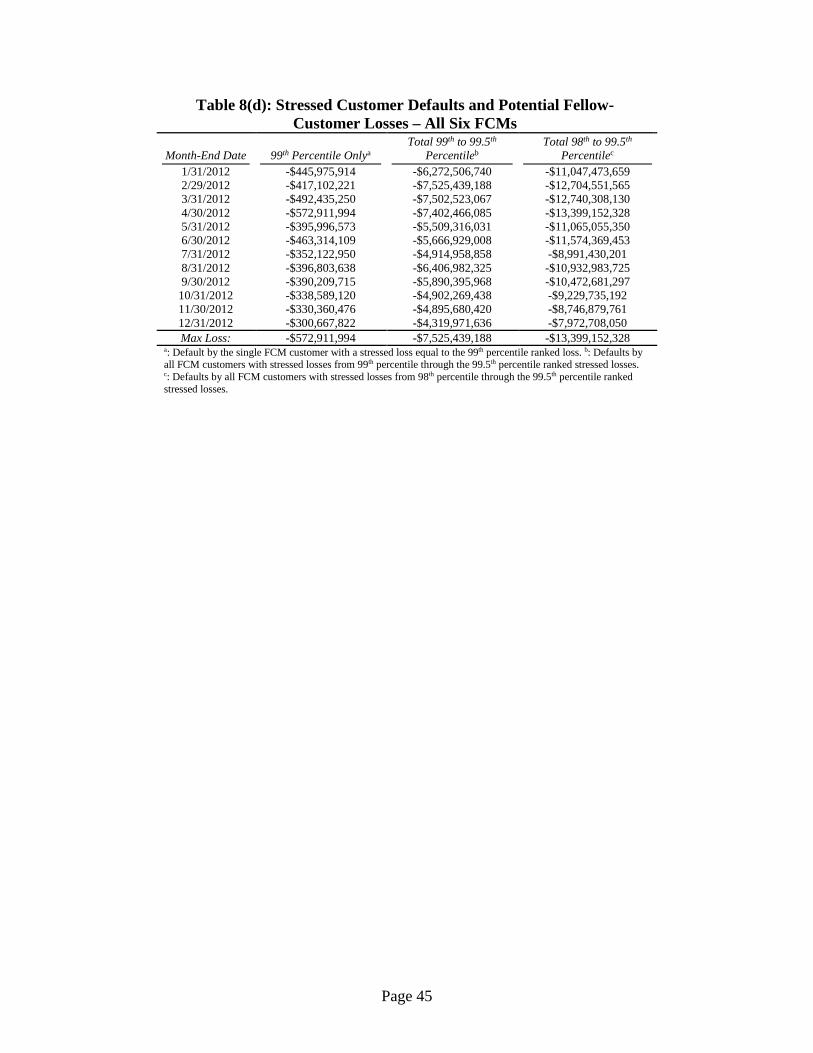
Table 8(d): Stressed Customer Defaults and Potential Fellow-Customer Losses – All Six FCMs
Month-End Date 99th Percentile Onlya Total 99th to 99.5th
Percentileb Total 98th to 99.5th
Percentilec 1/31/2012 -$445,975,914 -$6,272,506,740 -$11,047,473,659 2/29/2012 -$417,102,221 -$7,525,439,188 -$12,704,551,565 3/31/2012 -$492,435,250 -$7,502,523,067 -$12,740,308,130 4/30/2012 -$572,911,994 -$7,402,466,085 -$13,399,152,328 5/31/2012 -$395,996,573 -$5,509,316,031 -$11,065,055,350 6/30/2012 -$463,314,109 -$5,666,929,008 -$11,574,369,453 7/31/2012 -$352,122,950 -$4,914,958,858 -$8,991,430,201 8/31/2012 -$396,803,638 -$6,406,982,325 -$10,932,983,725 9/30/2012 -$390,209,715 -$5,890,395,968 -$10,472,681,297
10/31/2012 -$338,589,120 -$4,902,269,438 -$9,229,735,192 11/30/2012 -$330,360,476 -$4,895,680,420 -$8,746,879,761 12/31/2012 -$300,667,822 -$4,319,971,636 -$7,972,708,050 Max Loss: -$572,911,994 -$7,525,439,188 -$13,399,152,328
a: Default by the single FCM customer with a stressed loss equal to the 99th percentile ranked loss. b: Defaults by all FCM customers with stressed losses from 99th percentile through the 99.5th percentile ranked stressed losses. c: Defaults by all FCM customers with stressed losses from 98th percentile through the 99.5th percentile ranked stressed losses.
Page 45
PART 2: POTENTIAL PRIVATE, VOLUNTARY CAPI SOLUTIONS
VI. BENEFITS AND COSTS OF PRIVATE, VOLUNTARY CAPI Insurance is a contract in which one party pays a fee or price (the “premium”) to an insurance company for the right to receive compensation (the “benefit”) following the occurrence of a specific adverse event (known as the “triggering event”). Insurance exists because people and companies sometimes prefer to part with a relatively small amount money (i.e., pay insurance premiums) in order to receive a reimbursement for losses in the event something bad occurs.
A. Benefits vs. Costs of Insurance for Beneficiaries
The value of insurance to policy holders depends on how much the insurance protection costs. For competitively provided insurance policies, the premium can generally be viewed as the sum of two components: the insurer’s expected or average claim payment (or, equivalent, the amount of losses that the insurance purchaser expects to be reimbursed under the insurance policy), and the administrative and acquisitions costs to the insurer of providing the policy line (known as “premium loading” or just “load”).71
The most important component of the insurance premium (and the most difficult to estimate) is the expected loss on a policy or portfolio of policies. To estimate that expected loss, insurance companies use a variety of different approaches (actuarial, statistical, behavioral, etc.) based on the risks underlying the policy.72 The expected loss also depends on the total amount of coverage the insurance provides, which is highly sensitive to the policy limit and the size of the first-loss retention (or deductible).
In addition to including the estimated average benefit payment, the insurance premium includes load. Premium loading reflects administrative costs and expenses, the costs of reinsurance (which are estimated in a manner similar to the cost of insurance), and the cost of providing insurance-related services (e.g., loss adjustment expenses, underwriting and policy distribution expenses, due diligence costs, etc.), and the insurance company’s profit margin. Premium loading can account for 30 to 40 percent of the total premium – in some cases more for exotic or complicated policy lines and risks.
71 Some insurance premiums include a third component that reflects a mark-up added by the primary carrier to reflect a profit margin for the shareholders of the insurance company. 72 Note that “expected loss” in this context refers to the statistical or probabilistic use of the term “expected.” So, the expected annual loss for a reinsurer is equal to the annual probability of the occurrence of a loss multiplied by the amount the (re-)insurer will pay in claims if the loss event occurs. The (re-)insurer thus does not “expect” to incur this loss each year. For example, if a loss event is expected to occur in one of the next 500 years and the loss given a triggering event is $10 billion, the expected loss is $2 million. In other words, the average loss across 500 years is expected to be $2 million.
Page 46

The net benefit (i.e., expected benefit minus premium expenditure) to insurance purchasers thus depends on the insurance purchaser’s own expected loss potential vis-à-vis the expected loss estimated by the insurance carrier and reflected in the premium (together with load). For example, suppose a futures customer has $1 million in assets in §4d segregated funds at an FCM and believes that there is a 10 percent chance the FCM will become insolvent in the next year and that all of the customer’s assets will be lost. The “expected value” of CAPI to the customer thus would be $100,000 (i.e., $1 million at risk x 10 percent probability of loss). So, if the cost of insurance for that customer is exactly $100,000, the customer is essentially paying premiums that exactly cover the amount the customer expects to receive back from the insurance company on average. That ignores the premium loading, of course, which suggests that even “fairly priced” insurance might look like a bad decision for customers since they would be paying for exactly what they expect to receive back on average plus all of the costs of providing the insurance.
Yet, insurance can be valuable to individual customers in several situations. First, many purchasers of insurance are risk averse and place a value on the eradication of uncertainty. Such customers are willing to pay the additional cost of premium loading in order to eliminate the possibility of a catastrophic loss. In the example above, if the futures customer believes there is a 20 percent chance of losing its entire $1 million in assets following an FCM insolvency, the expected or average loss is $200,000. But the actual loss to the customer will either be zero (80 percent of the time) or $1 million (20 percent of the time). Risk-averse individuals thus are willing to pay more than $200,000 to insure against the 20 percent possibility of the $1 million loss. Similarly, corporations facing the possibility of financial ruin (and the associated costs of financial distress resulting from a large loss of assets on deposit with an FCM’s depository institution) also are willing to pay to eliminate the uncertainty of such “firm-killer” events.73
Second, an insurance purchaser might have different expectations about the risk of future insurable losses than the insurer. Specifically, if the insurance purchaser believes the probability of incurring a loss is higher than perceived by the insurance company, the insurance expenditure can make good economic sense. Continuing with the previous example, suppose the insurance company believes that $1 million in customer assets will be lost with a 10 percent probability but that the insurance customer expects to lose all $1 million of its assets with a 20 percent probability. In that case, the insurance premium (ignoring load) will be $100,000, but the expected value of the insurance to the beneficiary is $200,000. In that case, as long as the
73 For a more detailed discussion of these classic rationales for incurring costs to engage in risk transfer, see, e.g., N. A. Doherty and C. W. Smith, Jr., “Corporate Insurance Strategy: The Case of British Petroleum,” Journal of Applied Corporate Finance Vol. 6, No. 3 (Fall 1993), K. A. Froot, D. S. Scharfstein, and J. C. Stein, “Risk Management: Coordinating Investment and Financing Policies,” Journal of Finance Vol. 48, No. 5 (December 1993), D. Fite and P. Pfleiderer, “Should Firms Use Derivatives to Manage Risk?” In Risk Management: Problems & Solutions, W. H. Beaver and G. Parker, eds. (McGraw-Hill, Inc., 1995), R. M. Stulz, “Rethinking Risk Management,” Journal of Applied Corporate Finance Vol. 9, No. 3 (Fall 1996), C. L. Culp and M. H. Miller, eds., Corporate Hedging in Theory and Practice (Risk Books, 1999), and C. L. Culp, The Risk Management Process (John Wiley & Sons, 2001).
Page 47

premium loading does not exceed 100 percent of the expected loss, the customer will perceive to be paying less than the expected value of what it may receive back.74
B. Allocation of Costs for Private, Voluntary CAPI
In the previous section, we considered the relative benefit/cost tradeoff for the purchase of insurance by policy holders that are both the policy beneficiaries and paying their own premiums. But what if the policy beneficiaries do not have to bear the full cost of their insurance?
Suppose, for example, that FCMs are obliged in a mandated scheme to fund a CAPI provider. It is highly probable that FCMs would attempt to recover these costs in the form of higher fees. In a mandatory protection scheme, it would be essentially impossible for customers to avoid these higher costs – because all FCMs would be required to pay, all FCMs would likely raise fees proportionally – except by reducing their trading activity and assets in segregation.
In a voluntary scheme in which FCMs pay CAPI premiums on behalf of customers, one could imagine FCMs absorbing that cost as a competitive mechanism for attracting customers. Alternatively, FCMs would be free to pass along some of those costs and risk losing customers to other FCMs or to not opt in to the insurance program.
Similarly, in a voluntary scheme in which customers make actual premium payments, some FCMs might opt to help customers cover some or all of those costs (e.g., through a fee rebate) in an effort to attract new customer business.
C. Benefits and Costs for the U.S. Futures Industry
Apart from the benefit/cost tradeoff faced by individual insurance beneficiaries, another relevant consideration in the analysis of potential CAPI programs is the relative benefit/cost tradeoff for the U.S. futures industry itself (including customers, as well as DCOs, CPOs, CTAs, FCMs, IBs, and other market participants).
The main benefit that proponents of CAPI hope to achieve is the restoration of confidence in customer asset protection in U.S. futures markets. All else equal, if CAPI accomplishes that, the result would be a return of any disaffected customers and possibly the addition of new customer assets to U.S. futures markets. That, in turn, would lead to higher trading volume, and potentially greater liquidity, tighter markets, lower spreads and transactions costs, and greater revenues for financial intermediaries. In addition and importantly, to the extent the additional customer funds
74 The situation described here would be very atypical of insurance markets. Because (re-)insurance companies generally recognize that they cannot assess the true risks they are underwriting as well as the (re-)insurance beneficiaries that bear those risks, they tend to assume the worst about all potential (re-)insurance purchasers. Economists refer to this problem as “adverse selection,” and it often results in average premiums being charged that reflect (re-)insurance companies’ worst-case assumptions about risk even for (re-)insurance policy holders that might actually be relatively low risk. See, e.g., M. Rothschild and J. Stiglitz, “Equilibrium in Competitive Insurance Markets,” Quarterly Journal of Economics Vol. 90 (1976).
Page 48

are related to hedging activities, the benefits of added futures trading volume would extend to enhanced systemic stability, financial market integrity, and reduced financial fragility.
An additional potential benefit of CAPI – depending on how the program is structured – would be enhanced monitoring of FCMs for their customer risk-management practices. In any CAPI scheme in which industry market participants absorb the first-loss layer of losses (see Section VII.E), the industry-backed insurer would have a strong incentive to dictate minimum risk-management and monitoring requirements to participants and to work alongside DSROs (and the CFTC) to enforce compliance with those requirements.
Skeptics of CAPI, however, worry that the additional costs that CAPI would add to futures trading activities could actually work in the opposite direction. Specifically, if individual customers and FCMs do not perceive the benefits of CAPI to justify the costs, the result could be a reduction of customer assets within the U.S. futures industry, reduced trading volumes and liquidity, higher spreads, and less stable markets.
VII. BACKGROUND ON POTENTIAL PRIVATE, VOLUNTARY CAPI ALTERNATIVES
In this section, we consider the range of alternatives that private, voluntary CAPI might realistically encompass. The possibilities and variations are essentially unlimited, and our goal is neither to be exhaustive nor to second-guess potential market innovations that might arise in the future in response to demand for CAPI. Instead, we review here the various aspects of CAPI based on our discussions with various market participants in the insurance, reinsurance, and brokerage communities during the course of this study.
Because the purpose of any customer protection scheme is to protect customer funds, we do not consider any insurance or protection mechanism for non-customer-segregated accounts and funds (e.g., house trading accounts). In addition, we limit our discussion and analysis to customer protection products involving only exchange-traded futures and options on futures. We do not consider protection schemes for customer funds related to cleared swap transactions.
A. The Basics of Insurance
Although different (re-)insurance providers might offer a range of possible policies, we consider it likely that CAPI would be provided either as credit (re-)insurance or as a financial surety. For our purposes in this study, we focus on the potential provision of “indemnity” credit (re-)insurance.
An indemnity insurance contract pays a value to the beneficiary of the insurance policy that is proportional to the economic loss incurred by the insured party.75 A small loss thus results in a
75 Not all insurance contracts are indemnity contracts. In a “valued” insurance contract, for example, the benefit payable to the policy holder upon occurrence of the trigger event is not proportional to actual losses sustained by the insured but rather is fixed and specified at the beginning of the life of the policy. Valued insurance is popular for
Page 49

small payment, whereas a large loss results in a large payment, subject to the important constraint that the insured cannot recover more on the insurance contract than the actual economic damage sustained.
Insurance providers cannot accurately observe the actions of insureds without incurring significant costs. As such, insurance can give rise to “moral hazard” – i.e., insurance purchasers engage in less effective risk management and mitigation because they know they are insured. Indemnity insurance contracts include contractual provisions intended to mitigate such problems. Three specific contractual provisions often included in indemnity insurance contracts are designed to ensure that insurance purchasers retain sufficient exposure to losses that they have sufficient incentives to manage their risks.
• Deductibles/First-Loss Retentions: Virtually all insurance policies with the exception of certain Directors’ and Officers’ (“D&O”) insurance require the insurance purchaser to absorb some amount of the “first-loss” layer of the insured risk. The insurance benefit thus does not cover losses in that first-loss layer, which encourages insurance purchasers to manage their risks responsibly. In primary insurance markets, the first-loss layer retained by insurance purchasers is commonly known as the “deductible” on the insurance policy.
• Policy Limits: Indemnity policies also include policy limits that define the maximum amount of the benefit payable under the policy. If the risk exposure exceeds this policy limit, insurance purchasers have an added incentive to be attentive to risk management.
In addition to limitations on coverage, typical indemnity insurance contracts also include other features intended to mitigate moral hazard. In particular, three such features are as follows:
• Annual Policy Tenors: Virtually all insurance policies have a fixed coverage period of one year. The relatively short coverage period gives insurance companies the flexibility to re-assess the risk and claims experience of customers and to revise their premium quotations on an annual basis.
• Representations and Warranties: Important mitigants to moral hazard and fraud in private insurance markets are the inclusions of representations and warranties in the policy contract itself. Misrepresentation of a fact by an insurance purchaser is in most jurisdictions grounds for nullification of the contract (even if the misrepresentation is immaterial).
• Due Diligence: Especially for relatively large programs, insurance companies undertake due diligence analyses to assess the risks in the program directly. The outcome of the due diligence process may affect the structure of the insurance contract (e.g., first-loss retention, policy limit, and specific exclusions from the policy).
• Loss Adjustment: Because indemnity contracts pay benefits in proportion to the amount of the loss sustained, they are subject to a “loss adjustment” process. After the triggering event
losses that are difficult to measure and assess (e.g., term life insurance and property insurance for hard-to-value art work). Because the losses to be covered by CAPI are losses of funds and assets, a valued insurance contract makes little sense and we do not consider it in this analysis.
Page 50

occurs and the insurance purchaser sustains losses, the purchaser files a claim. The loss adjustment process is the method by which the insurance provider assesses the validity of the claim and the amount of the reported loss. The foreknowledge that any claim is subject to loss adjustment helps discourage moral hazard, as well as fraud and over-statements of damages in the filing of insurance claims.
• Co-Insurance: Some indemnity insurance contracts require the insured to bear a fraction of every dollar loss above the deductible and up to the policy limit. Known as co-insurance, such provisions might specify, for example, that the insurance reimburses the insurance purchaser for only 90 percent of the losses above the deductible and up to the policy limit. Bearing the costs of 10 percent of the insurable loss increases the incentives for the insured parties to manage their own risks responsibly.
B. The (Re-)Insurance Trigger and Indemnified Losses
(Re-)insurance contracts include the specification of one or more triggering events that can give rise to insurable losses and subsequent claims. We consider two possible triggering events, both of which require the failure of an FCM as evidenced by the filing of a bankruptcy petition, the declaration by a DCO that a clearing FCM is in default, or some other appropriate and objective indicator of a failure by a clearing or non-clearing FCM. Specifically, the two possible triggers of CAPI in the event of an FCM default (and the associated indemnified losses) are under-segregation losses arising from misfeasance or malfeasance or from fellow-customer losses as described in Sections III.A and III.B, respectively.
The occurrence of the triggering event, the economic realization of any resulting losses, and the filing of a CAPI claim will usually occur several months before any CAPI provider makes a final determination regarding the indemnified loss amount payable to CAPI purchases. During that loss adjustment process, some sources of short-term financing may be available to provide customers with temporary liquidity during the loss adjustment period – see Section VIII.E.
In the case of fellow-customer risk, part of the loss adjustment process involves the identification of customers that have unpaid obligations to the FCM that they can pay but have chosen not to as opposed to customers with unpaid obligations to the FCM that they cannot pay (which presumably were the unpaid obligations that caused the FCM to default). Specifically, our discussions with various market participants have indicated that many customers facing a variation margin call (i.e., request to deposit additional funds to cover trading losses from the current trading session in excess of assets already on deposit) from an FCM that has been declared in default might choose not to make their required payment to the FCM, preferring instead to wait for the ultimate determination of what is owed by the Bankruptcy Trustee. CAPI is not, however, intended to cover market risk-related losses by customers who can pay what they owe but choose not to do so. Rather, CAPI is intended to cover losses arising from customers who cannot pay what they owe. So, we do not consider a decision by a customer to delay a payment to be synonymous with non-payment – i.e., if a customer waits to pay but eventually does pay, the assets provided by that customer reduce the losses of non-defaulting customers with positive asset balances and should not be considered as part of the insurable customer assets at risk. We thus only consider losses to non-defaulting customers resulting from
Page 51

the actual and final failure of customers to pay as determined by the outcome of a bankruptcy proceeding and the insurance loss adjustment process.
C. The Insurance Beneficiaries
A beneficiary is an individual or organization that is indemnified under an insurance contract. We consider exclusively the case in which the CAPI beneficiaries are the individual futures customers that purchase coverage or that are covered by their FCMs. We do not consider schemes like the U.S. Federal Deposit Insurance Corporation that provide protection on a per-account basis, and instead restrict our attention to customer beneficiaries where any deductible and/or policy limit is applied across all eligible accounts owned by the same customer. Although individual customers are always the policy beneficiaries of CAPI as contemplated in this study, there are essentially two different ways that individual customers might be covered by CAPI in voluntary, opt-in schemes.
First, CAPI might be provided to customers directly and individually by CAPI providers. In such a scenario, all U.S. futures market customers would have the opportunity to purchase CAPI on an individual basis. Similarly, premiums for CAPI coverage would be paid directly by customers.
Second, customers of certain specific FCMs could have access to CAPI. For example, FCMs could choose on a firm-by-firm basis whether or not to purchase CAPI on behalf of some or all of their customers. The participating customers of FCMs opting to purchase CAPI protection would be named as the CAPI policy beneficiaries to ensure that insurance payments remain outside the bankruptcy process and go directly to the customers of the defaulting FCM. FCMs likely would pay the premium for the CAPI coverage and then recover some or all of those costs through additional fees allocated to participating customers.76
In addition to FCM-by-FCM purchases of CAPI on behalf of their customers, CAPI could also be available to customers of groups of FCMs that join together to provide CAPI (see, e.g., Sections VII.D.3), to customers of FCMs at a specific DCO, or to any of many other possible insurance alliances that U.S. futures market participants might wish to form in order to give their customers access to CAPI.
D. Potential CAPI Underwriters
(1) Primary Insurance Carriers CAPI could in principle be provided to customers directly or to groups of customers at specific FCMs by private insurance companies. Such insurance companies could include both U.S. and international private insurance carriers. A primary insurance carrier is a licensed and regulated insurance company that provides insurance to individuals and/or corporations.
Although some primary carriers specialize and provide only a few types of coverage, most large primary carriers offer a comprehensive array of property and casualty (“P&C”) insurance lines.
76 We understand that customers would have to pay some fee for the CAPI protection in order to secure their rights as beneficiaries in the event of the FCM's insolvency.
Page 52

The largest U.S. primary P&C insurance companies include Allstate Insurance Group, American International Group (“AIG”), Berkshire Hathaway Insurance (including GEICO), Farmers Insurance Group, Liberty Mutual Insurance Companies, Nationwide Group, Progressive Insurance Group, State Farm Group, Travelers Group, and USAA Group.
(2) Captives A multi-parent captive is a special-purpose insurance company owned by multiple companies (called “sponsors”) that also buy insurance from the captive on their own behalf or on behalf of specific beneficiaries. In a typical multi-parent captive, the owners/sponsors make some prescribed capital contribution to the captive. Those contributions (along with premiums paid by customers) are invested in low-risk interest-bearing assets. Any claims submitted to the captive are paid by the captive from its capital and any invested premium (including investment income on the invested premium and capital contributions).
Most multi-parent captives in the United States are formed as Risk Retention Groups (“RRGs”) under the Risk Retention Act of 1986. RRGs are exempt from the various state-specific requirements that can prohibit the formation of multi-parent captives, provided that RRGs do not provide workers’ compensation coverage. Nevertheless, we do not distinguish in this study between multi-parent captives and RRGs and instead henceforth refer to both simply as “captives.”
One or more captives could play an important role in a CAPI scheme. In particular, an industry captive could be the direct provider of insurance (or as the 100 percent reinsurer of a fronting insurance carrier) to customers and could cover a portion of its risks with reinsurance. For example, Exhibit 8 illustrates an industry “FCM Captive” that provides CAPI coverage to customers of FCMs (henceforth, “Participating FCMs”) through a fronting protection seller and reinsures at least some of that risk through the retrocession market.
Exhibit 8: Industry FCM Captive
Page 53

An FCM Captive might allow the customers of all Participating FCMs (or other market participants, such as IBs and CPOs as proposed by the Commodity Customer Coalition (“CCC”) – see Section VIII.D.1) access to the CAPI product. Alternatively, Participating FCMs might permit their customers to opt-in to CAPI coverage on a voluntary basis.
The governing body of the FCM Captive would presumably define any eligibility requirements. Importantly, an FCM Captive would be able to define criteria for which FCMs (and their customers) could participate in the protection scheme. This would presumably include the specification of minimum risk-management requirements and perhaps risk monitoring of participating FCMs. A first-loss retention by an FCM Captive thus could enhance risk management and risk monitoring, which would be beneficial from an industry perspective and would likely reduce reinsurance costs by aligning the incentives properly between the FCM Captive and its reinsurers.
An FCM Captive also would be more capital-efficient for participants than if individual customers and/or FCMs retained some first-loss exposure individually. In the case of a multi-sponsor FCM Captive, the triggering event likely would not be perfectly correlated – i.e., all participating FCMs would not likely experience insolvencies at the same time. All else equal, reinsurers thus would demand less retention to cover a more diversified pool of risks (or, alternatively, would demand a similar first-loss retention but offer a higher maximum total policy limit and/or a lower rate on line).77 A multi-parent captive or FCM Captive also probably would not need to pre-fund the entire retained first-loss layer. With multiple sponsors, some portion of the retained first-loss layer could be funded instead through post-loss assessments on sponsors or alternative risk-finance facilities as discussed in Section VII.E.
As with any mutualized insurance pool, FCMs would assume the risk for losses in the first layer that may arise from customers that they themselves do not monitor, oversee, and review. Participating FCMs thus would be required to rely on the customer risk-management processes of other owner-participants of the FCM Captive that are sources of the risks that they do not directly observe or monitor. FCMs with more advanced customer risk management systems and customers with lower amounts of capital at risk thus may become concerned that they are cross-subsidizing less-sophisticated FCMs with higher-risk customers (especially when focusing on the scenario in which fellow-customer risk is the insurance trigger). On the other hand, because the FCMs would experience losses in the retained risk layer on a mutualized basis, the FCM Captive would have a strong incentive to encourage participating FCMs to adopt responsible risk-management and customer surveillance processes and to deny entry into the FCM Captive to FCMs that fail to do so.
Other complications are likely to arise. Consider just a few of the additional questions and issues:
• Who would determine whether or not an FCM interested in bringing its capital and customer pool into the FCM Captive should be rejected for participation?
77 Rate on line is an expression of the cost of insurance coverage to the policy holder relative to the benefit. Specifically, the rate on line is equal to the reinsurance premium divided by the reinsurance policy coverage limit, expressed as a percentage.
Page 54

• What kind of interest group and political economy considerations would affect the governance and operation of the industry FCM Captive?
• When is an FCM Captive “too small” and inadequately diversified to be an efficient risk-pooling entity? And when is an FCM Captive “so big” that its sponsors have significant disagreements and conflicts of interest?
• Would an FCM Captive composed of specific commodity co-operatives (e.g., Metals or Agriculturals) be exposed to industry-wide catastrophic risks that may eliminate any potential correlation benefits and thus increase risks to the FCM Captive?
• Is there any reason to restrict FCM Captive ownership to FCMs, or should other entities (e.g., CPOs, CTAs, and IBs) also be invited to participate (e.g., as envisioned in the CCC Proposal as discussed in Section VIII.D.1)?
• Would anti-trust and competitiveness considerations influence the size and number of potential competing industry FCM Captives?
The above issues would be addressed through the actual negotiations between the FCMs participating in an FCM Captive and its reinsurers.
E. The First-Loss Retention
The first-loss retention refers to the amount of losses that are borne by insurance purchasers and/or beneficiaries before any insurance or reinsurance payments are triggered. In traditional primary insurance markets, the first-loss retention is synonymous with a policy deductible that permits insureds to file claims for reimbursement only when their indemnified losses exceed the pre-specified deductible threshold. (See Section VII.A.) Two important issues concerning first-loss retentions regularly arise in commercial insurance: (i) What person(s) or firm(s) bear the first-loss risk exposure to potential losses? and, (ii) Is the first-loss retention “funded” or “unfunded”?
(1) Retention of the First-Loss Risk Layer In virtually all types of P&C insurance, the amount of the first-loss retention is viewed by (re-)insurance companies as a crucial mechanism for mitigating moral hazard. To align the incentives of insurance purchasers with insurance companies (or reinsurance purchasers with reinsurers), underwriters virtually always insist that (re-)insurance purchasers and/or beneficiaries have some “skin in the game.” In other words, as discussed in Section VII.A, (re-)insurance purchasers should still be subject to the risk of some loss, and the (re-)insurance itself should not attenuate that exposure so significantly as to dull the risk-management incentives of (re-)insurance purchasers or beneficiaries.
In addition to mitigating moral hazard, (re-)insurance companies also typically dislike underwriting high-frequency, low-severity losses because they perceive such losses as arising from “normal-course-of-business” risks about which insurance purchasers are much better informed than the insurance providers. Such losses generally occur in the first-loss layer. For this additional reason, (re-)insurance companies (especially in the commercial P&C area) are
Page 55

typically reluctant to underwrite high-frequency, low-severity losses, and, if they do, charge significant additional premiums for such coverage.78
CAPI is highly unlikely to be an exception to these basic tenets of commercial (re-)insurance. Accordingly, few (if any) private (re-)insurers will agree to bear the first-loss exposure to any indemnified losses and claims arising from CAPI. Instead, the first-loss layer arising from the failure of an under-segregated FCM and giving rise to eligible CAPI claims will have be retained or borne by individual customer beneficiaries of CAPI policies, the FCMs of those customers, or some other futures market participant. We discuss this issue in more detail in Section VIII.
(2) Funded vs. Unfunded First-Loss Retention A “funded” first-loss layer refers to a first-loss retention in which the person(s) or firm(s) exposed to losses in that first-loss layer have pre-funded such losses. In other words, a funded first-loss retention refers to a situation in which money has been set aside to finance any claims in that first-loss layer before the actual loss occurs. In an “unfunded” first-loss layer, by contrast, the funds to cover any losses in the first-loss layer have not been set aside to cover claims arising from such losses before any of those losses are realized.
In most traditional personal insurance lines, the first-loss layer is unfunded and is in the form of a deductible. For example, in a health insurance policy that covers up to $1,000,000 in medical expenses with a $5,000 deductible, most insurance purchasers do not set aside and pre-fund the possible $5,000 in first-loss medical expenses that they may occur before their insurance policies begin to reimburse their expenses and losses.
Individuals that opt to create a Health Savings Account (“HSA”), however, are essentially creating a funded first-loss layer. In the above example, the health insurance purchaser might deposit $5,000 in a HSA to cover up to her first $5,000 in future medical expenses. Indemnified health expenses from $5,001 up to $1,000,000 would be covered by insurance, but, unlike the unfunded example, the health insurance purchaser with $5,000 in her HSA would already have set aside and funded her retained first-loss layer.
As discussed later in Section IX.C, the first-loss layer of certain private, voluntary CAPI programs may be either unfunded or funded.
F. Policy Limits
Another important consideration in the potential offerings of CAPI is the policy limit (i.e., the maximum potential insurance benefit payable, less any deductible) available to customers as policy beneficiaries. Several possibilities can be envisioned, which are discussed below.
78 Corporations often “self-insure” high-frequency low-severity losses because their own cost of capital (in that working capital layer) is cheaper than the cost of insurance for normal-course-of-business losses. See Culp (2006), op. cit.
Page 56

(1) Fixed Policy Limits CAPI could have a single policy limit applicable to all customers regardless of their size, futures trading objectives, and amounts of assets on deposit. For example, a $250,000 fixed per-customer limit for CAPI coverage would be akin to Securities Investor Protection Corporation (“SIPC”) policy limits for cash. (SIPC limits are $250,000 for cash and $500,000 per customer for securities.)
Depending on the amount of the policy limit, however, a “one-size-fits-all” approach could introduce significant potential problems. If the limit is set too high, it could give rise to moral hazard amongst customers in selecting their FCMs. But if the limit is set too low, then large customers likely will consider CAPI to be of little or no real value.
Another possibility is, of course, that each customer could choose their own policy limit flexibly, thereby allowing them to purchase as much coverage as they wish (with corresponding impacts on the deductibles and premiums for those customers). Although appealing in principle, a fully flexible array of fixed policy limits – especially given the diversity of customer types and risk exposures in U.S. futures markets – could unduly tax the underwriting divisions of the insurance provider(s), thereby resulting in higher underwriting costs, a higher premium loading, and a higher cost paid by purchasers of the insurance policies. A natural choice for CAPI providers would be to provide two or three different policy limits designed to target customers within different size categories (where size is defined as amount of customer assets on deposit with FCMs).
(2) Aggregate Facility Limits and “Inner Limits” In the particular case in which CAPI is provided by a special-purpose insurance company like an industry captive or mutual, the structure of the program’s policy limits likely would involve an aggregate facility limit as well as an aggregate first-loss retention by the captive or mutual. Specifically, suppose that an FCM-owned captive seeks $250 million of reinsurance and that a reinsurer or syndicate is willing to provide that coverage for all indemnified CAPI claims in excess of the first $50 million of losses. In that situation and assuming the $50 million first-loss layer is fully funded, $300 million in claims-paying resources would be available for the captive to finance up to $300 million in indemnified customer asset losses. Any losses arising from indemnified under-segregation risks of customers of all participating FCMs thus would be payable up to $300 million. So, an aggregate policy limit means that payments to customers for claims up to $300 million could arise as a result of numerous small losses across one or more FCMs, large losses from the failure of a single FCM, or even large losses from one single customer at one FCM that imposes fellow-customer losses high enough to reach the policy limit.
Under this structure, FCM customers still would be exposed to some form of fellow-customer risk – now, fellow-insured-customer risk. Unlike fellow-customer risk at the FCM level, fellow-insured-customer risk exposes the customers of one FCM to a more diversified portfolio of risks involving customers of the other FCMs participating in the FCM Captive. As long as the probability of all FCMs in the FCM Captive experiencing catastrophic under-segregation and/or
Page 57

fellow-customer losses at the same time is relatively low, the aggregate first-loss retention leads to greater risk diversification and risk-sharing and a more efficient utilization of capital.79
Programs with aggregate policy limits (and first-loss retentions) may also include “inner limits.” In the context of the FCM Captive, an inner limit is a restriction on the total amount of claims that can be recovered by any one specific Participating FCM. For example, in the program described above, the $300 million total coverage (including a $50 million first-loss retention by the captive and $250 million of reinsurance in excess of the first $50 million of losses) might be accompanied by a $200 million per-FCM inner limit. In that case, the funds available to cover customer asset losses arising from the failure of a single under-segregated FCM that is a sponsor of the captive would be limited to $200 million, thereby leaving $100 million in capital available to cover the failure of a second FCM during the same policy year.
All else equal, the inclusion of inner limits in a program with an aggregate risk retention policy reduces the benefit and value of the coverage to participants in the program. Nevertheless, reinsurers frequently demand such inner limits as a precondition of underwriting coverage.
VIII. SPECIFIC PRIVATE, VOLUNTARY CAPI SCENARIOS To facilitate consistent comparisons of both costs and structures, we defined several different CAPI scenarios, and, as is discussed in Section IX.A, we analyzed and provided data on these scenarios to prospective (re-)insurance market participants. Although we realize that insurance and reinsurance companies will engage in their own loss analysis in lieu of relying upon the analyses we provided before actually underwriting the (re-)insurance, some basic (and common) universe of data was necessary in order to facilitate the provision of cost estimates across the same or very similar contemplated structures. As such, the definition of specific scenarios was required in order to provide the necessary empirical analyses to prospective CAPI providers. In this section, we explain the three specific private, voluntary CAPI scenarios that we considered and for which we attempted to calculate potential costs for U.S. futures customers, FCMs, and the industry in general.80
A. Scenario #1: CAPI Provided Directly to Individual Customers
CAPI might be provided directly to individual customers (regardless of whether there assets are located at one or more FCMs) by primary insurance companies. In this scenario, the CAPI either would be provided directly to end customers by one or more primary carriers, or by one or more fronting primary carriers offering to provide individual customers with access to reinsurance markets through their fronting coverage offerings.
In most insurance products, the first-loss exposure is retained by the insurance beneficiary because the insurance beneficiary generally controls its risk exposure and chooses the relevant
79 See, e.g., C. L. Culp, Structured Finance and Insurance (John Wiley & Sons, 2006), Chapters 23 and 25. 80 Recent interest may be attributable to the increased demand for CAPI arising from heightened awareness of customers to their risks as a result of MF Global and Peregrine Financial, the enhanced customer protections put in place by market participants and the CFTC (thereby reducing risks for (re-)insurers, all else equal), or both.
Page 58

risk-management solutions. In the context of CAPI, customer retentions of first-loss layers are equivalent to the inclusion of deductibles in customer CAPI policies.
Forcing customers to bear the cost of a first-loss retained risk layer, however, makes little sense in the context of CAPI. The main risks that CAPI is intended to cover – i.e., under-segregation risks arising from misfeasance or malfeasance and fellow-customer risk – involve the loss of customer assets following an FCM’s failure. In the misfeasance and malfeasance situation, the FCM has engaged in fraud, embezzlement, unauthorized conversions of customer funds, and the like. In the fellow-customer loss situation, the FCM might not have engaged in appropriate customer-level risk management, monitoring, and surveillance. In both cases, the FCM’s failure and the resulting losses are not directly under the control of the FCM’s customers. As such, forcing the customers of the FCM to bear the first-loss layer is unlikely to have a direct impact on actual customer asset risk profiles. Nevertheless, CAPI provided to customers with no deductible and first-loss retention will dull customers’ sensitivities to the risk-management practices of their FCMs and likely will reduce customers’ incentives to engage in costly information gathering about their FCMs.
In addition to the reluctance of insurers to provide CAPI with customer-level deductibles and no first-loss retention by FCMs, the customers most likely to benefit from CAPI also are likely to consider a customer-level deductible unpalatable. Our discussions with several organizations that represent commercial end users of futures indicated that CAPI in which customers bear a first-loss risk would be viewed as significantly less valuable than CAPI in which FCMs retained a first-loss exposure instead.
Based on our discussions with various (re-)insurance market participants, we ascertained virtually no commercial interest in the provision of CAPI to end customers independently of their FCMs (or other intermediaries like CTAs and IBs). Although it is possible that some individual primary carrier(s) would consider underwriting customer-direct CAPI, our inability to identify any such interest caused us to exclude this scenario from further analysis.
B. Scenario #2: CAPI Provided to Customers of Individual FCMs
A second scenario might involve one or more specific FCMs purchasing CAPI coverage on behalf of all of their customers.81 In principle, FCM-specific purchases of insurance on behalf of customers could be a valuable dimension along which FCMs could compete for business. Those customers who value CAPI and are willing to pay what the FCM wants to charge for it might view FCMs providing CAPI more favorably than an otherwise-similar FCM not willing to offer such coverage. Similarly, by offering CAPI to its customers, Small FCMs may be better able to compete with larger FCMs, which may appeal to some customers that view those Large FCMs as “too big to fail” or, at least, less relatively less likely to fail at a time when assets are under-segregated.
In order to avoid problems associated with bankruptcy laws, the purchase of CAPI by an FCM would have to be properly constructed and documented. In particular, the FCM would have to
81 We did not consider the possibility that customers of the FCM would be able to opt in to the program. Offering customers opt-in rights would make the FCM-specific program extremely difficult to size.
Page 59

name its customers as the policy beneficiaries, and pay at least some of the policy premium (presumably recovering at least some of that expenditure from customers through higher fees). Also, claims payments to customers would need to be direct from the insurer to the customers and could not flow through the estate of the bankrupt FCM. Otherwise, the claims payments could become part of the estate and available as potential resources for all of the estate’s creditors rather than as earmarked payments to specific customers for their indemnified losses.
A more problematic aspect of FCM-specific CAPI programs, however, is the first-loss retention. Many FCM customers might find it unpalatable to have a deductible (or a first-loss retention layer from the insurer’s perspective). As such, the FCM might instead retain the first-loss exposure as the sum of all customers’ deductibles. Yet, because the failure of the FCM is a trigger on the CAPI, any first-loss exposure retained by the FCM would need to be fully funded (see Section VII.E.2) in order to be credible.
For example, if a sole FCM wishes to provide $250,000 of CAPI to all of its 1,000 customers, the FCM would want to buy a total of $250 million in insurance with its customers as the named beneficiaries. Suppose an insurer agreed to provide $200 million in coverage in excess of a $50 million first-loss retention or deductible. The CAPI only would be triggered when the FCM fails, however, in which case the FCM would not have unencumbered access to the funds it would need to pay the first $50 million in customer CAPI claims. So, for this scheme to work, the FCM would have to pre-fund the $50 million deductible in a manner that insulates those funds from the general assets of the bankrupt estate so that the $50 million is available solely to fund the first $50 million in CAPI payments (with the insurance covering the next $200 million in CAPI claims). It is possible to do this, but most (re-)insurance market participants with whom we spoke viewed such alternatives as cumbersome, unlikely to be profitable on an FCM-by-FCM basis, and, hence, unattractive.
In addition to the administrative expenses of this scenario, its feasibility depends heavily on the availability of surplus capital at the FCM considering sponsoring a program of this sort and on the willingness of an insurance company or reinsurer to underwrite the risk. Apart from the fact that the underwriting risk is undiversified in the sense that all potential customer claims are dependent on the same triggering event – i.e., the failure of the FCM with either an under-segregation loss or fellow-customer loss – a program of this sort also would be complicated. Underwriters would likely find it difficult to assess the risk of individual customers in sufficient detail to get comfortable with deductibles, policy limits, and first-loss retentions and to set premiums.82 And underwriters would be required to undertake such analyses for each interested FCM separately. Unless underwriters anticipate a fairly large number of interested FCMs, most such underwriters will not want to invest in the product line.
For these reasons and perhaps others, we received limited interest from underwriters in providing us with cost estimates for CAPI on an FCM-specific basis. Some (re-)insurers may be willing to
82 This is true in all scenarios. For the FCM Captive discussed in Sections VII.D.2 and VIII.C.1, however, the FCM Captive has better diversification across FCMs, which makes risk estimation more realistic and only requires one risk assessment on the FCM Captive itself.
Page 60

underwrite CAPI on an FCM-specific basis, but we did not encounter any such interest for the purpose of completing this study and therefore do not analyze this scenario further.
C. Scenario #3: CAPI Provided to Individual Customers Through a Captive or Mutual
In a third scenario, CAPI could be provided to certain customers through a special-purpose insurance company, as defined in Section VII.D.2. For example, two or more FCMs could form a captive insurance company for the specific purpose of providing CAPI to the customers of those participating FCMs. Alternatively, groups of customers themselves could form a mutual insurance company in which the customers are both the owners of the special-purpose insurance entity and its CAPI policy beneficiaries. In both situations, reinsurance would provide the primary source of funds to cover customers’ CAPI claims following the failure of an under-segregated FCM.
(1) FCM Captive To make this scenario explicit for reinsurers, we asked them to assume certain characteristics of the industry captive seeking reinsurance capacity. These characteristics are as follows:
• The FCM Captive is a licensed and regulated insurance company. • The nominal owners of the FCM Captive are the Participating FCMs. Participating FCMs
would make contributions of paid-in capital at the time of their FCM Captive share purchases. FCMs would be unable to withdraw any of their paid-in capital except on or around the annual anniversary and renewal date of the FCM Captive’s reinsurance program. Even at that time, FCMs wishing to continue participating in the FCM Captive would only be eligible to withdraw capital subject to an ongoing minimum capital requirement. Any capital contributions would be invested in low-risk assets.
• The FCM Captive would have an appropriate governance framework that would articulate and enforce minimum participation requirements for Participating FCMs. Those requirements would include requirements for Participating FCMs to maintain minimum risk-management and risk-control practices involving customer and fellow-customer risk, operational risk, and the like.
• Customers of Participating FCMs would be obliged to purchase CAPI from the FCM Captive.83 The FCM Captive, in consultation with its reinsurers and manager, would determine the exact terms for the coverage to be provided.
• Customers would be required to pay insurance premiums directly to the FCM Captive. • Reinsurance premium expenses and operating expenses would be financed by premiums
received from CAPI purchasers. • The FCM Captive would contract with a facility manager to manage the administrative and
operational aspects of the program.
83 It is possible, of course, that Participating FCMs could offer each of their customers the opportunity to purchase or opt out of CAPI. For simplicity and concreteness, however, we assume all customers of Participating FCMs would be obliged to participate in the CAPI scheme provided by the FCM Captive of which the Participating FCM is a sponsor.
Page 61

• The FCM Captive would be a limited-liability enterprise. Maximum losses and claims payments would be strictly limited by the FCM Captive’s financial resources (including hard assets and reinsurance). The FCM Captive and customers buying CAPI from the FCM Captive thus would not face any ongoing credit risk exposure to FCMs participating in the FCM Captive (except through the risk of the FCMs’ insured customers).
The most important information required by potential reinsurers for the industry captive scenario is the amount of risk that the Participating FCMs and/or customers would need to retain as a first-loss layer to secure reinsurance coverage. As is the case with virtually all insurance, the lower the first-loss retention or deductible, the higher the premium. Conversely, larger first-lost retentions are commensurate with lower premiums (and greater reinsurance capacity).
(2) Customer Mutual To ensure that the enterprise gains critical mass across a large number of customers it is likely that a coalition of market participants would need to kick-start and shepherd the process along. In addition, a sufficient number of customers across different FCMs would need to participate to create a sufficiently diversified risk portfolio and raise an adequate amount of capital.
In our discussion with various market participants, we did not identify sufficient interest in a customer mutual for CAPI to pursue this scenario. Nevertheless, the basic economics of the captive scenario is similar to the customer mutual scenario, especially with respect to the cost and availability of reinsurance in excess of a defined first-loss retention. As such, the loss exposure information and cost estimates we discuss later for the FCM Captive scenario should be essentially the same as a customer mutual. We thus do not discuss the customer mutual as a separate scenario in the remainder of this report.
D. Other Scenarios
In addition to the three scenarios outlined in the foregoing sections, we also identified in the course of our work several other potential scenarios for the provision of private, voluntary CAPI or CAPI-like protections. We did not explicitly solicit and did not receive cost estimates for these scenarios, and, as such, do not discuss them in any detail later. Nevertheless, these other scenarios all indicate that there is a potentially viable private market for the voluntary provision of CAPI to customers of U.S. FCMs.
(1) CCC/CIC The CCC has proposed a voluntary customer asset protection insurance program to be provided by the Commodity Insurance Corporation (“CIC”).84 The CCC proposal targets the segments of the U.S. futures customer base that, according to CCC, “most want account insurance”85 – specifically, customers of non-bank FCMs that lack the operational capabilities to sweep excess
84 See J. L. Roe, “Commodity Insurance Corporation,” Presentation of the Commodity Customer Coalition (n.d.), http://commoditycustomercoalition.org/?p=2388 – last visited March 30, 2013 (hereinafter “CIC Presentation”). 85 CIC Presentation, op. cit., p. 5.
Page 62

funds from their segregated accounts regularly and cost-effectively. CCC believes that CIC will primarily be of interest to target retail speculators (e.g., individuals, small pools, and small funds), producers and consumers (e.g., individual agricultural and energy hedgers, co-operatives, and merchandisers), and margin lenders (e.g., farm credit banks) and to the FCMs, IBs, CTAs, and CPOs that serve those types of customers.
The insurance coverage contemplated for CIC would provide customers with indemnification against some or all losses incurred as a result of the failure of an FCM and a shortfall in customer assets held at the defaulting FCM. The insurance would be subject to a policy limit to be chosen by customer policy holders and would not involve a deductible or first-loss retention for customers. Only customers of CIC Members (including FCMs, IBs, CTAs, and CPOs) would be eligible to purchase the CIC customer asset insurance policies. Customers would pay premiums either to a CIC Member or to a fronting insurance provider. Premiums would be payable monthly or annually either on a per contract basis or as a management fee.
The claims-paying resources of CIC would be a Customer Protection Fund (consisting of cash and Treasuries held at CIC) and reinsurance. The Customer Protection Fund would be financed with fees and assessments paid by CIC’s Members and insurance premiums (less the portion of premiums corresponding to premium loading and required to pay administrative and other expenses). The Customer Protection Fund would constitute the first-loss retention. CIC plans to seek reinsurance capacity either from sponsoring an insurance-linked security or through traditional reinsurance.
In addition to providing CAPI to participating customers, CIC would also provide customer policy holders with risk financing following the seizure of customer assets after an FCM’s insolvency. Specifically, CIC plans to use its own assets and a bank line of credit to finance an advance of funds to customer policy holders. The advance would be equal to the lesser of the amount of the customer’s frozen assets or the policy limit. CIC then would receive subrogation rights from customers, allowing CIC to assume the customer’s claim on the frozen assets (up to the amount of the loan) and eventually recover what is available from the bankrupt FCM’s estate.
Although CCC’s envisioned CIC is very similar to the FCM Captive in our Scenario #3 (discussed earlier in Section VIII.C.1), there are some distinctions. For example, CIC is envisioned to be a Cayman Islands domiciled captive owned not just by FCMs (as in Scenario #3), but also by registered IBs, CTAs, and CPOs. Despite these differences, we consider CCC’s envisioned CIC to be sufficiently similar to the FCM Captive outlined in Scenario #3 that we did not separately provide (re-)insurance market participants with the CCC scenario. In our view, the responses we received regarding Scenario #3 are also informative about the CCC’s proposed CIC.
(2) CME Family Farmer and Rancher Protection Fund We concentrated our analysis of private, voluntary CAPI provided by insurance and/or reinsurance companies. Nevertheless, specific DCOs might opt to offer some form of CAPI
Page 63

protection to certain customers. An archetypical example of such a program is CME’s Family Farmer and Rancher Protection Fund (“FF&RPF”).86
CME established the FF&RPF in April 2012. The FF&RPF provides up to a total of $100 million to eligible family farmers, ranchers, and agricultural cooperatives for losses of customer assets following the failure of one or more FCMs that execute their trades. Specifically, FF&RFP claims cover up to $25,000 of losses for individual family farmers and ranchers and up to $100,000 of losses for agricultural co-operatives that hedge their crop and livestock risks using CME products and markets executed through clearing members of CME.87
Programs like the CME FF&RPF could also potentially procure private, voluntary reinsurance to cover its existing indemnifications or increase the total capital available to cover eligible customers’ claims. In fact, CME did explore procuring reinsurance to cover its $100 million CAPI program, and received an indicative term sheet from a major reinsurance broker. The terms and cost of the proposed reinsurance facility, however, were viewed as uneconomic by CME, and CME chose to retain the risk of the program in lieu of procuring a reinsurance solution.
Complications may arise in DCO-backed CAPI programs, moreover, as a result of the competitive nature of U.S. futures markets. In particular, a DCO is likely to want to restrict its coverage in such programs to direct participants in its own markets and to FCMs that the DCO can directly monitor. As such, one DCO may not wish to provide its own capital to cover the transactions of customers executed through other, competing DCOs. Similarly, a DCO may not wish to provide coverage to non-clearing FCMs that the DCO cannot directly monitor. Nevertheless, CME’s FF&RPF does provide a concrete example of a CAPI product that is currently available with a DCO assuming the first-loss retention and should not be overlooked.
(3) Excess SIPC-Like Coverage for Futures As discussed in more detail later in Section X.A, SIPC is a government-backed insurance scheme that provides investors in failed U.S. securities brokerages with a specific, fixed amount of protection – viz., generally up to $500,000 for securities lost following the failure of a U.S. broker. Virtually since the inception of SIPC in 1970, private insurance companies have offered voluntary “Excess SIPC” surety bond coverage through which brokers purchase coverage that would cover the losses in excess of the $500,000 per-customer SIPC coverage following the failure of the broker. Typical Excess SIPC surety bonds were designed to protect relatively large customers for losses well in excess of their SIPC limits.88
86 See, e.g., CME Group, CME Group Family Farmer & Rancher Protection Fund – Terms and Conditions (April 2, 2012), and CME Group, Quick Facts on Family Farmer & Rancher Protection Fund Eligibility (April 2012). 87 Participation in the program by clearing FCMs is voluntary. If a clearing FCM opts not to participate, then its customers are not eligible for coverage under the program. Customers can, of course, choose to execute their trades through a different CME-clearing FCM that has opted into the program. 88 See, e.g., U.S. General Accounting Office, “Securities Investor Protection: Update on Matters Related to the Securities Investor Protection Corporation,” Report to Congressional Requesters (July 2003) (hereinafter “GAO (2003)”), and SIPC Modernization Task Force, Excess SIPC Insurance (June 2010).
Page 64

Several (re-)insurance participants with whom we spoke indicated that they might in the future consider offering an Excess SIPC-like product to U.S. FCMs. In this section, we explain Excess SIPC in more detail and comment on why we did not solicit indications of cost and availability from (re-)insurers as part of this study.
(a) Typical Excess SIPC Surety Bonds Protections for customers of a broker that has purchased Excess SIPC have historically come in three different forms. First, Net Equity Excess SIPC policies typically provide a customer with coverage for losses up to the amount of its total net equity less any receipts by the customer from the SIPA Trustee, SIPC, or the failed broker. Brokers purchasing Net Equity Excess SIPC coverage for their customers generally did not have any limitation on coverage at the aggregate level (i.e., across all customers of the broker in aggregate), or, if an aggregate limit was specified, it was at a very high amount of total coverage for the broker’s customers.
A second type of Excess SIPC coverage specifies unlimited aggregate coverage for the broker but contains per-customer inner limits as defined in Section VII.F.2. For example, suppose a broker has 100 customers, 90 of which each have $5 million in assets and 10 of which each have $125 million in assets. A typical Excess SIPC policy of this kind would not cap the Excess SIPC total coverage, but might specify a $100 million inner limit per-customer. In the event that this broker fails and all of its assets are unrecoverable, the 90 smaller customers would receive their $500,000 SIPC coverage plus $4.5 million in payments from the Excess SIPC provider. The 10 larger customers, however, would only receive $100 million from the Excess SIPC provider and therefore would be exposed to the additional $25 million in losses per customer. In this example, the total payment to the customers of the failed broker by the Excess SIPC provider would be $1.405 billion (i.e., $1 billion paid to the 10 larger customers and $405 million paid to the 90 smaller customers).
A final type of Excess SIPC coverage provides customers of a purchasing broker coverage subject both to aggregate and per-customer limits. To continue the previous example, suppose the same failing broker now also has an aggregate Excess SIPC policy limit of $250 million in addition to per-customer inner limits of $100 million. In that case, even the 90 relatively smaller customers would not be fully covered by the policy. Although the loss of $4.5 million by 90 customers would fall well below the per-customer inner limit, the total loss for those 90 customers would be $405 million, which is $155 million above the aggregate policy limit even before taking into account the 10 larger customers.
In general, Excess SIPC policies have typically been very restrictive and have included several significant risk protections designed to limit the risk exposure of the Excess SIPC underwriters. For example, most Excess SIPC policies require that the broker providing such coverage to its customers must also provide a parent guarantee to cover customer claims before the Excess SIPC coverage is triggered. Some Excess SIPC policies, moreover, also require a letter of credit from a third party to provide additional credit enhancement and further reduce the likelihood that the Excess SIPC policies would be triggered. These restrictions significantly limited the exposure of the insurance providers of this product and also led to relatively low premiums. Typical premiums were often as low as $5,000 per $1 million in coverage.
Page 65

(b) Providers of Excess SIPC Coverage Insurance companies have offered Excess SIPC coverage dating back to the 1970s following the creation of SIPC. Until 2003, most such policies were provided by P&C and financial guaranty insurance companies, including AIG, Asset Guaranty Insurance Company, Radian Asset Assurance,89 and Travelers Property Casualty Corporation. In mid-2003, however, the main providers of Excess SIPC began to exit the market.
Through 2003, no brokerage failure had triggered a claim on any Excess SIPC surety bond in the United States. Nevertheless, the risk of the failure of a large brokerage with thousands of customers was potentially significant, especially for Excess SIPC policies without aggregate coverage limits.90 A primary reason cited by Excess SIPC providers for exiting the business was the lack of growth opportunities and relatively low income relative to the potentially catastrophic risks to which such policies exposed Excess SIPC providers. Even with 100 of the largest U.S. brokerages purchasing Excess SIPC each year (which was indeed the case through 2003), total premium income on Excess SIPC lines was only estimated at between $30 million and $40 million per year in 2003.91 As a result, Excess SIPC P&C providers opted to dedicate their capital and resources elsewhere in 2003.92
The primary remaining provider of new Excess SIPC coverage by late 2003 was Lloyd’s of London. Lloyd’s is a (re-)insurance market in which multiple syndicates (the economic equivalents of reinsurance companies) underwrite policies sold to customers like securities brokers. The Lloyd’s Excess SIPC surety bonds typically include a per-broker aggregate policy limit, thereby limiting Lloyd’s syndicates to a known and quantifiable maximum risk exposure. Specifically, Lloyd’s Excess SIPC coverage is generally limited to a $600 million aggregate coverage amount per broker with $150 million per-customer inner limits.93
Sensing a competitive opportunity, certain other private insurance companies (e.g., XL Capital Ltd.) began to enter the Excess SIPC market to compete with Lloyd’s in early 2004. The most important new market entrant was the Customer Asset Protection Company (“CAPCO”), which was formed in late 2003 as a licensed New York insurance company for the specific purpose of providing Excess SIPC coverage in response to the withdrawals of mainstream P&C insurers.
89 Radian Group, Inc., acquired Asset Guaranty Insurance Co. (and its affiliate Enhance Reinsurance Co.) in 2001. 90 Events following the failure of Enron, moreover, had led to concerns about the risks of surety bonds more generally. See Culp (2006), op. cit., pp. 480-482, and C. L. Culp and J. P. Forrester, “Structured Financing Techniques in Oil and Gas Project Finance: Future Flow Securitizations, Prepaids, Volumetric Production Payments, and Project Finance Collateralized Debt Obligations,” in Energy and Environmental Project Finance Law and Taxation: New Investment Techniques, A. S. Kramer and P. C. Fusaro, eds. (London: Oxford University Press, 2010), pp. 544-546. 91 J. B. Treaster, “To Insurers, a Long Free Ride is Looking Risky,” New York Times (August 9, 2003). 92 See, e.g., GAO (2003), op. cit., pp. 24-26. 93 Z. Kouwe, “Billions in Lehman Claims Could Bury an Elusive Insurer,” New York Times (July 31, 2009).
Page 66

CAPCO issued its first Excess SIPC surety bonds in early 2004.94 At that time, CAPCO was a captive insurance company (see Section VII.D.2) owned by 14 companies with relatively large and active U.S. and U.K. broker/dealer subsidiaries.95 Lehman Brothers was one of the original sponsors of CAPCO and remained a sponsor through its own failure in September 2008.96
CAPCO provided Net Equity Excess SIPC coverage (i.e., without aggregate broker or customer limits) until 2008. The claims-paying resources of the CAPCO Excess SIPC captive included capital resources of its broker/dealer participants/owners, paid-in equity capital, and reinsurance. CAPCO gained significant market share in the 2004 to 2008 period largely because its Excess SIPC policies did not have aggregate limits, whereas the Excess SIPC policies of its competitors did.97
CAPCO was rated A+ by Standard & Poor’s (“S&P”) from its inception through late 2008. In December 2008, however, rating agencies began to express concerns about CAPCO’s ability to pay potential Excess SIPC customer claims arising from the liquidation of Lehman Brothers International (Europe) (“LBIE”).98 On December 10, 2008, S&P downgraded CAPCO’s counterparty and financial strength ratings from A+ to BB as a result of its “reassessment of the probability of CAPCO incurring a significant claim due to the liquidation of [LBIE].”99 On February 10, 2009, S&P again downgraded CAPCO from BB to B- with the following explanation: “The downgrade reflects Standard & Poor’s assessment of CAPCO’s potential liability to clients of [LBIE]. Although there is still tremendous uncertainty surrounding the administration of LBIE, Standard & Poor’s believes the situation could create a liability for CAPCO that exceeds the insurer’s resources.”100
By early 2009, all of CAPCO’s Excess SIPC surety bonds had expired and CAPCO was not offering any additional coverage. Indeed, some estimates provided to the New York State Insurance Department suggest that CAPCO could potentially face up to $11 billion in claims on Excess SIPC coverage provided to Lehman Brothers.101
94 CAPCO changed its domicile to Vermont in 2005. See Standard & Poor’s, “Customer Asset Protection Co.,” Global Credit Portal RatingsDirect (March 17, 2005). 95 Standard & Poor’s, “Customer Asset Protection Co.,” Global Credit Portal RatingsDirect (April 2, 2004). 96 Kouwe, op. cit. 97 See Standard & Poor’s, “Customer Asset Protection Co.,” Global Credit Portal RatingsDirect (June 5, 2008), p. 4. 98 The source of concern was whether or not re-hypothecated LBIE securities might be deemed as lost customer assets. 99 Standard & Poor’s, “Customer Asset Protection Co. Rtgs Lowered to ‘BB’ from ‘A+’; Rtgs Remain on Credit Watch Neg,” Global Credit Portal RatingsDirect (June 5, 2008), p. 2. 100 Standard & Poor’s, “Customer Asset Protection Co. Downgraded to ‘B-’; Ratings to be Withdrawn,” Global Credit Portal RatingsDirect (February 10, 2009), p. 2. 101 Kouwe, op. cit.
Page 67

(c) Excess SIPC-Like Coverage for U.S. FCMs and Their Customers Several problems arise when contemplating how insurance companies might provide the equivalent of Excess SIPC coverage in U.S. futures markets. First, Excess SIPC is predicated on the existence of a first-loss retention borne by SIPC. A private, voluntary futures-equivalent product thus is difficult to envision or analyze without the corresponding first-loss retention that SIPC provides in securities markets (along the lines of the proposal discussed in Section XI.A).
Second, even if a SIPC-like first-loss retention existed, many U.S. FCMs would be unable to secure Excess SIPC-like coverage for their futures customers because they are standalone firms and lack the ability to provide the requisite parent guaranty. Such FCMs also may be privately held firms without the traded debt and equity securities on which insurers would traditionally rely to estimate risks and price coverage for Excess SIPC.
In addition, as explained earlier, Excess SIPC has always been primarily intended to provide coverage and comfort to relative large firms and relatively big customers. In that regard, the CAPCO example provides a cautionary tale about the provision of such products without an appropriate aggregate policy limit (and perhaps also customer-specific inner limits). To the extent that any private insurers choose to provide a comparable CAPI product to customers of U.S. FCMs, it is likely that such policies will involve specific aggregate FCM limits and customer inner limits.
E. Risk Finance in a Voluntary CAPI Regime
A significant and recurring complaint from U.S. futures market customers following the insolvency of an FCM is the inability of customers to access their assets and funds following the FCM’s failure. In situations where an FCM fails for reasons unrelated to customer accounts, those customer accounts generally can be transferred quickly and with minimal disruption to other non-defaulting FCMs as has been shown through the failures of firms like Drexel Burnham Lambert, Lee Stern & Co.,102 Barings, Refco, Lehman Brothers, and others. But when questions exist regarding the amount of §4d customer-segregated or §30.7 foreign-secured funds, the accounts of customers are typically frozen while the relevant authority (e.g., a bankruptcy or SIPA trustee) undertakes an official reconciliation and accounting of the failed FCM’s assets and liabilities.
102 On October 22, 1992, a trader named Darrell Zimmerman who was using Stern & Co. as his clearing FCM executed a large number of unauthorized trades that generated losses and led to significant volatility in bond futures and options markets. Zimmerman fled to Canada, and Stern & Co. was unable to cover the resulting loss of about $8.5 million payable to the Chicago Board of Trade (“CBOT”) resulting from Zimmerman’s trades. The CBOT banned Stern & Co. from doing business and suspended several memberships of the firm’s principals. All customer accounts at Stern & Co. were transferred to other FCMs with no significant disruptions, and the $8.5 million payable by Stern & Co. was covered by other CBOT clearing members. Within a few days, Lee Stern reimbursed them out of his personal funds. Shortly thereafter, Stern & Co. was reinstated to the CBOT in good standing as a non-clearing FCM. Because his membership suspension was expunged, Mr. Stern’s more than 60 years as a CBOT member makes him one of the longest-standing (by some accounts the longest-standing) member of that exchange. See, e.g., B. J. Feder, “Clearing Firm is Suspended by Chicago Board of Trade,” New York Times (October 24, 1992), B. J. Feder, “Firm’s Suspension as Trader is Lifted by Chicago Board,” New York Times (October 28, 1992), and B. J. Feder, “Clearing Firm’s Worst Nightmare,” New York Times (November 10, 1992).
Page 68

The inability of futures customers to access their remaining assets and funds at a failed FCM is considered by many to be a significant weakness in the current system for the protection of U.S. futures customers’ assets. As discussed in Section III.A.1, customers of MFG were forced to wait nearly two years to receive their remaining assets (despite CME stepping in to provide the SIPA trustee with a guarantee).
Some market participants in the United States have argued that a scheme similar to the Canadian Investor Protection Fund (“CIPF”) (discussed in Section X.B, below) should be adopted here because such a program would supposedly ensure the expedient transfer of non-defaulting customer accounts or the financing of frozen customer positions following an FCM’s insolvency. In fact, that is a misconception of the Canadian regime. As an illustration, the Canadian arm of MFG’s empire was not actually insolvent when its U.S. parent filed for bankruptcy protection. Nevertheless, MFG Canada Co. was forced into bankruptcy due to a short-term capital shortfall when funds in its U.S. parent were frozen as a result of the U.S. parent’s bankruptcy petition. Indeed, all of the customer funds in the Canadian MFG affiliate appear to have been present and accounted for. Yet, Canadian clients went weeks with their accounts frozen and were both unable to trade or to recover their cash investments. In fact, the CIPF warns customers that the ultimate protection of their funds does not guarantee access to short-term liquidity for frozen customer positions.
Nevertheless, some alternatives are available to provide customers of failed FCMs with short-term financing to replace the liquidity those customers have lost as a result of the freezing of their assets in a failed FCM (provided they are willing to bear the costs). Importantly, these solutions need not be conditional on the existence of a CAPI program. Although such risk financing solutions to provide liquidity to customers with frozen assets are certainly less expensive when combined with customer asset protection insurance, the two concepts (i.e., true risk transfer via insurance and risk financing for retained risks and associated losses) are not inextricably intertwined, as we discuss below.
In the event that the failure of an FCM results in a possible loss of customer assets and the freezing or seizure of the customer assets that remain, the availability of a CAPI policy greatly simplifies customers’ short-term liquidity constraints. Specifically, a “bank wrap” could be provided in conjunction with customer asset protection insurance that would provide the FCM customers with access to short-term funds as a substitute for the customers’ frozen or seized assets.
A typical bank wrap of a (re-)insurance policy is designed to put funds in the hands of insurance policy holders immediately as the insurance company and any reinsurers undertake their loss adjustment and claims administration processes. The eventual claim payment is simply pledged to a bank or banking syndicate as collateral for a loan to the insurance purchaser. The loan maturity corresponds to the expected time the insurance company will take to assess the loss and finally and irrevocably settle the claim, and the amount of the loan is based on the expected benefit payment.
Page 69
IX. COST ESTIMATES AND CAPITAL AVAILABILITY FOR PRIVATE, VOLUNTARY CAPI
As discussed previously, we ascertained at an early stage of this study that (re-)insurance market participants with whom we spoke were unwilling to provide cost estimates or prospective policy programs for Scenarios #1 or #2 (i.e., CAPI provided directly to customers or on an FCM-specific basis). Our subsequent analysis thus focused on Scenario #3. In this section, we summarize our request to (re-)insurance market participants, the data we provided to prospective (re-)insurance market participants, and the responses we received.
A. Request to (Re-)Insurance Market Participants
In our request to (re-)insurance market participants, we asked that they review the data we provided to them and then respond by providing us with the following: (i) indicative premium quotes on potential CAPI (re-)insurance coverage for the Scenarios (expressed on an all-in, rate on line basis inclusive of load and any other fees) and (ii) indications of interest and available capacity to underwrite these risks through the Scenarios.
We considered it important to provide a single set of quantitative data to all (re-)insurance market participants and to ask them to base their indicative premium quotations on the data and analyses that we provided. We understand that in any concrete, actual deal, the (re-)insurers will wish to perform their own independent analysis as a part of their actual deal-specific underwriting processes. By providing data to (re-)insurers for the purpose of the study, however, we hoped to provide a middle ground in which (re-)insurers had sufficient information to provide meaningful indicative premium estimates without forcing them to undertake a full underwriting-like quantitative analysis purely for the purpose of responding to our request for this study. The data that we provided to potential underwriters is discussed in Section IX.B below.
Two potential CAPI providers indicated a potential interest in providing some type of CAPI in the future and took the time to describe the potential offerings of CAPI they envisioned as possibilities. Yet, neither firm provided us with indicative premium quotations or available capacity amounts.103 Although we appreciate both of those firms’ willingness to have had several discussions with us and to help with our study, the lack of any specific cost or capacity estimates in their responses precludes our inclusion of those firms’ comments in this Report. Nevertheless, we consider the appetite of these two market participants to be potential CAPI providers as an important further indication of the interest by private (re-)insurers in offering coverage of certain under-segregation risks in the future.
103 One of the two potential providers was uncertain about its willingness to provide CAPI and thus felt it was premature to provide indications of cost and capacity. The other potential provider was very interested in providing CAPI for several kinds of potential customer asset risks (including misfeasance or malfeasance and fellow-customer risk) but was unwilling to provide indications of cost or capacity without engaging in an underwriting-equivalent risk modeling exercise using its own data.
Page 70

B. Data Provided to Prospective Reinsurers
The data we provided to prospective reinsurers includes the descriptive data shown earlier in Sections V.B and V.C, as well as the data summarized in this section. As noted, by the time our data collection and analysis was complete, it was already evident that there was no appetite amongst the insurance participants with whom we were speaking to provide capacity estimates or indicative premiums for Scenarios #1 or #2. As such, the data and analysis we presented was focused on Scenario #3.104
(1) Conditional Expected Losses and the First-Loss Retention A fundamental input to reinsurers in estimating the availability of capital and the cost of that capital to reinsure a structure like the FCM Captive is what reinsurers call the conditional expected loss (“CEL”) for the FCM Captive. The CEL reflects the loss that the FCM Captive can expect to realize in a given year, where the terms “expect” and “expected” are used in the probabilistic and statistical sense. In other words and very importantly, the CEL does not represent the amount that the FCM Captive expects to lose in a year. Instead, the CEL indicates the average loss that would be expected to occur over a very long time period like 100, 200, or 500 years. It is this CEL that reinsurers generally require insurers to retain as a first-loss (i.e., deductible-equivalent) exposure.
The two components of a CEL estimate are Loss Given Default (“LGD”) – i.e., an estimate of losses assuming that one or more FCM defaults and CAPI triggering events have occurred – and the probability of the FCM Captive realizing that LGD. To go from an estimated LGD to a CEL for a given first-loss layer, we need to make assumptions about the probabilities that insurable losses will exceed certain thresholds in a year. These probabilities are known as annualized exceedance probabilities (“AEPs”).
More formally, our data analyses focused on the AEP that total insurable losses will exhaust the first-loss layer and result in reinsurance payments by one or more reinsurers – i.e.,
𝐴𝐴𝐴𝐴𝐴𝐴1 = 𝐴𝐴𝑃𝑃𝑃𝑃𝑃𝑃[𝐿𝐿 ≤ 𝐴𝐴𝐴𝐴1]
where L denotes insurable losses over a policy year and EP1 denotes the Exhaustion Point for the first-loss layer in a policy year. By construction, the Exhaustion Point for the first-loss layer EP1 is also equivalent to the Attachment Point for the reinsurance layer in the policy year, denoted AP2 (i.e., Attachment Point for layer 2).
The CEL for the first-loss layer (to be retained as a first-loss layer by the FCM Captive) is then defined as
𝐶𝐶𝐴𝐴𝐿𝐿1 = 𝐴𝐴𝐴𝐴𝐴𝐴1 𝑥𝑥 𝐿𝐿𝐿𝐿𝐷𝐷1
104 Most of the data and analyses presented for Scenario #3 could also be used by reinsurers to estimate the risks of Scenario #2. In other words, Scenario #3 contemplates an industry captive, but a “special case” of Scenario #3 is a captive with a single FCM participant, which is Scenario #2. As such, reinsurers were also provided with adequate information to respond on Scenario #2, but, predictably, none did so.
Page 71

where LGD1 is the total potential LGD in the first-loss layer.
We were not asked to and did not engage in any modeling or estimation of potential AEPs or exceedance curves (i.e., multiple AEPs across multiple potential LGD amounts). Instead, we analyzed and presented interested reinsurers with three potential AEP1 values: 0.01 (i.e., a loss in one out of every 100 years); 0.005 (i.e., a loss in one out of every 200 years); and 0.002 (i.e., a loss in one out of every 500 years). Our rationale for using these three loss probabilities is not based on any independent empirical or theoretical modeling work that we undertook, but rather is instead driven by our discussions with various reinsurers suggesting that CAPI would be viewed as similar to catastrophic reinsurance and thus will be unlikely to generate underwriting interest with attachment points unless they correspond to catastrophic AEPs. As such, the sizes of potential first-loss layers and CELs that we present are based on assumed potential AEPs and not on AEPs that we have attempted to associate with the various risk exposures summarized here.
(2) Fixed Customer Limits vs. Aggregate First-Loss Retention As discussed in Section VII.F, policy limits on a program can either be defined in terms of fixed customer-specific limits or an aggregate limit across all FCMs that participate in the FCM Captive. Customer-specific limits are comparable to Excess SIPC-like products (discussed in Section VIII.D.3). The problem with fixed customer-specific limits, however, is that the total amount of risk for any prospective reinsurers is based on the number of customers at Participating FCMs, which may be related to the existence of a CAPI product. Because the availability of CAPI at Participating FCMs could result in a significant increase in customers, and, hence, a significantly higher potential liability for reinsurers, data on the current number of customers at FCMs would likely be insufficient.
Reinsurers instead prefer to see a single aggregate first-loss retention so that they can estimate premium costs and capacity based on a specific estimated CEL. As such, we only considered the case in which any customer losses arising from misfeasance or malfeasance under-segregation losses or fellow-customer losses would be payable up to the exhaustion point of the first-loss layer regardless of the size of claims from any individual customers. In other words, we considered an aggregate first-loss retention by the FCM Captive that would cover any insurable losses by any customer(s) of any defaulting FCM.
How many FCMs would choose to participate in an FCM Captive cannot be known, especially in the absence of concrete cost estimates and well-defined policy language and coverage details. Nevertheless, the size and extent of the FCM Captive can and must be analyzed under several different FCM Captive participation scenarios that will drive the total assets at risk and, hence, the size(s) of the presumptive retained first-loss layer(s).
(3) Misfeasance and Malfeasance Under-Segregation Risk Table 2 earlier showed data for total customer assets across 52 Small, 15 Medium, and 10 Large FCMs (the entire reporting universe) during 2012. We begin by assuming that the customer assets at the FCMs are equal to the maximum amount (by FCM) during all month-ends in 2012 (i.e., Table 2, Panel (d)). For example, the maximum reported for Small FCMs was
Page 72

$1,128,040,953. That means that across all 52 Small FCMs, the largest total customer assets on deposit during any month-end in 2012 were about $1.13 billion.
Table 9 below shows the per-FCM CEL corresponding to the three assumed AEPs.
Table 9: Per-FCM CELs from Under-Segregation Risk Small FCMs Medium FCMs Large FCMs
Max 2012 Assets:a $1,128,040,953 $4,514,351,283 $31,851,751,905 # of FCMs:b 52 15 10
AEP1 = 0.010 $11,280,410 $45,143,513 $318,517,519 0.005 $5,640,205 $22,571,756 $159,258,760 0.002 $2,256,082 $9,028,703 $63,703,504
a: Based on Table 2, Panel (d). b: Based on total number of FCMs reporting to the CFTC during 2012.
From Table 9, different under-segregation CELs for the FCM Captive can be computed based on assumed participation rates. Specifically, using the total numbers of FCMs by size type in 2012 (from Table 2), we consider three Participation Scenarios with different percentages of Small, Medium, and Large FCMs in the FCM Captive.105
The CEL corresponding to under-segregation risk was computed as follows:
𝐶𝐶𝐴𝐴𝐿𝐿 = 𝜋𝜋�𝛿𝛿𝑁𝑁𝑗𝑗𝐿𝐿𝑗𝑗
3
𝑗𝑗=1
where 𝜋𝜋 is the assumed AEP for the default of an under-segregated FCM, 𝛿𝛿 is the assumed amount of customer assets at the FCM that are lost and unrecoverable, 𝑁𝑁𝑗𝑗 is the number of FCMs in size category j, 𝐿𝐿𝑗𝑗 is the estimated customer assets lost (before taking into account recoveries) across all FCMs within each FCM size category j at each month-end during 2012, and j=1,2,3 indicate FCM size categories Small, Medium, and Large, respectively. Specifically, 𝐿𝐿𝑗𝑗 is the maximum amount of customer assets across all FCMs within each FCM size category j across all months in 2012.
The numbers in Table 10 show the CELs for each of the three AEPs and all three Participation Scenarios. In Table 10, the assumed proportion of customer assets that are lost and unrecoverable following an under-segregation loss is 𝛿𝛿=1. In other words, Table 10 reports under-segregation CELs assuming that the defaulting FCM has zero customer assets left and that customers of that FCM lose all of their assets on deposit with the FCM.
105 We assume in this analysis that widespread participation in a CAPI FCM Captive by Large FCMs is unlikely because of the much-larger customer assets at those Large FCMs. The impact of the participation of a Large FCM on the first-loss layer required to support reinsurance of the FCM Captive is evident by examining Participation Scenario 3 in Tables 10, 11, 14, and 15.
Page 73

Table 10: Potential Under-Segregation CELs for FCM Captive Based on Varied FCM Participation Rates – Proportion of Unrecoverable Losses = 100%
Small FCMs Medium FCMs Large FCMs Total Panel (a): Participation Scenario 1
FCM Participation Rate:a 10% 5% 0% Participating FCMs:b 5 1 0 6 Total Assets at Risk:c $5,640,204,765 $4,514,351,283 $0 $10,154,556,048
AEP = 0.010 $56,402,048 $45,143,513 $0.00 $101,545,560 AEP = 0.005 $28,201,024 $22,571,756 $0.00 $50,772,780 AEP = 0.002 $11,280,410 $9,028,703 $0.00 $20,309,112
Panel (b): Participation Scenario 2 FCM Participation Rate:a 25% 10% 0%
Participating FCMs:b 13 2 0 15 Total Assets at Risk:c $14,664,532,389 $9,028,702,566 $0 $23,693,234,955
AEP = 0.010 $146,645,324 $90,287,026 $0.00 $236,932,351 AEP = 0.005 $73,322,662 $45,143,513 $0.00 $118,466,175 AEP = 0.002 $29,329,065 $18,057,405 $0.00 $47,386,470
Panel (c): Participation Scenario 3 FCM Participation Rate:a 50% 25% 1%
Participating FCMs:b 26 4 1 31 Total Assets at Risk:c $29,329,064,778 $18,057,405,132 $31,851,751,905 $79,238,221,815
AEP = 0.010 $293,290,648 $180,574,051 $318,517,519 $792,382,218 AEP = 0.005 $146,645,324 $90,287,026 $159,258,760 $396,191,109 AEP = 0.002 $58,658,130 $36,114,810 $63,703,504 $158,476,444
a: The FCM Participation Rate is the percentage of total FCMs for each size category presumed in each Participation Scenario to join the FCM Captive – i.e., FCMs that would contribute capital to the FCM Captive and whose customers could purchase CAPI from the FCM Captive. b: The number of Participating FCMs in each Participation Scenario is based on the presumed FCM Participation Rate and the total number of FCMs in 2012 as indicated in Table 2. c: Total Assets at Risk is equal to the product of (i) the maximum amount of customer assets across all FCMs within each FCM size category reporting during 2012 and (ii) the number of FCMs assumed to be participating in the FCM Captive within each FCM size category.
The numbers in bold in the last column in Table 10 labeled “Total” represent the minimum amount of assets that the FCM Captive would need to hold in order to absorb the CEL in a retained first-loss layer corresponding to those total assets at risk. For example, if five Small FCMs and one Medium FCM (i.e., Participation Scenario 1) join the FCM Captive and the risk of an under-segregation loss of all customer assets in all five FCMs is considered a one-in-200-year event (i.e., AEP=0.005), the FCM Captive would need about $51 million in capital and premiums, and the attachment point for reinsurance would be at that $51 million loss level.
Assuming that absolutely all of the defaulting FCM’s customer assets are gone and cannot be recovered is, of course, a very conservative assumption (from the perspective of reinsurers underwriting the potential losses). Using the numbers in Table 10, we can re-calculate CELs for under-segregation losses for other assumed proportions of unrecoverable assets by simply multiplying the CELs in the table by any value of 𝛿𝛿 between zero (i.e., 100 percent recoveries and no loss of customer assets) to unity (i.e., 100 percent loss of assets, as shown in Table 10). For example, Table 11 show the CELs for each of the three AEPs and all three Participation Scenarios, where the proportion of unrecoverable assets is now 𝛿𝛿=0.5. In other words, Table 11 reports under-segregation losses assuming that customers of the defaulting FCM recover half of their assets on deposit with the FCM.
Page 74

Table 11: Potential Under-Segregation CELs for FCM Captive Based on Varied FCM Participation Rates – Proportion of Unrecoverable Losses = 50%
Small FCMs Medium FCMs Large FCMs Total Panel (a): Participation Scenario 1
FCM Participation Rate:a 10% 5% 0% Participating FCMs:b 5 1 0 6 Total Assets at Risk:c $5,640,204,765 $4,514,351,283 $0 $10,154,556,048.00
AEP = 0.010 $28,201,024 $22,571,757 $0 $50,772,781 AEP = 0.005 $14,100,512 $11,285,878 $0 $25,386,390 AEP = 0.002 $5,640,205 $4,514,352 $0 $10,154,557
Panel (b): Participation Scenario 2 FCM Participation Rate:a 25% 10% 0%
Participating FCMs:b 13 2 0 15 Total Assets at Risk:c $14,664,532,389 $9,028,702,566 $0 $23,693,234,955
AEP = 0.010 $73,322,662 $45,143,513 $0 $118,466,175 AEP = 0.005 $36,661,331 $22,571,757 $0 $59,233,088 AEP = 0.002 $14,664,533 $9,028,703 $0 $23,693,235
Panel (c): Participation Scenario 3 FCM Participation Rate:a 50% 25% 1%
Participating FCMs:b 26 4 1 31 Total Assets at Risk:c $29,329,064,778 $18,057,405,132 $31,851,751,905 $79,238,221,815
AEP = 0.010 $146,645,324 $90,287,026 $159,258,760 $396,191,109 AEP = 0.005 $73,322,662 $45,143,513 $79,629,380 $198,095,555 AEP = 0.002 $29,329,065 $18,057,405 $31,851,752 $79,238,222
a: The FCM Participation Rate is the percentage of total FCMs for each size category presumed in each Participation Scenario to join the FCM Captive – i.e., FCMs that would contribute capital to the FCM Captive and whose customers could purchase CAPI from the FCM Captive. b: The number of Participating FCMs in each Participation Scenario is based on the presumed FCM Participation Rate and the total number of FCMs in 2012 as indicated in Table 2. c: Total Assets at Risk is equal to the product of (i) the maximum amount of customer assets across all FCMs within each FCM size category reporting during 2012 and (ii) the number of FCMs assumed to be participating in the FCM Captive within each FCM size category.
As a comparison and reference point for interpreting Tables 10 and 11, NFA in its 1986 study analyzed an under-segregation loss scenario (based on segregated funds data as of September 30, 1985) in which defaulting FCMs hold less than 50 percent of the per-FCM average of segregated funds, missing customer funds are less than 50 percent of defaulting FCMs’ required segregation amounts, and 50 percent of missing customer funds are eventually recovered. In 1985, that translated into a $3.5 million under-segregation loss exposure.106
Table 12 shows a comparison of the potential under-segregation risk exposures using the assumptions in the 1986 NFA study and segregated funds data as of August 31, 2011 (i.e., the last month in which it was included in FCM financial reports filed with the CFTC) and for 2012. Using NFA’s assumptions, the risk exposures indicated in Table 12 are the potential under-segregation loss of a single FCM at which total customer assets are equal to 50 percent of the average amount of customer assets across all FCMs.107 Line (d) in Table 12 indicates the per-FCM risk or loss exposure per defaulting FCM.
106 NFA CAPI Study, op. cit., p. 43. 107 FCMs reporting no customer assets are excluded from the analysis on both dates. For that reason, the results shown here differ from those reported elsewhere. See, e.g., S. A. Gidel, “Commodity Customer Protections and Regulations: History and Potential Solutions for the Future, 1938-2012,” Commodity Customer Coalition White Paper (February 14, 2012), p. 18.
Page 75

Table 12: Per-FCM Under-Segregation Risk Based on 1986 NFA Report Assumptions Segregation Data As Of 8/31/11 2012a
Number of FCMs with Customer Assets 72 77b (a) Average Customer Assets per FCM $2,975,761,645 $2,852,691,340c (b) Avg Customer Assets at Defaulting FCM = 50% of (a) $1,487,880,822 $1,426,345,670 (c) Missing Assets at Defaulting FCM = 50% of (b) $743,940,411 $713,172,835 (d) Unrecovered Assets at Defaulting FCM = 50% of (c) $371,970,206 $356,586,418 a: All months in 2012. b: FCMs reporting no customer assets (either §4d or §30.7 assets) in all months during 2012 are excluded from this analysis. c: For 2012, customer assets are calculated as the maximum amount of customer assets at each reporting FCM across all months of 2012. The average is then taken across all FCMs’ maximum reported customer assets.
The potential losses for a single FCM shown in Table 12 are much larger than the CELs shown in Tables 10 and 11 for the first two Participation Scenarios, as compared to the losses in the third Participation Scenario (i.e., 26 defaulting Small FCMs, four defaulting Medium FCMs, and one defaulting Large FCM) which are more in line. The reason for this is that Tables 10 and 11 show conditional expected losses, which are potential losses adjusted by several annualized probabilities that those losses will occur. Table 12, by contrast, shows only the potential total losses and not the annualized loss probabilities.
Table 13 shows the potential under-segregation losses using NFA’s default and recovery assumptions and data as of August 31, 2011, and 2012. Unlike Table 12, Table 13 now presents CELs instead of just LGD exposures – i.e., the numbers in Table 13 are the CELs using row (d) from Table 12 as estimates of LGDs and then multiplied by the three probabilities shown in the first column of Table 13.
Table 13: Per-FCM Under-Segregation CELs Based on 1986 NFA Report Assumptions CEL Based on Data As Of…a
Probability Expected Frequency 8/31/11 2012 0.010 1-in-100 Year Event $3,719,702 $3,565,864 0.005 1-in-200 Year Event $1,859,851 $1,782,932 0.002 1-in-500 Year Event $743,940 $713,173
a: CELs are equal to the amounts shown on Line (d) in Table 12 multiplied by the assumed loss probabilities shown in the first column.
For example, the per-FCM CEL corresponding to an assumed annualized FCM default probability of one percent is $3,565,864 based on 2012 data (i.e., the first data line and last column of Table 13). If 14 FCMs default at the same time, the total CEL is $49,922,096 (=$3,565,864 x 14). That is just below the CEL reported for the same loss probability and the same 50 percent unrecoverable loss assumption shown for Participation Scenario 1 in Panel (a) of Table 11 (i.e., $50,772,781). Yet, Participation Scenario 1 only assumes a default of five Small FCMs and one Medium FCM.
One reason that the CELs shown in Table 10 are so much higher than the CELs in Table 13 is that we do not assume in Table 10 that default-related losses are limited to 50 percent of the customer assets at FCMs with total customer assets below the per-FCM average customer asset amount. We are not suggesting that our assumptions are necessarily more “realistic” than the assumptions in the 1986 NFA Report, but rather wish to underscore that we have made
Page 76

extremely conservative risk assumptions for the purpose of presenting these analyses to reinsurers.
(4) Fellow-Customer Under-Segregation Risk Table 8 showed various estimated potential LGDs arising from fellow-customer risk. Unlike loss estimates for under-segregation risk (which are based solely on total assets at risk and assumed AEPs), loss estimates for fellow-customer risk from an insurance perspective are harder to interpret. On the one hand, as explained in Section V.C, the stress scenarios used to generate estimates of fellow-customer LGD exposures are highly conservative (from the perspective of reinsurers evaluating potential loss exposures). On the other hand, we have made no attempt to estimate the probabilities that one or more particular customers with net loss and payment obligations actually will default on their obligations.
To remain consistent with the analysis in the previous section, we again consider AEPs of 0.01, 0.005, and 0.002 and calculate the sizes of the first-loss retention layers for the FCM Captive corresponding to the CEL associated with these three potential loss probabilities. For example, the 0.002 AEP can be interpreted as the one-in-500-year probability that all customers with stressed net losses ranked from the 98th percentile-largest loss up to the 99.5th percentile-largest loss fail to pay what they owe to their FCM, no partial recoveries of those funds occur, and the FCM contributes none of its own funds to cover the resulting deficiency, thereby triggering an FCM default and fellow-customer losses. This is a very conservative approach (from a reinsurer’s perspective) in the sense that FCMs in this situation will generally have at least some assets to contribute toward reducing the customer funds deficiency that are not reflected in these loss estimates.
Using the numbers from Tables 8(b) and 8(c) for stressed customer defaults with losses ranked between the 98th and 99.5th percentiles, the resulting net losses for those FCMs are shown in Table 14 under the three participation scenarios examined in Section IX.B.3. For example, in Participation Scenario 2 (i.e., 13 Small FCMs, 2 Medium FCMs, and no Large FCMs), a presumed one-in-100-year probability for fellow-customer losses would result in a CEL of about $22.8 million. Under those assumptions, the FCM Captive thus would need to retain the $22.8 million retained first-loss layer.
Page 77

Table 14: Potential Fellow-Customer CELs for FCM Captive Based on Varied FCM Participation Rates
Small FCMs Medium FCMs Large FCMs Total Panel (a): Participation Scenario 1
FCM Participation Rate:a 10% 5% 0% 8% Participating FCMs:b 5 1 0 6
Stressed Loss:c $558,808,060 $414,233,865 $0 $973,041,926 AEP = 0.010 $5,588,081 $4,142,339 $0 $9,730,419 AEP = 0.005 $2,794,040 $2,071,169 $0 $4,865,210 AEP = 0.002 $1,117,616 $828,468 $0 $1,946,084
Panel (b): Participation Scenario 2 Participation Rate:a 25% 10% 0% 19%
Participating FCMs:b 13 2 0 15 Stressed Loss:c $1,452,900,956 $828,467,730 $0 $2,281,368,690
AEP = 0.010 $14,529,010 $8,284,677 $0 $22,813,687 AEP = 0.005 $7,264,505 $4,142,339 $0 $11,406,843 AEP = 0.002 $2,905,802 $1,656,935 $0 $4,562,737
Panel (c): Participation Scenario 3 Participation Rate:a 50% 25% 1% 41%
Participating FCMs:b 26 4 1 31 Stressed Loss:c $2,905,801,919 $1,656,935,460 $12,631,168,763 $17,193,906,142
AEP = 0.010 $29,058,019 $16,569,355 $126,311,688 $171,939,061 AEP = 0.005 $14,529,010 $8,284,677 $63,155,844 $85,969,531 AEP = 0.002 $5,811,604 $3,313,871 $25,262,338 $34,387,812
a: The FCM Participation Rate is the percentage of total FCMs for each size category presumed in each Participation Scenario to join the FCM Captive – i.e., FCMs that would contribute capital to the FCM Captive and whose customers could purchase CAPI from the FCM Captive. b: The number of Participating FCMs in each Participation Scenario is based on the presumed FCM Participation Rate and the total number of FCMs in 2012 as indicated in Table 2. c: The Stressed Loss is equal to the product of (i) the maximum loss in 2012 across all FCMs within each size categories assuming that customers with net payment obligations in the 98th through the 99.5th percentile fail to pay what they owe and (ii) the number of FCMs assumed to be participating in the FCM Captive within each FCM size category.
(5) Summary of Potential First-Loss Retentions Table 15 presents a side-by-side comparison of the estimated conditional expected under-segregation losses arising from misfeasance or malfeasance and fellow-customer losses across the three FCM Captive participation scenarios and for the three potential AEPs. For under-segregation CELs, we present the most conservative case (from a reinsurance perspective) of a zero recovery rate – i.e., all customer assets at the defaulting FCMs are presumed to be lost and unrecoverable.
Table 15: Estimated First-Loss Layer Exhaustion Points by AEP and FCM Captive Participation Scenario for Under-Segregation and Fellow-Customer Risk
# of FCMs Participating in the
FCM Captive 1-in-100 Event (AEP = 0.010)
1-in-200 Event (AEP = 0.005)
1-in-500 Event (AEP = 0.002)
Small Medium Large Mis- or
Malfeasancea Fellow-
Customerb Mis- or
Malfeasancea Fellow-
Customerb Mis- or
Malfeasancea Fellow-
Customerb 5 1 0 $101,545,560 $9,730,419 $50,772,780 $4,865,210 $20,309,112 $1,946,084
13 2 0 $236,932,350 $22,813,687 $118,466,175 $11,406,843 $47,386,470 $4,562,737 26 4 1 $792,382,218 $171,939,061 $396,191,109 $85,969,531 $158,476,444 $34,387,812
a: From Table 10. b: From Table 14.
Page 78

Counter-intuitive as it may seem, Table 15 shows that the first-loss layers (i.e., CELs) are much higher across all participation scenarios for under-segregation risk than for fellow-customer risk. The reason for this is that we are assuming that an under-segregation loss scenario (including fraud) result in a loss of all customer assets during normal market conditions, whereas the fellow-customer loss scenario only assumes a loss of some customer assets during distressed market conditions.108 As a result, required capitalization levels for the FCM Captive and the size of the retained first-loss layer for the under-segregation scenario will tend also to be sufficient to cover the fellow-customer risk scenario we have articulated here.
C. Funding for the First-Loss Layer
As discussed in Section VII.E.2, a first-loss retention may be unfunded or funded depending on the nature of the underlying risk exposure, expected frequency and severity of claims, and the benefits and costs of the available alternatives. Although we provided information and analyses to reinsurers that quantified potential first-loss exposures for an FCM Captive in Scenario #3 (see, e.g., Table 15), we did not include any specific proposal in our request to reinsurers as to whether the first-loss layer should be unfunded, partially funded, or fully funded.
We describe the implications of alternative funding approaches for the first-loss retention in the next two sections.
(1) Partially Funded First-Loss Retention Recall from Section VII.E.2 that an unfunded first-loss retention in traditional primary insurance is an unfunded deductible in which the insured pays all costs and absorbs all losses from its general funds. The first-loss retention for an FCM Captive providing CAPI to customers of Participating FCMs, however, is the equivalent of a deductible from the perspective of the FCM Captive’s reinsurers. From the perspective of customers purchasing CAPI from the FCM Captive, the FCM Captive, in order to be credible, would need to provide customers with assurances that their CAPI claims not covered by reinsurance would be paid using other claims-paying resources of the FCM Captive.
A completely unfunded first-loss layer thus is extremely unrealistic. As one alternative, Participating FCMs might be required to fund some portion of the first-loss layer. For example, if Participating FCMs were required to fund the first 10 or 20 percent of losses in a facility that had a $50 million first-loss retention, FCMs would have to contribute $5 or $10 million (collectively). The partial funding of the first-loss layer by Participating FCMs would serve two purposes. First, it would ensure that at least some paid-in capital is available at the FCM Captive
108 We did not consider the scenario in which customer gains resulting from stressed market conditions also would be fully at risk of fraud. Simulating extreme stressed gains (which was a natural byproduct of our stress tests) resulted in some very significant simulated profits that would come in the form of variation margin after a trading session. We consider it very unlikely that a fraudster could time its fraud to seize those customer gains right after they are wired into customer accounts but right before customers had a chance to withdraw their proceeds. Nevertheless, this is possible, but the simulated losses are so large that they are likely to be uninsurable.
Page 79

to cover potential CAPI claims. Second, it would mitigate moral hazard on the part of Participating FCMs.
For the unfunded portion of the first-loss layer, no monies would be set aside or collected from Participating FCMs prior to the occurrence of an event that actually triggers eligible CAPI claims (i.e., the failure of one or more Participating FCMs that are under-segregated). Thus, post-loss assessment mutual or captive (re-)insurers generally maintain very low amounts of paid-in capital, and, when a loss occurs, non-failing participants are called on to contribute the funds required to cover the first-loss claims.
For example, U.S. State-based P&C guaranty funds are mutualized insurance funds that guarantee that policies at failed P&C insurance companies can still be honored. With New York State as a notable exception, most such State-based P&C guaranty funds are based on post-loss assessments. Specifically, following the failure of a P&C insurance company in a given state that lacks the claims-paying resources to honor all of its customer claims, all other licensed P&C insurers in that state are required to make a pro rata contribution (based on the amount of business those companies do in that state) to cover the claims from customers of the insolvent insurance company.109
Post-loss assessments are popular for insurance entities that underwrite extremely low-frequency loss events. Because it is costly to raise and contribute capital to cover risks like under-segregated FCM failures and the resulting CAPI claims, it may not make economic sense to pre-fund that loss if such losses are expected to occur very infrequently (as the data suggests they are). Instead, post-loss assessments may be less costly and more capital efficient.
A potentially significant drawback of post-loss assessments to cover the first-loss layer is the credit and liquidity risk to which the FCM Captive is exposed. If the non-failing Participating FCMs lack the financial resources or willingness to honor their post-assessment obligations at the time they arise, the claimants in the FCM Captive’s first-loss layer may be subject to significant delays in payments or, in the extreme case, to non-payments of claims.
(2) Fully Funded First-Loss Retention A fully funded first-loss retention would involve pre-loss funding of the entire first-loss layer. For example, an FCM Captive with a $50 million first-loss layer would need access to $50 million in funds to cover the first $50 million in CAPI claims on a fully funded basis.
If Participating FCMs are required to fund the entire $50 million first-loss layer, many Small and Medium FCMs may view the program as cost-prohibitive in a market where capital is relatively scarce. As a practical matter, there is no good source of data for U.S. FCMs’ capital available to pay into an FCM Captive. Many of the FCMs have diverse financial activities that go well beyond futures trading, and some are private companies with no published financial statements. Nevertheless, we can get at least some crude sense of the available FCM capital to support the FCM Captive’s retained first-loss layer by looking at the Excess Adjusted Net Capital (“ANC”)
109 See, e.g., National Conference of Insurance Guaranty Funds, Property and Casualty Guaranty Fund Resource Manual, http://www.ncigf.org/media/files/NCIGF_ResourceManual_FINAL.pdf (last visited October 19, 2013).
Page 80

of FCMs by size category. ANC is a measure of regulatory capital, and Excess ANC measures the capital held by FCMs in excess of the regulatory minimum capital requirements computing using regulatory capital definitions. These are not measures of economic capital or available liquid assets and thus should not be misinterpreted.
With those caveats in mind, Table 16 reports three different measures of Excess ANC. We consider a “Low” estimate of Excess ANC by taking the average Excess ANC for all reporting FCMs for all months in 2012 and then take the 25th percentile of the average Excess ANC computed across all FCMs within each size category. The “Median” Excess ANC is the 50th percentile of the average Excess ANC computed across FCMs within each size category. And the “High” Excess ANC scenario is the 75th percentile of the average Excess ANC computed across FCMs within each size category. We then take the resulting Excess ANC estimates by size category and multiply them by the number of FCMs presumed to be participating in the FCM Captive in each size category for the three FCM Captive participation scenarios.
Table 16: Excess Adjusted Net Capital Available for FCM Captive by Participation Scenario
# of Contributing FCMs Total Available “Low” Excess ANCa
Total Available “Median” Excess ANCb
Total Available “High” Excess ANCc Small Medium Large
5 1 0 $113,222,700 $1,071,077,344 $2,374,483,003 13 2 0 $236,640,860 $2,172,867,253 $5,045,866,383 26 4 1 $6,256,993,749 $11,500,619,652 $20,275,755,860
a: Total available 25th Percentile Excess ANC calculated across all month-ends in 2012 for all FCMs within size categories corresponding to presumed Contributing FCMs. b: Total available Median Percentile Excess ANC calculated across all month-ends in 2012 for all FCMs within size categories corresponding to presumed Contributing FCMs. c: Total available 75th Percentile Excess ANC calculated across all month-ends in 2012 for all FCMs within size categories corresponding to presumed Contributing FCMs. Source: CFTC.
As a comparison of the results in Table 16 with Table 15 indicates, available Excess ANC seems to be sufficient to support Participation Scenario 1 (i.e., 5 Small Participating FCMs and one Medium participating FCM) even in the scenario where available capital is measured as the 25th percentile Excess ANC estimate within each size category across average Excess ANCs for all of 2012. Nevertheless, as noted earlier, ANC and Excess ANC are measures of regulatory capital, not available capital, and the available capital from FCMs participating in the FCM Captive might be more limited than the Excess ANC numbers shown in Table 16.
(3) External Resources for Funding the First-Loss Retention A lack of available paid-in capital from FCMs participating in the FCM Captive is not immediately a “dead on arrival” scenario for a fully funded FCM Captive. Various risk finance solutions are available in the reinsurance market that would essentially enable Participating FCMs to combine the true risk-transfer function of reinsurance with the economic equivalent of a lending facility.
For example, one or more reinsurers could in effect loan the FCM Captive the required capital to support the required first-loss layer. Actual paid-in capital then could be built up in the FCM Captive over time through premium contributions with corresponding rebates to FCM participants for low-loss or no-loss risk periods. The “loan” would be repaid by deducting a portion of the premium for that purpose. Although such programs (known generally as “finite reinsurance” facilities) have in the past been subject to criticism for involving insufficient actual
Page 81

risk transfer, properly constructed finite risk reinsurance programs remain a staple of the structured reinsurance industry.110
(4) Initial Capital vs. Subsequent Capital Requirements Virtually all (re-)insurance contracts have a tenor of one year. In other words premium covers claims payments for one year, subject to the first-loss retention or deductible and the policy limit. As such, the need for an FCM Captive to cover the first $50 million of CAPI payments will renew each year when customer CAPI policies and any reinsurance agreements renew.
As long as there are no losses and CAPI claims, Participating FCMs will not need to make any additional capital contributions. Indeed, initial capital contributions of FCMs even could be reduced (e.g., the FCM Captive pays a dividend to its participating members) as interest accrues on the assets held by the FCM Captive.
By contrast, if the entire first-loss layer of $50 million was paid out to customers of a failing participating FCM over the reinsurance policy year, the remaining FCM participants will need to “recharge” the FCM Capital with an additional $50 million contribution when the CAPI policies and reinsurance are renewed.
D. FICAP Insurance Co.
Based on the data we provided and our request to prospective insurers and reinsurers for Scenario #3 and the FCM Captive, we received an indicative term sheet for the provision of CAPI to U.S. FCMs by an FCM Captive called the Futures Industry Customer Asset Protection Insurance Company (“FICAP”).
Although we received only this single response, it reflects the collective pricing analysis and available capacity of multiple reinsurers. The fact that these multiple reinsurers chose to provide a single response to us is an indication of the seriousness of their interest in CAPI provision. Had the individual reinsurers wished to provide us only with hypothetical indications of cost and capacity, they would have done so individually. That the reinsurers provided a single indicative term sheet as a syndicate therefore suggests that their interest is more than academic and is in fact a commercially viable and “real” proposal.
(1) Capacity and Term The indicative term sheet we received indicates an initial total aggregate CAPI limit of $300 million, of which $50 million would be a retained first-loss deductible by FICAP. The $250 million in CAPI coverage in excess of the first-loss $50 million retention would be ceded to the reinsurance syndicate. In other words, customers of the Participating FCMs would have a total of $300 million available to cover losses arising from the failure of under-segregated Participating
110 See, e.g., C. L. Culp and J. B. Heaton, “The Uses and Abuses of Finite Risk Reinsurance,” Journal of Applied Corporate Finance, Vol. 17, No. 3 (Summer 2005).
Page 82

FCMs. Under-segregation losses arising either from misfeasance or malfeasance or fellow-customer risk are both covered by the contemplated policy.
The term of the reinsurance program for FICAP would be one year, which, as noted earlier, is the norm in insurance and reinsurance markets.
(2) Reinsurance Syndicate The majority of the capacity is expected to be provided by Lloyd’s of London (currently rated A+ by Standard & Poor’s and described earlier in Section VIII.D.3). Discussions have taken place with several Lloyd’s syndicates, three of which are interested to move forward immediately (with one reinsurer having already expressed a desire to be the lead underwriter). In addition, other reinsurers domiciled in Bermuda and Switzerland have expressed interest in providing part of the $250 million reinsurance capacity to FICAP. These additional reinsurers have contributed to the indicated pricing range discussed in Section IX.D.6 below. We refer to these parties underlying the proposal we received as the “FICAP Reinsurance Syndicate.”111
(3) Participating FCMs The FICAP proposal (including capacity and premium cost indications) is based on an assumed initial group of four to 10 Participating FCMs that either are Small FCMs or on the small side of Medium FCMs. FICAP’s initial participation assumptions thus are very similar to our Participation Scenario #1 as discussed in Section IX.B (i.e., 5 Small FCMs and 1 Medium FCM).
To mitigate moral hazard and adverse selection (see Section VII.A), FCMs participating in FICAP are required to satisfy minimum criteria regarding their risk profiles, management regimes, and risk-management and internal control frameworks. These minimum participation criteria will be established by the FICAP Facility Manager, subject to oversight by FICAP’s Board of Directions (both of which are discussed in the next section).
(4) Facility Manager and Board of Directors The FICAP proposal assumes that FICAP itself would be a participant in a rent-a-captive or protected cell company (“PCC”).112 In other words, FICAP would not need to form a specific stand-alone captive insurance company but instead could “rent” space on the balance sheet of an existing captive in a manner that segregates (in a bankruptcy-remote manner) the activities and assets of FICAP from other participants in the captive. This has the advantage of allowing FICAP to avoid the costs of establishing its own captive, which, among other things, allows
111 We emphasize that FICAP does not yet exist as an entity, and that the composition of this FICAP Reinsurance Syndicate would not be finalized until actual negotiations about a specific transaction occur. We use the term FICAP Reinsurance Syndicate only for expositional simplicity. 112 For explanations of these types of entities, see Culp (2006), op. cit., Chapter 23.
Page 83

FICAP to leverage the existing claims processing and administration infrastructure of the protected cell company rather than create its own from scratch.
The operations of FICAP would be managed by a reputable risk management company with a proven track record. The FICAP proposal indicates that this Facility Manager would receive a one percent fee per annum in return for managing the FICAP entity. The Facility Manager’s responsibilities would include the following:
• Collect premiums from Participating FCMs;113 • Process CAPI claims (including any loss adjustment process); • Pay authorized claims; • Manage the reinsurance program (e.g., file reinsurance claims on behalf of FICAP, liaise
with the lead reinsurance underwriter, oversee the annual renewal of the reinsurance, etc.); • Direct the investment of FICAP’s assets (subject to an approved investment policy); • Determine any customer-specific inner limits (see Section VII.F.2); • Determine any premium adjustments for Participating FCMs; • Set and administer minimum criteria for Participating FCMs (e.g., determine and evaluate
acceptable risk profiles and management regimes at Participating FCMs, determine and evaluate risk management and internal control regimes at Participating FCMs, etc.); and
• Underwrite on behalf of the reinsurers and monitor the credit profile of FCMs using appropriate credit surveillance methodologies.
FICAP and the Facility Manager would be subject to oversight by a board of directors that would be comprised (at a minimum) of representatives of each participating FCM. The board of directors would be responsible for approving the investment policy governing the investment of FICAP’s assets, approving the reinsurance program, and the like. Because the board would primarily be comprised of FCMs directly impacted by the reinsurance, the board would have no role in the underwriting process.
(5) Maximum Payout Per Loss As discussed in Sections VII.F.2 and VIII.D.3, the use of inner limits (i.e., per-occurrence or per-entity limits inside an aggregate program limit) is relatively common. In that regard, FICAP proposes a potential maximum payout per loss of $50 million. In that case, the maximum payout by the reinsurance syndicate per FCM failure is $50 million for customers of the failed FCM. In consequence, the $250 million of reinsurance available to FICAP is only available to cover $50 million in losses per FCM and is only triggered if more than one FCM fails in a policy year.
Some customers and FCMs may be concerned with the maximum payout per loss limitation of $50 million. On the one hand, a $50 million per-FCM limit would be adequate to cover the CEL of the Small and Medium FCMs in many circumstances. As Table 9 indicates, the per-FCM CEL for a Small FCM (based on 2012 data reported by 52 FCMs) is $11,280,410 assuming a one
113 Premiums might be paid by FCM customers directly or by FCMs on their customers’ behalf.
Page 84

percent AEP (i.e., one-in-100-year loss event).114 The per-FCM CEL for a Medium FCM at a one percent AEP – i.e., $45,143,513 as indicated in Table 9 – is also below the $50 million FCM-specific inner limit proposed by FICAP.
On the other hand, CELs are long-term expected or average losses, and any given FCM failure may generate customer losses well in excess of CELs or the proposed $50 million inner limit on FICAP’s Participating FCMs. For example, as discussed in Section III.A.2, an estimated $215 million in §4d customer-segregated funds were inappropriately and wrongfully diverted at PFG (which was a Small FCM at the time of its failure). Had FICAP been in place and had PFG been a FICAP participating FCM, PFG’s customers thus would only have received up to $50 million, still leaving an approximate $165 million customer loss.
The proposed $50 million per-loss limit was included in part to facilitate the provision of specific premium cost estimates. A $100 million per-loss limit, for example, might also be possible, but would result in different premium cost estimates than those summarized in Section IX.D.6. Similarly, a redefinition of the risks that FICAP would underwrite might also lead to a change in the FICAP Reinsurance Syndicate’s premium quotations and request for inner limits. In particular, if FICAP only provided CAPI to customers of Participating FCMs to cover the risk of losses from misfeasance or malfeasance (and not fellow-customer risk), we have indications that the costs of the reinsurance would be lower and/or the inner limits less restrictive.115
(6) Premium Cost The FICAP Reinsurance Syndicate indicates a cost for the reinsurance of five to eight percent annually. This cost estimate reflects the range of prices and attachment points indicated by prospective reinsurers. The final price will be an average number in the indicated range. The final price, moreover, will also depend on the specific Participating FCMs (e.g., the number of FCM customers, asset balances of those customers, risk-management capabilities of the FCM, and other FCM-specific characteristics to be analyzed in the underwriting process).
Together with the Facility Manager’s fee, the all-in cost to FICAP’s Participating FCMs and their customers thus would be in the range of six to nine percent of the $300 million aggregate program size. The total premium would thus be between $18 million to $27 million per year, equal to a $3 million Facility Manager’s fee plus a reinsurance premium of $15 million (low) or $24 million (high).
The FICAP proposal indicates that FCMs would be assessed premium charges on a pro rata basis.116 Specifically, the pro rata calculation is based on each FCM’s potential claims payments.
114 As Table 9 further indicates, lower AEPs result in even lower CELs – i.e., $5,640,205 and $2,256,082 CELs for Small FCMs assuming AEPs of 0.005 and 0.002, respectively. 115 Reinsurers may be concerned that FCM failures are likely to be more correlated in time if caused by fellow-customer losses, whereas FCM failures arising from misfeasance or malfeasance are more likely to be uncorrelated across FCMs and with market disruption events. 116 The FICAP proposal also indicates that the Facility Manager can adjust per-FCM premiums up or down from the base pro rata amounts to address any specific risk adjustments required for a particular FCM and its customers
Page 85

Because the inner limit restricts maximum payouts per loss to $50 million, each FCM (regardless of its size category) bears an equal share of the premium cost. Table 17 shows examples of the per-FCM premium allocations based on the number of Participating FCMs for both the low and high ends of the indicated FICAP premium range. Obviously the per-FCM premium declines as the number of Participating FCMs increases.
Table 17: Indicative Allocation of FICAP Premiums to Participating FCMs # of Participating FCMs Total Premium = 6% per annum Total Premium = 9% per annum
1 $18,000,000 $27,000,000 5 $3,600,000 $5,400,000 10 $1,800,000 $2,700,000
Participating FCMs are likely to pass along some or all of their premium costs to customers. Any such allocation of premium costs would presumably take into account the significant differences in customer asset exposures (as discussed in Section V.B and shown in Tables 5 and 6) to align the proportion of CAPI costs borne by individual customers with the potential CAPI payments they would receive in the event of an FCM’s failure.
As an illustrative example, assume that five Small FCMs and one Medium FCM participate in FICAP. Small and Medium FCMs have numbers of customers equal to the maximum number of customers in any month during 2012 at either of the two Contributing FCMs in each size category (as shown in Table 4). Rounding to the nearest 10, a Small FCM thus is assumed to have 2,360 customers, and a Medium FCM is assumed to have 54,670 customers.
One potential allocation of premium costs to customers would be a pro rata allocation based on the amount of assets the customer had at the FCM in the previous year as a percentage of the FCM’s total customer assets.117 For the example, we use the data from the two Contributing FCMs in each of the Small and Medium size categories to divide customer asset balances during 2012 into size deciles.118 We then assume that 10 percent of the FCM’s customers had a previous-year asset balance equal to the maximum of the range for each decile. The FCM’s total CAPI premium cost is then allocated to customers in each size range (based on the prior year’s numbers) on a pro rata basis.
The allocation of the total CAPI payment to the FCM (up to the maximum per-claim inner limit of $50 million in the FICAP proposal) is also pro rata, but is based on the “Covered Loss Rate” for the FCM, defined as the maximum possible $50 million CAPI payment divided by the total loss of customer assets. To be conservative from a reinsurer’s perspective, assume that the failure of the FCM results in a loss of all customer assets with no subsequent recoveries. As such, the
relative to other participants. Because this aspect of premiums depends on the actual FCMs that participate, we do not address this adjustment here. 117 The CAPI premium and benefit customer allocation rules discussed here are offered purely for illustrative purposes. Other potential allocation scenarios could easily be defined. 118 More specifically, we estimate the customer assets based on the first nine deciles (i.e., 10th percentile, 20th percentile, 30th percentile, and so forth up to the 90th percentile). For the last decile, we use the 95th percentile for the Small FCM and the 97th percentile for the Medium FCM. We do not use the 100th percentile in order to exclude outliers, and we use a higher percentile for the Medium FCM to generate a larger maximum customer asset size.
Page 86
total loss of customer assets (before CAPI payments) is equal to the total customer assets of the FCM. Each customer thus receives back a percentage of its lost assets equal to the FCM’s overall Covered Loss Rate – i.e., all customers in this example are presumed to recover the same fraction of their assets.
Table 18 shows a summary of this example. Specifically, Panel (a) of Table 18 shows the potential per-customer benefits and costs of CAPI for the Small FCM, and Panel (b) shows similar information for the Medium FCM. With six FCMs participating, the low per-FCM premium is $3,000,000 per annum and the high per-FCM premium is $4,500,000 per annum.
As Panel (a) of Table 18 shows, the Small FCM has a total of about $101.2 million in assets, a total of 2,360 customers, and a Covered Loss Rate of 49.41%. The absolute amounts of premiums charged to customers range from $2.79 to $8,314.12 per annum for the six percent FICAP premium, and from $4.18 to $12,471.17 per annum for the nine percent FICAP premium. In return for paying these premiums, customers in the smallest size category with $94 in assets would each receive $46.44 out the total $50 million CAPI payment, customers in the largest size category with an assumed $280,469 in assets would each receive $138,568.59 in CAPI payments, and similarly for other customer sizes.
In terms of assessing the net benefit of CAPI, all customers of all sizes in this example have the same ratio of premium cost to CAPI payments. For the six percent total CAPI premium, the ratio of premium costs to CAPI payments is six percent. For the nine percent total CAPI premium, the cost/benefit ratio is nine percent. In other words, for every dollar of CAPI protection, customers are charged from six to nine cents per annum of the actual premium charged.
Page 87

Table 18: Potential Allocations of CAPI Benefits and Costs to FCM Customers – 5 Small FCMs and 1 Medium FCM Participating in FICAP
Customer Assets by Size Ranges Benefits and Costs of CAPI Per Customer Assets per Customera
No. of Customersb
Total Assets in Size Rangec
% of Total Assetsd
CAPI Paymente
Premium Cost (6% Scenario)f
Premium Cost (9% Scenario)f
Panel (a): Small FCM Covered Loss Rate = 49.41%g
Low CAPI Premium (6%) Allocated to FCM = $3,000,000 High CAPI Premium (9%) Allocated to FCM = $4,500,000
$1-$94 236 $22,184 0.02% $46.44 $2.79 $4.18 $95-$330 236 $77,880 0.08% $163.04 $9.78 $14.67
$331-$957 236 $225,852 0.22% $472.82 $28.37 $42.55 $958-$2,259 236 $533,124 0.53% $1,116.08 $66.96 $100.45
$2,260-$4,434 236 $1,046,424 1.03% $2,190.66 $131.44 $197.16 $4,435-$7,370 236 $1,739,320 1.72% $3,641.22 $218.47 $327.71
$7,371-$13,244 236 $3,125,584 3.09% $6,543.33 $392.60 $588.90 $13,245-$27,293 236 $6,441,148 6.36% $13,484.39 $809.06 $1,213.59 $27,294-$92,373 236 $21,800,028 21.54% $45,637.83 $2,738.27 $4,107.40 $92,374-$280,469 236 $66,190,684 65.40% $138,568.59 $8,314.12 $12,471.17
Totals: 2,360 $101,202,228 100% $50,000,000.00 $3,000,000.00 $4,500,000.00 Panel (b): Medium FCM
Covered Loss Rate = 1.59%g Low CAPI Premium (6%) Allocated to FCM = $3,000,000 High CAPI Premium (9%) Allocated to FCM = $4,500,000
$1-$50 5,467 $273,350 0.01% $0.79 $0.05 $0.07 $51-$352 5,467 $1,924,384 0.06% $5.59 $0.34 $0.50
$353-$1,182 5,467 $6,461,994 0.21% $18.76 $1.13 $1.69 $1,183-$2,685 5,467 $14,678,895 0.47% $42.61 $2.56 $3.83 $2,686-$5,089 5,467 $27,821,563 0.88% $80.76 $4.85 $7.27 $5,090-$9,200 5,467 $50,296,400 1.60% $146.00 $8.76 $13.14
$9,201-$16,854 5,467 $92,140,818 2.92% $267.46 $16.05 $24.07 $16,855-$33,415 5,467 $182,679,805 5.80% $530.27 $31.82 $47.72 $33,416-$90,255 5,467 $493,424,085 15.66% $1,432.26 $85.94 $128.90 $90,255-$417,245 5,467 $2,281,078,415 72.40% $6,621.30 $397.28 $595.92
Totals: 54,670 $3,150,779,709 100% $50,000,000.00 $3,000,000.00 $4,500,000.00 a: The first nine ranges of per-customer assets reported for the Small and Medium FCMs are based on the first nine percentile ranges for customer assets at the two Contributing FCMs (in each size category) during 2012, as summarized in Table 5. To avoid the influence of outliers in the data, the high range is based on the 95th percentile customer account size for the Small FCM and the 97th percentile customer account size for the Medium FCM. b: The total number of customers for each FCM is equal to the maximum number of customers reported by either of the two Contributing FCMs in each size category during 2012 (as shown in Table 4) rounded to the nearest 10. c: Total assets for each FCM within each customer asset size range is equal to the number of customers in that range multiplied by the maximum value of the range itself. For example, in the first row of Panel (a) the total assets in the $1-$94 size range is equal to 236 customers times $94, or $122,184. d: The percentage of total assets is the total assets in each size range divided by the total assets of the FCM as shown in the third column of the last row of each panel. e: The CAPI payment per customer is equal to the total assets in the size range multiplied by the Covered Loss Rate (as defined in footnote g) and divided by the number of customers in each size range. f: The CAPI premium cost per customer in each size range is equal to the total CAPI premium allocated to the FCM divided by the number of customers in each size range and multiplied by the total customer assets in each size range as a proportion of the FCM’s total customer assets. g: The Covered Loss Rate for each FCM is equal to the $50 million per-loss maximum payment under the indicative terms in the FICAP proposal divided by the total customer assets at the FCM.
Panel (b) of Table 18 presents similar information for the Medium FCM. The Medium FCM has a total of about $3.15 billion in customer assets, a total of 54,670 customers, and a Covered Loss Rate of only 1.59%. The Covered Loss Rate is much lower for the Medium FCM than for the Small FCM because the total loss (presumed equal to total customer assets) for the Medium FCM is much higher, but the maximum per-FCM limit of $50 million is the same as it was for the Small FCM. No matter the size of customer’s assets on deposit with the Medium FCM, the pro rata allocation of the CAPI benefit means that all customers would receive a CAPI payment of no more than 1.59 percent of their assets.
Page 88

Because the Medium FCM has many more customers than the Small FCM, per-customer premium costs are much lower for customers of the Medium FCM. Small customers with $50 in assets would pay between $0.05 and $0.07 per year in premium, whereas a larger customer with $417,245 in assets would pay between $397.28 and $595.92 in annual premiums.
(7) Funding the First-Loss Retention The FICAP Reinsurance Syndicate proposes a fully funded $50 million first-loss layer (see Section IX.C). The FCMs participating in FICAP, however, would not be required to contribute paid-in capital in the full amount of the first-loss retention. Instead, the FICAP Reinsurance Syndicate proposes that the first-loss retention could be at least partially funded by a group of external investors. Participating FCMs would be required to provide some unspecified amount of paid-in capital to align incentives and ensure they have adequate skin in the game, but FICAP indicates that the bulk of the first-loss layer could potentially be funded externally.
Specifically, suppose (hypothetically) that the reinsurance syndicate demands that the first $10 million of losses must be funded through paid-in capital contributions by the Participating FCMs on a pro rata basis. The next $40 million of losses in excess of the first $10 million in losses thus might be funded by external investors.
Assuming no under-segregated FCMs fail and/or no significant CAPI claims, investors in the first-loss layer would be repaid over time from interest earned on the $10 million in paid-in capital (from the Participating FCMs) plus a “ceding commission.” A ceding commission is essentially a credit by a reinsurance syndicate to a cedant to cover the acquisition cost of originating the policy. Such costs include premium taxes, actuarial and accounting fees, underwriting/due diligence expenses, travel and, if a broker is involved, the broker’s commission.
(8) Founder Group Benefits The FICAP proposal also outlines a potential benefit for the initial FCM participants in FICAP. As discussed in the previous section, any interest earned on FICAP’s assets and ceding commissions would first be used to repay the external investor for the principal and interest of their loan to fund the first-loss retention. Once those loans have been repaid and FICAP’s assets have grown to $50 million, interest on FICAP’s investments and ceding commissions could be used to reduce future premiums for those initial FCMs, in effect creating a type of capital rebate.
E. Financing for Immediate CAPI Payments to Customers
As discussed in Section VIII.E, a significant concern amongst some U.S. futures customers is that, following an FCM failure, their funds may be frozen or inaccessible for a relatively long period of time while the bankruptcy trustee processes and reviews claims and attempts to recover assets. The existence of a CAPI policy does not automatically relieve customers of those concerns. Insurance usually involves a loss adjustment process (see Section VII.A) in which the amount of the claim is assessed and verified by the insurer, which can also be a lengthy process.
We did not request and did not receive specific indications of cost for a bank wrap or credit facility (see Section VIII.E.1) for the proposed FICAP facility. The reason we did not request
Page 89

this information is that it is beyond the purview of reinsurers to provide specific terms or cost estimates for what is essentially a banking product.
Nevertheless, the market participants with whom we spoke agree that short-term financing may be (i.e., subject to banks’ willingness to provide it) available to provide customers of failing under-segregated FCMs with bridge financing. Specifically, FICAP could negotiate a $300 million secured line of credit with a bank or bank syndicate in which the funding for FICAP’s first-loss layer and the reinsurance receivable would serve as the collateral.
The secured line of credit would enable FICAP to make CAPI payments immediately following the failure of an FCM without engaging in a lengthy loss adjustment process. Asset recoveries by the bankruptcy or SIPA trustee could then occur over time without depriving customers to replacement funding. Similarly, reinsurance claims (based on losses net of recoveries) could also be processed in the normal course of business without making customers wait for the resolution of that process to receive their funds.
Such facilities, however, are not inexpensive. Pricing for this type of secured line of credit is generally based on the weighted-average credit rating of the reinsurers, the cost of regulatory and economic capital to the banks providing such a facility, and a “liquidity premium” banks charge to cover this kind of bridge financing risk. Based on several similar facilities that the market participants with whom we spoke have structured, the fee for such a secured line of credit could be as much as five per cent per annum (relative to the $300 million facility size) or more.
Page 90

PART 3: GOVERNMENT-MANDATED, UNIVERSAL CAPI
X. SELECTED EXAMPLES OF GOVERNMENT-MANDATED, UNIVERSAL INSURANCE SCHEMES
The fourth Scenario we analyzed is a government-mandated, universal CAPI scheme. In the wake of MFG, some have called for the creation of such a scheme as another way to help restore customers’ confidence in the safekeeping of their assets. For example, MFG’s SIPA Trustee recommends the establishment of a “protection fund for futures and commodities customers.” The Trustee indicates that about 78 percent of all FCM customers’ claims were below $100,000 and that two-thirds of the MFG FCM customer claimants represented less than $200 million, or less than three percent of MFG’s total required customer segregation amount. The MFG SIPA Trustee thus recommends:
A fund capped at a relatively low dollar amount per customer would suffice to make these customers whole very quickly even in a case with a shortfall the size of MFG’s. With such a fund in existence, three-quarters of MFG’s commodities customers would not have been subject to any loss and could have been made whole within days of the bankruptcy filing. A protective fund of this nature could be modestly funded and maintained at a minimal cost until such time as necessary to advance funds to customers, thereby allowing them to resume trading with little or no delay. The fund could be replenished by industry assessments when needed to satisfy claims in FCM failures.119
There are several existing government-sanctioned customer asset protection schemes in financial markets.120 Although partially privately funded, these insurance funds are either direct governmental creations (with commensurate financial government backstops) or are formally tied to an existing regulatory and supervisory system. We discuss in the next sections the several government-backed insurance schemes that are most similar to what a government-mandated, universal CAPI scheme for U.S. futures is likely to resemble.
A. SIPC
Most failing securities brokerage firms that are liquidated pursuant to the Securities Investor Protection Act of 1970 (“SIPA”) in what is called a SIPA proceeding.121 In a typical SIPA proceeding, the SIPC is either appointed as a trustee or works with a court-appointed trustee of
119 MFG Trustee Report, op. cit., p. 175. 120 More such schemes exist than we review in this report. We focus here on the government-backed, universal-coverage programs that are closest to the proposals which have been advanced for a comparable U.S. futures customer protection scheme. 121 15 U.S.C. §§78aaa et. seq.
Page 91

the failed brokerage to try to recover assets and distribute cash and securities to customers of the failed brokerage.
(1) SIPC Coverage and Claims Experience SIPC essentially performs an insurance function for certain customer assets at failed SIPC-member brokerages. Specifically, SIPC provides coverage for customers with eligible claims of up to $500,000 for securities and up to $250,000 for cash regardless of the actual assets available at the failed brokerage.122 To the extent that the brokerage has assets in excess of those amounts or (more likely) that the SIPA trustee can recover additional assets, claims in excess of those “policy limits” can be honored.
Since SIPC’s inception, a total of 325 proceedings have commenced pursuant to SIPA – i.e., an average of about eight cases per year. In the last 10 years, the average annual number of SIPA proceedings fell to two.123 Exhibit 9 below shows the total number of SIPA proceedings per year since SIPC’s inception.
Exhibit 9: Number of SIPA Claims Per Year, 1971-2012
122 The Dodd-Frank Wall Street Reform and Consumer Protection Act increased SIPC’s cash coverage amount from $100,000 to $250,000. For any SIPA claims filed prior to July 22, 2010, cash claims by customers covered by SIPC were limited to $100,000. 123 SIPC Annual Report (2012), p. 6.
0
5
10
15
20
25
30
35
40
45
1971
1972
1973
1974
1975
1976
1977
1978
1979
1980
1981
1982
1983
1984
1985
1986
1987
1988
1989
1990
1991
1992
1993
1994
1995
1996
1997
1998
1999
2000
2001
2002
2003
2004
2005
2006
2007
2008
2009
2010
2011
2012N
umbe
r of S
IPA
Proc
eedi
ngs
Proceedings Completed Customer Claims Satisifed, Litigation Pending Customer Claims Being ProcessedSOURCE: SIPC Annual Report (2012)
Page 92

From 1970 through 2012, cash and securities distributed to customers of the 325 failed brokerages totaled about $120.7 billion across more than 625,200 customer claims. Of those 625,200 claims, only 351 were for cash and securities with values above the SIPC policy limits.124 Of the total $120.7 billion that SIPC has paid to customers from 1970 through 2012, roughly $119.6 billion came from the estates of the failed brokerages (including assets recovered by trustees). The remaining $1.1 billion was paid out of the SIPC Fund, which, for purposes of this study, is analogous to an insurance fund.125
To satisfy guaranteed customer claims and cover the trustee’s expenses of liquidating failed brokerages, SIPC makes advances to the SIPA trustee. Table 19 shows the ranges of the amounts of these advances and the number of proceedings falling into those ranges. A total of $2,070,830,004 in advances was made over the SIPC’s life through 2012. Over the same time period, SIPC recovered $13,991,621 from assets recovered by SIPA trustees in individual proceedings and from the appreciation in the assets of failed brokerages. The total amount advanced of $2,056,838,383 reflects about $1.1 billion paid to customers (as noted earlier) and approximately $923.8 million in advances that covered the administrative expenses of SIPA trustees. In other words, about 45 percent of all SIPC advances were used by SIPA trustees to cover administrative expenses and not to pay customer claims.
Table 19: Net Advances from SIPC Fund, 1970 – 2012 Amounts of Net Advances # of SIPA Proceedings Amounts Advanced
>$40,000,001 1 $1,505,717,477 $10,000,001-$40,000,000 12 $243,865,587 $5,000,001-$10,000,000 18 $131,237,905 $1,000,001-$5,000,000 60 $133,531,711 $500,001-$1,000,000 38 $28,173,672 $250,001-$500,000 42 $14,541,020 $100,001-$250,000 60 $9,692,672 $50,001-$100,000 42 $2,995,426 $25,001-$50,000 24 $879,779 $10,001-$25,000 11 $168,668
$0-$10,000 10 $26,087 Net Recovery 7 ($13,991,621) Total Cumulative Net Advances $2,056,838,383 Advances for Accounts of Customers $1,133,026,649 Advances for Administrative Expenses $923,811,734 SOURCE: SIPC Annual Report (2012).
(2) SIPC’s Claims-Paying Resources SIPC advances are paid from the assets in the SIPC Fund. The SIPC Fund is financed by mandatory assessments on SIPC members – at present, equal to 0.25 percent per annum of each member’s annual net operating revenues126 – as well as interest earned on the Fund’s assets. Table 20 summarizes the revenues of SIPC in each year from 2008 through 2012, the sources of
124 SIPC Annual Report (2012), pp. 6-7. 125 SIPC Annual Report (2012), pp. 7. 126 SIPC member assessment amounts have changed over time. For a complete history, see SIPC Annual Report (2012), p. 9.
Page 93

those revenues, and the size of the SIPC Fund (for comparison). For all five of the years shown, member assessments and contributions averaged about $310.3 million and total revenues averaged about $358.9 million. In 2012, SIPC had a total of 4,364 members. So, the average assessment paid by SIPC members in 2012 was approximately $95,000.
Table 20: SIPC Total Fund Size and Gross Revenues, 2008-2012 2008 2009 2010 2011 2012
SIPC Total Fund Size: $1,699,039,958 $1,091,831,811 $1,181,851,883 $1,431,845,772 $1,599,605,253 SIPC Gross Revenues: Member Assessments & Contributions $816,322 $346,299,978 $409,200,016 $382,800,000 $412,305,529
Interest on US Govt Securities $67,597,794 $56,636,031 $38,160,886 $39,412,362 $39,995,610
Interest on Assessments $3,337 $304,378 $170,336 $420,086 $149,872 Total Gross Revenues $68,417,453 $403,240,387 $447,531,238 $422,632,448 $452,451,011 SOURCE: SIPC Annual Reports (2008-2012).
Exhibit 10 shows the total value of the SIPC Fund from 1971 through the end of 2012. The target size of the SIPC Fund, however, has not always matched the actual size of the SIPC Fund. When SIPA was adopted in 1970, the minimum target funding amount for SIPC was set at $150 million. As Exhibit 10 demonstrates, the SIPC Fund had balances in excess of its target funding level throughout most of the 1980s. In 1991, the SIPC Board increased the funding target for SIPC in an effort to reach a target of $1 billion by 1997. Following the Lehman Brothers and Madoff failures, SIPC again changed its target funding level in 2009 to $2.5 billion.127 Various studies have concluded that SIPC was “adequately funded” during all of these periods.128
127 SIPC Modernization Task Force, Adequacy of the SIPC Fund (June 2010). 128 See, e.g., U.S. General Accounting Office, “Securities Investor Protection: The Regulatory Framework Has Minimized SIPC’s Losses,” Report to Congressional Requesters (September 1992), Fitch Risk Management, “Review of SIPC Risk Profile and Practices: The MJK Clearing Event, the Securities Lending Exposure, Risk Management Practices and Capital Requirements,” Report Prepared for SIPC (January 31, 2003), and SIPC Modernization Task Force (June 2010), op. cit.
Page 94

Exhibit 10: Value of SIPC Fund, 1971-2012
SOURCE: SIPC Annual Report (2012). An important additional consideration is that the resources available to the SIPC Fund to cover customer claims and authorized advances are not limited to the assets in the SIPC Fund. In addition to those assets, SIPC also enjoys the equivalent of a line of credit to the U.S. Treasury. SIPA provides that “[i]n the event that [the SIPC Fund] is or may reasonably appear to be insufficient” to cover its obligations, the Securities and Exchange Commission (“SEC”) can extend credit to SIPC to cover obligations that it cannot satisfy from the assets in the SIPC Fund. The SEC, in turn, funds this loan by issuing notes to the U.S. Treasury. In this manner, the U.S. Treasury functions as the economic equivalent of a reinsurer of the SIPC Fund for its guaranteed obligations to customers of failed SIPC members. The maximum amount that the SIPC Fund can borrow to satisfy its obligations has generally matched the funding target for SIPC over time and currently is $2.5 billion. Over its history, SIPC has never needed to draw on this credit line.129
B. Canadian Investor Protection Fund
The CIPF is the Canadian analogue of the SIPC. The CIPF was originally formed in 1969 by an agreement between various Canadian SROs and became a governmentally sanctioned entity in 1991. CIPF member firms must be members of the Investment Industry Regulatory Organization of Canada (“IIROC”), which is the national SRO for registered Canadian investment dealers and authorized to oversee its members by recognition orders issued by the Canadian Securities Administrators (“CSA”). The CIPF, in turn, is the only insurance fund authorized by the CSA to provide customer asset protection insurance to IIROC members. CIPF’s unique authority is based on a memorandum of understanding with the CSA and an industry agreement with IIROC.
129 See, e.g., S. Y. Bowen, Prepared Statement, Capital Markets and Government Sponsored Enterprises Subcommittee of the Committee on Financial Services, U.S. House of Representatives (March 7, 2012).
Page 95

(1) CIPF Coverage and Claims Experience The most significant difference between the SIPC and CIPF is that CIPF covers all investment accounts at member firms regardless of whether they hold stocks, bonds, futures, or currencies. Specifically, each account holder is eligible for reimbursement from CIPF for losses of up to $1 million resulting from the failure of a participating broker/dealer. Unlike SIPC, CIPF does not have a limit on cash reimbursements to customers for eligible claims. If the entire $1 million in a customer’s lost assets were in cash, the investor still would be eligible to receive the full $1 million.
Since 1969 when the CIPF was first established, 20 CIPF member firms have become insolvent, and CIPF has paid all eligible customer claims resulting from those failures.130 Table 21 provides details of those insolvencies and the resulting claims paid by CIPF. Over its lifetime, the CIPF has paid a total of just under $36 million (including trustee expenses), and about 43 percent of that total is attributable to the failure of a single firm (i.e., Osler Inc. in 1987). The average cost to CIPF of a member insolvency from 1969 through 2012 was just $1.779 million.
Table 21: CIPF Member Insolvencies and Distributions, 1969-2012 (C$ millions) Insolvent CIPF Member Firm Year Claims & Expenses Net of Recoveries
Malone Lynch Securities Ltd. 1971 $1.546 Andrews & Belanger Co. Ltd. 1971 $0.078 Chartrand, Quinn, Senecal & Co. 1973 $0.139 Blanchard, O’Connor & Co. 1974 $0.036 Atlantic Securities Ltd. 1981 $0.273 Rademaker MacDougall & Co. 1982 $0 First Commonwealth Securities Co. 1986 $1.828 Anglo Securities Ltd. 1986 $0.261 Osler Inc. 1987 $15.532 R. Drapeau Capital Inc. 1989 $0.025 Invescourt, courtier en valeurs mobilières inc. 1990 $0.006 Brault, Guy, O’Brien Inc. 1990 $0.166 McConnell & Co. Ltd. 1991 $2.919 Essex Capital Management Ltd. 1999 $6.123 Maxima Capital Inc. 2001 $0 Rampart Securities Inc. 2001 $3.345 Thomson Kernaghan & Co. Ltd. 2002 ($0.677) MF Global Canada Co. 2011 $2.875 Barret Capital Management Inc. 2012 $1.161 First Leaside Securities Inc. 2012 $0.337 Total: $35.973 Maximum: $15.532 Average: $1.779 SOURCE: CIPF, CIPF Member Insolvencies, http://www.cipf.ca/Public/AboutUs/HistoryofCIPF/CIPFMemberInsolvencies.aspx – last visited November 11, 2013.
130 CIPF, Annual Report 2012, p. 6.
Page 96

Comparing Table 21 with Table 19, two empirical observations are immediately obvious in comparing CIPF to SIPC. First, the frequency and number of insolvencies and resulting claims is much lower for CIPF than for SIPC over their shared history of more than four decades. Second, SIPC’s total distributions and expenses exceed CIPF’s by several orders of magnitude.
(2) CIPF’s Claims-Paying Resources The CIPF has several sources of claims-paying resources. The largest resource is the CIPF general fund, which had a value of about $425 million at year-end 2012 as shown in Panel (a) of Table 22 for the years 2006 through 2012. Panel (b) of Table 22 shows member assessments and investment income over those same years. Those two sources of revenues provide additional claims-paying resources for the CIPF. Regular annual CIPF member assessments are based on the risks of participating members (as opposed to SIPC funding that is based purely on a fixed percentage of gross revenues) and range from a minimum of $5,000 per year up to one percent of a member’s gross revenues.131 As such, broker participants in the CIPF with relatively larger amounts of customer assets or relatively higher risk ratings are required to make a larger contribution to the CIPF than other members.132
Table 22: CIPF Total Fund Size, Gross Revenues, and Expenses for Bank Credit Lines and Insurance, 2006-2012 ($ millions)
2006 2007 2008 2009 2010 2011 2012 Panel (a): CIPF General Fund Balances
CIPF General Fund Size $277.5 $312.6 $345.8 $359.5 $381.6 $409.3 $424.6 Panel (b): Gross Revenues
Member Assessmentsa $29.9 $21.9 $10.6 $9.8 $7.6 $8.7 $9.7 Investment Income $10.6 $12.8 $13.6 $13.3 $13.7 $14.4 $14.4 Total $40.6 $34.7 $24.2 $23.1 $21.3 $23.0 $24.1
Panel (c): Bank Line of Credit Fees and Insurance Expenses
Credit & Insurance Expenses $0.180 $0.455 $0.593 $0.928 $1.028 $1.142 $1.216 Panel (d): Net Provision (Recoveries) for Claims
Customer Claims $1.3 ($2.3) $0.5 ($1.0) ($2.2) $3.1 $0.5 a: Includes regular assessments and assessments for capital deficiencies. Sources: CIPF, Annual Reports (2007-2012) and CIPF, Financial Statements (2011-2012).
In addition to the general fund and its assessment powers on members, the CIPF first purchased the economic equivalent of a reinsurance policy133 in 2007 to reimburse certain payments by the
131 CIPF, 2012 Annual Report, p. 16. 132 http://www.cipf.ca/Public/AboutUs/TheCIPFFund/Fundresources.aspx – last visited October 9, 2013. 133 The CIPF usually refers to its coverage as insurance, but, because the policy indemnifies CIPF for certain CAPI payments that CIPF makes to customers, the policy it is more properly viewed as reinsurance. In some documents, the CIPF does refer to the policy as reinsurance. See, e.g., R. Reszel and B. Love, “Reports from Key Industry Institutions – Canadian Investor Protection Fund (CIPF): Financial Administrators Section,” Presentation at 2007 FAS Annual Conference (Fairmont Chateau Montebello) (September 28, 2007), p. 7.
Page 97

CIPF for payments of eligible customer claims in excess of a $100 million first-loss retention.134 Although the size of the CIPF’s first-loss retention has remained at $100 million in each year since 2007, the coverage has varied. From 2007 through 2009, the policy had an annual limit of $100 million and thus covered eligible payments to CIPF customers from one or more failing members from $100 million up to $200 million. In 2010, the policy covered 70 percent of all losses between $100 million and $200 million.135 In 2011, the CIPF increased its coverage level to $116 million in excess of the $100 million first-loss retention.136 The policy limit was increased again in 2012, and currently provides up to $131 million in coverage in excess of a $100 million first-loss retention.137
One of the main original motivations for the CIPF to procure (re-)insurance for its payments to customers was to increase the overall amount of CIPF’s claims-paying resources while reducing member assessments.138 As Table 22 shows, member assessments in 2006 and 2007 totaled $29.9 million and $21.9 million, respectively. By 2008, total member assessments had fallen to $10.6 million and have remained below $10 million in each year from 2009 through 2012.
The CIPF also maintains a liquidity facility consisting of lines of credit with two chartered Canadian banks. The total amount of the liquidity facility was $100 million from 2006 through 2010. In 2011, the CIPF increased the total size of its liquidity facility to $125 million.139 IIROC provides a guarantee for these lines of credit by pledging to assess its members in the event that the CIPF draws on the lines. In that situation, assessments on members may exceed the otherwise-capped amount of one percent of a member’s gross revenues.140
Panel (c) of Table 22 reports the combined expense of CIPF’s bank credit lines and insurance facility from 2007 through 2012. In 2006, prior to the CIPF’s purchase of insurance, the reported $180,000 annual expense is just for the credit lines. In 2007, the combined cost of the liquidity facility and insurance was about $455,000. If we assume hypothetically that the cost of the bank lines remained unchanged, the implied insurance premium when the facility was put in place in mid-2007 would have been about $275,000, or 0.275 percent of the policy limit. In later years, even assuming counterfactually that the entire combined cost of the bank and insurance programs was attributable to insurance, the implied rate on line (i.e., cost as a percentage of coverage) would not have exceeded one percent. The cost of the CIPF’s insurance thus is substantially below the costs outlined in the FICAP proposal discussed in Section IX.D. One reason for this, of course, may be the historical claims experience of the CIPF – i.e., infrequent claims of relatively small amounts, as discussed in the previous section.
134 CIPF, 2007 Annual Report, pp. 4 & 6. 135 CIPF, 2009 Annual Report, pp. 3 & 7, and CIPF, 2010 Annual Report, p. 19. 136 CIPF, 2011 Annual Report, pp. 4 & 14. 137 CIPF, 2012 Annual Report. 138 See CIPF, 2008 Annual Report, p. 6, and Reszel and Love, op. cit. 139 CIPF, 2011 Financial Statements, p. 11. 140 See, e.g., CIPF, 2007 Annual Report, p. 17, CIPF, 2008 Annual Report, p. 15, CIPF, 2009 Annual Report, p. 17, CIPF, 2010 Annual Report, p. 19,
Page 98

C. Natural Catastrophe State Insurance Programs
Multiple examples of government-sponsored insurance entities exist around the world that provide insurance directly to individuals and/or companies that otherwise may not have access to such insurance because it is deemed to be in the public interest to provide this insurance. Most of these examples involve the underwriting of property insurance to cover losses arising from natural catastrophes.
State-sponsored natural catastrophe insurance funds might at first glance seem dissimilar to government-sponsored CAPI funds. In some structural respects, the programs may indeed differ in important ways. But as regards the underlying risks, CAPI and natural catastrophe funds are similar inasmuch as both types of funds are intended to cover high-severity, low-frequency risks. Two examples of such natural catastrophe insurance programs are discussed below.
(1) California Earthquake Authority For example, the California Earthquake Authority is a publicly managed and largely privately funded organization that provides catastrophic residential earthquake insurance and encourages Californians to reduce their risk of earthquake loss. The California Earthquake Authority was established in 1996 by the California legislature in response to a refusal by insurers to write earthquake coverage following an unexpected severe earthquake that struck California’s San Fernando Valley in 1995.
Although earthquake insurance is required by law in California, only insurance companies who elect to participate in the California Earthquake Authority can offer California Earthquake Authority earthquake insurance policies. To date, over 70 percent of the catastrophic earthquake policies covering residential property insurance sold in the state of California are California Earthquake Authority policies.
The California Earthquake Authority has accumulated almost $4.6 billion in capital since it commenced operations in 1996 through insurance policy sales and conservative investments in diverse, high-quality securities. The premiums charged to customers by the California Earthquake Authority are based on California Earthquake Authority’s assessments of earthquake risk combined with assessments of the value and likelihood of damage to homes and is proportional to the coverage amounts of homeowners’ insurance provided by a California Earthquake Authority participating insurer. The California Earthquake Authority must accept any policy from a participating insurer if it meets eligibility requirements. California Earthquake Authority policies provide a deductible based on the calculated share of loss for which a homeowner is responsible. The California Earthquake Authority’s total claims-paying capacity now exceeds $9.5 billion.
(2) Citizens Property Insurance Corporation Citizens Property Insurance Corporation (“CPIC”) is another example of a government-sponsored insurance entity. In response to the high hurricane activity in Florida, CPIC was established by the Florida legislature in 2002 as a non-profit insurer to provide wind and general property insurance for Florida homeowners who could not obtain coverage in high-risk areas or in private insurance markets. By 2010, CPIC had become the largest property insurer in Florida
Page 99

with almost 1.3 million policies that cover approximately $457 billion in property (i.e., about 18 percent of residential exposure in Florida).
CPIC is responsible for paying hurricane and other covered claims to its policyholders. It maintains three separate accounts: personal lines, commercial lines, and high risk, which are managed separately. The funds are obtained from premiums collected for writing insurance policies. These premiums are determined based on property values and the estimated exposures of a catastrophic event per each account. If CPIC’s funds are depleted (after taking into account any reinsurance payments) following a catastrophic event, assessments are levied (first on policy holders and then on insurance companies) in order to allow CPIC to collect resources to continue paying claims. These assessments are based on a percentage of premiums paid by policyholders.
For every year, CPIC’s excess of revenue over operating costs accumulates on a tax-free basis to provide additional financial resources for the payment of future claims. As of year-end 2012, CPIC’s statutory surplus was $5.1 billion with total assets of $12.2 billion. Over 92 percent of CPIC’s total assets consisted of cash and invested assets which are governed by a conservative investment policy.
(3) Natural Catastrophe State Insurance Programs and Insurance-Linked Securities It is worth noting that since 2011, both the California Earthquake Authority and CPIC sponsored insurance-linked securities (“ILS”) as a source of reinsurance. ILS facilitate the provision of reinsurance by capital markets investors directly to reinsurance purchasers through securitization-like programs. ILS thus expand the capital available to cover insurance risks outside traditional reinsurance markets and into structured credit markets.141
Since August 2011, the California Earthquake Authority has sponsored three separate ILS issuances under its Embarcadero Re program – an initial issuance of $150 million, followed by a second issue in January 2012 of $150 million and a July 2012 issue of $300 million. Similarly, in May 2012 CPIC sponsored the largest single ILS issue to date under its Everglades Re program. Demand for the Everglades Re offering was so strong that the initial planned transaction size of $200 million was substantially increased to $750 million. Whereas earlier ILS structures have typically provided sponsors with only a small portion of their total reinsurance cover requirements, the Everglades Re issue secured 75 percent of CPIC’s projected total reinsurance cover budget.
XI. POTENTIAL GOVERNMENT-MANDATED, UNIVERSAL CAPI PROGRAMS FOR U.S. FUTURES CUSTOMERS
A government-mandated, universal CAPI scheme in which all customers of all U.S. FCMs would be provided with CAPI protection by an insurance fund created, sanctioned, and possibly backed financially by the U.S. Government could take many different possible forms. Yet, only
141 See, e.g., Culp (2006), op. cit., Chapter 22.
Page 100

one such proposal has been concretely advanced to date, and, as such, we focus here on that specific proposal for a Futures Investor and Customer Protection Corporation (“FICPC”) and FICPC Fund.142
A. FICPC
The Futures Investor and Customer Protection Act would establish the FICPC and the FICPC Fund. The proposed customer asset protection scheme would be mandatory and universal and would essentially mimic the protections afforded to securities investors by SIPC.
Specifically, FICPC would provide up to $250,000 to FCM customers as reimbursement for losses sustained from the failure of a CFTC-regulated FCM (apart from losses arising purely as the result of financial market downturns). Following an FCM’s insolvency, its customers would file claims with an FICPC trustee (analogous to a SIPA Trustee, as discussed in Section X.A). The FICPC Trustee would have the authority to transfer customer accounts to non-defaulting FCMs or to liquidate those accounts.
Under this proposal, the FICPC would be funded by mandatory payments from FCMs of up to 0.5 percent of each FCMs’ previous annual gross revenues related to futures trading until reaching a target funding level of not more than $2.5 billion. The proposal further advocates that the FICPC would be governed by a board of directors to be confirmed by a majority vote of the U.S. Senate. In the FICPC, there is no retained first-loss layer by either customers or any other market participants.
B. Analysis of FICPC
A number of potential concerns can be identified in the FICPC scenario. We discuss these issues in the sections below.
(1) Adequacy of Funding Over Time As discussed in Section X.A.2, the target funding level at SIPC’s inception in 1970 was only $150 million. That target funding level was increased to $1 billion in 1991 and again to $2.5 billion in 2009. The size of the government guaranty backing SIPC has also changed over time along with the target SIPC funding level. Because the SIPC Fund and its target funding has generally been regarded by most (until recently) as being adequate, the need for SIPC to rely on its government backstop has been relatively limited.
To establish a FICPC with an inception-date funding target of $2.5 billion, by contrast, would be more problematic from a funding standpoint. In 2012, the 62 FCMs reporting positive annual gross revenues from commodities to CME and NFA had average annual gross revenues of $82.3 million, and the total annual gross revenue for all FCMs was $5.1 billion. In the first year,
142 Statement of CFTC Commissioner Bart Chilton, August 9, 2012.
Page 101

FICPC would receive (based on 2012 gross revenue numbers) an average of $411,635 from each FCM for a total across all FCMs of $25,521,389.143
Assuming no losses or eligible CAPI claims, the FICPC’s Fund assets would grow over time. Yet, the growth rate of FICPC’s assets would be incredibly slow vis-à-vis the target funding level of $2.5 billion. For example, assuming a two percent return on FICPC’s assets each year, an annual contribution by FCMs of $25,521,389 (i.e., assuming gross revenues for futures remains at 2012 levels), and no eligible claims filed, the FICPC would not reach its target $2.5 billion funding level for 55 years.
Exhibit 11 shows the assets of a FICPC Fund under those assumptions and further assuming that the first $25.5 million was paid at the beginning of 2013 based on 2012 gross revenue numbers and that no claims payments are made in the first year. The FICPC Fund would cross the $1 billion asset threshold in 2041 (i.e., 28 years after its inception) assuming no claims and a two percent return on invested assets.
Exhibit 11: Projected Value of FICPC Fund, 2013-2067
The relatively slow growth rate of the SIPC Fund over time vis-à-vis the perceived adequacy of the SIPC Fund, moreover, is not necessarily a good indicator of the adequacy of a FICPC Fund,
143 Numbers may not appear to reconcile because of rounding.
$0.0
$0.5
$1.0
$1.5
$2.0
$2.5
$3.0
2013201420152016201720182019202020212022202320242025202620272028202920302031203220332034203520362037203820392040204120422043204420452046204720482049205020512052205320542055205620572058205920602061206220632064206520662067
$ Bi
llion
s
NOTES: Assumes (i) constant annual contributions to FICPC of $25,521,389 at the beginning of each year (equal to 0.5% of 2012 gross revenues from commodities for all FCMs that reported positive gross revenues in 2012), (ii) that no customers submit eligible CAPI claims to FICPC, and (iii) that FICPC assets are invested in government bonds earning 2% per annum.
Page 102

especially in the early years when its funding level is projected to be relatively low. The reason for this is the fundamental difference between the nature and amounts of many SIPC claims as compared to FICPC claims arising from the failures of under-segregated FCMs.
As shown in Exhibit 9, SIPC has had multiple claims per year in all except three years since its inception. Table 19 indicates, moreover, that all but 13 advances by a SIPA trustee since 1970 have been for amounts of $10 million or less. In other words, only about four percent of SIPA proceedings have involved advances of more than $10 million to customers of failed brokers.
The amount of customer assets at risk from misfeasance or malfeasance and fellow-customer risk, however, are virtually never in the $10 million and under category – far from it. So, unlike the SIPC Fund, a FICPC Fund likely would need significantly more funding than it would actually have available in order to provide credible assurances to customers that their assets are protected in its early years.
The capacity available in a private, voluntary program like FICAP is much smaller than the target funding level contemplated for FICPC. Indeed, under the assumptions discussed above (and reflected in Exhibit 11) the FICPC Fund would reach the $300 million level (i.e., the total capacity of FICAP) in about 10 years. Unlike FICAP, however, FICPC provides universal coverage to all customers of all U.S. FCMs, whereas the FICAP capacity is sized to cover the risk of four to 10 Small or Medium FCMs. Whereas $300 million might be sufficient to cover the risks of four to 10 FCMs, it is not sufficient to cover the risk of all FCMs and their customers.
From a funding perspective, FICPC thus likely makes no economic sense as a credible source of customer asset protection unless a taxpayer-funded government backstop is provided to close any gap between actual FICPC claims and its actual funding level.
(2) Alternative Funding Sources If a government-sponsored CAPI scheme is to go forward, we believe that additional sources of funds apart from SIPC-mimicking 0.5 percent of gross revenues from futures is necessary in order for the protection fund to be plausible. Alternatives to capitalizing such a fund include the following: assessments on FCMs of greater than 0.5 percent of annual gross revenues from futures in the prior year; transaction-based fees; asset-based fees; and government backing.
Assessments on FCMs greater than the SIPC-based 0.5 percent of gross revenue contribution would likely have even more regressive effects than the proposed 0.5 percent. Large FCMs would have an even greater financial obligation with an even lower benefit for their customers. As a result, such a policy might even drive both Large FCMs and their Large Customers offshore to escape the disproportionate costs and consequences of such a scheme.
Financing a CAPI fund based on per-transaction charges has been discussed by some market participants, especially given that mandatory charges to finance NFA are based on the same such per-transaction charges. Yet, any fee that is transaction-based will affect market liquidity. All else equal, a higher per-transaction fee leads to lower transaction volume, less market depth, and potentially higher execution costs in the form of larger bid-ask spreads. The empirical record regarding the impact of financial transaction taxes on market liquidity provides an ample
Page 103

cautionary warning flag for a per-transaction fee as a source of funding a government-sponsored CAPI program.144
Assessing fees on FCMs based on their total customer assets in segregation makes more sense economically than fees based on FCM gross revenues or transaction-based fees because the fees are better-related to the actual risk exposures. Nevertheless, even asset-based assessments will suffer the same problem as all of the private fixed-policy-limit scenarios explored. Namely, uncertainties about the total number of customers will make it extremely difficult to determine an assessment rate that is sufficient to cover the CEL. For the very same reason that customer-specific and FCM-specific CAPI programs will encounter significant problems in reinsurance markets, a government-sponsored fund financed with contributions from FCMs based on total customer assets will be equally difficult to support. If the U.S. Government is the de facto or de jure reinsurer of such a fund, the contingent taxpayer-backed liability could be very significant.
(3) Crowding Out Private CAPI Solutions One of the most significant potential problems with the FICPC proposal is the extent to which the adoption of a universal, mandated FICPC solution would “crowd out” creative, market-based, private, and voluntary CAPI solutions.
For example, suppose a mandated and universal FICPC solution is put into place. As the data plainly show (see, e.g., Table 6), small customers would benefit significantly more than large customers from FICPC. Yet, a private, voluntary facility like FICAP is predicated on a demand for CAPI by those same small customers at primarily Small FCMs. Because FICPC would already provide small customers with a solution that obviates the need for a FICAP-like entity (while at the same time providing no real comfort to Large FCMs and their customers), it is unlikely that Small and Medium FCMs would agree to finance an entity like FICAP with a government-mandated, universal FICPC regime already in place.
As the U.S. securities market experience has demonstrated, basically the only viable private, voluntary customer protection product is Excess SIPC coverage (as discussed in Section VIII.D.3). If a FICPC Fund is established for customers of U.S. FCMs, an analogue to Excess SIPC coverage is likely to be offered. But the FICPC solution would provide a disincentive to (re-)insurance market participants to develop and provide more tailored CAPI solutions that better align the demands of specific market participants with the supply of risk capital.
(4) Mismatch of Funding Sources and Main FICPC Beneficiaries Another concern with the FICPC plan is the mismatch between sources of funds and customers being protected. By funding the FICPC as a fixed percentage of gross revenues from FCMs’ futures businesses, the FICPC gets most of its assets from large bank-affiliated FCMs. In 2012, a total of 70 FCMs reported positive annual gross revenues from commodities to CME and NFA in
144 See, e.g., C. L. Culp, Financial Transaction Taxes: Benefits and Costs, Compass Lexecon White Paper (March 2010).
Page 104

their capacities as DSROs. The 10 FCMs with the highest amounts of customer assets at year-end 2012 would have accounted for 44 percent of the FICPC funding.
Yet, the median value of customer assets on deposit at Large FCMs in 2012 was roughly $1.4 million, as compared to median customer assets on deposit at Small and Medium FCMs in 2012 of $4,434 and $5,089, respectively. (See Table 5.) As such, the proposed funding scheme for the FICPC would not require the customers that benefit most from FICPC coverage to provide a proportional amount of the funding.
Page 105

PART 4: APPENDICES
APPENDIX 1: COMPASS LEXECON PROJECT TEAM
Study Director and Principal Report Author:
• Christopher L. Culp, Ph.D., is a Senior Advisor with Compass Lexecon, Managing Director of Risk Management Consulting Services, Inc. (“RMCS”), Adjunct Professor of Finance at The University of Chicago’s Booth School of Business, and Honorarprofessor and Professor for Insurance at Universität Bern (Switzerland) in the Institut für Finanzmanagement. He has written four books and co-edited two books and numerous articles about derivatives, risk management, insurance, and/or structured finance. He is on the editorial advisory boards of several industry journals, including Futures Industry magazine. Prof. Culp also has extensive practical consulting experience in derivatives, risk management, (re)insurance, and clearing/settlement. He received his Ph.D. with a concentration in finance from The University of Chicago’s Booth School of Business.
Study Team Members
• H. Neal Lenhoff is an Executive Vice President at Compass Lexecon. His areas of expertise include empirical analysis of very large sets of data, as well as projects with complex programming issues and forensic data analysis. He has extensive experience in the securities and derivatives industries and has managed the empirical work on many high-profile securities-related matters.
• Andrea M. P. Neves is President of Seven Consulting, Inc., and a regular collaborator with both Compass Lexecon and RMCS. Ms. Neves has graduate degrees in both finance and physics and has extensive experience in evaluating the risk attributes of DCOs and risk management processes in general. Ms. Neves is an expert in the areas of derivatives clearing and settlement.
• Paul Palmer is President of Equifin Risk Solutions, which provides customized trade-related credit risk transfer solutions to its bank and corporate clients in the United States and abroad using captive insurance facilities which it owns and manages. He is the former CEO of Capital Credit, a risk advisory and securitization firm that bridged the worlds of insurance and structured finance. Prior to that, Mr. Palmer was President of Enhance Structured Products at Asset Guaranty/Enhance Financial Services Group, where he was responsible for creating credit risk transfer products for financial institutions and industrial corporations globally. He started his career at AIG in credit and product development.
• David J. Ross is an Executive Vice President at Compass Lexecon. He is the author of several academic articles on topics in finance and the economic analysis of law. He also has served as a consulting and/or testifying expert on numerous matters involving financial economics, and the economic analysis of law.
• Bettina J. Stärkle is a Consultant with RMCS. She previously worked in the Swiss banking industry and has expertise in both insurance markets and derivatives.
Page 106

APPENDIX 2: THE SPAN MARGIN MODEL
The Standard Portfolio Analysis of Risk (“SPAN”) margin model was developed by the Chicago Mercantile Exchange in the wake of the 1987 stock market crash and went into use in 1988. Since then, most globally active futures clearinghouses around the world have adopted SPAN or a SPAN-like approach to calculate minimum margin requirements for commodity futures and futures options.
For related futures and options products valued based on the same underlying pricing curve (e.g., futures and options based on the same underlying commodity or index but with different maturity dates), SPAN generates a margin requirement by considering alternative valuations of the product under multiple risk scenarios. Specifically, the margin requirement is the absolute value of the maximum estimated potential loss for the product across those different risk scenarios. The parameters that define the SPAN risk scenarios are called price and volatility “scanning ranges” and are designed to capture the potential extreme values that a product may experience over the next trading day as a result of changes in price and volatility. In general, price and volatility scanning ranges for SPAN are set based on a variety of risk analytics that are computed to cover 99th percentile (or higher) historical price changes. For products like futures whose valuations depend only on price levels, the SPAN margin requirement is the absolute value of the maximum potential loss on that contract across the price scanning range. For options, SPAN takes into account combinations of both price and volatility changes in generating potential risk-based loss scenarios. Specifically, 16 combinations of price and volatility changes are used as inputs into option pricing models used to determine option settlement prices, and the resulting valuations are the basis for the scenario-based potential losses. For an option buyer, the absolute value of the largest potential loss is the required margin. For an option seller, the margin requirement is the higher of (i) the absolute value of the largest potential loss under the 16 scenarios or (ii) a short option minimum that is intended primarily to ensure that deep out-of-the-money written options with relatively low prices are adequately margined. Additional adjustments to margin also are made for relatively less liquid products that the DCO believes would take more than one day to be hedged or liquidated following a clearing member default. SPAN also includes an adjustment to increase margin for physically settled derivatives that are close to or in their delivery period. SPAN is a portfolio-based margin model, and, as such, the margin on a given portfolio is not merely the sum of all margin requirements for the individual component positions in the portfolio. Instead, SPAN adjusts portfolio margin requirements to reflect negative and positive correlations within related products based on the same commodity and across related commodity groups. Commodity groups are essentially asset classes, and include Agricultural commodities, Energy commodities, Currencies, Equities, Interest Rate products, and Metals.
Page 107

APPENDIX 3: RECENT ENHANCEMENTS TO CUSTOMER PROTECTIONS IN U.S.
FUTURES MARKETS Following the failure of MFG, several derivatives industry SROs promptly formed a joint committee to examine ways in which SROs could strengthen current safeguards for customer funds145 held at FCMs in order to prevent customer losses arising from the insolvency of an FCM.146 Undertaking a parallel effort, FIA established a special committee – the Futures Markets Financial Integrity Task Force (“Task Force”) – to develop and recommend specific measures that could be implemented in the near term through both industry best practices and regulatory changes to address the issues arising from the bankruptcy of MFG.
With the assistance of FIA’s Financial Management Committee, whose members include representatives of FIA member firms, DCOs, and depository institutions, the Task Force released its Initial Recommendations for the Protection of Customer Funds on February 28, 2012 (“Initial Recommendations”). The Initial Recommendations, which reflect best practices that the FCMs represented on the Committee currently follow, were designed to enhance, not replace, existing customer funds protections.147
This Appendix describes the recommendations of the FIA Task Force and the revisions to SRO rules and examination procedures that resulted from the joint committee’s review. It concludes with a summary of the CFTC’s recently adopted rules and rule amendments to provide further enhanced customer asset protections.148
A. The Initial Recommendations
The Initial Recommendations generally fall into one of three categories: (i) enhanced disclosure regarding customer funds protections; (ii) enhanced reporting with regard to customer funds; and (iii) enhanced internal controls.
145 For purposes of this Appendix, the term “customer funds” refers to, collectively: (i) customer funds required to be segregated in accordance with section 4d(a)(2) of the Act; (ii) the foreign futures and foreign options secured amount required to be calculated in accordance with Commission Rule 30.7; and (iii) the cleared swaps customer collateral required to be segregated in accordance with section 4d(f) of the Act and Part 22 of the CFTC’s rules. 146 The joint committee, which was formed in January 2012, was led by CME and NFA, the principal DSROs charged with conducting examinations of FCMs and other CFTC registrants. Other participants included the IntercontinentalExchange, the Kansas City Board of Trade, and the Minneapolis Grain Exchange. 147 A copy of the Initial Recommendations may be found at: http://www.futuresindustry.org/downloads/Initial_Recommendations_for_Customer_Funds_Protection.pdf. 148 Enhancing Protections Afforded Customers and Customer Funds Held by Futures Commission Merchants and Derivatives Clearing Organizations, Federal Register (forthcoming). The rules and rule amendments are effective 60 days following publication in the Federal Register, although the compliance dates for certain provisions of the rules are later.
Page 108

(1) Enhanced Customer Funds Disclosure The Task Force recognized that one of the more important services an FCM can provide its customers is to assure that these customers appreciate the limitations as well as the benefits of the customer funds protections set out in the CEA (or the “Act”) and the CFTC’s rules. To address those elements of the protections that are of immediate concern to customers, the FIA Law and Compliance Executive Committee prepared Frequently Asked Questions on Customer Funds Protections, which sets out responses to questions that FIA member firms have received from their customers regarding customer funds protections.149 The Frequently Asked Questions on Customer Funds Protections was released concurrently with the Initial Recommendations.
(2) Enhanced Customer Funds Reporting CFTC rules require each FCM to (i) compute as of the end of each business day the amount of funds held, and required to be held, in segregation,150 and (ii) maintain detailed records of the investment of customer funds held in accordance with CFTC Rule 1.25. The information contained in these reports, however, had not previously been made available to the CFTC or the SROs on a routine basis. The Task Force noted that NFA had adopted rules requiring those FCMs for which it is the DSRO to file with NFA a copy of each daily segregation calculation and a monthly report – known as the Segregated Investment Detail Report (“SIDR”) – identifying the sectors in which the FCM invests customer funds, the amount of customer funds invested in each sector, and the weighted average maturity of the assets held in each sector.
To assure that the CFTC and all SROs would have more up-to-date information on customer segregated funds at each FCM, the Task Force recommended that the NFA reporting requirements be extended to all FCMs. Specifically, each FCM should be required to file with its DSRO its daily segregation calculation. Further, each FCM should be required to file twice monthly reports, as of each month-end and as of the 15th of each month (or the next business day), identifying: (i) the asset sectors (e.g., cash, government securities, money market mutual funds) in which the FCM invests customer funds; (ii) the amount of customer funds invested in each sector; and (iii) the weighted average maturity of the assets held in each sector.
(3) Enhanced Internal Controls The Task Force recognized that no rules can adequately protect customer funds unless the firms responsible for complying with those rules maintain strong internal controls. The Task Force, therefore, recommended that all FCMs document and implement policies and procedures regarding their internal controls. These recommendations reflect the best practices of those firms
149 A copy of the Frequently Asked Questions on Customer Funds Protections may be found at http://www.futuresindustry.org/downloads/PCF-FAQs.PDF. FIA views this document as a “living document” and will revise the document as other questions are identified or as required by amendments to the Act or the Commission’s rules. FIA last revised this document in June 2012. 150 Commission Rule 1.32 (with respect to customer funds required to be segregated in accordance with section 4d(a)(2) of the Act); Commission Rule 22.12 with respect to funds required to be segregated in accordance with section 4d(f) of the Act); Commission Rule 30.7(f) with respect to funds required to be held in the foreign futures and foreign options secured account amount.
Page 109

represented on the Financial Management Committee. Specifically, the Task Force recommended the following:
• The CFTC should propose a rule requiring each FCM to certify annually that there are (and have been since the last report) no material weaknesses in its internal controls regarding the computation of adjusted net capital and compliance with the provisions of the Act and the CFTC’s rules regarding the protection of customer funds.
• SROs should require FCMs to document their policies and procedures that require an appropriate separation of duties among individuals responsible for compliance with the Act and the CFTC’s rules relating to the protection of customer funds, subject to appropriate oversight and review.
• NFA should consider whether it should develop an examination for chief financial officers of FCMs and other personnel responsible for compliance with the provisions of the Act and the CFTC’s rules relating to the calculation of the FCM’s adjusted net capital and the protection of customer funds.
• SROs should require each FCM to document its policies and procedures for valuing all securities held in the customer segregated account, including permitted investments under CFTC Rule 1.25, to assure that such securities are accurately valued and, in particular, are readily marketable and highly liquid.151
• SROs should require each FCM to document policies and procedures for selecting the depositories, including affiliates, with which the FCM deposits and maintains customer funds.
• SROs should require each FCM to document its policies and procedures with respect to the FCM’s determination of the appropriate targeted residual interest it maintains in the customer funds accounts.152 Such policies and procedures should be designed to reasonably assure that any withdrawals from the customer segregated account to the FCM’s own account comprise the FCM’s residual interest and will not result in a violation of the Act and the CFTC’s rules, or the FCM’s targeted residual interest.153 The FCM’s chief financial officer or the chief financial officer’s delegate must approve in writing any withdrawal from the customer
151 The Task Force also recommended that the Commission amend Rule 1.25 to confirm that an FCM investing customer funds in accordance with the rule bears the risk of loss arising from any such investment and must use its own funds to restore the value of the customer segregated account. 152 In order to assure compliance with the segregation requirements of sections 4d(a)(2) and 4d(f) of the Act, CFTC Rules 1.23 and 22.2, respectively, authorize an FCM to add its own funds and securities to a customer funds account. Such funds and securities are referred to as the FCM’s residual interest. All such FCM funds and securities are held for the exclusive benefit of the FCM’s customers while held in a customer funds account. 153 The Task Force expressed its view that the CFTC or a DSRO should have authority to require an FCM to increase the amount of FCM funds held in segregation or to prevent an FCM from withdrawing its residual interest except in carefully circumscribed circumstances and in accordance with carefully articulated objective standards.
Page 110

segregated account in violation of the policies and procedures, as well as any material change in the policies and procedures regarding the maintenance of the FCM’s residual interest in the customer segregated account.
B. CME154 and NFA Rules Implementing Task Force Recommendations
CME and NFA have adopted rules to implement several of the recommendations detailed in the previous section.155 The primary new customer protection rules are discussed in the subsections below.
(1) Enhanced Customer Funds Disclosure and Reporting Revised CME and NFA rules require each FCM to submit through WinJammer156 daily segregation reports and twice monthly SIDR reports. The rules apply to customer funds required to be segregated in accordance with section §4d(a)(2) of the Act, the foreign futures and foreign options secured amount required to be calculated in accordance with CFTC Rule 30.7, and the cleared swaps customer account required to be segregated in accordance with section §4d(f) of the Act and Part 22 of the CFTC’s rules.157
In addition, CME and NFA rules require each FCM holding customer funds at a depository to require the depository to report daily to CME or NFA the balances in the FCM’s customer funds account(s) held at the depository in the form and manner prescribed by CME and NFA.158
Recognizing that this information is also important to customers conducting a due diligence review of an FCM through which the customer may choose to clear, NFA has added new sections to its Background Affiliation Status Information Center (“BASIC”) system to provide summary reports of the financial information filed with NFA. The “NFA Financial Data
154 CME Group operates five designated contract markets in the United States: (i) Chicago Mercantile Exchange (“CME”); (ii) Chicago Board of Trade (“CBOT”); (iii) New York Mercantile Exchange (“NYMEX”); (iv) New York Commodity Exchange (“COMEX”); and (v) Kansas City Board of Trade (“KCBOT”). Each exchange has its own rules, but, for purposes of this Appendix, those rules have been harmonized. In particular, Rule 971 at each exchange is essentially identical. Subsequent references to CME Rule 971 thus should be read to include CBOT Rule 971 and NYMEX Rule 971. The comparable rule for COMEX falls under NYMEX Rule 971 and for KCBOT falls under CBOT 971. 155 CME Rule 971; NFA Financial Requirement Section 16. Neither CME Rule 971 nor NFA Financial Requirement Section 16 require an FCM to report the weighted average maturity of the assets held in each sector. 156 The WinJammerTM Online Filing System is the futures industry standard for futures firms to enter and transmit FOCUS, 1FR-FCM, Segregated Investment Detail Reports (SIDR), notice filings and other financial statements. 157 CME and NFA are performing limited reviews of the customer segregated, the foreign futures and foreign options secured amount and cleared swaps customer statements on a surprise basis outside of the regular risk-based examinations. These reviews are performed in accordance with a review program adopted by the Joint Audit Committee and filed with the Commission. 158 NFA Financial Requirement Section 4 is applicable to all FCMs; CME Rule 971 imposes a similar requirement on its clearing member FCMs.
Page 111

Reporting” screen thus now includes links to FCM Capital Reports (updated monthly); FCM Customer Segregated Funds Reports (updated semi-monthly); and FCM Customer Secured Amount Funds Report (updated semi-monthly).159 These reports show the most recent monthly or semi-monthly financial data. Users also have the option of viewing historical information from the previous 12 months by clicking on the “View More” link in the reports.
(2) Enhanced Internal Controls Both CME and NFA have adopted rules implementing certain of the Task Force recommendations regarding enhanced internal controls. Specifically, NFA Financial Requirements Section 16 requires each FCM to document its policies and procedures for determining the appropriate targeted residual interest for each customer funds account.
Furthermore, CME and NFA rules provide that the chief executive officer, chief financial officer or a “financial principal” (in the case of NFA) or “authorized representative” (in the case of CME) would be required to approve in writing any withdrawal of a portion of the FCM’s residual interest, not for the benefit of customers, in excess of 25 percent of the residual interest reflected in the FCM’s most recent daily segregation calculation. Such written approval would be required before the withdrawal is made, followed by immediate notice to the FCM’s DSRO.
C. Foreign Futures and Foreign Options Secured Amount
The CFTC’s foreign futures and options rules currently provide an FCM with greater flexibility in the manner in which it treats customers that trade on foreign boards of trade and the funds deposited by such customers to margin transactions on foreign boards of trade. For example: (i) foreign futures and foreign options customers are defined to include only those customers located in the US; (ii) only funds received from foreign futures and foreign options customers are required to be taken into account in calculating the foreign futures and foreign options secured amount in accordance with Rule 30.7; (iii) Rule 30.7 provides for an alternative calculation of the foreign futures and foreign options secured amount that does not assure protection of customer funds as fully as the net liquidating equity calculation that is used to determine the amount required to be segregated in connection with trading on US futures markets; and (iv) there is no limit on the amount of foreign futures and foreign options customer funds that may be held in permitted depositories outside of the US (although capital charges may apply).
Providing such flexibility was reasonable in 1987, when the foreign futures and foreign options rules (Part 30) were adopted. U. S. participation in foreign markets was small and generally limited to commercial users. International derivatives markets, however, have changed significantly in the past 25 years. Although FCMs have generally adopted policies and procedures designed to provide protections to all customers trading on foreign boards of trade that are comparable to the protections afforded customers trading on US futures markets, the Task Force recommended that the CFTC publish for comment proposed amendments to the Part 30 rules that would accomplish the following:
159 The FCM Customer Cleared Swaps Collateral Report is expected to be added shortly.
Page 112

• Revise the definition of a foreign futures and foreign options customer to include all customers, wherever located;
• Require all FCMs to calculate the foreign futures and foreign options secured amount using the net liquidating equity calculation;160
• Hold funds deposited with the FCM for the purpose of trading foreign futures and foreign options in the U.S., except as reasonably expected to meet margin obligations on foreign boards of trade;161 and
• Provide that, except as the CFTC otherwise provides by order, only funds deposited or otherwise required to be held for the purpose of trading foreign futures and foreign options should be held in the foreign futures and foreign options secured amount.
The Task Force further recommended that the CFTC withdraw that portion of its September 30, 2003, order that authorizes firms that are subject to regulation by the United Kingdom’s Financial Conduct Authority and have qualified for an exemption from registration as an FCM in accordance with CFTC Rule 30.10 to offer their customers that meet the definition of an eligible contract participant to opt out of the applicable UK segregations requirements.
D. Protections for Customer Assets Involving Cleared Swaps
Futures and options are known as exchange-traded derivatives because they are traded on a DCM and cleared by a DCO. Over-the-counter (“OTC”) derivatives (a.k.a. “swaps”162), by contrast, are bilateral derivatives negotiated outside the framework of organized exchanges. “OTC-cleared” derivatives, or “cleared swaps,” are derivatives that are negotiated and executed either over-the-counter (e.g., through voice brokers) or regulated trading platforms (e.g., swap execution facilities) and subsequently cleared by a DCO. Although cleared swaps have been used
160 In its interpretive statement regarding NFA Financial Requirement Section 16, NFA advised FCMs that, in calculating the amount of funds that must be held in a foreign futures and foreign options secured amount account, they must use the method that calculates net liquidating equity plus the market value of any securities held in customers’ accounts. 161 The Task Force observed that the appropriate excess is not amenable to a prescriptive rule, but will depend, for example, on the volatility from time-to-time of the products traded, the type of collateral (cash or securities) deposited with the foreign broker, the time-zone in which the market is located, and the jurisdiction of the markets traded. To the extent that a numerical standard is deemed necessary, the Task Force suggested that it should be no less than 50 percent of the amount that an FCM is required to deposit with a foreign broker to maintain customer foreign futures and foreign options positions. The CFTC, however, recently amended Rule 30.7 to provide that an FCM may deposit with a foreign broker as an additional amount no more than 20 percent of the total amount of funds necessary to meet margin and prefunding margin requirements. See Enhancing Protections Afforded Customers and Customer Funds Held by Futures Commission Merchants and Derivatives Clearing Organizations, Federal Register (forthcoming). 162 A “swap” can refer to a specific type of financial contract in which multiple cash flows (or assets) are exchanged over time – e.g., interest rate swaps, commodity swaps, currency and cross-currency swaps, equity swaps, etc. The term “swap” can also refer more generally to all OTC derivatives. Our use of the term “swap” is in the latter context.
Page 113
by market participants since at least the late 1990s,163 both the United States and Europe adopted legislation in 2010 that will require “standardized” OTC derivatives to be cleared by a DCO.164
Customer assets related to cleared swaps are subject to “Legal Segregation with Operational Commingling” or “LSOC” requirements.165 Cleared swaps collateral may be commingled across swaps customers in an FCM but must be segregated and deposited at a U.S. bank or trust company, a “collecting” FCM, or a DCO. Cleared swaps collateral may not be commingled with §4d segregated or §30.7 foreign-secured customer assets. As in the case of §4d segregated and §30.7 foreign-secured funds, FCMs are permitted to maintain residual interests in cleared swaps collateral pools for cleared swap customers.
Cleared swaps collateral is distinct from §4d and §30.7 segregated and secured funds primarily because it reduces some fellow-customer risk. Specifically, the cleared swaps collateral value of one customer cannot be used to cover any other losses following an FCM default regardless whether the loss causing the default originated in cleared swaps customer accounts, §4d customer accounts, §30.7 customer accounts, or the FCM’s house account. In other words, the cleared swaps collateral value posted by a customer can only be used to cover a shortfall of funds by that same customer. Clearing members must provide a daily report to DCOs that indicate the value of each customer’s individual margin requirements and collateral value.
E. CFTC Enhanced Customer Protection Rules
In November 2012, the CFTC proposed a number of rules intended to enhance the protection of customers and customer funds held by FCMs and DCOs.166 The proposed rules build upon and codify recommendations made by the FIA Task Force and the rules adopted by CME and NFA earlier this year. The CFTC finalized its CFTC Customer Protection Rules on October 31, 2013.167
The CFTC Customer Protection Rules require each FCM to do the following: (i) submit to the CFTC and its DSRO its daily Statement of Segregation Requirements and Funds in Segregation
163 See, e.g., C. L. Culp, “OTC-Cleared Derivatives: Benefits, Costs, and Implications of the ‘Dodd-Frank Wall Street Reform and Consumer Protection Act,’” Journal of Applied Finance No. 2 (2010). 164 See, e.g., Dodd-Frank Wall Street Reform and Consumer Protection Act, U.S. Public Law 111-203 (July 23, 2010), and European Commission, Proposal for a Regulation of the European Parliament and of the Council on OTC Derivatives, Central Counterparties, and Trade Repositories (a.k.a. European Market Infrastructure Regulation) (September 15, 2010). 165 17 CFR §22 (2013). 166 CFTC, “Enhancing Protections Afforded Customers and Customer Funds Held by Futures Commission Merchants and Derivatives Clearing Organizations: Proposed Rule,” Federal Register Vol. 77, No. 220 (November 14, 2012). 167 Enhancing Protections Afforded Customers and Customer Funds Held by Futures Commission Merchants and Derivatives Clearing Organizations, Federal Register (forthcoming).
Page 114

by noon the next business day;168 (ii) submit to the CFTC and its DSRO as of the 15th day and last business day of the month a report listing the names of all banks, trust companies, FCMs, DCOs, or other depository or custodian holding futures customer funds, the amount of funds held at each entity, and the types of investments held on behalf of customers;169 (iii) obtain the written approval of the FCM’s chief executive officer, chief financial officer, or other senior official listed as a principal of the FCM and knowledgeable about the firm’s financial requirements and position prior to withdrawing 25 percent or more of the firm’s residual interest in the customer segregated account for its proprietary use;170 and (iv) allow the CFTC and its SRO read-only access to accounts at depositories holding customer funds.171
In addition, the amendments require each FCM to:
• Maintain a residual interest in each class of customer funds account – i.e., customer segregated accounts, foreign futures and foreign options secured amount accounts, and cleared swaps customer collateral accounts – sufficient to exceed the sum of all customer margin deficits;172
• Provide immediate written notice to the CFTC and the FCM’s DSRO in certain circumstances, including whenever: (i) the FCM’s residual interest is below the FCM’s targeted amount, or the residual amount is less than the sum of the customers’ margin deficits;173 or (ii) the FCM or its parent or material affiliate experiences a material adverse impact to its creditworthiness or ability to fund its obligations;174
• Provide prompt written notice to the CFTC and the FCM’s DSRO whenever the FCM experiences a material change in its operations or risk profile;175
• Furnish each customer a “Disclosure Document” prior to entering into an account agreement or first accepting funds from a customer, which would include all information about the FCM (i) that would be material to the customer’s decision to do business with the FCM, and (ii) that is otherwise necessary for full and fair disclosure, including its business, operations, risk profile, and affiliates;176 and
168 Rules 1.32(d), 22.2(g)(2) and 30.7(l)(3). 169 Rules 1.32(f), 22.2(g)(5) and 30.7(l)(5). 170 Rules 1.23(d), 22.17(c) and 30.7(g)(3). 171 Rules 1.20(b)(5) and 30.7(d)(3). 172 Rules 1.22(c) and 30.7(f). 173 Rule 1.12(j). 174 Rule 1.12(k). 175 Rule 1.12(l). 176 Proposed Rule 1.55(i)-(k).
Page 115

• Require each FCM to establish and enforce a system of risk management policies and procedures designed to monitor and manage the risks associated with the activities of the FCM.177
177 Proposed Rule 1.11. These rules would codify many of the internal controls recommendations set out in the Initial Recommendations.
Page 116