current extreme weather and climate change · current extreme weather and climate change september...
TRANSCRIPT
Current Extreme Weatherand Climate Change
September 7, 2011
Expert Reviewers:! Kevin Trenberth, National Center for Atmospheric Research! Jerry Meehl, National Center for Atmospheric Research! Jeff Masters, Weather Underground! Richard Somerville, Scripps Institution of Oceanography, University of California,
San Diego
Editorial Team for Climate Communication:! Hunter Cutting! Sandra Chung! Susan Hassol
OverviewRecent weather events such as deadly heat waves and devastating floods have sparkedpopular interest in understanding the role of global warming in driving extreme weather. Theseevents are part of a new pattern of more extreme weather across the globe, shaped in part byhuman-induced climate change.
As the climate has warmed, some types of extreme weather have become more frequent andsevere in recent decades, with increases in extreme heat, intense precipitation, and drought.
1
Heat waves are longer and hotter. Heavy rains and flooding are more frequent. In a wide swingbetween extremes, drought, too, is more intense and more widespread.
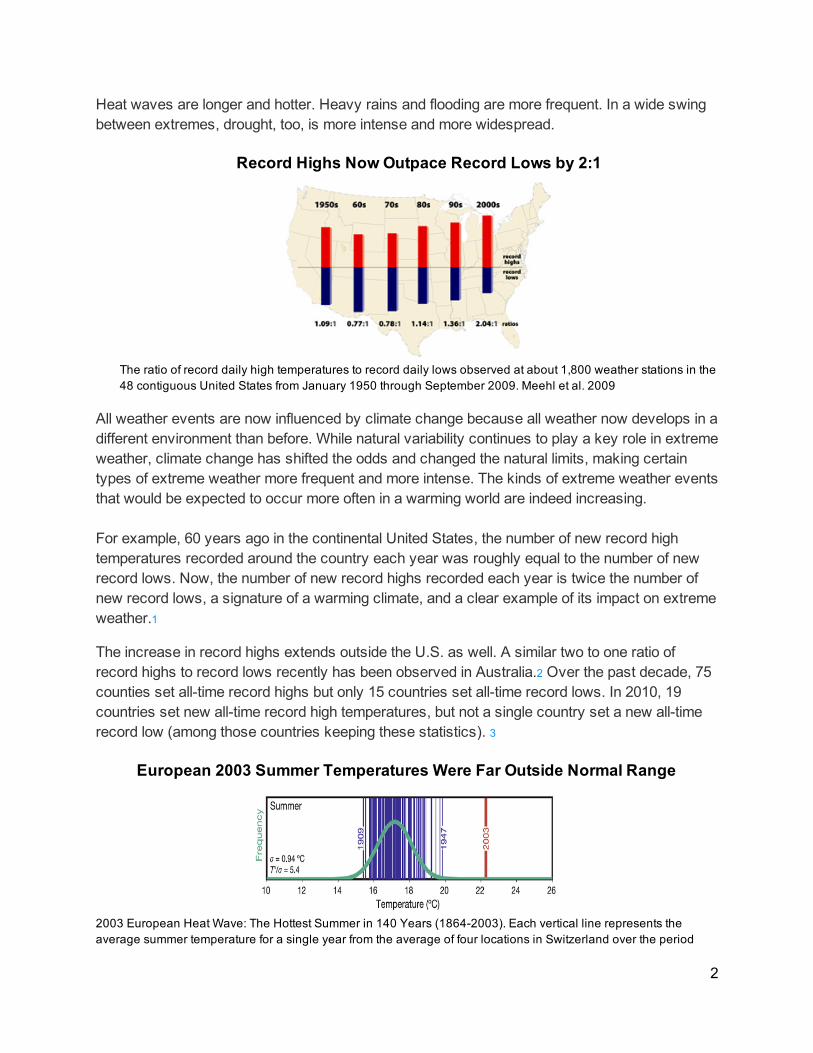
Record Highs Now Outpace Record Lows by 2:1
The ratio of record daily high temperatures to record daily lows observed at about 1,800 weather stations in the48 contiguous United States from January 1950 through September 2009. Meehl et al. 2009
All weather events are now influenced by climate change because all weather now develops in adifferent environment than before. While natural variability continues to play a key role in extremeweather, climate change has shifted the odds and changed the natural limits, making certaintypes of extreme weather more frequent and more intense. The kinds of extreme weather eventsthat would be expected to occur more often in a warming world are indeed increasing.
For example, 60 years ago in the continental United States, the number of new record hightemperatures recorded around the country each year was roughly equal to the number of newrecord lows. Now, the number of new record highs recorded each year is twice the number ofnew record lows, a signature of a warming climate, and a clear example of its impact on extremeweather.1
The increase in record highs extends outside the U.S. as well. A similar two to one ratio ofrecord highs to record lows recently has been observed in Australia.2 Over the past decade, 75counties set all-time record highs but only 15 countries set all-time record lows. In 2010, 19countries set new all-time record high temperatures, but not a single country set a new all-timerecord low (among those countries keeping these statistics). 3
European 2003 Summer Temperatures Were Far Outside Normal Range
2003 European Heat Wave: The Hottest Summer in 140 Years (1864-2003). Each vertical line represents theaverage summer temperature for a single year from the average of four locations in Switzerland over the period
2
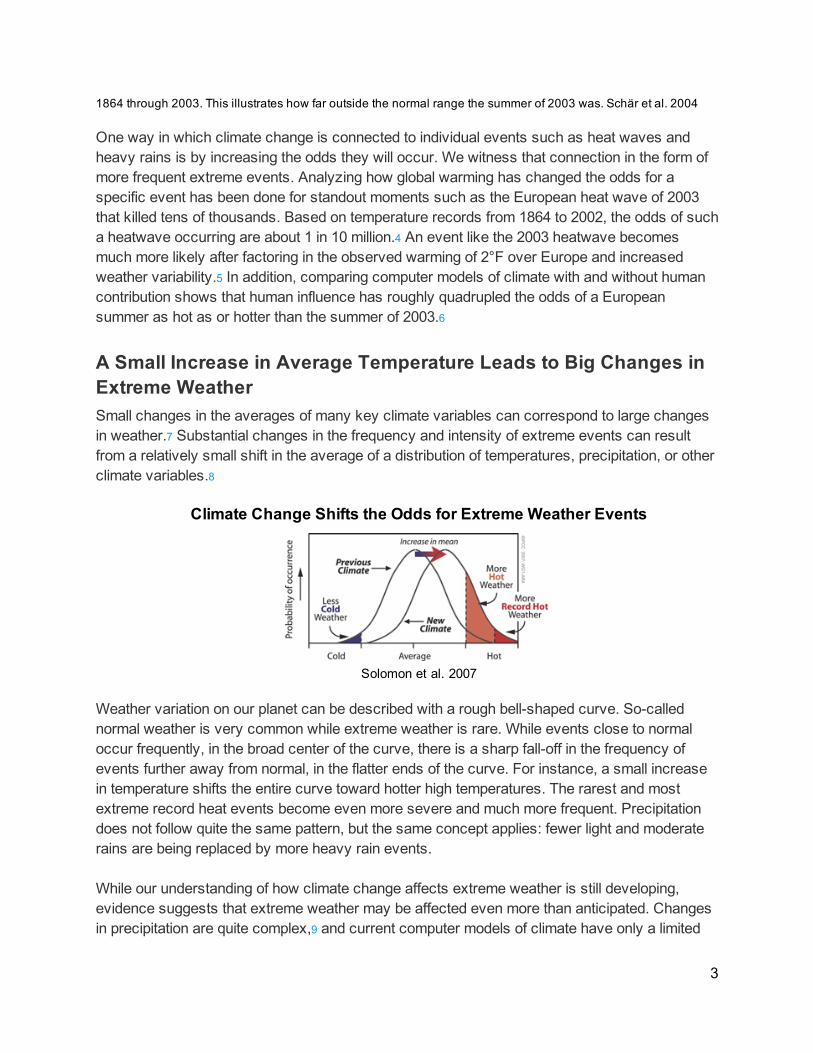
1864 through 2003. This illustrates how far outside the normal range the summer of 2003 was. Schär et al. 2004
One way in which climate change is connected to individual events such as heat waves andheavy rains is by increasing the odds they will occur. We witness that connection in the form ofmore frequent extreme events. Analyzing how global warming has changed the odds for aspecific event has been done for standout moments such as the European heat wave of 2003that killed tens of thousands. Based on temperature records from 1864 to 2002, the odds of sucha heatwave occurring are about 1 in 10 million.4 An event like the 2003 heatwave becomesmuch more likely after factoring in the observed warming of 2°F over Europe and increasedweather variability.5 In addition, comparing computer models of climate with and without humancontribution shows that human influence has roughly quadrupled the odds of a Europeansummer as hot as or hotter than the summer of 2003.6
A Small Increase in Average Temperature Leads to Big Changes inExtreme WeatherSmall changes in the averages of many key climate variables can correspond to large changesin weather.7 Substantial changes in the frequency and intensity of extreme events can resultfrom a relatively small shift in the average of a distribution of temperatures, precipitation, or otherclimate variables.8
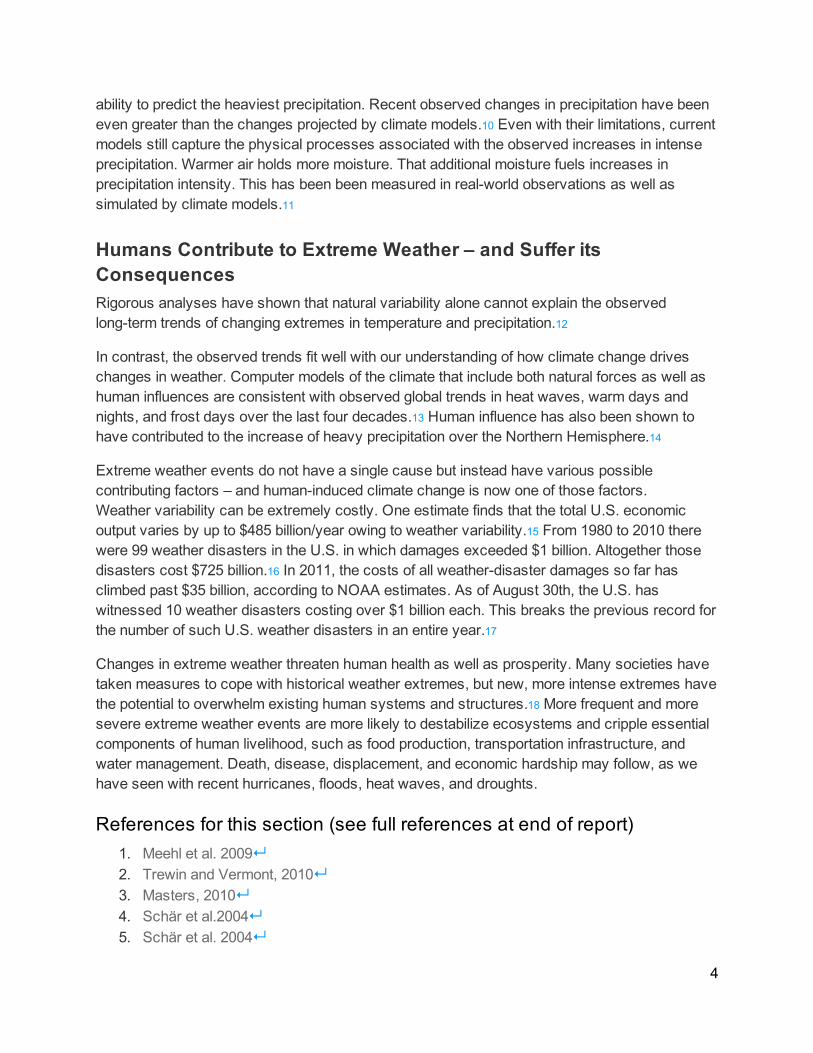
Climate Change Shifts the Odds for Extreme Weather Events
Solomon et al. 2007
Weather variation on our planet can be described with a rough bell-shaped curve. So-callednormal weather is very common while extreme weather is rare. While events close to normaloccur frequently, in the broad center of the curve, there is a sharp fall-off in the frequency ofevents further away from normal, in the flatter ends of the curve. For instance, a small increasein temperature shifts the entire curve toward hotter high temperatures. The rarest and mostextreme record heat events become even more severe and much more frequent. Precipitationdoes not follow quite the same pattern, but the same concept applies: fewer light and moderaterains are being replaced by more heavy rain events.
While our understanding of how climate change affects extreme weather is still developing,evidence suggests that extreme weather may be affected even more than anticipated. Changesin precipitation are quite complex,9 and current computer models of climate have only a limited
3
ability to predict the heaviest precipitation. Recent observed changes in precipitation have beeneven greater than the changes projected by climate models.10 Even with their limitations, currentmodels still capture the physical processes associated with the observed increases in intenseprecipitation. Warmer air holds more moisture. That additional moisture fuels increases inprecipitation intensity. This has been been measured in real-world observations as well assimulated by climate models.11
Humans Contribute to Extreme Weather – and Suffer itsConsequencesRigorous analyses have shown that natural variability alone cannot explain the observedlong-term trends of changing extremes in temperature and precipitation.12
In contrast, the observed trends fit well with our understanding of how climate change driveschanges in weather. Computer models of the climate that include both natural forces as well ashuman influences are consistent with observed global trends in heat waves, warm days andnights, and frost days over the last four decades.13 Human influence has also been shown tohave contributed to the increase of heavy precipitation over the Northern Hemisphere.14
Extreme weather events do not have a single cause but instead have various possiblecontributing factors – and human-induced climate change is now one of those factors.Weather variability can be extremely costly. One estimate finds that the total U.S. economicoutput varies by up to $485 billion/year owing to weather variability.15 From 1980 to 2010 therewere 99 weather disasters in the U.S. in which damages exceeded $1 billion. Altogether thosedisasters cost $725 billion.16 In 2011, the costs of all weather-disaster damages so far hasclimbed past $35 billion, according to NOAA estimates. As of August 30th, the U.S. haswitnessed 10 weather disasters costing over $1 billion each. This breaks the previous record forthe number of such U.S. weather disasters in an entire year.17
Changes in extreme weather threaten human health as well as prosperity. Many societies havetaken measures to cope with historical weather extremes, but new, more intense extremes havethe potential to overwhelm existing human systems and structures.18 More frequent and moresevere extreme weather events are more likely to destabilize ecosystems and cripple essentialcomponents of human livelihood, such as food production, transportation infrastructure, andwater management. Death, disease, displacement, and economic hardship may follow, as wehave seen with recent hurricanes, floods, heat waves, and droughts.
References for this section (see full references at end of report)1. Meehl et al. 2009↵2. Trewin and Vermont, 2010↵3. Masters, 2010↵4. Schär et al.2004↵5. Schär et al. 2004↵
4
6. Stott et al. 2004↵7. Karl et al. 2008↵8. Trenberth 1999; Gutowski et al. 2008↵9. Trenberth 1998, 2011↵10. Gutowski et al. 2008, Allan and Soden 2008, and Min 2011↵11. Tebaldi et al. 2006↵12. Solomon et al. 2007, Stott et al. 2010, and Min et al. 2011↵13. Tebaldi et al. 2006 and Christidis 2011↵14. Min et al. 2011↵15. Lazo et al 2010↵16. Lott et al. 2011↵17. NOAA 2011↵18. Peterson et al. 2008↵
Heat WavesAcross the globe in recent decades, there has been an increase in the number of hot extremes,particularly very warm nights.1 Hot days have also been hotter and more frequent.2 Since 1950the number of heat waves has increased and heat waves have become longer.3
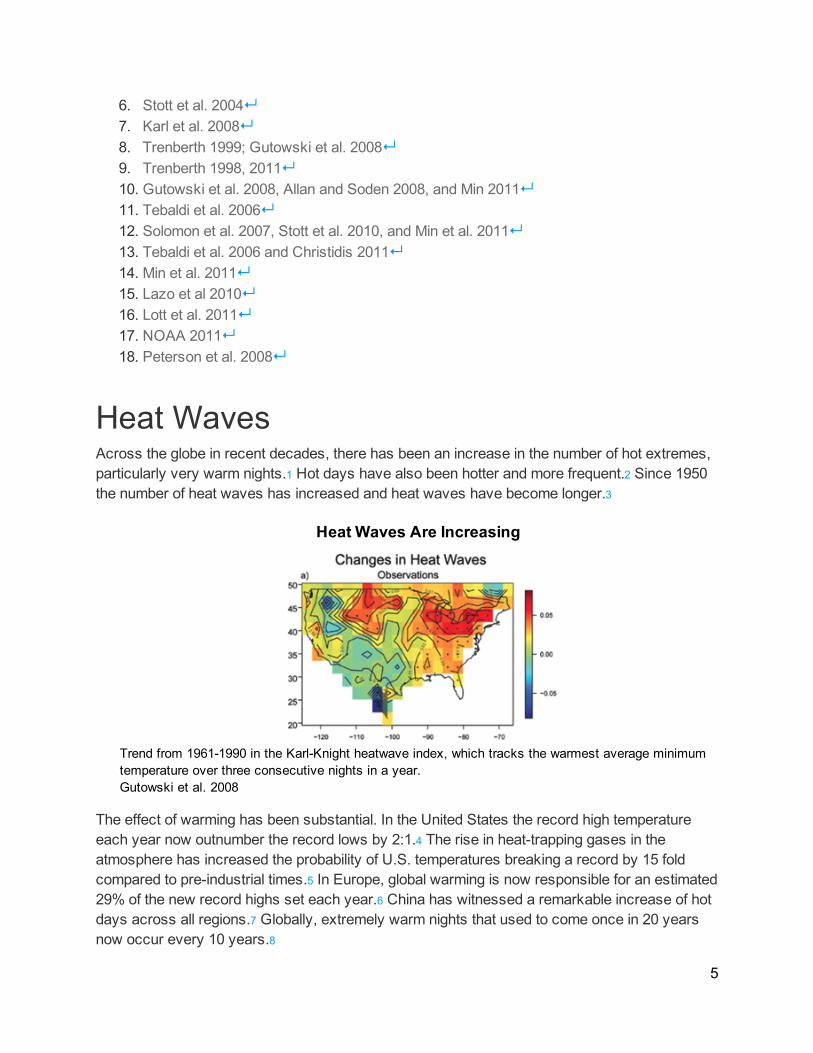
Heat Waves Are Increasing
Trend from 1961-1990 in the Karl-Knight heatwave index, which tracks the warmest average minimumtemperature over three consecutive nights in a year.Gutowski et al. 2008
The effect of warming has been substantial. In the United States the record high temperatureeach year now outnumber the record lows by 2:1.4 The rise in heat-trapping gases in theatmosphere has increased the probability of U.S. temperatures breaking a record by 15 foldcompared to pre-industrial times.5 In Europe, global warming is now responsible for an estimated29% of the new record highs set each year.6 China has witnessed a remarkable increase of hotdays across all regions.7 Globally, extremely warm nights that used to come once in 20 yearsnow occur every 10 years.8
5
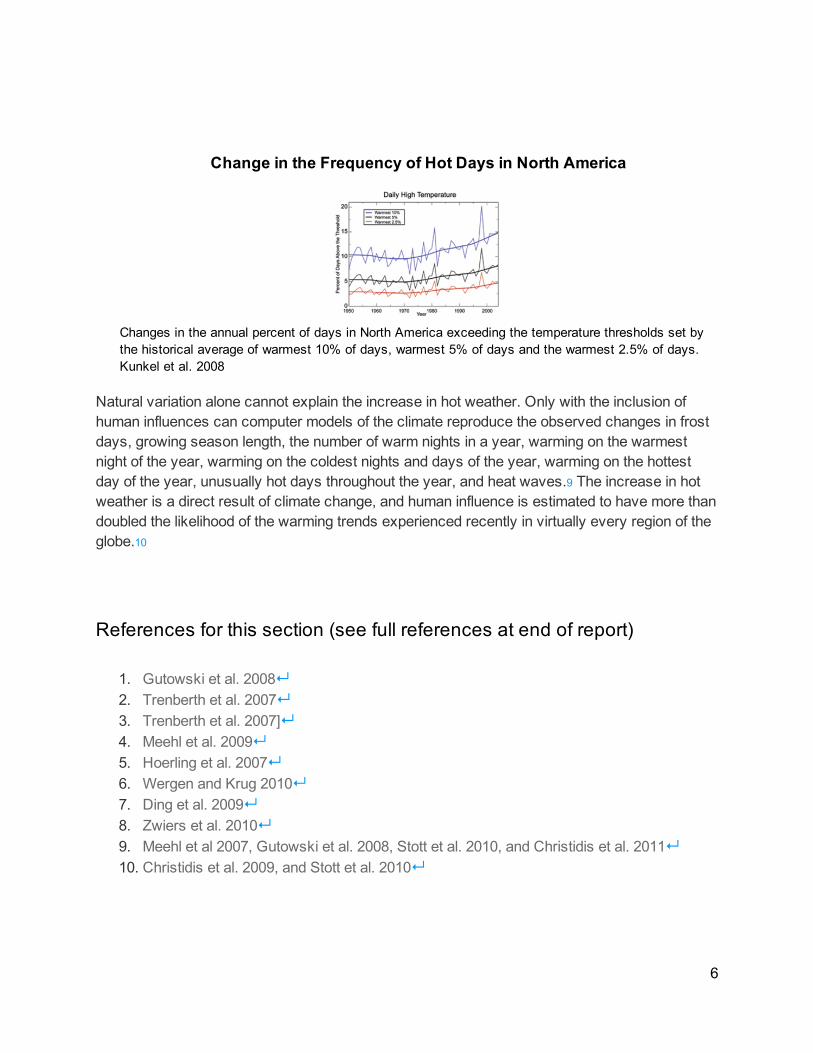
Change in the Frequency of Hot Days in North America
Changes in the annual percent of days in North America exceeding the temperature thresholds set bythe historical average of warmest 10% of days, warmest 5% of days and the warmest 2.5% of days.Kunkel et al. 2008
Natural variation alone cannot explain the increase in hot weather. Only with the inclusion ofhuman influences can computer models of the climate reproduce the observed changes in frostdays, growing season length, the number of warm nights in a year, warming on the warmestnight of the year, warming on the coldest nights and days of the year, warming on the hottestday of the year, unusually hot days throughout the year, and heat waves.9 The increase in hotweather is a direct result of climate change, and human influence is estimated to have more thandoubled the likelihood of the warming trends experienced recently in virtually every region of theglobe.10
References for this section (see full references at end of report)
1. Gutowski et al. 2008↵2. Trenberth et al. 2007↵3. Trenberth et al. 2007]↵4. Meehl et al. 2009↵5. Hoerling et al. 2007↵6. Wergen and Krug 2010↵7. Ding et al. 2009↵8. Zwiers et al. 2010↵9. Meehl et al 2007, Gutowski et al. 2008, Stott et al. 2010, and Christidis et al. 2011↵10. Christidis et al. 2009, and Stott et al. 2010↵
6
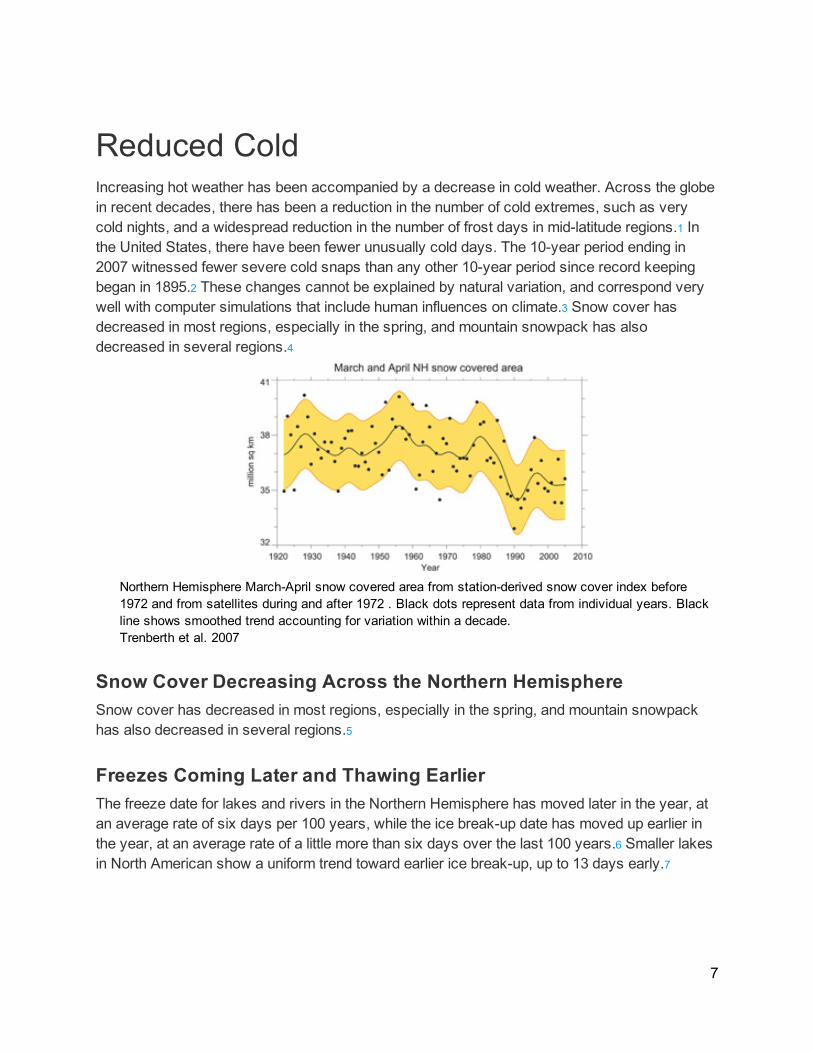
Reduced ColdIncreasing hot weather has been accompanied by a decrease in cold weather. Across the globein recent decades, there has been a reduction in the number of cold extremes, such as verycold nights, and a widespread reduction in the number of frost days in mid-latitude regions.1 Inthe United States, there have been fewer unusually cold days. The 10-year period ending in2007 witnessed fewer severe cold snaps than any other 10-year period since record keepingbegan in 1895.2 These changes cannot be explained by natural variation, and correspond verywell with computer simulations that include human influences on climate.3 Snow cover hasdecreased in most regions, especially in the spring, and mountain snowpack has alsodecreased in several regions.4
Northern Hemisphere March-April snow covered area from station-derived snow cover index before1972 and from satellites during and after 1972 . Black dots represent data from individual years. Blackline shows smoothed trend accounting for variation within a decade.Trenberth et al. 2007
Snow Cover Decreasing Across the Northern HemisphereSnow cover has decreased in most regions, especially in the spring, and mountain snowpackhas also decreased in several regions.5
Freezes Coming Later and Thawing EarlierThe freeze date for lakes and rivers in the Northern Hemisphere has moved later in the year, atan average rate of six days per 100 years, while the ice break-up date has moved up earlier inthe year, at an average rate of a little more than six days over the last 100 years.6 Smaller lakesin North American show a uniform trend toward earlier ice break-up, up to 13 days early.7
7
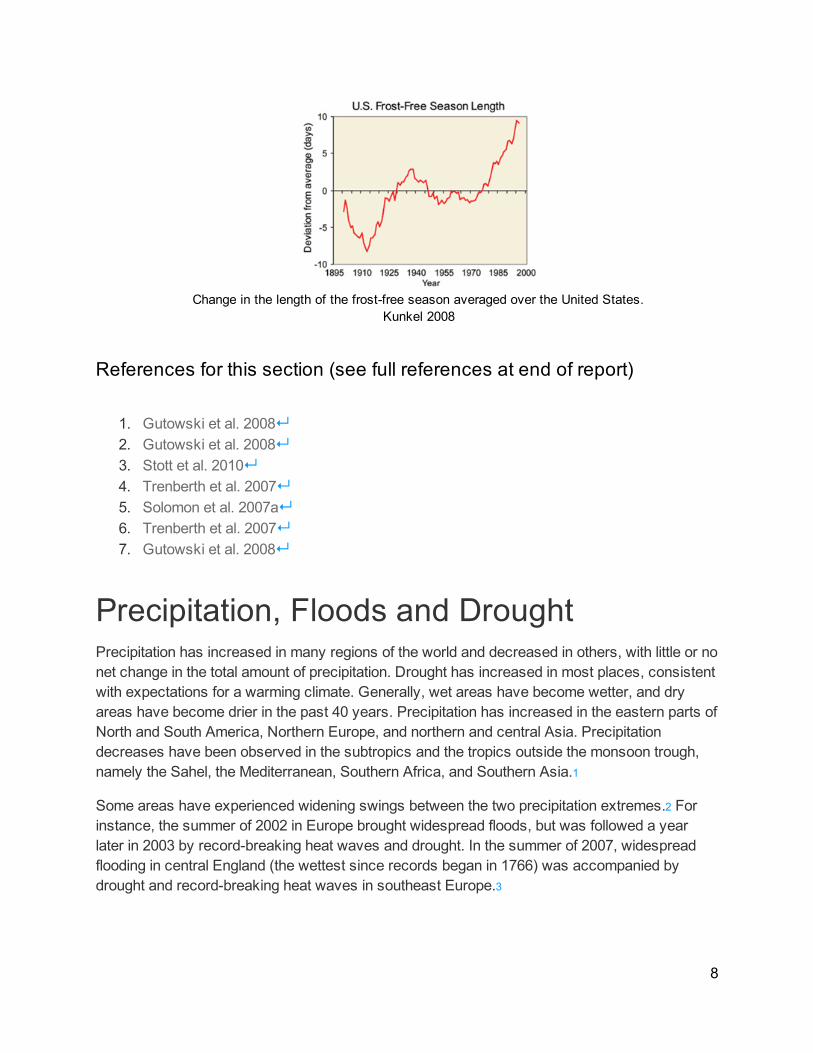
Change in the length of the frost-free season averaged over the United States.Kunkel 2008
References for this section (see full references at end of report)
1. Gutowski et al. 2008↵2. Gutowski et al. 2008↵3. Stott et al. 2010↵4. Trenberth et al. 2007↵5. Solomon et al. 2007a↵6. Trenberth et al. 2007↵7. Gutowski et al. 2008↵
Precipitation, Floods and DroughtPrecipitation has increased in many regions of the world and decreased in others, with little or nonet change in the total amount of precipitation. Drought has increased in most places, consistentwith expectations for a warming climate. Generally, wet areas have become wetter, and dryareas have become drier in the past 40 years. Precipitation has increased in the eastern parts ofNorth and South America, Northern Europe, and northern and central Asia. Precipitationdecreases have been observed in the subtropics and the tropics outside the monsoon trough,namely the Sahel, the Mediterranean, Southern Africa, and Southern Asia.1
Some areas have experienced widening swings between the two precipitation extremes.2 Forinstance, the summer of 2002 in Europe brought widespread floods, but was followed a yearlater in 2003 by record-breaking heat waves and drought. In the summer of 2007, widespreadflooding in central England (the wettest since records began in 1766) was accompanied bydrought and record-breaking heat waves in southeast Europe.3
8
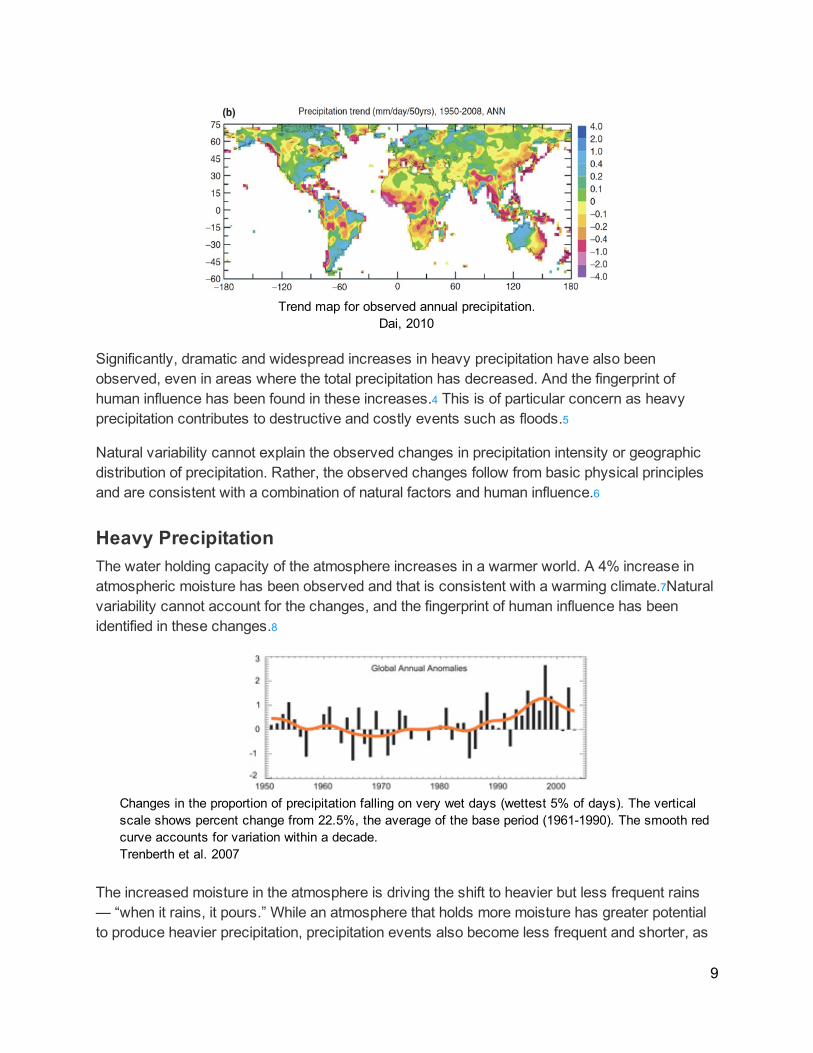
Trend map for observed annual precipitation.Dai, 2010
Significantly, dramatic and widespread increases in heavy precipitation have also beenobserved, even in areas where the total precipitation has decreased. And the fingerprint ofhuman influence has been found in these increases.4 This is of particular concern as heavyprecipitation contributes to destructive and costly events such as floods.5
Natural variability cannot explain the observed changes in precipitation intensity or geographicdistribution of precipitation. Rather, the observed changes follow from basic physical principlesand are consistent with a combination of natural factors and human influence.6
Heavy PrecipitationThe water holding capacity of the atmosphere increases in a warmer world. A 4% increase inatmospheric moisture has been observed and that is consistent with a warming climate.7Naturalvariability cannot account for the changes, and the fingerprint of human influence has beenidentified in these changes.8
Changes in the proportion of precipitation falling on very wet days (wettest 5% of days). The verticalscale shows percent change from 22.5%, the average of the base period (1961-1990). The smooth redcurve accounts for variation within a decade.Trenberth et al. 2007
The increased moisture in the atmosphere is driving the shift to heavier but less frequent rains— “when it rains, it pours.” While an atmosphere that holds more moisture has greater potentialto produce heavier precipitation, precipitation events also become less frequent and shorter, as
9
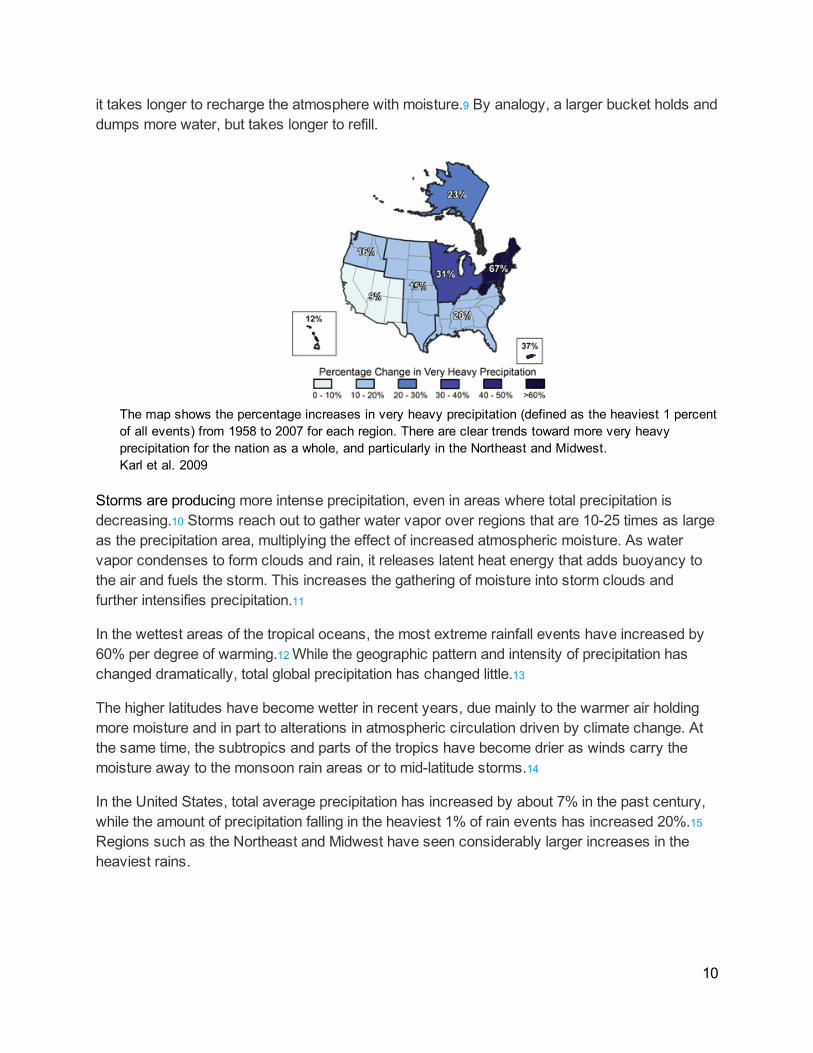
it takes longer to recharge the atmosphere with moisture.9 By analogy, a larger bucket holds anddumps more water, but takes longer to refill.
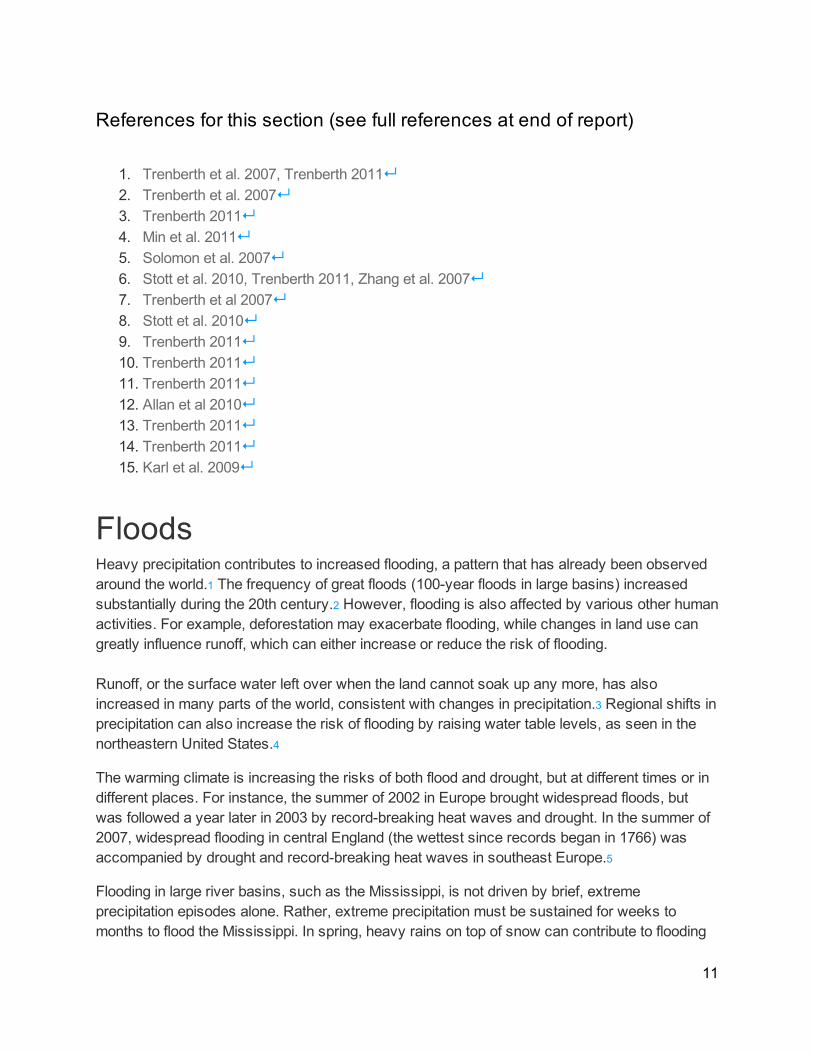
The map shows the percentage increases in very heavy precipitation (defined as the heaviest 1 percentof all events) from 1958 to 2007 for each region. There are clear trends toward more very heavyprecipitation for the nation as a whole, and particularly in the Northeast and Midwest.Karl et al. 2009
Storms are producing more intense precipitation, even in areas where total precipitation isdecreasing.10 Storms reach out to gather water vapor over regions that are 10-25 times as largeas the precipitation area, multiplying the effect of increased atmospheric moisture. As watervapor condenses to form clouds and rain, it releases latent heat energy that adds buoyancy tothe air and fuels the storm. This increases the gathering of moisture into storm clouds andfurther intensifies precipitation.11
In the wettest areas of the tropical oceans, the most extreme rainfall events have increased by60% per degree of warming.12 While the geographic pattern and intensity of precipitation haschanged dramatically, total global precipitation has changed little.13
The higher latitudes have become wetter in recent years, due mainly to the warmer air holdingmore moisture and in part to alterations in atmospheric circulation driven by climate change. Atthe same time, the subtropics and parts of the tropics have become drier as winds carry themoisture away to the monsoon rain areas or to mid-latitude storms.14
In the United States, total average precipitation has increased by about 7% in the past century,while the amount of precipitation falling in the heaviest 1% of rain events has increased 20%.15
Regions such as the Northeast and Midwest have seen considerably larger increases in theheaviest rains.
10
References for this section (see full references at end of report)
1. Trenberth et al. 2007, Trenberth 2011↵2. Trenberth et al. 2007↵3. Trenberth 2011↵4. Min et al. 2011↵5. Solomon et al. 2007↵6. Stott et al. 2010, Trenberth 2011, Zhang et al. 2007↵7. Trenberth et al 2007↵8. Stott et al. 2010↵9. Trenberth 2011↵10. Trenberth 2011↵11. Trenberth 2011↵12. Allan et al 2010↵13. Trenberth 2011↵14. Trenberth 2011↵15. Karl et al. 2009↵
FloodsHeavy precipitation contributes to increased flooding, a pattern that has already been observedaround the world.1 The frequency of great floods (100-year floods in large basins) increasedsubstantially during the 20th century.2 However, flooding is also affected by various other humanactivities. For example, deforestation may exacerbate flooding, while changes in land use cangreatly influence runoff, which can either increase or reduce the risk of flooding.
Runoff, or the surface water left over when the land cannot soak up any more, has alsoincreased in many parts of the world, consistent with changes in precipitation.3 Regional shifts inprecipitation can also increase the risk of flooding by raising water table levels, as seen in thenortheastern United States.4
The warming climate is increasing the risks of both flood and drought, but at different times or indifferent places. For instance, the summer of 2002 in Europe brought widespread floods, butwas followed a year later in 2003 by record-breaking heat waves and drought. In the summer of2007, widespread flooding in central England (the wettest since records began in 1766) wasaccompanied by drought and record-breaking heat waves in southeast Europe.5
Flooding in large river basins, such as the Mississippi, is not driven by brief, extremeprecipitation episodes alone. Rather, extreme precipitation must be sustained for weeks tomonths to flood the Mississippi. In spring, heavy rains on top of snow can contribute to flooding
11
in northern regions. Such long-term, heavy precipitation episodes are becoming more commonin some areas. In the U.S., 90-day periods of heavy rainfall were 20% more common from 1981to 2006 than in any earlier 25-year period on record.6 Record breaking Mississippi floodingoccurred in 2011 in association with very heavy rains, and was followed by extensive floodingfurther north in the Missouri River basin due to heavy rain and snowmelt.
Recent record floods, such as in Nashville, Tennessee in early 2010, in Pakistan in mid-2010,and in Australia in late 2010, were driven in part by the human-influenced trend toward heavyprecipitation.7Changes in large-scale patterns of atmospheric pressure also contributed to thePakistan flooding.8
References for this section (see full references at end of report)1. Parry et al. 2007↵2. Milly 2002↵3. Gutowski et al. 2008↵4. Weider and Boutt 2010↵5. Trenberth 2011↵6. Kunkel et al. 2008↵7. Ash 2011, Asrar 2010, and Trenberth 2010↵8. Stott 2010↵
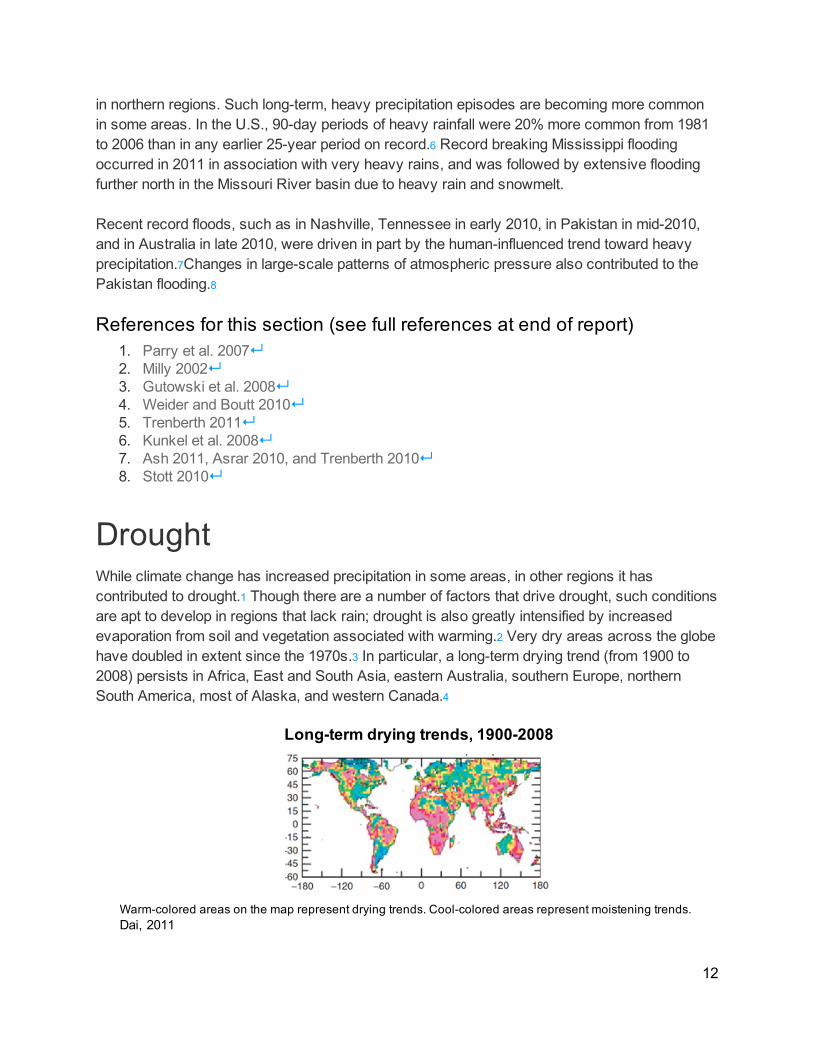
DroughtWhile climate change has increased precipitation in some areas, in other regions it hascontributed to drought.1 Though there are a number of factors that drive drought, such conditionsare apt to develop in regions that lack rain; drought is also greatly intensified by increasedevaporation from soil and vegetation associated with warming.2 Very dry areas across the globehave doubled in extent since the 1970s.3 In particular, a long-term drying trend (from 1900 to2008) persists in Africa, East and South Asia, eastern Australia, southern Europe, northernSouth America, most of Alaska, and western Canada.4
Long-term drying trends, 1900-2008
Warm-colored areas on the map represent drying trends. Cool-colored areas represent moistening trends.Dai, 2011
12
The global increase in drier, hotter areas and the trend in which dry areas are becoming driercan both be traced to the human influence.5 Drying trends have been observed in both theNorthern and Southern hemispheres since the 1950s.6 These trends cannot be explained bynatural variations but do fit well with climate model expectations for global warming.7 Inparticular, greenhouse gas emissions have contributed significantly to recent drying by drivingwarming over land and ocean.8
The increase in drought is caused by many factors: shortfalls in precipitation; earlier snow melt;a shift away from light and moderate rains towards short, heavy precipitation events; andincreased evaporation from soil and vegetation due to higher atmospheric temperatures, all ofwhich have been driven at least in part by climate change. Increased heating leads to greaterevaporation of moisture from land, thereby increasing the intensity and duration of drought.9Individual droughts have been linked to climate change, such as the drought that hit central Indiain 2008 when the north-south pattern of precipitation was disrupted by unusual weather drivenby abnormally high sea surface temperatures due in part to global warming.10
Wet and Dry Extremes Both Increasing Across the GlobeThe increase in drought is caused by many factors: shortfalls in precipitation, early snow melt, ashift away from light and moderate rains towards short, heavy precipitation events, andincreased evaporation due to higher temperatures, all of which have been driven in part byclimate change. Increased heating leads to greater evaporation of moisture from land, therebyincreasing the intensity and duration of drought.11
Alterations in atmospheric circulation have contributed to the distinctive pattern in globalprecipitation changes in recent years whereby the subtropics and much of the tropics (with theexception of the monsoon trough) have become drier.12 Rapid warming since the late 1970s hasboth evaporated large amounts of moisture from the land into the atmosphere and alteredatmospheric circulation patterns, contributing to the drying over land.13
Individual droughts have been linked to climate change, such as the drought that hit central Indiain 2008 when the north-south pattern of precipitation was disrupted by unusual weather drivenby abnormally high sea surface temperatures linked to global warming.14
Spring Snowmelt Shifting to Earlier in the Year
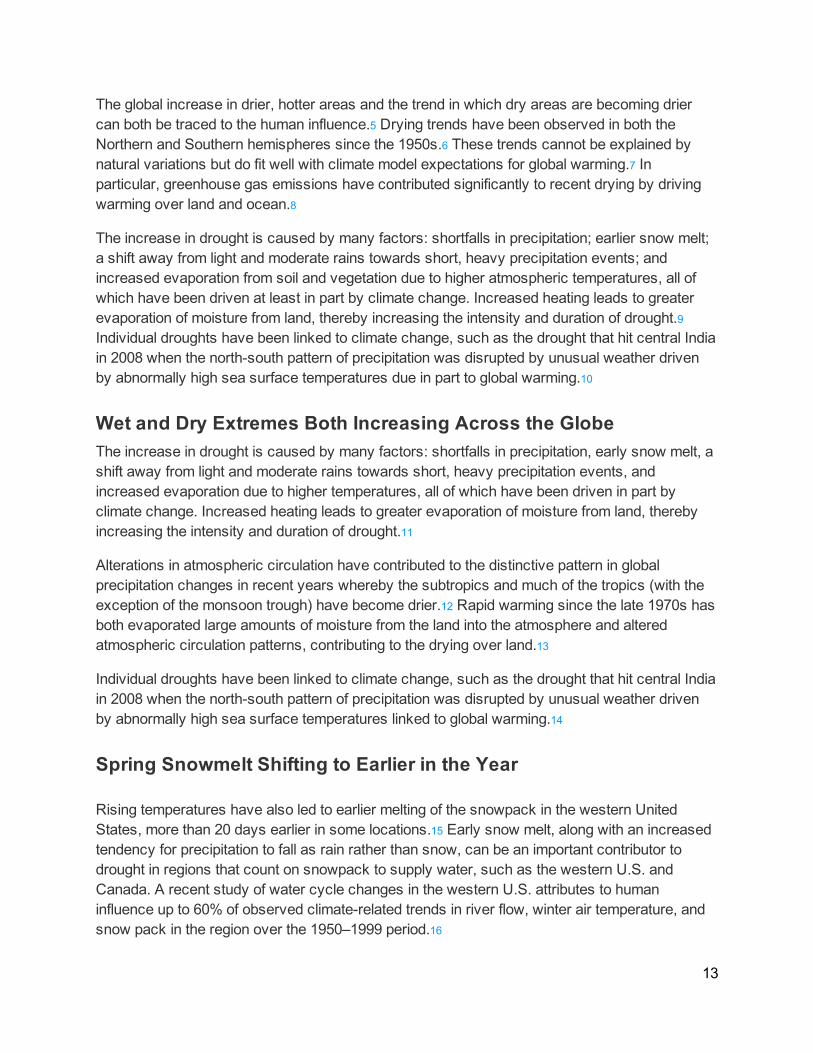
Rising temperatures have also led to earlier melting of the snowpack in the western UnitedStates, more than 20 days earlier in some locations.15 Early snow melt, along with an increasedtendency for precipitation to fall as rain rather than snow, can be an important contributor todrought in regions that count on snowpack to supply water, such as the western U.S. andCanada. A recent study of water cycle changes in the western U.S. attributes to humaninfluence up to 60% of observed climate-related trends in river flow, winter air temperature, andsnow pack in the region over the 1950–1999 period.16
13
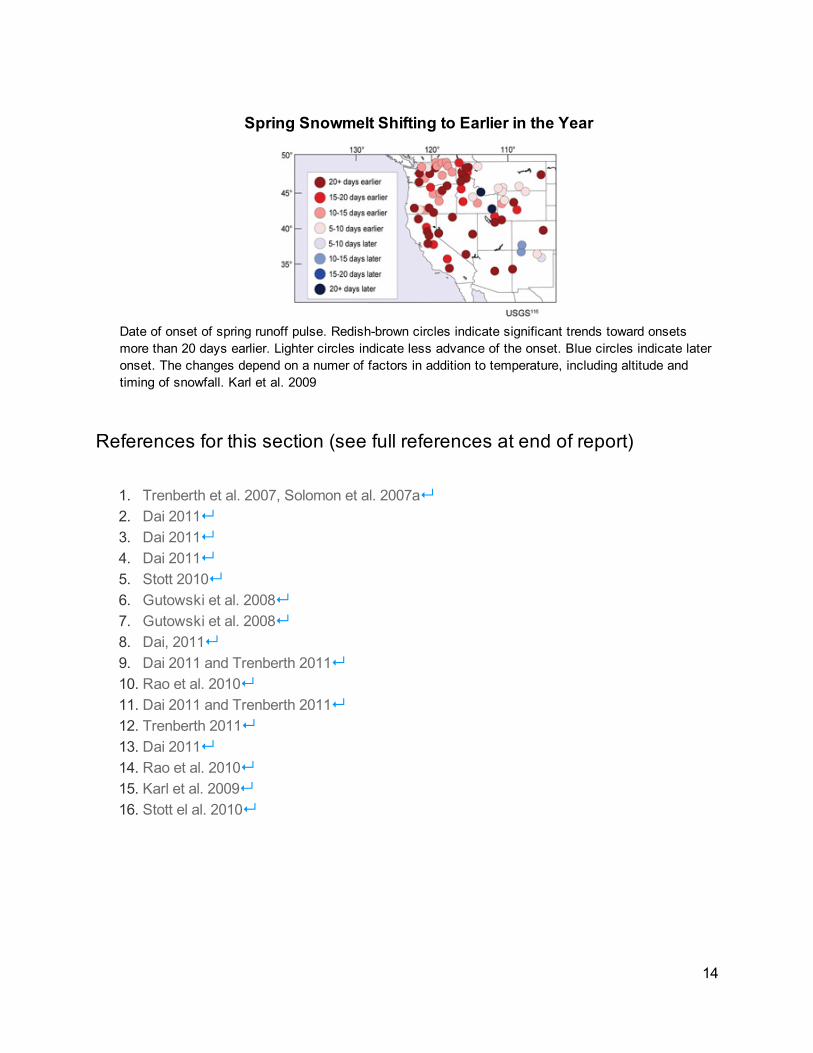
Spring Snowmelt Shifting to Earlier in the Year
Date of onset of spring runoff pulse. Redish-brown circles indicate significant trends toward onsetsmore than 20 days earlier. Lighter circles indicate less advance of the onset. Blue circles indicate lateronset. The changes depend on a numer of factors in addition to temperature, including altitude andtiming of snowfall. Karl et al. 2009
References for this section (see full references at end of report)
1. Trenberth et al. 2007, Solomon et al. 2007a↵2. Dai 2011↵3. Dai 2011↵4. Dai 2011↵5. Stott 2010↵6. Gutowski et al. 2008↵7. Gutowski et al. 2008↵8. Dai, 2011↵9. Dai 2011 and Trenberth 2011↵10. Rao et al. 2010↵11. Dai 2011 and Trenberth 2011↵12. Trenberth 2011↵13. Dai 2011↵14. Rao et al. 2010↵15. Karl et al. 2009↵16. Stott el al. 2010↵
14
Circulation Changes: El Niño and the ArcticOscillationLocal weather, particularly extreme local weather, is often determined by fluctuations in largepatterns of regional atmospheric pressure and sea surface temperatures, such as the ArcticOscillation (and its close relative, the North Atlantic Oscillation) and other patterns associatedwith El Niño-Southern Oscillation (ENSO). These recognizable patterns come and go over aperiod of months to years. And these patterns may be altered by global warming.
Circulation variations, such as the ones associated with ENSO, largely determine where stormy,wet weather is favored and where dry weather prevails. In regions where the effects of thesecirculation variations are similar to global warming effects, new extremes are observed. WhileENSO and other sources of natural variability can determine the location of extremes,1 theintensity and duration of the associated extremes such as droughts, and the associated heatwaves, have increased with climate change. Similarly, in the wet areas, the intensity of rains andrisk of flooding is greater.
Regional circulation patterns have significantly changed in recent years.2 For example, changesin the Arctic Oscillation cannot be explained by natural variation and it has been suggested thatthey are broadly consistent with the expected influence of human-induced climate change.3 Thesignature of global warming has also been identified in recent changes in the Pacific DecadalOscillation, a pattern of variability in sea surface temperatures in the northern Pacific Ocean.4El Niños have become more common and their intensity has nearly doubled in recent years, astatistically rare event. This recent shift towards more intense and frequent El Niños is related tothe recent increase in dry areas around the world.5 However, past observations andreconstructions of El Niño events from non-instrumental records such as corals show that ElNiño events naturally fluctuate in magnitude and frequency over time, and this has beendemonstrated in long climate model simulations of past and future climate as well.6
El Niño’s center of action appears to be shifting from the eastern to the central Pacific, which inturn is affecting the distribution and frequency of weather events.7 However, due to the widenatural fluctuations within circulation patterns, it is difficult to attribute recent changes solely tohuman activity. Further research is needed to determine how global warming impacts thesecirculation patterns.
Recent extreme weather events partially driven by circulationchanges:
15
“Snowmageddon,” United States, 2010A combination of changes in El Niño and the Arctic Oscillation (which is closely related to theNorth Atlantic Oscillation) has been identified as the immediate driver of the heavy snowfallexperienced by the mid-Atlantic states in the United States during the winter of 2010.8 The warmtropical Atlantic contributed extra moisture to the record snows. Global warming may havecontributed to the record negative phase of the Arctic Oscillation that helped to drive the extremeweather south to the U.S. (See Winter Storms section for more detail.)
Pakistan floods, 2010The weather pattern over northern India, the Himalayas, and Pakistan is usually dominated by acirculation pattern that prevents mid-latitude weather systems from penetrating very far south.However, in 2010, active weather systems spread southward into Pakistan. Global warming hadincreased the amount of atmospheric moisture available to condense into rain, and La Niña, acirculation pattern that can produce heavy rains in Pakistan, was in progress. These systemscombined with the monsoon to produce record rainfall. Record-breaking high temperatures inMoscow were another consequence of the mid-latitude weather moving southward, as was theexcessive rain and flooding over China.9 Several studies are currently exploring how climatechange may have contributed to these events, but scientists at the World MeteorologicalOrganization are already convinced that higher Atlantic Ocean temperatures from globalwarming were a contributing factor.10
Southeastern U.S. floods and drought, early 2000sThe recent dramatic swings between drought and flooding in the southeastern United Stateshave been found to be linked to changes in the North Atlantic Subtropical High (also known asthe Bermuda High), and these changes may be linked to global warming.11
The precise connections between global warming and circulation changes are still beinginvestigated and our understanding will evolve accordingly. However, we now know that climatechange is already affecting regional circulation patterns and by extension helping to shape localextreme weather.
References for this section (see full references at end of report)
1. Meehl and Teng, 2007↵2. Lee and McPhaden 2010, Stott 2010↵3. Stott 2010↵4. Bonfils and Santer 2010↵5. Dai 2011↵6. Meehl et al., 2006↵7. McPhaden 2010, Dai 2011↵8. Seager et al. 2010↵
16
9. Stott 2010↵10. Gronewald 2010↵11. Li et al. 2010↵
Hurricanes and Other Summer StormsAll storms, including thunderstorms, rain or snow storms, and tropical cyclones, are nowdeveloping in a warmer, moister environment. Consequently, storms are producing more heavyprecipitation, even in areas where total precipitation is decreasing.1 General storminess aroundthe world, as measured by wind speeds and ocean wave heights, has increased in recentyears, with the increase particularly pronounced in winter months. This pattern cannot beexplained by natural variability alone, and is consistent with model simulations of a warmingclimate.2
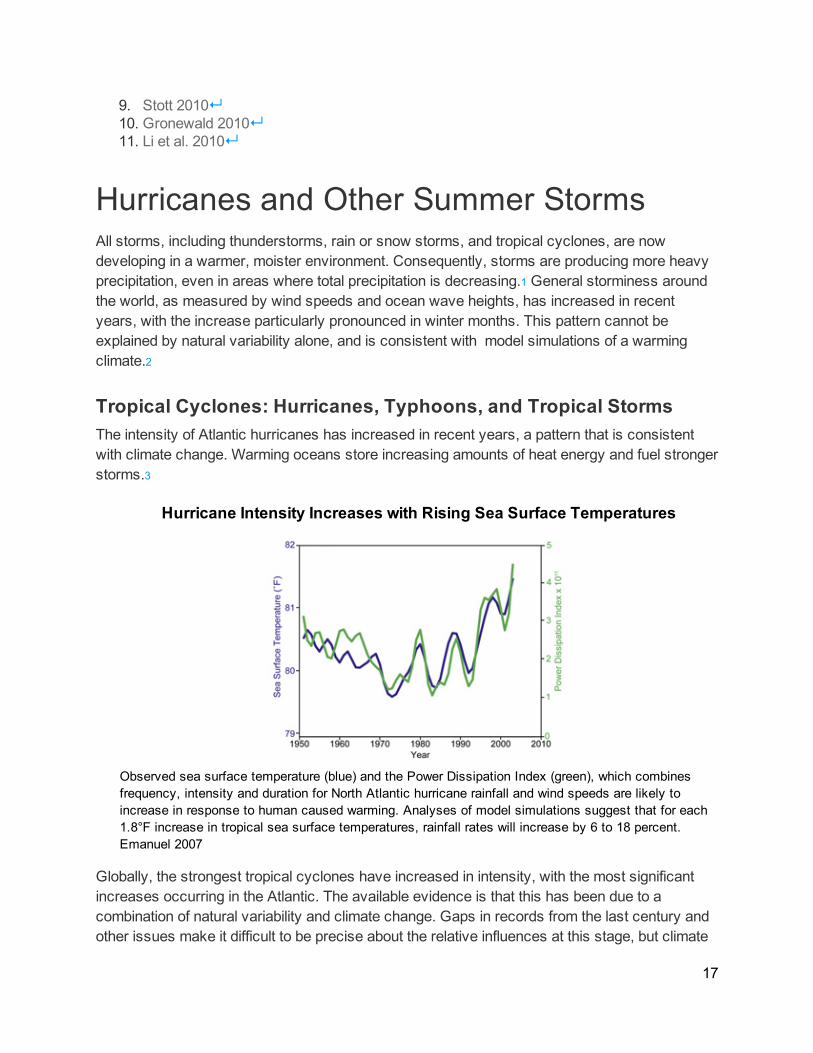
Tropical Cyclones: Hurricanes, Typhoons, and Tropical StormsThe intensity of Atlantic hurricanes has increased in recent years, a pattern that is consistentwith climate change. Warming oceans store increasing amounts of heat energy and fuel strongerstorms.3
Hurricane Intensity Increases with Rising Sea Surface Temperatures
Observed sea surface temperature (blue) and the Power Dissipation Index (green), which combinesfrequency, intensity and duration for North Atlantic hurricane rainfall and wind speeds are likely toincrease in response to human caused warming. Analyses of model simulations suggest that for each1.8°F increase in tropical sea surface temperatures, rainfall rates will increase by 6 to 18 percent.Emanuel 2007
Globally, the strongest tropical cyclones have increased in intensity, with the most significantincreases occurring in the Atlantic. The available evidence is that this has been due to acombination of natural variability and climate change. Gaps in records from the last century andother issues make it difficult to be precise about the relative influences at this stage, but climate
17
change is expected to dominate in the future.4
The Atlantic hurricane season is also getting longer, at a rate of 5 to 10 days per decade. Thebroadening of the season correlates with rising sea surface temperatures; each degree Celsiustemperature change corresponds to a 20-day shift in both the beginning and end of hurricaneseason. Here too, however, due to the uneven state of record keeping, we cannot rule out thepossibility of a role for natural variation in this trend.5
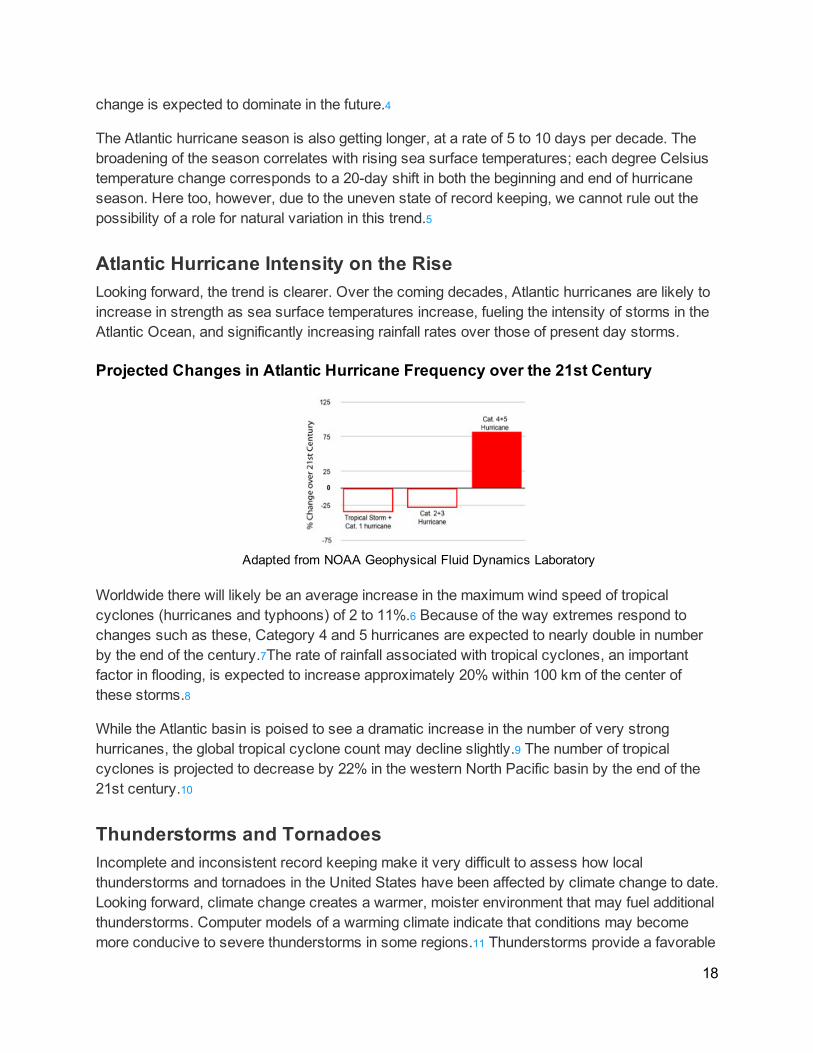
Atlantic Hurricane Intensity on the RiseLooking forward, the trend is clearer. Over the coming decades, Atlantic hurricanes are likely toincrease in strength as sea surface temperatures increase, fueling the intensity of storms in theAtlantic Ocean, and significantly increasing rainfall rates over those of present day storms.
Projected Changes in Atlantic Hurricane Frequency over the 21st Century
Adapted from NOAA Geophysical Fluid Dynamics Laboratory
Worldwide there will likely be an average increase in the maximum wind speed of tropicalcyclones (hurricanes and typhoons) of 2 to 11%.6 Because of the way extremes respond tochanges such as these, Category 4 and 5 hurricanes are expected to nearly double in numberby the end of the century.7The rate of rainfall associated with tropical cyclones, an importantfactor in flooding, is expected to increase approximately 20% within 100 km of the center ofthese storms.8
While the Atlantic basin is poised to see a dramatic increase in the number of very stronghurricanes, the global tropical cyclone count may decline slightly.9 The number of tropicalcyclones is projected to decrease by 22% in the western North Pacific basin by the end of the21st century.10
Thunderstorms and TornadoesIncomplete and inconsistent record keeping make it very difficult to assess how localthunderstorms and tornadoes in the United States have been affected by climate change to date.Looking forward, climate change creates a warmer, moister environment that may fuel additionalthunderstorms. Computer models of a warming climate indicate that conditions may becomemore conducive to severe thunderstorms in some regions.11 Thunderstorms provide a favorable
18
environment for tornado formation; but tornadoes also require wind shear, a highly uncertainelement in climate models.
Extreme WindsAverage wind speed over a majority of the world’s oceans has increased 5 to 10% over the past20 years, and the speed of extreme winds (the strongest 1% of winds) has increased by at least15% over the majority of oceans.12 On the other hand, surface wind speed over land appears tobe declining slightly in many mid-latitude locations, including the U.S.13 High-altitude circulationchanges associated with climate change may affect wind speeds, but land use factors such asurban development and vegetation growth are also major contributors to slowing land surfacewinds.14
References for this section (see full references at end of report)1. Trenberth 2011↵2. Stott et al. 2010↵3. Trenberth 2011↵4. Knutson et al. 2010↵5. Kossin 2008↵6. Knutson et al. 2010↵7. Knutson et al. 2010 and Bender et al. 2010↵8. Knutson et al. 2010↵9. Knutson et al. 2010↵10. Murakami et al. 2011↵11. Gutowski et al. 2008 and Trapp et al. 2007↵12. Young et al. 2011↵13. Vautard et al 2010, McVicar & Roderick 2010, Pryor et al 2009↵14. Vautard et al 2010↵
Winter StormsClimate change is fueling an increase in the intensity and snowfall of winter storms. Theatmosphere now holds more moisture, and that in turns drives heavier than normal precipitation,including heavier snowfall in the appropriate conditions.1Heavy snowfall and snowstorm frequency have increased in many northern parts of the UnitedStates.2 The heavier-than-normal snowfalls recently observed in the Midwest and NortheastUnited States are consistent with climate model projections. In contrast, the South and lowerMidwest saw reduced snowstorm frequency during the last century.3 Overall snow cover hasdecreased in the Northern Hemisphere, due in part to higher temperatures that shorten the timesnow spends on the ground.
19
Snowstorms Shift Northward in the Northern HemisphereThe regional pattern of fewer snowstorms in the southern United States and more in the Northcorresponds to a similar northward shift of cold-season storms in the entire NorthernHemisphere over the past 50 years. Mid-latitude storms have decreased in frequency (e.g., inthe United States overall) while high-latitude storm activity has increased (e.g., in Canada).4 It islikely that human influence contributed to these changes.5
Rapidly Warming Arctic Drives Recent Surprising ColdIn the past few years, unusually warm air in the Arctic has driven winter storm tracks south intothe United States, reflecting the complex and sometimes counteracting ways that climatechange may affect local weather extremes. In these events, cold-air usually penned in the Arcticby winds known as the polar vortex, broke out and reached the U.S. and Europe due to anerosion of the vortex, an erosion that may have been driven by an abnormally warm Arctic.6Despite the outbreak of Arctic air, the winters of 2010 and 2011 experienced by the U.S. andEurope were only slightly colder than the average of the winters experienced from 1951-1980,many of which were much colder that the 2010 and 2011 winters. The remaining eight of the last10 winters experienced by the U.S. were all warmer than the 1951-1980 average for the U.S.7
“Snowmageddon,” United States, February 2010A combination of changes in El Niño and the Arctic Oscillation (which is closely related to theNorth Atlantic Oscillation) has been identified as the immediate driver of the famously heavysnowfall experienced by the mid-Atlantic states in the United States during the winter of 2010.8Global warming may have played a part in this remarkable event by contributing in two ways tothe record negative phase of Arctic Oscillation that helped to erode the polar vortex andpermitted a cold-air outbreak south to the United States. Evidence suggests that the negativephase of the Arctic Oscillation was driven in part by warm air (air warmed by the dramaticseasonal loss of Arctic sea ice)9 as well as by changes in snow cover over Eurasia driven byclimate change.10 This event is part of an emerging trend in which a warming climate mayparadoxically bring colder, snowier winters to northern Europe and the eastern United States.11
Lake-effect Snowfall near the Great Lakes, February 2007In the Midwest, lake-effect snowfall has increased along and near the southern and easternshores of the Great Lakes since 1950. Lake-effect snow is produced by the strong flow of coldair across large areas of relatively warmer ice-free water. As the climate has warmed, icecoverage on the Great Lakes has fallen. This has created conditions conducive to greaterevaporation of moisture and thus heavier snowstorms. Among recent extreme lake-effect snowevents was a February 2007 10-day storm total of over 10 feet of snow in western New Yorkstate.12
20
References for this section (see full references at end of report)
1. Trenberth 2011↵2. Karl et al. 2009↵3. Karl et al. 2009↵4. Karl et al. 2009↵5. Gutowski et al. 2008↵6. Overland 2010, NOAA 2010a, and NOAA 2010b↵7. Hansen 2011↵8. Seager et al. 2010↵9. Overland 2010, NOAA 2010a, and NOAA 2010b↵10. Cohen et al. 2010↵11. Overland 2010, NOAA 2010a, NOAA 2010b, Cohen et al. 2010, and Vavrus et al 2006.↵12. Karl et al. 2009↵
ConclusionHuman-induced climate change has contributed to changing patterns of extreme weather acrossthe globe, from longer and hotter heat waves to heavier rains. From a broad perspective, allweather events are now connected to climate change. While natural variability continues to playa key role in extreme weather, climate change has shifted the odds and changed the naturallimits, making certain types of extreme weather more frequent and more intense.
While our understanding of how climate change affects extreme weather is still developing,evidence suggests that extreme weather may be affected even more than anticipated. Extremeweather is on the rise, and the indications are that it will continue to increase, in both predictableand unpredictable ways.
21
ReferencesAllan, R., 2011: Climate change: Human influence on rainfall. Nature 2011 Volume: 470, Pages:344–345 doi:10.1038/470344a
Allan, R. and B. Soden, 2008: Atmospheric Warming and the Amplification of PrecipitationExtremes.Science 2008: Vol. 321 no. 5895 pp. 1481-1484 DOI: 10.1126/science.1160787
Allan P., B. Soden, V. John, W. Ingram, and P. Good, 2010: Current changes in tropicalprecipitation.Environ. Res. Lett. 2010 doi: 10.1088/1748-9326/5/2/025205
Ash, Andrew, 2011: Coincidence or climate change? Australian Broadcasting News. February 3,2011. http://www.abc.net.au/unleashed/43560.html
Bender, M., T. Knutson, R. Tuleya, J. Sirutis, G. Vecchi, S. Garner, and I. Held, 2010: ModeledImpact of Anthropogenic Warming on the Frequency of Intense Atlantic Hurricanes. Science. 22January 2010: 327 (5964), 454-458. DOI:10.1126/science.1180568http://www.sciencemag.org/citmgr?gca=sci;327/5964/454
Bonfils, C. and B. Santer, 2010: Investigating the possibility of a human component in variouspacific decadal oscillation indices. Climate Dynamics 2010. DOI:10.1007/s00382-010-0920-1.http://dx.doi.org/10.1007/s00382-010-0920-1.
Changnon, S., D. Changnon, T. Karl, 2006: Temporal and Spatial Characteristics of Snowstormsin the Contiguous United States. J. Appl. Meteor. Climatol., 45, 1141–1155. doi:10.1175/JAM2395.1
Christidis N, P.A. Stott, F.W. Zwiers, H. Shiogama, and T. Nozawa, 2009: Probalistic estimatesof recent changes in temperature: a multi-scale attributions analysis. Climate Dynamics 2009.
Christidis, N., P.A. Stott, and S. Brown, 2011: The role of human activity in the recent warming ofextremely warm daytime temperatures. Journal of Climatedoi:10.1175/2011JCLI4150.1http://journals.ametsoc.org/doi/abs/10.1175/2011JCLI4150.1
Cohen, J., J. Foster, M. Barlow, K. Saito, and J. Jones, 2010: Winter 2009–2010: A case studyof an extreme Arctic Oscillation event, Geophys. Res. Lett., 37, L17707,doi:10.1029/2010GL044256.
Dai, A.: 2011: Drought under global warming: a review. Wiley Interdisciplinary Reviews: ClimateChange, 2: 45–65. doi: 10.1002/wcc.81
22
Ding, T., Qian, W. and Yan, Z. (2010), Changes in hot days and heat waves in China during1961–2007. International Journal of Climatology, 30: 1452–1462. doi: 10.1002/joc.1989
Emanuel, K., 2007: Environmental factors affecting tropical cyclone power dissipation. Journal ofClimate, 20(22), 5497-5509.
Groisman, P., Knight, R., Karl, T., Easterling, D., Sun B., and Lawrimore, J. 2004: ContemporaryChanges of the Hydrological Cycle over the Contiguous United States: Trends Derived from InSitu Observations. J. Hydrometeor, 5, 64–85. doi:10.1175/1525-7541(2004)005<0064:CCOTHC>2.0.CO;2
Gronewald, Nathaniel, 2010: Is the Flooding in Pakistan a Climate Change Disaster?Devastating flooding in Pakistan may foreshadow extreme weather to come as a result of globalwarming.Scientific American. August 18, 2010.http://www.scientificamerican.com/article.cfm?id=is-the-flooding-in-pakist
Gutowski, W.J., G.C. Hegerl, G.J. Holland, T.R. Knutson, L.O. Mearns, R.J. Stouffer, P.J.Webster, M.F. Wehner, F.W. Zwiers, 2008: Causes of Observed Changes in Extremes andProjections of Future Changes in Weather and Climate Extremes in a Changing Climate.Regions of Focus: North America, Hawaii, Caribbean, and U.S. Pacific Islands. T.R. Karl, G.A.Meehl, C.D. Miller, S.J. Hassol, A.M. Waple, and W.L. Murray (eds.). A Report by the U.S.Climate Change Science Program and the Subcommittee on Global Change Research,Washington, DC.
Hansen, J., 2011: Perceptions of Climate Change. March 27,2011.http://www.columbia.edu/~jeh1/mailings/
Hoerling, M., J. Eischeid, X. Quan, and T. Xu, 2007: Explaining the record 2006 US warmth.Geophys. Res. Letters, 34,doi:10.1029/2007GL030643.http://www.publicaffairs.noaa.gov/releases2007/aug07/noaa07-045.html
Karl, T.R., G.A. Meehl, T.C. Peterson, K.E. Kunkel, W.J. Gutowski, Jr., D.R. Easterling, 2008:Executive Summary in Weather and Climate Extremes in a Changing Climate. Regions ofFocus: North America, Hawaii, Caribbean, and U.S. Pacific Islands. T.R. Karl, G.A. Meehl, C.D.Miller, S.J. Hassol, A.M. Waple, and W.L. Murray (eds.). A Report by the U.S. Climate ChangeScience Program and the Subcommittee on Global Change Research, Washington, DC.Karl, T.R., G.A. Meehl, and T.C. Peterson, 2009: Global Climate Change Impacts in the UnitedStates. Cambridge University Press, 2009.
Knutson, T., J. McBride, J. Chan, K. Emanuel, G. Holland, C. Landsea, I. Held, J. Kossin, A.Srivastava, and M. Sugi, 2010: Tropical cyclones and climate change. Nature Geosci 2010http://dx.doi.org/10.1038/ngeo779http://www.nature.com/ngeo/journal/v3/n3/suppinfo/ngeo779_S
23
1.html
Kossin, J. P., 2008: Is the North Atlantic hurricane season getting longer? Geophys. Res. Lett.,35, L23705, doi:10.1029/2008GL036012
Kunkel, K.E., P.D. Bromirski, H.E. Brooks, T. Cavazos, A.V. Douglas, D.R. Easterling, K.A.Emanuel, P.Ya. Groisman, G.J. Holland, T.R. Knutson, J.P. Kossin, P.D. Komar, D.H. Levinson,and R.L. Smith, 2008: Observed changes in weather and climate extremes. In: Weather andClimate Extremes in a Changing Climate: Regions of Focus: North America, Hawaii, Caribbean,and U.S. Pacific Islands[Karl, T.R., G.A. Meehl, C.D. Miller, S.J. Hassol, A.M. Waple, and W.L.Murray (eds.)]. Synthesis and Assessment Product 3.3. U.S. Climate Change Science Program,Washington, DC, pp. 35-80.
Lazo, J., M. Lawson, P. Larsen, and D. Waldman, 2010: U.S. Economic Sensitivity to WeatherVariability. Bulletin of the American Meteorological Society.doi:10.1175/2011BAMS2928.1http://journals.ametsoc.org/doi/abs/10.1175/2011BAMS2928.1
Lee, T., and M. J. McPhaden, 2010: Increasing intensity of El Niño in the central-equatorialPacific,Geophys. Res. Lett., 37, L14603, doi:10.1029/2010GL044007.
Li, W., L. Li, R. Fu, Y. Deng, and H. Wang, 2010: Changes to the North Atlantic Subtropical Highand Its Role in the Intensification of Summer Rainfall Variability in the Southeastern UnitedStates.Journal of Climate 2010doi:10.1175/2010JCLI3829.1http://journals.ametsoc.org/doi/abs/10.1175/2010JCLI3829.1
Lott N., T. Ross, A. Smith, T. Houston and K. Shein, 2011: Billion Dollar U.S. Weather Disasters,1980-2010. National Climatic Data Center. Jan. 18, 2011.http://www.ncdc.noaa.gov/oa/reports/billionz.html
Masters J., 2010: Bolivia ties its all-time heat record. Dr. Jeff Masters Wunderblog. November23, 2010. http://www.wunderground.com/blog/JeffMasters/comment.html?entrynum=1701
McPhaden, M., 2010 NASA/NOAA Study Finds El Niños Growing Stronger. NOAA NewsAugust 25, 2010. http://www.noaanews.noaa.gov/stories2010/20100825_elnino.html
McVicar, T. and Roderick, M. Atmospheric Science: Winds of Change. Nature Geoscience 3,747–748 (2010) doi:10.1038/ngeo1002http://www.nature.com/ngeo/journal/v3/n11/full/ngeo1002.html
Meehl, G.A., J.M. Arblaster and C. Tebaldi, 2007: Contributions of natural and anthropogenicforcing to changes in temperature extremes over the U.S. Geophys. Res. Lett., 34, L19709,doi:10.1029/2007GL030948.
24
Meehl, G.A., and H. Teng, 2007: Multi-model changes in El Niño teleconnections over NorthAmerica in a warmer climate. Cli. Dyn., 29, 779-790, DOI 10.1007/s00382-007-0268-3.
Meehl, G. A., H. Teng, and G. W. Branstator, 2006: Future changes of El Niño in two globalcoupled climate models. Climate Dynamics, 26, 549-566, doi: 10.1007/s00382-005-0098-0.
Meehl, G. A., T. F. Stocker, W.D. Collins, P. Friedlingstein, A.T. Gaye, J.M. Gregory, A. Kitoh,R. Knutti, J.M. Murphy, A. Noda, S.C.B. Raper, I.G. Watterson, A.J. Weaver, and Z. –C. Zhao,2007: Global Climate Projections. In: Climate Change 2007: The Physical Science Basis.Contribution of Working Group I to the Fourth Assessment Report of the IntergovernmentalPanel on Climate Change [Solomon, S., D. Qin, M. Manning, Z. Chen, M. Marquis, K.B. Averyt,M. Tignor and H.L. Miller (eds.)]. Cambridge University Press, Cambridge, United Kingdom andNew York, NY, USA, 747–845.
Meehl, G. A., C. Tebaldi, G. Walton, D. Easterling, and L. McDaniel, 2009: Relative increase ofrecord high maximum temperatures compared to record low minimum temperatures in the U.S.,Geophys. Res. Lett., 36, L23701, doi:10.1029/2009GL040736.
Milly, P.C.D., R. T. Wetherald, K. A. Dunne, and T. L. Delworth, 2002: Increasing risk of greatfloods in a changing climate. Nature (31 January 2002) doi:10.1038/415514a
Min S., X. Zhang, F. Zwiers, and G. Hegerl, 2011: Human contribution to more-intenseprecipitation extremes. Nature 2011 Volume: 470, Pages: 378–381. doi:10.1038/nature09763Murakami, H., B. Wang, and A. Kitoh, 2011: Future Change of Western North Pacific Typhoons:Projections by a 20-km-Mesh Global Atmospheric Model*. J. Climate, 24, 1154–1169. doi:10.1175/2010JCLI3723.1
NOAA 2010a. NOAA Arctic Report Card 2010. Future of Arctic Sea Ice and Global Impacts.http://www.arctic.noaa.gov/future/
NOAA 2010b. NOAA Arctic Report Card 2010. Warm Arctic-Cold Continents Pattern.http://www.arctic.noaa.gov/future/warm_arctic_cold_continent.html andhttp://www.arctic.noaa.gov/future/impacts-about.html
NOAA 2011. National Climatic Data Center. Billion Dollar U.S. Weather Disasters.http://www.ncdc.noaa.gov/oa/reports/billionz.html
Overland, J., M. Wang, and J. Walsh, 2010: Arctic Report Card. NOAA, Pacific MarineEnvironmental Laboratory, Seattle, WA Joint Institute for the Study of the Atmosphere andOcean, University of Washington, Seattle, WA International Arctic Research Center, Fairbanks,AK October 14, 2010. http://www.arctic.noaa.gov/reportcard/atmosphere.html
Pall P., T. Aina, D. Stone, P. Stott, T. Nozawa, A. Hilberts, D. Lohmann, and M. Allen, 2011:
25
Anthropogenic greenhouse gas contribution to flood risk in England and Wales in autumn 2000.Nature 2011 Volume: 470, Pages: 382–385 doi:10.1038/nature09762
Parry, M.L., O.F. Canziani, J.P. Palutikof and Co-authors, 2007: Technical Summary. ClimateChange 2007: Impacts, Adaptation and Vulnerability. Contribution of Working Group II to theFourth Assessment Report of the Intergovernmental Panel on Climate Change, M.L. Parry, O.F.Canziani, J.P. Palutikof, P.J. van der Linden and C.E. Hanson, Eds., Cambridge UniversityPress, Cambridge, UK, 23-78.
Peterson, T.C., D.M. Anderson, S.J. Cohen, M. Cortez-Vázquez, R.J. Murnane, C. Parmesan,D. Phillips, R.S. Pulwarty, J.M.R. Stone, 2008: Why Weather and Climate Extremes Matter inWeather and Climate Extremes in a Changing Climate. Regions of Focus: North America,Hawaii, Caribbean, and U.S. Pacific Islands. T.R. Karl, G.A. Meehl, C.D. Miller, S.J. Hassol,A.M. Waple, and W.L. Murray (eds.). A Report by the U.S. Climate Change Science Programand the Subcommittee on Global Change Research, Washington, DC.
Pryor, S. C., R. J. Barthelmie, D. T. Young, E. S. Takle, R. W. Arritt, D. Flory, W. J. GutowskiJr., A. Nunes, and J. Roads (2009), Wind speed trends over the contiguous United States, J.Geophys. Res., 114, D14105, doi:10.1029/2008JD011416.http://www.agu.org/pubs/crossref/2009/2008JD011416.shtml
Rao, Suryachandra A., Hemantkumar S. Chaudhari, Samir Pokhrel, B. N. Goswami, 2010:Unusual Central Indian Drought of Summer Monsoon 2008: Role of Southern Tropical IndianOcean Warming. J. Climate, 23, 5163–5174. doi: 10.1175/2010JCLI3257.1
Schär, C., P. Vidale, D. Luthi, C. Frei, C. Haberli, M. A. Liniger, and C. Appenzeller, 2004: Therole of increasing temperature variability in European summer heatwaves. Nature 2004.http://dx.doi.org/10.1038/nature02300
Seager, R., Y. Kushnir, J. Nakamura, M. Ting, and N. Naik, 2010: Northern Hemisphere wintersnow anomalies: ENSO, NAO and the winter of 2009/10, Geophys. Res. Lett., 37, L14703,doi:10.1029/2010GL043830
Solomon, S., D. Qin, M. Manning, R.B. Alley, T. Berntsen, N.L. Bindoff, Z. Chen, A.Chidthaisong, J.M. Gregory, G.C. Hegerl, M. Heimann, B. Hewitson, B.J. Hoskins, F. Joos, J.Jouzel, V. Kattsov, U. Lohmann, T. Matsuno, M. Molina, N. Nicholls, J. Overpeck, G. Raga, V.Ramaswamy, J. Ren, M. Rusticucci, R. Somerville, T.F. Stocker, P. Whetton, R.A. Wood and D.Wratt, 2007: Technical Summary. In: Climate Change 2007: The Physical Science Basis.Contribution of Working Group I to the Fourth Assessment Report of the IntergovernmentalPanel on Climate Change [Solomon, S., D. Qin, M. Manning, Z. Chen, M. Marquis, K.B. Averyt,M. Tignor and H.L. Miller (eds.)]. Cambridge University Press, Cambridge, United Kingdom andNew York, NY, USA.
26
Stott, Peter, 2010: Climate change: how to play our hand? There have always been extremes ofweather around the world but evidence suggests human influence is changing the odds. TheGuardian. August 9, 2010.http://www.guardian.co.uk/environment/2010/aug/09/climate-change-flooding
Stott, P.A. , D.A. Stone, and M.R. Allen, 2004: Human Contribution to the European heat wave of2003. Nature, 432(7017), 610-614
Stott, P. A., Gillett, N. P., Hegerl, G. C., Karoly, D. J., Stone, D. A., Zhang, X. and Zwiers, F. ,2010: Detection and attribution of climate change: a regional perspective. Wiley InterdisciplinaryReviews: Climate Change, 1: 192–211. doi: 10.1002/wcc.34
Tebaldi, C., K. Hayhoe, J. M. Arblaster, and G. A. Meehl, 2006: Going to the Extremes – AnIntercomparison of Model-Simulated Historical and Future Changes in Extreme Events. ClimaticChange, 2006.
Trapp, R.J., N.S. Diffenbaugh, H.E. Brooks, M.E. Baldwin, E.D. Robinson, and J.S. Pal, 2007:Severe thunderstorm environment frequency during the 21st century caused byanthropogenically enhanced global radiative forcing, PNAS 104 no. 50, 19719-19723, Dec. 11,2007.
Trenberth, K.E., P.D. Jones, P. Ambenje, R. Bojariu, D. Easterling, A. Klein Tank, D. Parker, F.Rahimzadeh, J.A. Renwick, M. Rusticucci, B. Soden and P. Zhai, 2007: Chapter 3,Observations: Surface and Atmospheric Climate Change. In: Climate Change 2007: ThePhysical Science Basis. Contribution of Working Group I to the Fourth Assessment Report ofthe Intergovernmental Panel on Climate Change [Solomon, S., D. Qin, M. Manning, Z. Chen, M.Marquis, K.B. Averyt, M. Tignor and H.L. Miller (eds.)]. Cambridge University Press, Cambridge,United Kingdom and New York, NY, USA.
Trenberth, K. E., 1999: The extreme weather events of 1997 and 1998. Consequences, 5, 1,2–15.http://www.gcrio.org/CONSEQUENCES/vol5no1/extreme.html
Trenberth, K., 2010: Tennessee Floods Demonstrate Potential Impacts of Climate Change.Project on Climate Science. May 5, 2010.http://theprojectonclimatescience.org/press-room/tennessee-floods-demonstrate-potential-impacts-of-climate-change/
Trenberth, K. E., 2011: Changes in precipitation with climate change. Climate Research.doi:10.3354/cr00953, in press.
Trewin, B. and H. Vermont, 2010: Changes in the frequency of record temperatures in Australia,1957-2009. Australian Meteorological and Oceanographic Journal, 60, 113-119.
27
Vautard, R., Cattiaux, J., Yiou, P, Thépaut, J., and Ciais, P. Northern Hemisphere atmosphericstilling partly attributed to an increase in surface roughness. Nature Geoscience 3, 756–761(2010) doi:10.1038/ngeo979. http://www.nature.com/ngeo/journal/v3/n11/full/ngeo979.html
Vavrus, S., J. Walsh, W. Chapman, and D. Portis, 2006: The behavior of extreme cold airoutbreaks under greenhouse warming. Int. J. Climatol. 26: 1133–1147 (2006) DOI:10.1002/joc.1301
Weider, K., and D. F. Boutt (2010): Heterogeneous water table response to climate revealed by60 years of ground water data, Geophys. Res. Lett., 37, L24405, doi:10.1029/2010GL045561.
Wentz, F., L. Ricciardulli, K. Hilburn, and C. Mears, 2007: How Much More Rain Will GlobalWarming Bring? Science 13 July 2007: 317 (5835), 233-235. Published online 31 May 2007[DOI:10.1126/science.1140746]
Wergen, G. and J. Krug, 2010: Record-breaking temperatures reveal a warming climate.Europhysics Letters, Volume 92, Issue 3, pp. 30008 (2010). DOI: 10.1209/0295-5075/92/30008Young, I., S. Zieger, A. Babanin: Global Trends in Wind Speed and Wave Height. Science. 2011Mar 24. DOI: 10.1126/science.1197219
Zhang, X., F.W. Zwiers, G.C. Hegerl, F.H. Lambert, N.P. Gillett, S. Solomon, P. Stott and T.Nozawa, 2007: Detection of human influence on 20th century precipitation trends. Nature.doi:10.1038/nature06025
Zwiers F., X. Zhang, and Y. Feng, 2010: Anthropogenic Influence on Long Return Period DailyTemperature Extremes at Regional Scales. Journal of Climate 2010doi:10.1175/2010JCLI3908.1
28