current employment statistics benchmark article · from the current employment statistics (ces)...
TRANSCRIPT
U.S. Bureau of Labor Statistics Page 1 of 51
Benchmark Article BLS National Establishment Survey Estimates Revised to Incorporate March 2012 Benchmarks Introduction ..................................................................................................................................... 1 Summary of the benchmark revisions............................................................................................. 2 Revisions in the post-benchmark period ......................................................................................... 9 Changes to the CES published series ............................................................................................ 11
Series changes ........................................................................................................................... 11 Reconstructed data .................................................................................................................... 24 Seasonally adjusted data publication change ............................................................................ 24
Data clarification ........................................................................................................................... 25 Why benchmarks differ from estimates ........................................................................................ 26 Benchmark revision effects for other data types........................................................................... 26 Methods......................................................................................................................................... 33
Benchmark adjustment procedure ............................................................................................ 33 Benchmark source material ...................................................................................................... 33 Business birth and death estimation .......................................................................................... 34
Availability of revised data ........................................................................................................... 35 Small domain model ..................................................................................................................... 35 Seasonal adjustment procedure ..................................................................................................... 36
Special model adjustments ........................................................................................................ 36 Special notice regarding seasonal adjustment for AE hours and earnings ............................... 39 Seasonal adjustment model specifications ................................................................................ 39
Table of figures ............................................................................................................................. 51 Tables ........................................................................................................................................ 51 Exhibits ..................................................................................................................................... 51
Introduction
Kerrie Leslie Brenda Loya Kerrie Leslie and Brenda Loya are economists in the Division of Current Employment Statistics National, Office of Employment and Unemployment Statistics, Bureau of Labor Statistics. Telephone: (202) 691-6555; e-mail: [email protected] With the release of data for January 2013 on February 1, 2013, the Bureau of Labor Statistics (BLS) introduced its annual revision of National estimates of employment, hours, and earnings from the Current Employment Statistics (CES) monthly survey of nonfarm establishments. Each year, the CES survey realigns its sample-based estimates to incorporate universe counts of employment—a process known as benchmarking. Comprehensive counts of employment, or benchmarks, are derived primarily from unemployment insurance (UI) tax reports that nearly all employers are required to file with State Workforce Agencies.
Benchmark Article: BLS Establishment Estimates Revised to Incorporate March 2012 Benchmarks
U.S. Bureau of Labor Statistics Page 2 of 51
Back to Top
Summary of the benchmark revisions
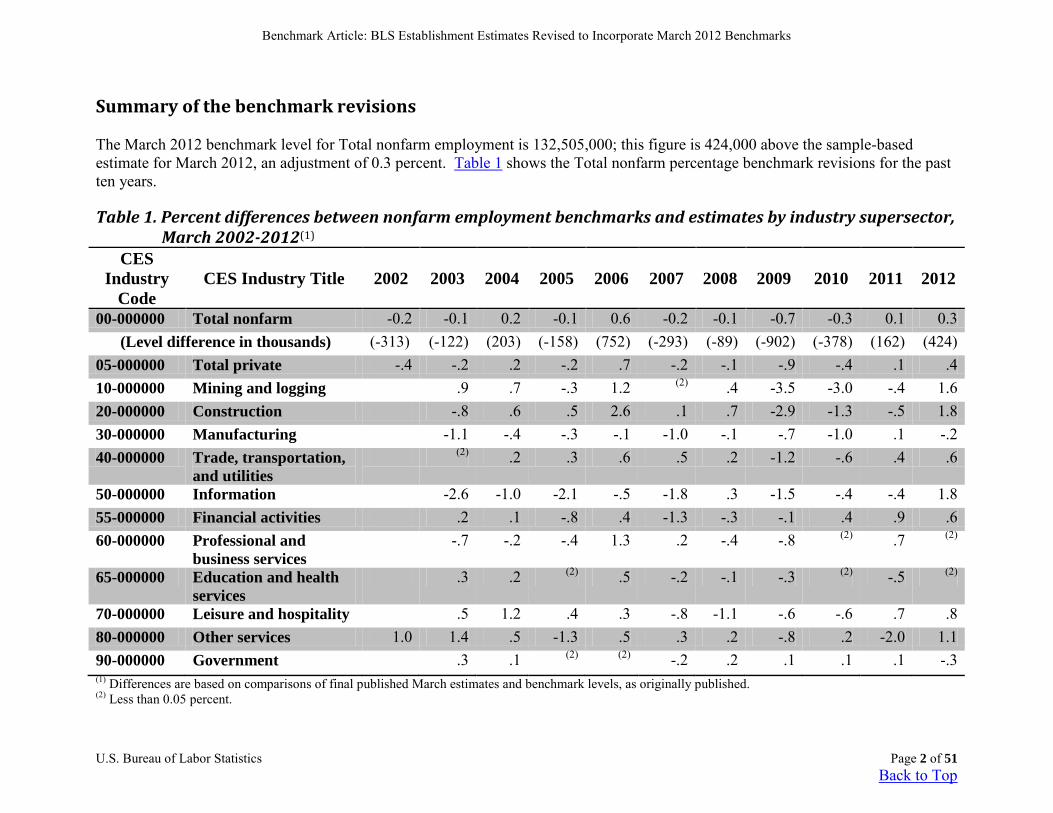
The March 2012 benchmark level for Total nonfarm employment is 132,505,000; this figure is 424,000 above the sample-based estimate for March 2012, an adjustment of 0.3 percent. Table 1 shows the Total nonfarm percentage benchmark revisions for the past ten years.
Table 1. Percent differences between nonfarm employment benchmarks and estimates by industry supersector, March 2002-2012(1)
CES Industry
Code CES Industry Title 2002 2003 2004 2005 2006 2007 2008 2009 2010 2011 2012
00-000000 Total nonfarm -0.2 -0.1 0.2 -0.1 0.6 -0.2 -0.1 -0.7 -0.3 0.1 0.3 (Level difference in thousands) (-313) (-122) (203) (-158) (752) (-293) (-89) (-902) (-378) (162) (424)
05-000000 Total private -.4 -.2 .2 -.2 .7 -.2 -.1 -.9 -.4 .1 .4 10-000000 Mining and logging .9 .7 -.3 1.2 (2) .4 -3.5 -3.0 -.4 1.6 20-000000 Construction -.8 .6 .5 2.6 .1 .7 -2.9 -1.3 -.5 1.8 30-000000 Manufacturing -1.1 -.4 -.3 -.1 -1.0 -.1 -.7 -1.0 .1 -.2 40-000000 Trade, transportation,
and utilities (2) .2 .3 .6 .5 .2 -1.2 -.6 .4 .6
50-000000 Information -2.6 -1.0 -2.1 -.5 -1.8 .3 -1.5 -.4 -.4 1.8 55-000000 Financial activities .2 .1 -.8 .4 -1.3 -.3 -.1 .4 .9 .6 60-000000 Professional and
business services -.7 -.2 -.4 1.3 .2 -.4 -.8 (2) .7 (2)
65-000000 Education and health services
.3 .2 (2) .5 -.2 -.1 -.3 (2) -.5 (2)
70-000000 Leisure and hospitality .5 1.2 .4 .3 -.8 -1.1 -.6 -.6 .7 .8 80-000000 Other services 1.0 1.4 .5 -1.3 .5 .3 .2 -.8 .2 -2.0 1.1 90-000000 Government .3 .1 (2) (2) -.2 .2 .1 .1 .1 -.3 (1) Differences are based on comparisons of final published March estimates and benchmark levels, as originally published. (2) Less than 0.05 percent.
Benchmark Article: BLS Establishment Estimates Revised to Incorporate March 2012 Benchmarks
U.S. Bureau of Labor Statistics Page 3 of 51
Back to Top
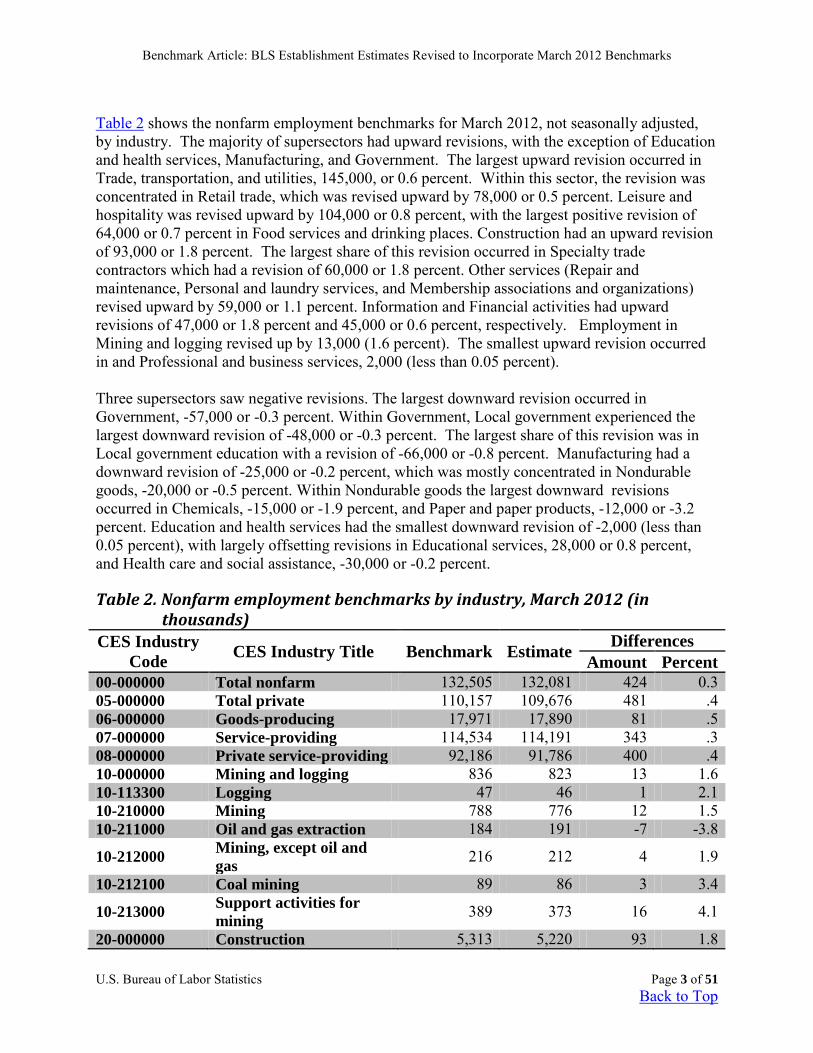
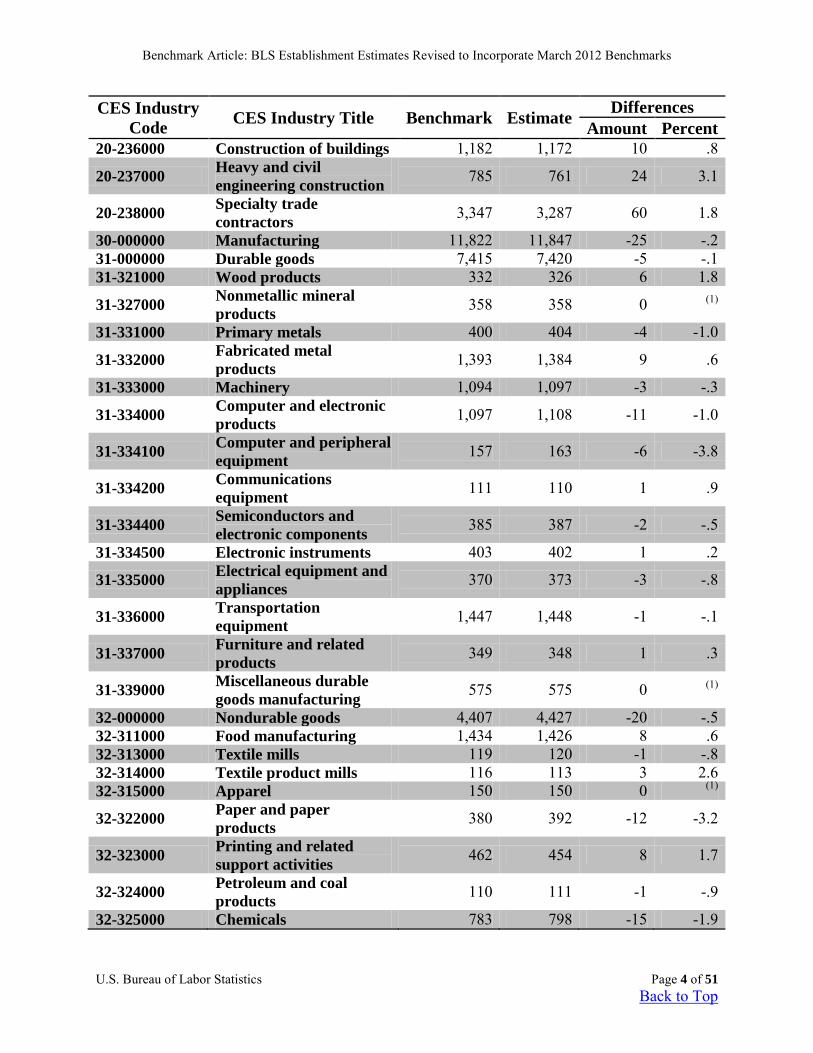
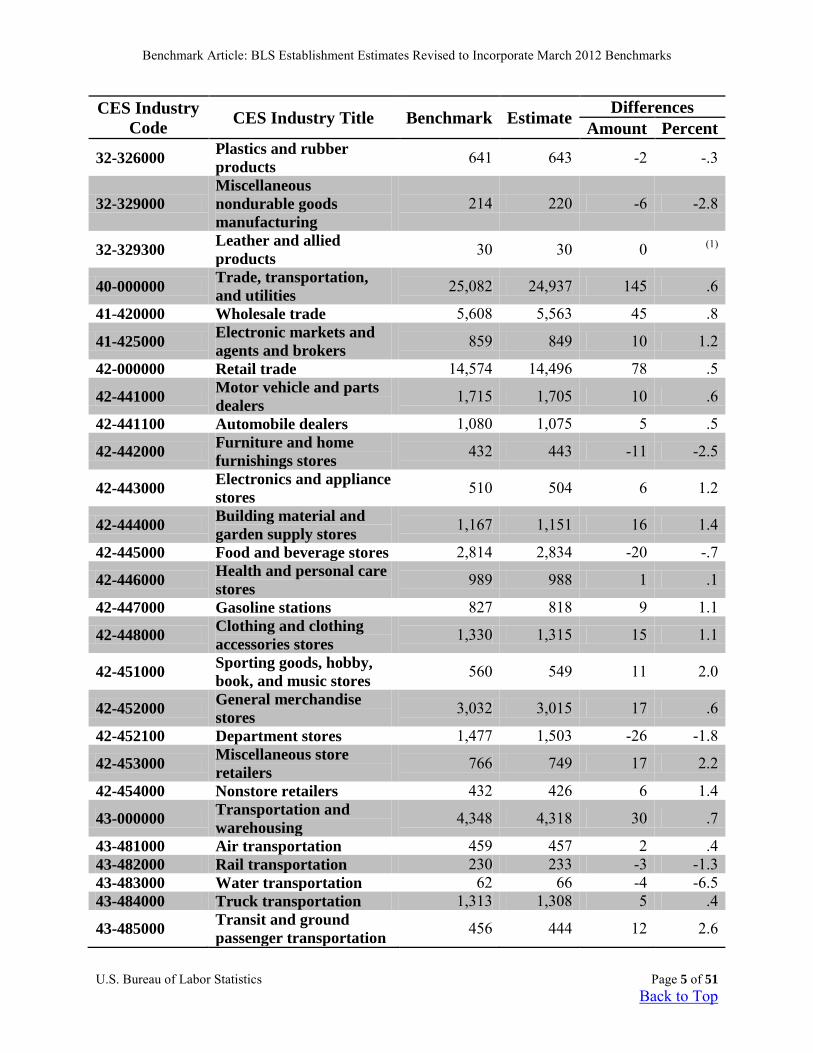
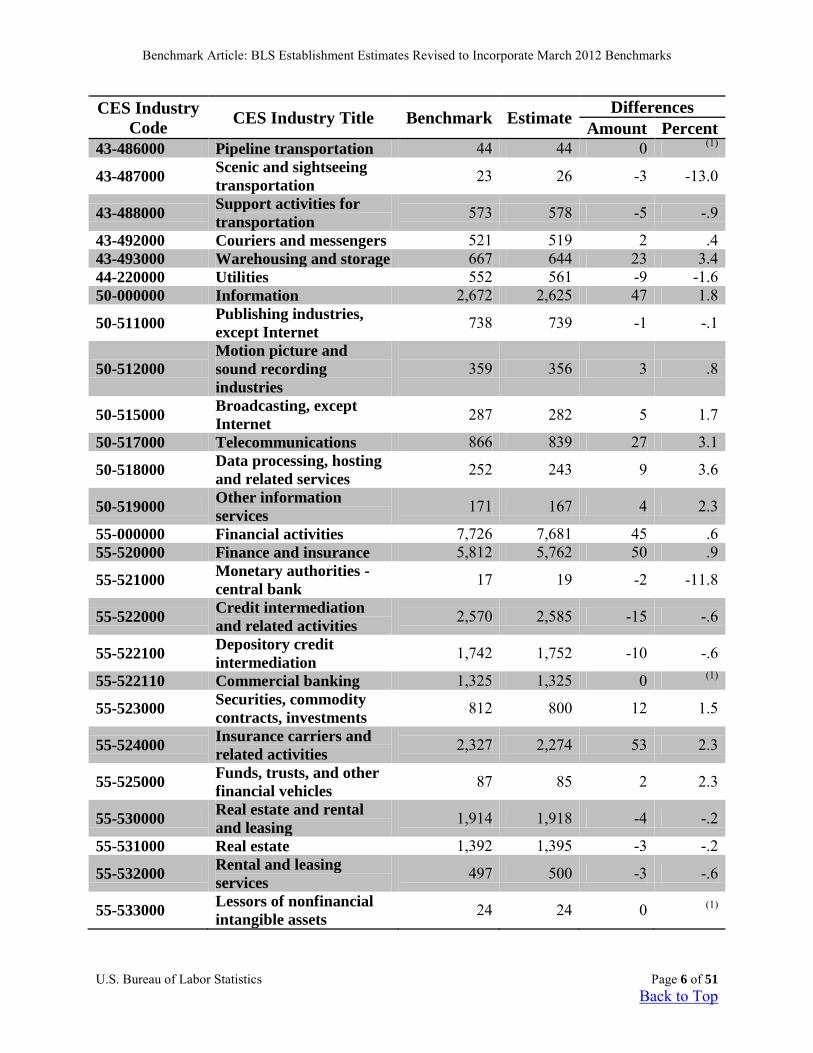
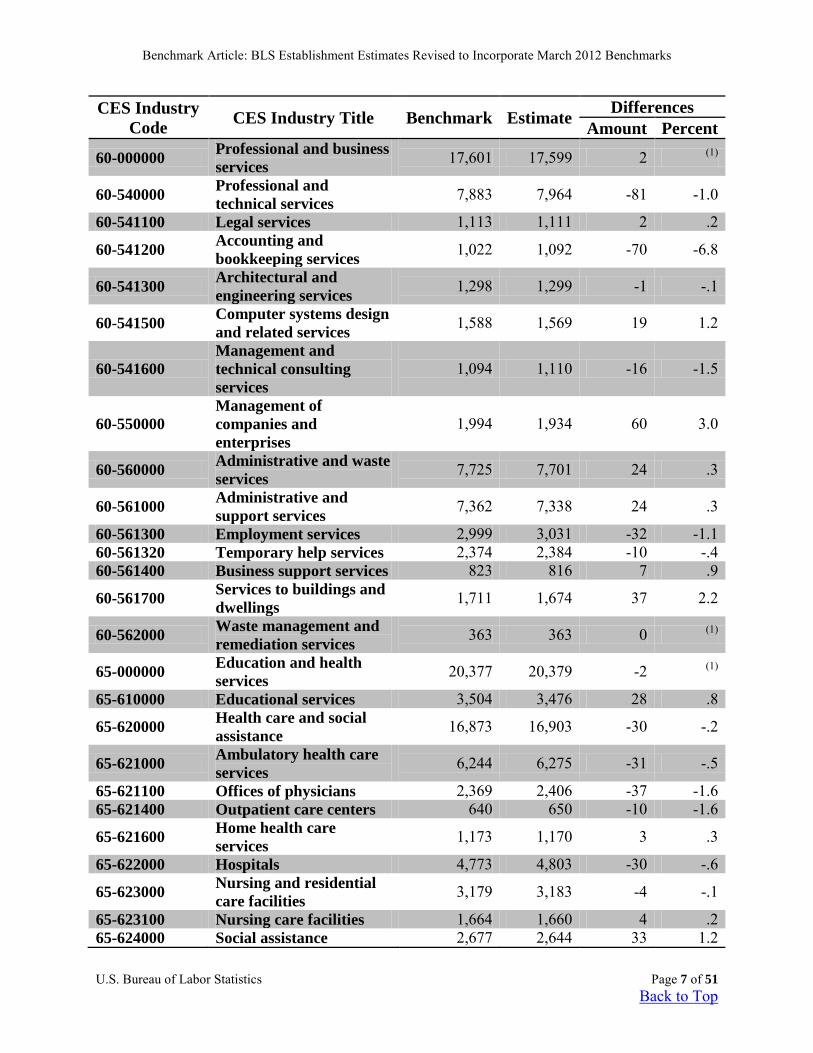
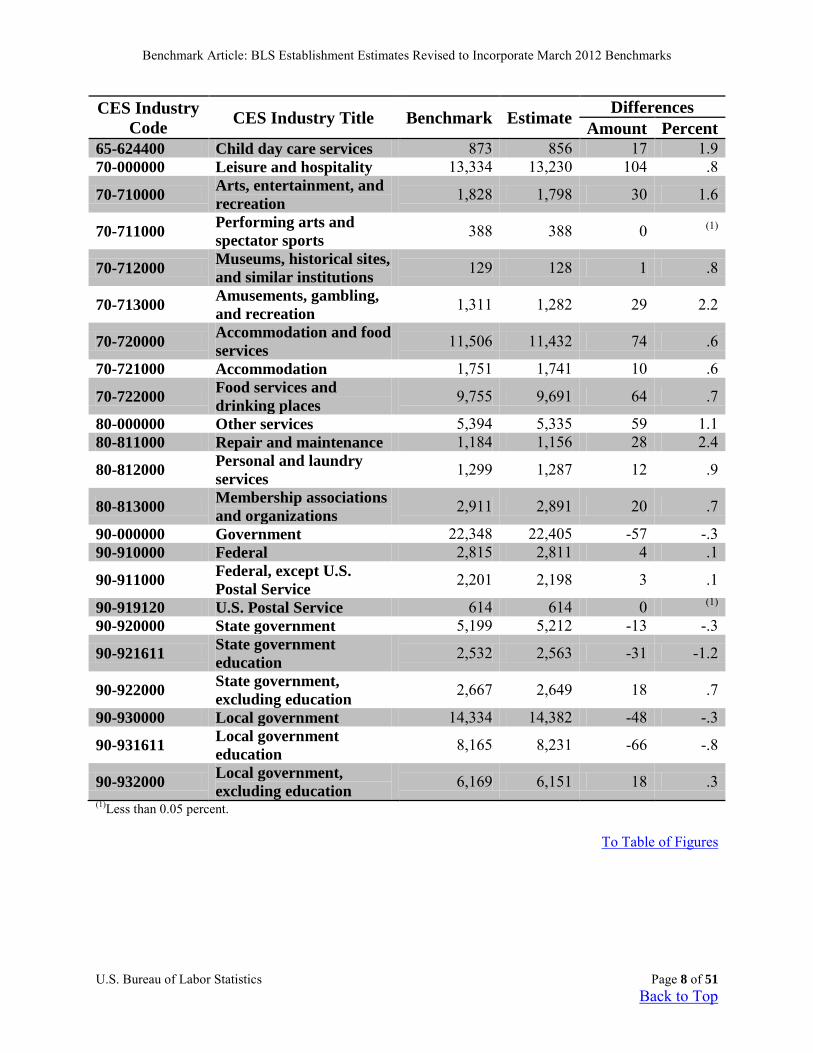
Table 2 shows the nonfarm employment benchmarks for March 2012, not seasonally adjusted, by industry. The majority of supersectors had upward revisions, with the exception of Education and health services, Manufacturing, and Government. The largest upward revision occurred in Trade, transportation, and utilities, 145,000, or 0.6 percent. Within this sector, the revision was concentrated in Retail trade, which was revised upward by 78,000 or 0.5 percent. Leisure and hospitality was revised upward by 104,000 or 0.8 percent, with the largest positive revision of 64,000 or 0.7 percent in Food services and drinking places. Construction had an upward revision of 93,000 or 1.8 percent. The largest share of this revision occurred in Specialty trade contractors which had a revision of 60,000 or 1.8 percent. Other services (Repair and maintenance, Personal and laundry services, and Membership associations and organizations) revised upward by 59,000 or 1.1 percent. Information and Financial activities had upward revisions of 47,000 or 1.8 percent and 45,000 or 0.6 percent, respectively. Employment in Mining and logging revised up by 13,000 (1.6 percent). The smallest upward revision occurred in and Professional and business services, 2,000 (less than 0.05 percent). Three supersectors saw negative revisions. The largest downward revision occurred in Government, -57,000 or -0.3 percent. Within Government, Local government experienced the largest downward revision of -48,000 or -0.3 percent. The largest share of this revision was in Local government education with a revision of -66,000 or -0.8 percent. Manufacturing had a downward revision of -25,000 or -0.2 percent, which was mostly concentrated in Nondurable goods, -20,000 or -0.5 percent. Within Nondurable goods the largest downward revisions occurred in Chemicals, -15,000 or -1.9 percent, and Paper and paper products, -12,000 or -3.2 percent. Education and health services had the smallest downward revision of -2,000 (less than 0.05 percent), with largely offsetting revisions in Educational services, 28,000 or 0.8 percent, and Health care and social assistance, -30,000 or -0.2 percent.
Table 2. Nonfarm employment benchmarks by industry, March 2012 (in thousands)
CES Industry Code CES Industry Title Benchmark Estimate Differences
Amount Percent 00-000000 Total nonfarm 132,505 132,081 424 0.3 05-000000 Total private 110,157 109,676 481 .4 06-000000 Goods-producing 17,971 17,890 81 .5 07-000000 Service-providing 114,534 114,191 343 .3 08-000000 Private service-providing 92,186 91,786 400 .4 10-000000 Mining and logging 836 823 13 1.6 10-113300 Logging 47 46 1 2.1 10-210000 Mining 788 776 12 1.5 10-211000 Oil and gas extraction 184 191 -7 -3.8
10-212000 Mining, except oil and gas 216 212 4 1.9
10-212100 Coal mining 89 86 3 3.4
10-213000 Support activities for mining 389 373 16 4.1
20-000000 Construction 5,313 5,220 93 1.8
Benchmark Article: BLS Establishment Estimates Revised to Incorporate March 2012 Benchmarks
U.S. Bureau of Labor Statistics Page 4 of 51
Back to Top
CES Industry Code CES Industry Title Benchmark Estimate Differences
Amount Percent 20-236000 Construction of buildings 1,182 1,172 10 .8
20-237000 Heavy and civil engineering construction 785 761 24 3.1
20-238000 Specialty trade contractors 3,347 3,287 60 1.8
30-000000 Manufacturing 11,822 11,847 -25 -.2 31-000000 Durable goods 7,415 7,420 -5 -.1 31-321000 Wood products 332 326 6 1.8
31-327000 Nonmetallic mineral products 358 358 0 (1)
31-331000 Primary metals 400 404 -4 -1.0
31-332000 Fabricated metal products 1,393 1,384 9 .6
31-333000 Machinery 1,094 1,097 -3 -.3
31-334000 Computer and electronic products 1,097 1,108 -11 -1.0
31-334100 Computer and peripheral equipment 157 163 -6 -3.8
31-334200 Communications equipment 111 110 1 .9
31-334400 Semiconductors and electronic components 385 387 -2 -.5
31-334500 Electronic instruments 403 402 1 .2
31-335000 Electrical equipment and appliances 370 373 -3 -.8
31-336000 Transportation equipment 1,447 1,448 -1 -.1
31-337000 Furniture and related products 349 348 1 .3
31-339000 Miscellaneous durable goods manufacturing 575 575 0 (1)
32-000000 Nondurable goods 4,407 4,427 -20 -.5 32-311000 Food manufacturing 1,434 1,426 8 .6 32-313000 Textile mills 119 120 -1 -.8 32-314000 Textile product mills 116 113 3 2.6 32-315000 Apparel 150 150 0 (1)
32-322000 Paper and paper products 380 392 -12 -3.2
32-323000 Printing and related support activities 462 454 8 1.7
32-324000 Petroleum and coal products 110 111 -1 -.9
32-325000 Chemicals 783 798 -15 -1.9
Benchmark Article: BLS Establishment Estimates Revised to Incorporate March 2012 Benchmarks
U.S. Bureau of Labor Statistics Page 5 of 51
Back to Top
CES Industry Code CES Industry Title Benchmark Estimate Differences
Amount Percent
32-326000 Plastics and rubber products 641 643 -2 -.3
32-329000 Miscellaneous nondurable goods manufacturing
214 220 -6 -2.8
32-329300 Leather and allied products 30 30 0 (1)
40-000000 Trade, transportation, and utilities 25,082 24,937 145 .6
41-420000 Wholesale trade 5,608 5,563 45 .8
41-425000 Electronic markets and agents and brokers 859 849 10 1.2
42-000000 Retail trade 14,574 14,496 78 .5
42-441000 Motor vehicle and parts dealers 1,715 1,705 10 .6
42-441100 Automobile dealers 1,080 1,075 5 .5
42-442000 Furniture and home furnishings stores 432 443 -11 -2.5
42-443000 Electronics and appliance stores 510 504 6 1.2
42-444000 Building material and garden supply stores 1,167 1,151 16 1.4
42-445000 Food and beverage stores 2,814 2,834 -20 -.7
42-446000 Health and personal care stores 989 988 1 .1
42-447000 Gasoline stations 827 818 9 1.1
42-448000 Clothing and clothing accessories stores 1,330 1,315 15 1.1
42-451000 Sporting goods, hobby, book, and music stores 560 549 11 2.0
42-452000 General merchandise stores 3,032 3,015 17 .6
42-452100 Department stores 1,477 1,503 -26 -1.8
42-453000 Miscellaneous store retailers 766 749 17 2.2
42-454000 Nonstore retailers 432 426 6 1.4
43-000000 Transportation and warehousing 4,348 4,318 30 .7
43-481000 Air transportation 459 457 2 .4 43-482000 Rail transportation 230 233 -3 -1.3 43-483000 Water transportation 62 66 -4 -6.5 43-484000 Truck transportation 1,313 1,308 5 .4
43-485000 Transit and ground passenger transportation 456 444 12 2.6
Benchmark Article: BLS Establishment Estimates Revised to Incorporate March 2012 Benchmarks
U.S. Bureau of Labor Statistics Page 6 of 51
Back to Top
CES Industry Code CES Industry Title Benchmark Estimate Differences
Amount Percent 43-486000 Pipeline transportation 44 44 0 (1)
43-487000 Scenic and sightseeing transportation 23 26 -3 -13.0
43-488000 Support activities for transportation 573 578 -5 -.9
43-492000 Couriers and messengers 521 519 2 .4 43-493000 Warehousing and storage 667 644 23 3.4 44-220000 Utilities 552 561 -9 -1.6 50-000000 Information 2,672 2,625 47 1.8
50-511000 Publishing industries, except Internet 738 739 -1 -.1
50-512000 Motion picture and sound recording industries
359 356 3 .8
50-515000 Broadcasting, except Internet 287 282 5 1.7
50-517000 Telecommunications 866 839 27 3.1
50-518000 Data processing, hosting and related services 252 243 9 3.6
50-519000 Other information services 171 167 4 2.3
55-000000 Financial activities 7,726 7,681 45 .6 55-520000 Finance and insurance 5,812 5,762 50 .9
55-521000 Monetary authorities - central bank 17 19 -2 -11.8
55-522000 Credit intermediation and related activities 2,570 2,585 -15 -.6
55-522100 Depository credit intermediation 1,742 1,752 -10 -.6
55-522110 Commercial banking 1,325 1,325 0 (1)
55-523000 Securities, commodity contracts, investments 812 800 12 1.5
55-524000 Insurance carriers and related activities 2,327 2,274 53 2.3
55-525000 Funds, trusts, and other financial vehicles 87 85 2 2.3
55-530000 Real estate and rental and leasing 1,914 1,918 -4 -.2
55-531000 Real estate 1,392 1,395 -3 -.2
55-532000 Rental and leasing services 497 500 -3 -.6
55-533000 Lessors of nonfinancial intangible assets 24 24 0 (1)
Benchmark Article: BLS Establishment Estimates Revised to Incorporate March 2012 Benchmarks
U.S. Bureau of Labor Statistics Page 7 of 51
Back to Top
CES Industry Code CES Industry Title Benchmark Estimate Differences
Amount Percent
60-000000 Professional and business services 17,601 17,599 2 (1)
60-540000 Professional and technical services 7,883 7,964 -81 -1.0
60-541100 Legal services 1,113 1,111 2 .2
60-541200 Accounting and bookkeeping services 1,022 1,092 -70 -6.8
60-541300 Architectural and engineering services 1,298 1,299 -1 -.1
60-541500 Computer systems design and related services 1,588 1,569 19 1.2
60-541600 Management and technical consulting services
1,094 1,110 -16 -1.5
60-550000 Management of companies and enterprises
1,994 1,934 60 3.0
60-560000 Administrative and waste services 7,725 7,701 24 .3
60-561000 Administrative and support services 7,362 7,338 24 .3
60-561300 Employment services 2,999 3,031 -32 -1.1 60-561320 Temporary help services 2,374 2,384 -10 -.4 60-561400 Business support services 823 816 7 .9
60-561700 Services to buildings and dwellings 1,711 1,674 37 2.2
60-562000 Waste management and remediation services 363 363 0 (1)
65-000000 Education and health services 20,377 20,379 -2 (1)
65-610000 Educational services 3,504 3,476 28 .8
65-620000 Health care and social assistance 16,873 16,903 -30 -.2
65-621000 Ambulatory health care services 6,244 6,275 -31 -.5
65-621100 Offices of physicians 2,369 2,406 -37 -1.6 65-621400 Outpatient care centers 640 650 -10 -1.6
65-621600 Home health care services 1,173 1,170 3 .3
65-622000 Hospitals 4,773 4,803 -30 -.6
65-623000 Nursing and residential care facilities 3,179 3,183 -4 -.1
65-623100 Nursing care facilities 1,664 1,660 4 .2 65-624000 Social assistance 2,677 2,644 33 1.2
Benchmark Article: BLS Establishment Estimates Revised to Incorporate March 2012 Benchmarks
U.S. Bureau of Labor Statistics Page 8 of 51
Back to Top
CES Industry Code CES Industry Title Benchmark Estimate Differences
Amount Percent 65-624400 Child day care services 873 856 17 1.9 70-000000 Leisure and hospitality 13,334 13,230 104 .8
70-710000 Arts, entertainment, and recreation 1,828 1,798 30 1.6
70-711000 Performing arts and spectator sports 388 388 0 (1)
70-712000 Museums, historical sites, and similar institutions 129 128 1 .8
70-713000 Amusements, gambling, and recreation 1,311 1,282 29 2.2
70-720000 Accommodation and food services 11,506 11,432 74 .6
70-721000 Accommodation 1,751 1,741 10 .6
70-722000 Food services and drinking places 9,755 9,691 64 .7
80-000000 Other services 5,394 5,335 59 1.1 80-811000 Repair and maintenance 1,184 1,156 28 2.4
80-812000 Personal and laundry services 1,299 1,287 12 .9
80-813000 Membership associations and organizations 2,911 2,891 20 .7
90-000000 Government 22,348 22,405 -57 -.3 90-910000 Federal 2,815 2,811 4 .1
90-911000 Federal, except U.S. Postal Service 2,201 2,198 3 .1
90-919120 U.S. Postal Service 614 614 0 (1) 90-920000 State government 5,199 5,212 -13 -.3
90-921611 State government education 2,532 2,563 -31 -1.2
90-922000 State government, excluding education 2,667 2,649 18 .7
90-930000 Local government 14,334 14,382 -48 -.3
90-931611 Local government education 8,165 8,231 -66 -.8
90-932000 Local government, excluding education 6,169 6,151 18 .3
(1)Less than 0.05 percent.
To Table of Figures
Benchmark Article: BLS Establishment Estimates Revised to Incorporate March 2012 Benchmarks
U.S. Bureau of Labor Statistics Page 9 of 51
Back to Top
Revisions in the post-benchmark period
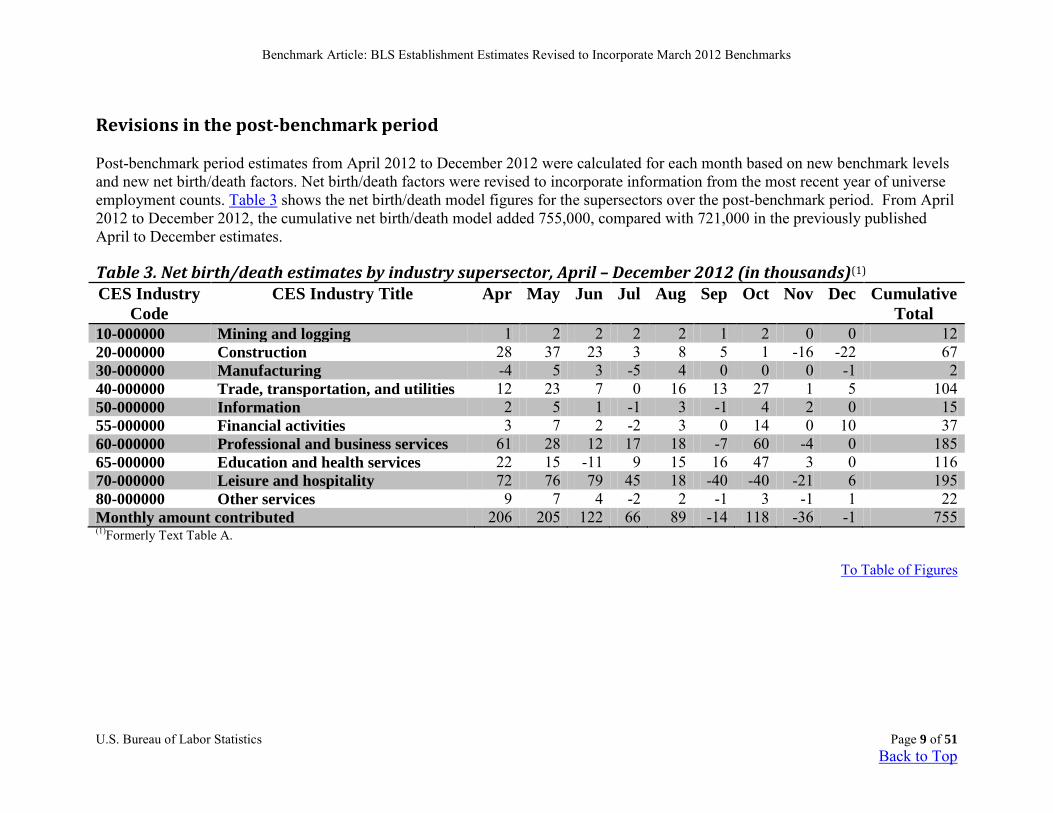
Post-benchmark period estimates from April 2012 to December 2012 were calculated for each month based on new benchmark levels and new net birth/death factors. Net birth/death factors were revised to incorporate information from the most recent year of universe employment counts. Table 3 shows the net birth/death model figures for the supersectors over the post-benchmark period. From April 2012 to December 2012, the cumulative net birth/death model added 755,000, compared with 721,000 in the previously published April to December estimates.
Table 3. Net birth/death estimates by industry supersector, April – December 2012 (in thousands)(1) CES Industry
Code CES Industry Title Apr May Jun Jul Aug Sep Oct Nov Dec Cumulative
Total 10-000000 Mining and logging 1 2 2 2 2 1 2 0 0 12 20-000000 Construction 28 37 23 3 8 5 1 -16 -22 67 30-000000 Manufacturing -4 5 3 -5 4 0 0 0 -1 2 40-000000 Trade, transportation, and utilities 12 23 7 0 16 13 27 1 5 104 50-000000 Information 2 5 1 -1 3 -1 4 2 0 15 55-000000 Financial activities 3 7 2 -2 3 0 14 0 10 37 60-000000 Professional and business services 61 28 12 17 18 -7 60 -4 0 185 65-000000 Education and health services 22 15 -11 9 15 16 47 3 0 116 70-000000 Leisure and hospitality 72 76 79 45 18 -40 -40 -21 6 195 80-000000 Other services 9 7 4 -2 2 -1 3 -1 1 22 Monthly amount contributed 206 205 122 66 89 -14 118 -36 -1 755 (1)Formerly Text Table A.
To Table of Figures
Benchmark Article: BLS Establishment Estimates Revised to Incorporate March 2012 Benchmarks
U.S. Bureau of Labor Statistics Page 10 of 51
Back to Top
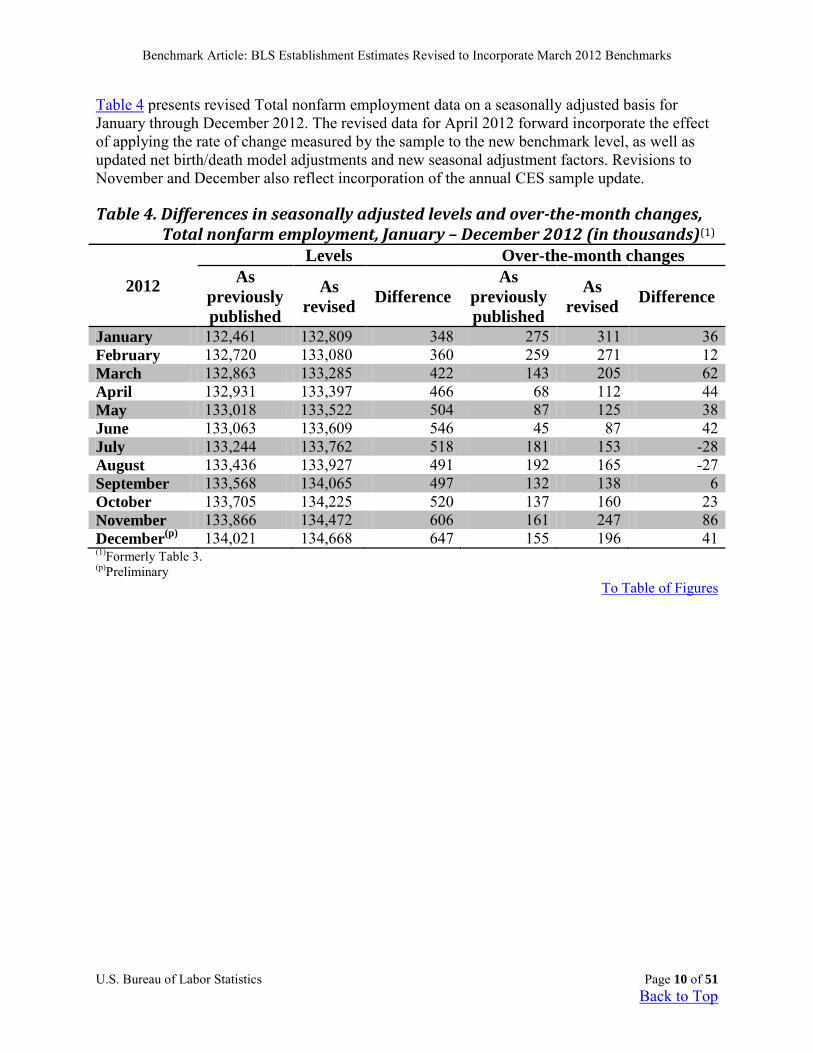
Table 4 presents revised Total nonfarm employment data on a seasonally adjusted basis for January through December 2012. The revised data for April 2012 forward incorporate the effect of applying the rate of change measured by the sample to the new benchmark level, as well as updated net birth/death model adjustments and new seasonal adjustment factors. Revisions to November and December also reflect incorporation of the annual CES sample update.
Table 4. Differences in seasonally adjusted levels and over-the-month changes, Total nonfarm employment, January – December 2012 (in thousands)(1)
2012
Levels Over-the-month changes As
previously published
As revised Difference
As previously published
As revised Difference
January 132,461 132,809 348 275 311 36 February 132,720 133,080 360 259 271 12 March 132,863 133,285 422 143 205 62 April 132,931 133,397 466 68 112 44 May 133,018 133,522 504 87 125 38 June 133,063 133,609 546 45 87 42 July 133,244 133,762 518 181 153 -28 August 133,436 133,927 491 192 165 -27 September 133,568 134,065 497 132 138 6 October 133,705 134,225 520 137 160 23 November 133,866 134,472 606 161 247 86 December(p) 134,021 134,668 647 155 196 41 (1)Formerly Table 3. (p)Preliminary
To Table of Figures
Benchmark Article: BLS Establishment Estimates Revised to Incorporate March 2012 Benchmarks
U.S. Bureau of Labor Statistics Page 11 of 51
Back to Top
Changes to the CES published series
With the release of the January 2013 estimates, CES incorporated series changes related to annual sample adequacy review, reconstructed the history of a series, and began publishing previously available but not published seasonally adjusted series.
Series changes
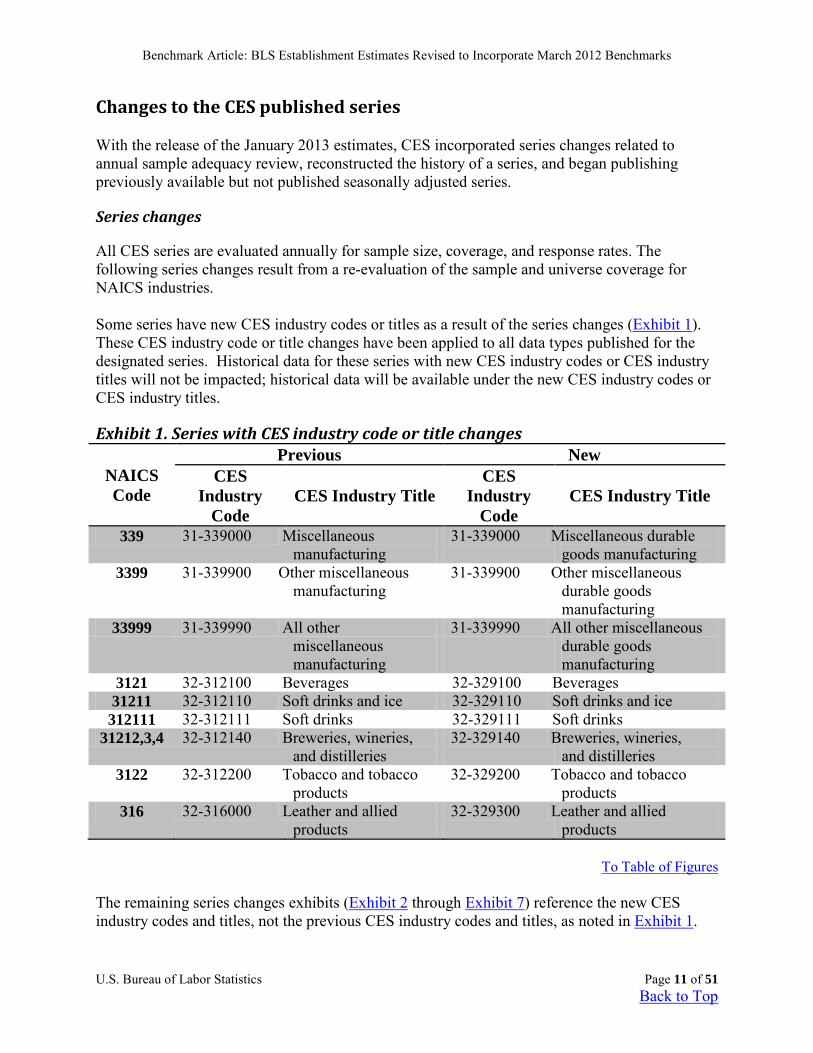
All CES series are evaluated annually for sample size, coverage, and response rates. The following series changes result from a re-evaluation of the sample and universe coverage for NAICS industries. Some series have new CES industry codes or titles as a result of the series changes (Exhibit 1). These CES industry code or title changes have been applied to all data types published for the designated series. Historical data for these series with new CES industry codes or CES industry titles will not be impacted; historical data will be available under the new CES industry codes or CES industry titles.
Exhibit 1. Series with CES industry code or title changes
NAICS Code
Previous New CES
Industry Code
CES Industry Title CES
Industry Code
CES Industry Title
339 31-339000 Miscellaneous manufacturing
31-339000 Miscellaneous durable goods manufacturing
3399 31-339900 Other miscellaneous manufacturing
31-339900 Other miscellaneous durable goods manufacturing
33999 31-339990 All other miscellaneous manufacturing
31-339990 All other miscellaneous durable goods manufacturing
3121 32-312100 Beverages 32-329100 Beverages 31211 32-312110 Soft drinks and ice 32-329110 Soft drinks and ice 312111 32-312111 Soft drinks 32-329111 Soft drinks
31212,3,4 32-312140 Breweries, wineries, and distilleries
32-329140 Breweries, wineries, and distilleries
3122 32-312200 Tobacco and tobacco products
32-329200 Tobacco and tobacco products
316 32-316000 Leather and allied products
32-329300 Leather and allied products
To Table of Figures
The remaining series changes exhibits (Exhibit 2 through Exhibit 7) reference the new CES industry codes and titles, not the previous CES industry codes and titles, as noted in Exhibit 1.
Benchmark Article: BLS Establishment Estimates Revised to Incorporate March 2012 Benchmarks
U.S. Bureau of Labor Statistics Page 12 of 51
Back to Top
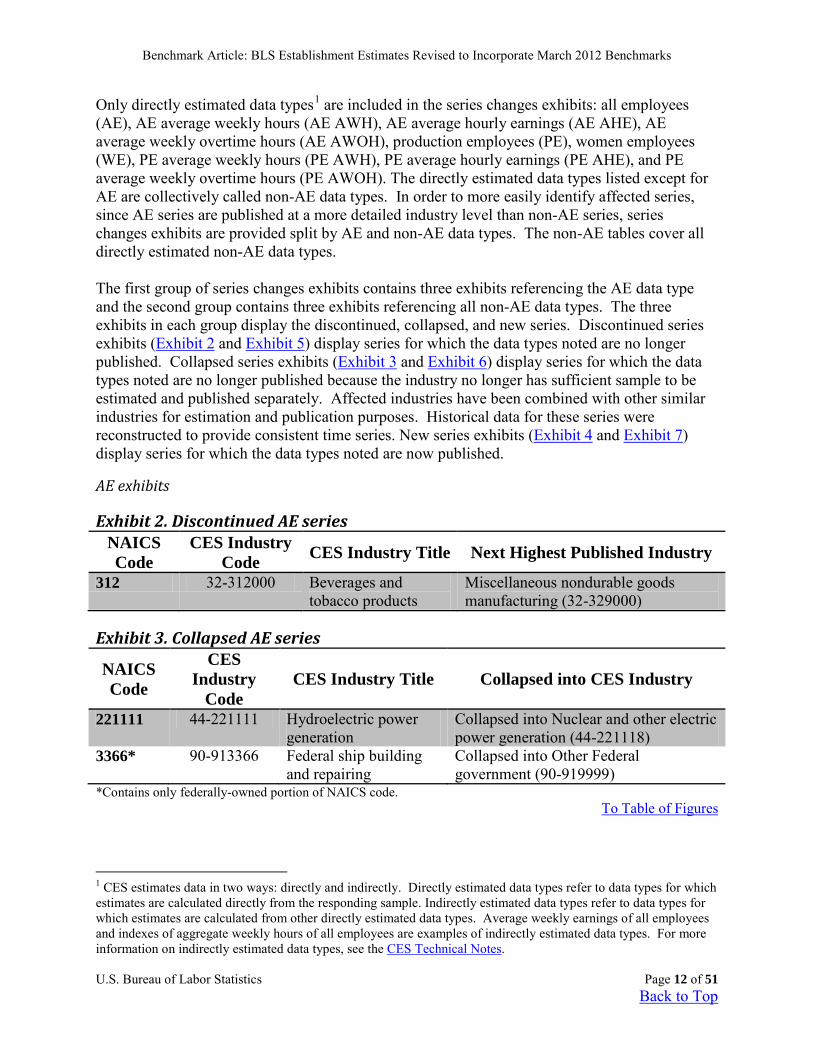
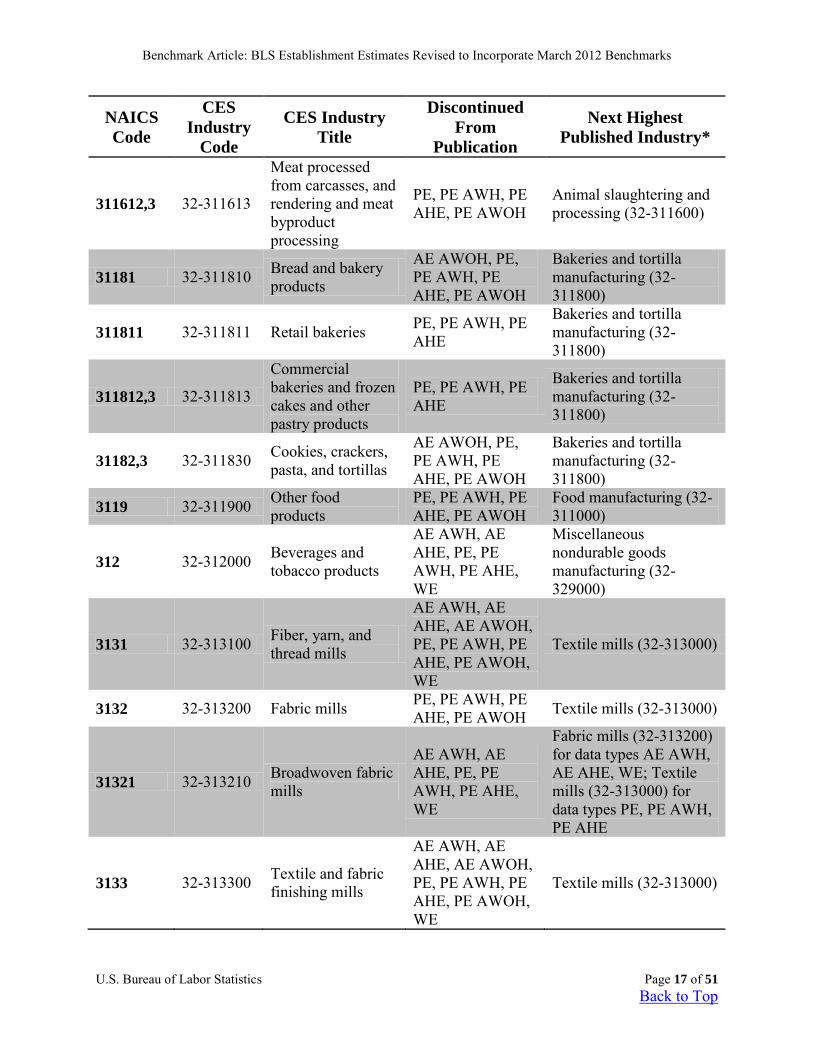
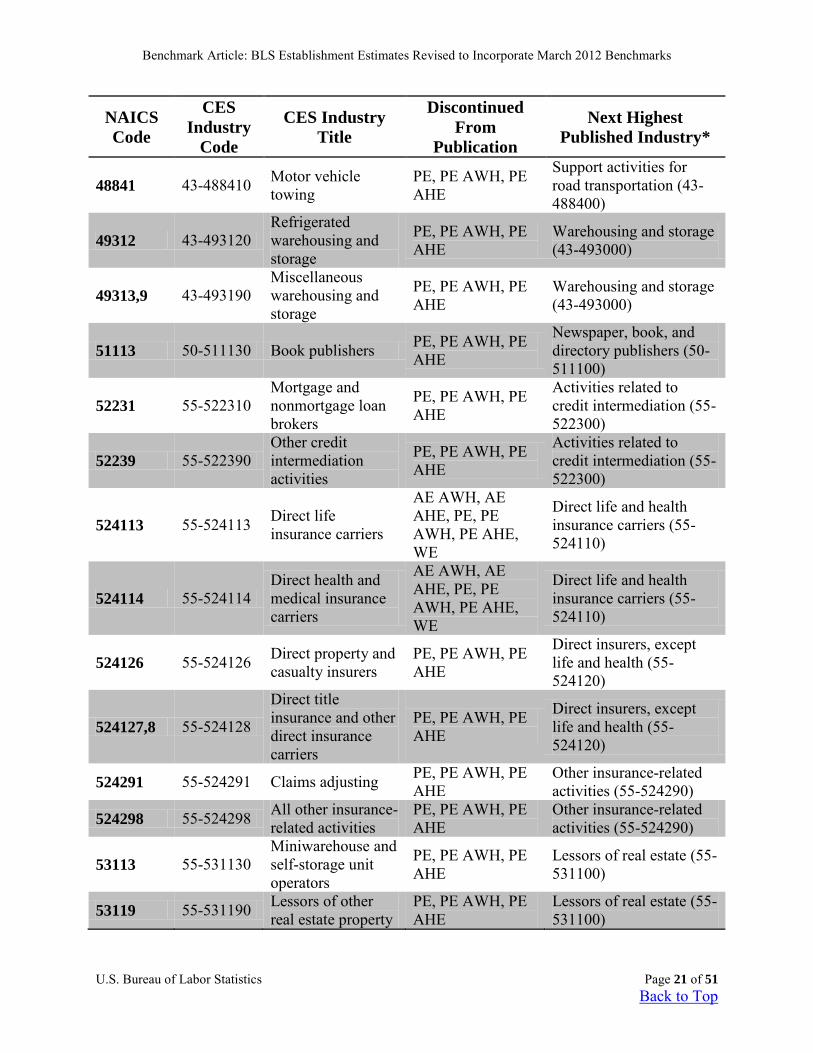
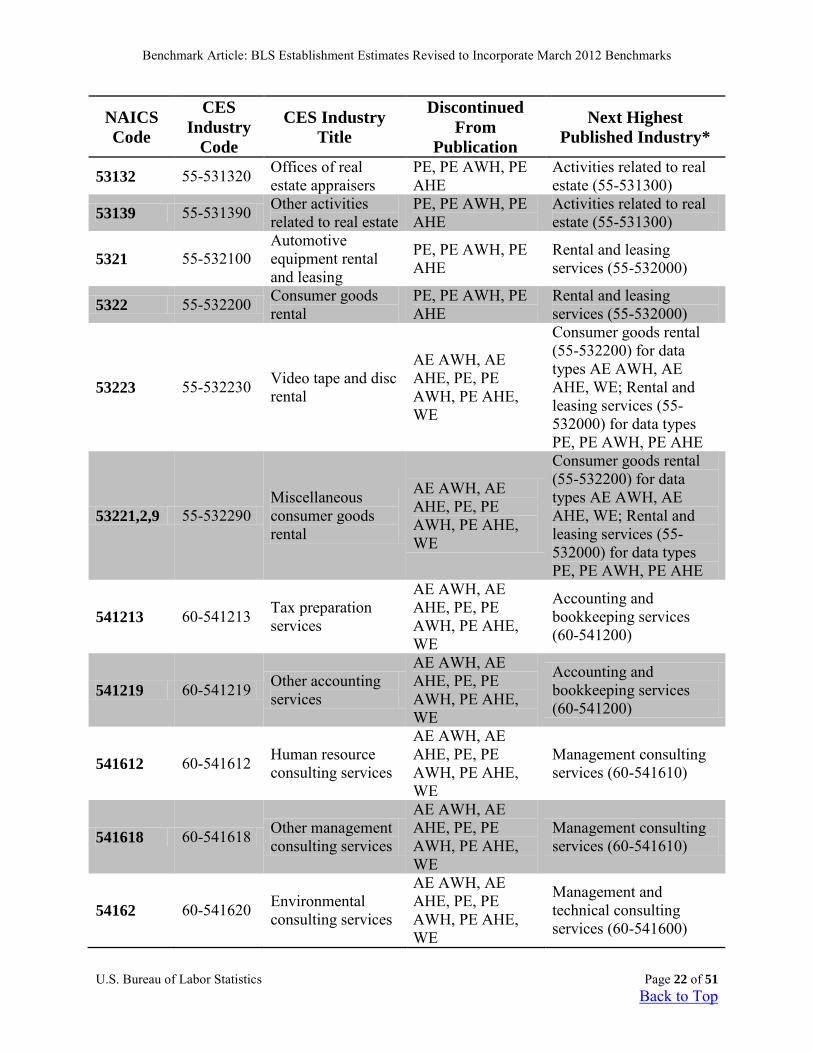
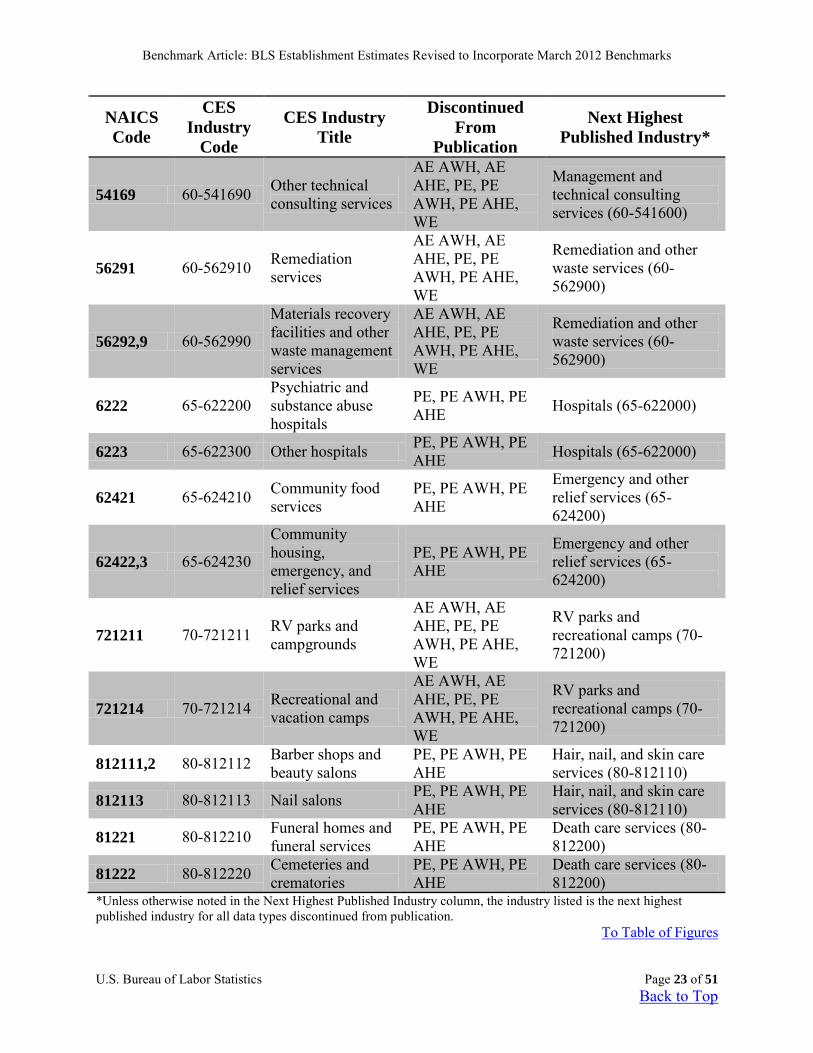
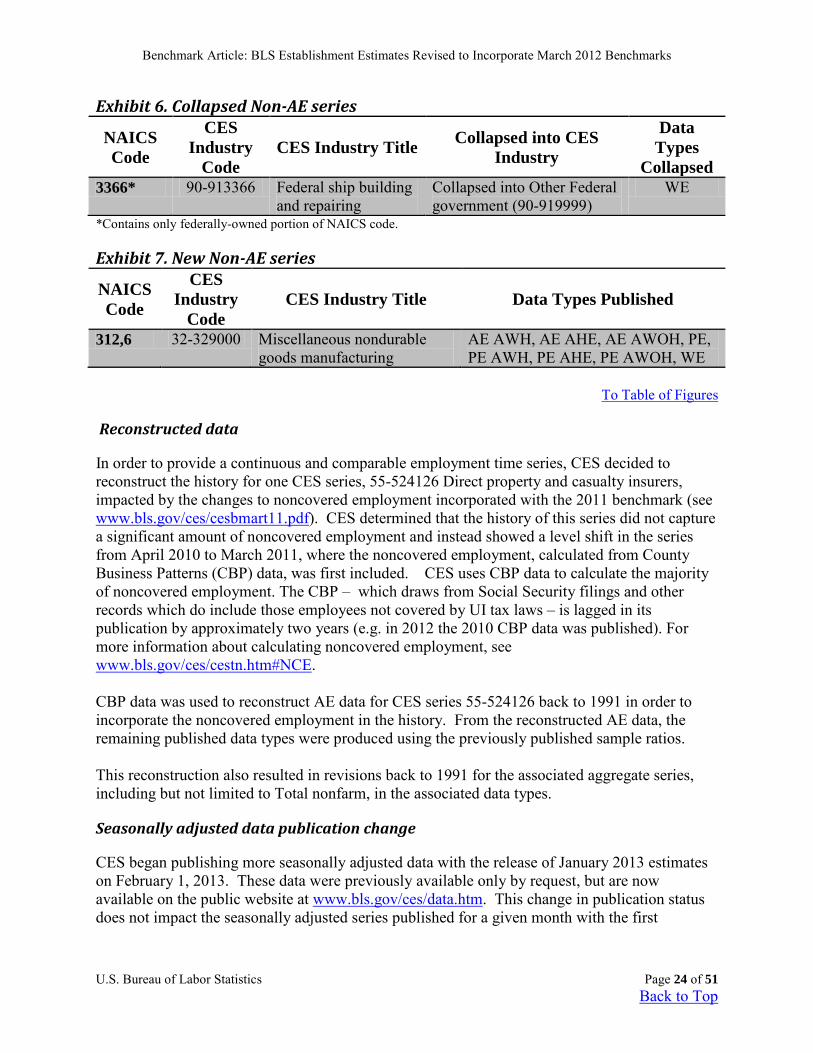
Only directly estimated data types1 are included in the series changes exhibits: all employees (AE), AE average weekly hours (AE AWH), AE average hourly earnings (AE AHE), AE average weekly overtime hours (AE AWOH), production employees (PE), women employees (WE), PE average weekly hours (PE AWH), PE average hourly earnings (PE AHE), and PE average weekly overtime hours (PE AWOH). The directly estimated data types listed except for AE are collectively called non-AE data types. In order to more easily identify affected series, since AE series are published at a more detailed industry level than non-AE series, series changes exhibits are provided split by AE and non-AE data types. The non-AE tables cover all directly estimated non-AE data types. The first group of series changes exhibits contains three exhibits referencing the AE data type and the second group contains three exhibits referencing all non-AE data types. The three exhibits in each group display the discontinued, collapsed, and new series. Discontinued series exhibits (Exhibit 2 and Exhibit 5) display series for which the data types noted are no longer published. Collapsed series exhibits (Exhibit 3 and Exhibit 6) display series for which the data types noted are no longer published because the industry no longer has sufficient sample to be estimated and published separately. Affected industries have been combined with other similar industries for estimation and publication purposes. Historical data for these series were reconstructed to provide consistent time series. New series exhibits (Exhibit 4 and Exhibit 7) display series for which the data types noted are now published.
AE exhibits
Exhibit 2. Discontinued AE series NAICS Code
CES Industry Code CES Industry Title Next Highest Published Industry
312 32-312000 Beverages and tobacco products
Miscellaneous nondurable goods manufacturing (32-329000)
Exhibit 3. Collapsed AE series
NAICS Code
CES Industry
Code CES Industry Title Collapsed into CES Industry
221111 44-221111 Hydroelectric power generation
Collapsed into Nuclear and other electric power generation (44-221118)
3366* 90-913366 Federal ship building and repairing
Collapsed into Other Federal government (90-919999)
*Contains only federally-owned portion of NAICS code. To Table of Figures
1 CES estimates data in two ways: directly and indirectly. Directly estimated data types refer to data types for which estimates are calculated directly from the responding sample. Indirectly estimated data types refer to data types for which estimates are calculated from other directly estimated data types. Average weekly earnings of all employees and indexes of aggregate weekly hours of all employees are examples of indirectly estimated data types. For more information on indirectly estimated data types, see the CES Technical Notes.
Benchmark Article: BLS Establishment Estimates Revised to Incorporate March 2012 Benchmarks
U.S. Bureau of Labor Statistics Page 13 of 51
Back to Top
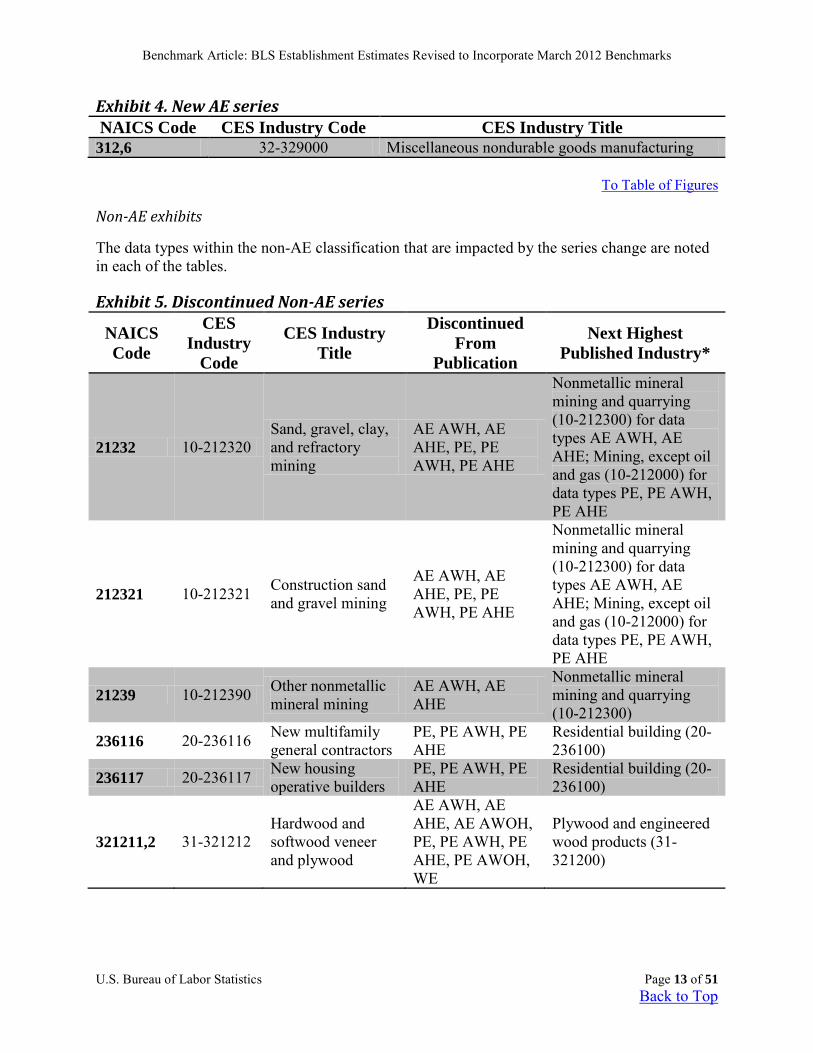
Exhibit 4. New AE series NAICS Code CES Industry Code CES Industry Title
312,6 32-329000 Miscellaneous nondurable goods manufacturing
To Table of Figures
Non-AE exhibits
The data types within the non-AE classification that are impacted by the series change are noted in each of the tables.
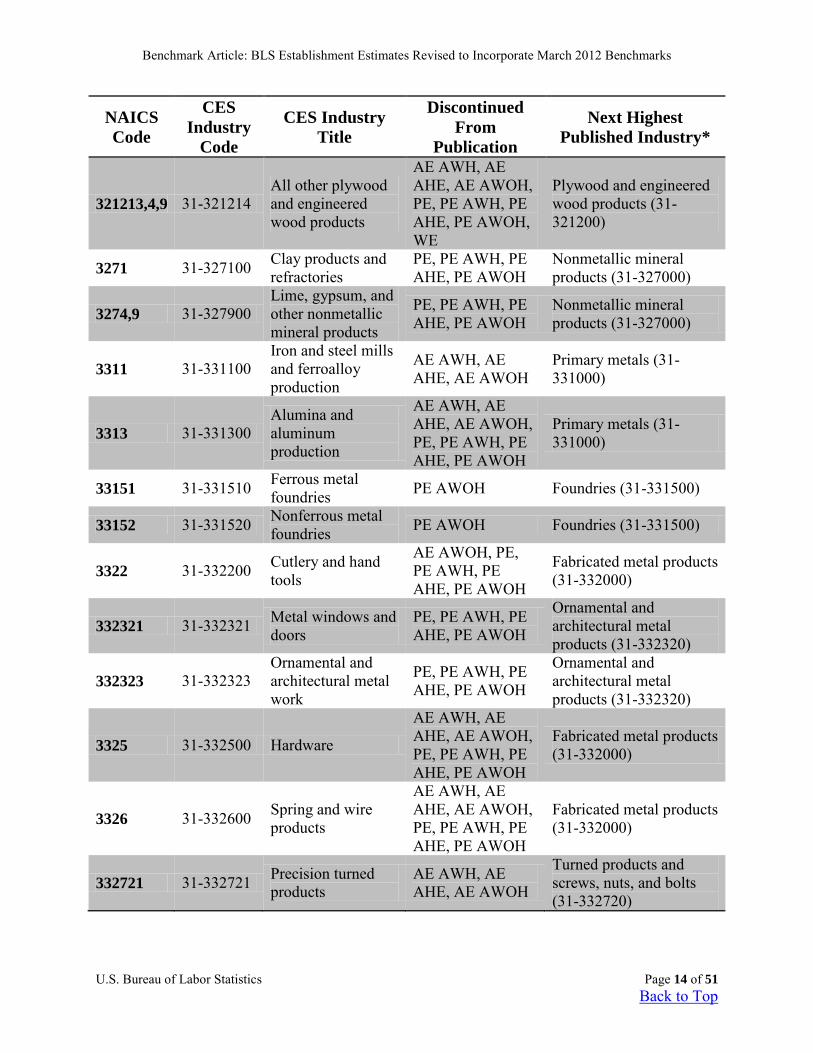
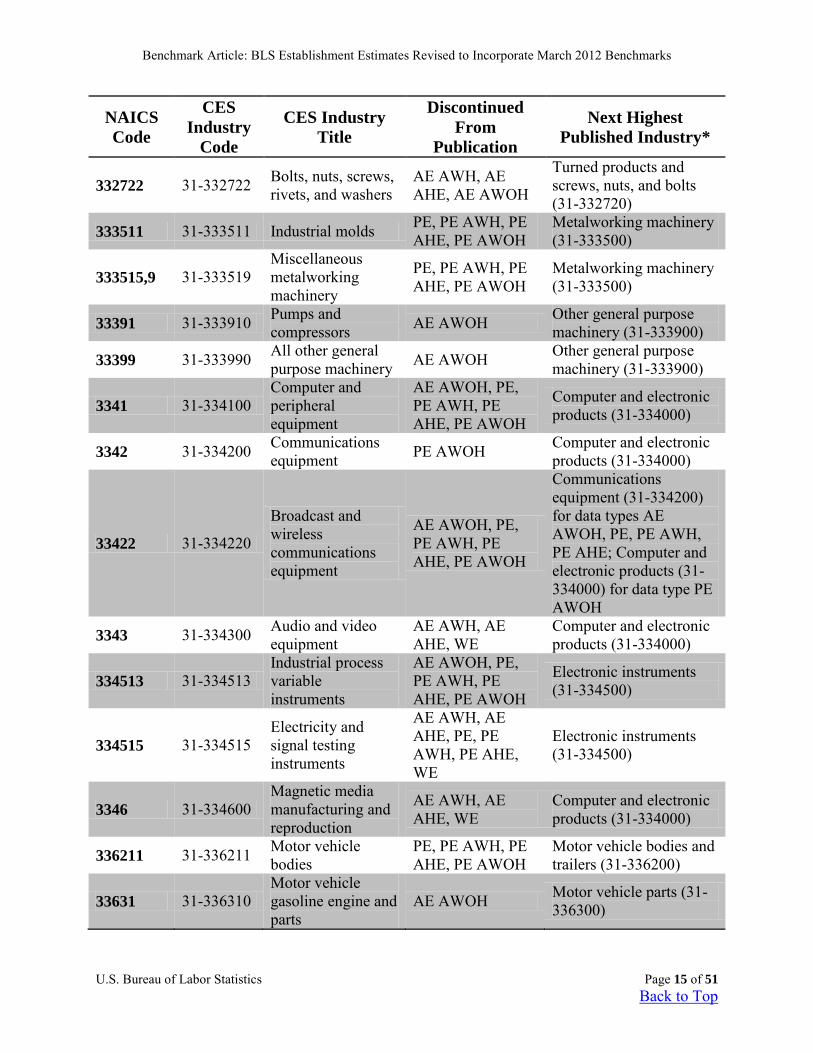
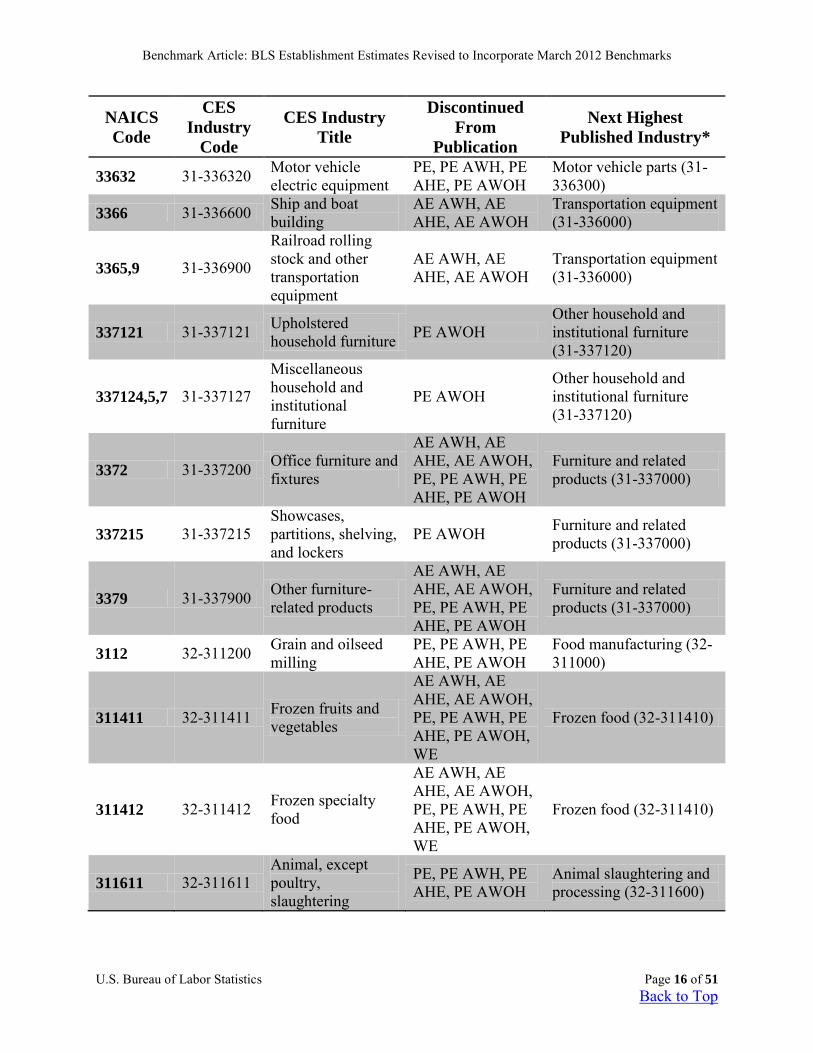
Exhibit 5. Discontinued Non-AE series
NAICS Code
CES Industry
Code
CES Industry Title
Discontinued From
Publication
Next Highest Published Industry*
21232 10-212320 Sand, gravel, clay, and refractory mining
AE AWH, AE AHE, PE, PE AWH, PE AHE
Nonmetallic mineral mining and quarrying (10-212300) for data types AE AWH, AE AHE; Mining, except oil and gas (10-212000) for data types PE, PE AWH, PE AHE
212321 10-212321 Construction sand and gravel mining
AE AWH, AE AHE, PE, PE AWH, PE AHE
Nonmetallic mineral mining and quarrying (10-212300) for data types AE AWH, AE AHE; Mining, except oil and gas (10-212000) for data types PE, PE AWH, PE AHE
21239 10-212390 Other nonmetallic mineral mining
AE AWH, AE AHE
Nonmetallic mineral mining and quarrying (10-212300)
236116 20-236116 New multifamily general contractors
PE, PE AWH, PE AHE
Residential building (20-236100)
236117 20-236117 New housing operative builders
PE, PE AWH, PE AHE
Residential building (20-236100)
321211,2 31-321212 Hardwood and softwood veneer and plywood
AE AWH, AE AHE, AE AWOH, PE, PE AWH, PE AHE, PE AWOH, WE
Plywood and engineered wood products (31-321200)
Benchmark Article: BLS Establishment Estimates Revised to Incorporate March 2012 Benchmarks
U.S. Bureau of Labor Statistics Page 14 of 51
Back to Top
NAICS Code
CES Industry
Code
CES Industry Title
Discontinued From
Publication
Next Highest Published Industry*
321213,4,9 31-321214 All other plywood and engineered wood products
AE AWH, AE AHE, AE AWOH, PE, PE AWH, PE AHE, PE AWOH, WE
Plywood and engineered wood products (31-321200)
3271 31-327100 Clay products and refractories
PE, PE AWH, PE AHE, PE AWOH
Nonmetallic mineral products (31-327000)
3274,9 31-327900 Lime, gypsum, and other nonmetallic mineral products
PE, PE AWH, PE AHE, PE AWOH
Nonmetallic mineral products (31-327000)
3311 31-331100 Iron and steel mills and ferroalloy production
AE AWH, AE AHE, AE AWOH
Primary metals (31-331000)
3313 31-331300 Alumina and aluminum production
AE AWH, AE AHE, AE AWOH, PE, PE AWH, PE AHE, PE AWOH
Primary metals (31-331000)
33151 31-331510 Ferrous metal foundries PE AWOH Foundries (31-331500)
33152 31-331520 Nonferrous metal foundries PE AWOH Foundries (31-331500)
3322 31-332200 Cutlery and hand tools
AE AWOH, PE, PE AWH, PE AHE, PE AWOH
Fabricated metal products (31-332000)
332321 31-332321 Metal windows and doors
PE, PE AWH, PE AHE, PE AWOH
Ornamental and architectural metal products (31-332320)
332323 31-332323 Ornamental and architectural metal work
PE, PE AWH, PE AHE, PE AWOH
Ornamental and architectural metal products (31-332320)
3325 31-332500 Hardware
AE AWH, AE AHE, AE AWOH, PE, PE AWH, PE AHE, PE AWOH
Fabricated metal products (31-332000)
3326 31-332600 Spring and wire products
AE AWH, AE AHE, AE AWOH, PE, PE AWH, PE AHE, PE AWOH
Fabricated metal products (31-332000)
332721 31-332721 Precision turned products
AE AWH, AE AHE, AE AWOH
Turned products and screws, nuts, and bolts (31-332720)
Benchmark Article: BLS Establishment Estimates Revised to Incorporate March 2012 Benchmarks
U.S. Bureau of Labor Statistics Page 15 of 51
Back to Top
NAICS Code
CES Industry
Code
CES Industry Title
Discontinued From
Publication
Next Highest Published Industry*
332722 31-332722 Bolts, nuts, screws, rivets, and washers
AE AWH, AE AHE, AE AWOH
Turned products and screws, nuts, and bolts (31-332720)
333511 31-333511 Industrial molds PE, PE AWH, PE AHE, PE AWOH
Metalworking machinery (31-333500)
333515,9 31-333519 Miscellaneous metalworking machinery
PE, PE AWH, PE AHE, PE AWOH
Metalworking machinery (31-333500)
33391 31-333910 Pumps and compressors AE AWOH Other general purpose
machinery (31-333900)
33399 31-333990 All other general purpose machinery AE AWOH Other general purpose
machinery (31-333900)
3341 31-334100 Computer and peripheral equipment
AE AWOH, PE, PE AWH, PE AHE, PE AWOH
Computer and electronic products (31-334000)
3342 31-334200 Communications equipment PE AWOH Computer and electronic
products (31-334000)
33422 31-334220
Broadcast and wireless communications equipment
AE AWOH, PE, PE AWH, PE AHE, PE AWOH
Communications equipment (31-334200) for data types AE AWOH, PE, PE AWH, PE AHE; Computer and electronic products (31-334000) for data type PE AWOH
3343 31-334300 Audio and video equipment
AE AWH, AE AHE, WE
Computer and electronic products (31-334000)
334513 31-334513 Industrial process variable instruments
AE AWOH, PE, PE AWH, PE AHE, PE AWOH
Electronic instruments (31-334500)
334515 31-334515 Electricity and signal testing instruments
AE AWH, AE AHE, PE, PE AWH, PE AHE, WE
Electronic instruments (31-334500)
3346 31-334600 Magnetic media manufacturing and reproduction
AE AWH, AE AHE, WE
Computer and electronic products (31-334000)
336211 31-336211 Motor vehicle bodies
PE, PE AWH, PE AHE, PE AWOH
Motor vehicle bodies and trailers (31-336200)
33631 31-336310 Motor vehicle gasoline engine and parts
AE AWOH Motor vehicle parts (31-336300)
Benchmark Article: BLS Establishment Estimates Revised to Incorporate March 2012 Benchmarks
U.S. Bureau of Labor Statistics Page 16 of 51
Back to Top
NAICS Code
CES Industry
Code
CES Industry Title
Discontinued From
Publication
Next Highest Published Industry*
33632 31-336320 Motor vehicle electric equipment
PE, PE AWH, PE AHE, PE AWOH
Motor vehicle parts (31-336300)
3366 31-336600 Ship and boat building
AE AWH, AE AHE, AE AWOH
Transportation equipment (31-336000)
3365,9 31-336900
Railroad rolling stock and other transportation equipment
AE AWH, AE AHE, AE AWOH
Transportation equipment (31-336000)
337121 31-337121 Upholstered household furniture PE AWOH
Other household and institutional furniture (31-337120)
337124,5,7 31-337127
Miscellaneous household and institutional furniture
PE AWOH Other household and institutional furniture (31-337120)
3372 31-337200 Office furniture and fixtures
AE AWH, AE AHE, AE AWOH, PE, PE AWH, PE AHE, PE AWOH
Furniture and related products (31-337000)
337215 31-337215 Showcases, partitions, shelving, and lockers
PE AWOH Furniture and related products (31-337000)
3379 31-337900 Other furniture-related products
AE AWH, AE AHE, AE AWOH, PE, PE AWH, PE AHE, PE AWOH
Furniture and related products (31-337000)
3112 32-311200 Grain and oilseed milling
PE, PE AWH, PE AHE, PE AWOH
Food manufacturing (32-311000)
311411 32-311411 Frozen fruits and vegetables
AE AWH, AE AHE, AE AWOH, PE, PE AWH, PE AHE, PE AWOH, WE
Frozen food (32-311410)
311412 32-311412 Frozen specialty food
AE AWH, AE AHE, AE AWOH, PE, PE AWH, PE AHE, PE AWOH, WE
Frozen food (32-311410)
311611 32-311611 Animal, except poultry, slaughtering
PE, PE AWH, PE AHE, PE AWOH
Animal slaughtering and processing (32-311600)
Benchmark Article: BLS Establishment Estimates Revised to Incorporate March 2012 Benchmarks
U.S. Bureau of Labor Statistics Page 17 of 51
Back to Top
NAICS Code
CES Industry
Code
CES Industry Title
Discontinued From
Publication
Next Highest Published Industry*
311612,3 32-311613
Meat processed from carcasses, and rendering and meat byproduct processing
PE, PE AWH, PE AHE, PE AWOH
Animal slaughtering and processing (32-311600)
31181 32-311810 Bread and bakery products
AE AWOH, PE, PE AWH, PE AHE, PE AWOH
Bakeries and tortilla manufacturing (32-311800)
311811 32-311811 Retail bakeries PE, PE AWH, PE AHE
Bakeries and tortilla manufacturing (32-311800)
311812,3 32-311813
Commercial bakeries and frozen cakes and other pastry products
PE, PE AWH, PE AHE
Bakeries and tortilla manufacturing (32-311800)
31182,3 32-311830 Cookies, crackers, pasta, and tortillas
AE AWOH, PE, PE AWH, PE AHE, PE AWOH
Bakeries and tortilla manufacturing (32-311800)
3119 32-311900 Other food products
PE, PE AWH, PE AHE, PE AWOH
Food manufacturing (32-311000)
312 32-312000 Beverages and tobacco products
AE AWH, AE AHE, PE, PE AWH, PE AHE, WE
Miscellaneous nondurable goods manufacturing (32-329000)
3131 32-313100 Fiber, yarn, and thread mills
AE AWH, AE AHE, AE AWOH, PE, PE AWH, PE AHE, PE AWOH, WE
Textile mills (32-313000)
3132 32-313200 Fabric mills PE, PE AWH, PE AHE, PE AWOH Textile mills (32-313000)
31321 32-313210 Broadwoven fabric mills
AE AWH, AE AHE, PE, PE AWH, PE AHE, WE
Fabric mills (32-313200) for data types AE AWH, AE AHE, WE; Textile mills (32-313000) for data types PE, PE AWH, PE AHE
3133 32-313300 Textile and fabric finishing mills
AE AWH, AE AHE, AE AWOH, PE, PE AWH, PE AHE, PE AWOH, WE
Textile mills (32-313000)
Benchmark Article: BLS Establishment Estimates Revised to Incorporate March 2012 Benchmarks
U.S. Bureau of Labor Statistics Page 18 of 51
Back to Top
NAICS Code
CES Industry
Code
CES Industry Title
Discontinued From
Publication
Next Highest Published Industry*
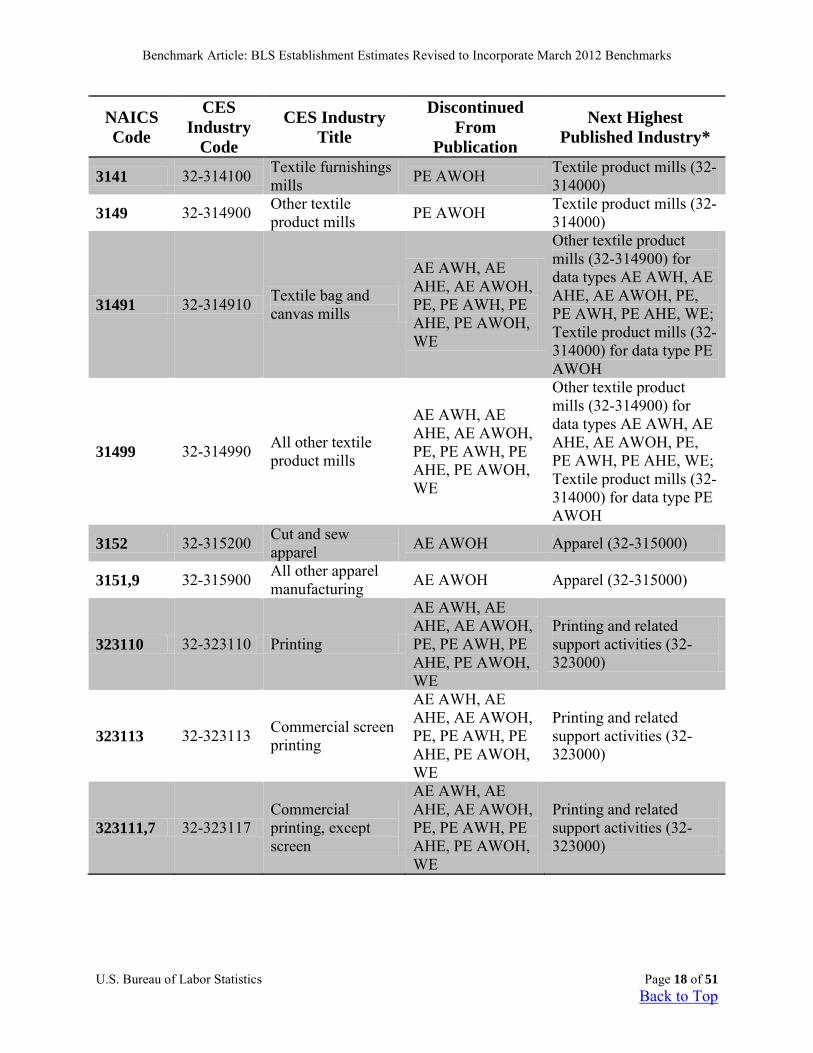
3141 32-314100 Textile furnishings mills PE AWOH Textile product mills (32-
314000)
3149 32-314900 Other textile product mills PE AWOH Textile product mills (32-
314000)
31491 32-314910 Textile bag and canvas mills
AE AWH, AE AHE, AE AWOH, PE, PE AWH, PE AHE, PE AWOH, WE
Other textile product mills (32-314900) for data types AE AWH, AE AHE, AE AWOH, PE, PE AWH, PE AHE, WE; Textile product mills (32-314000) for data type PE AWOH
31499 32-314990 All other textile product mills
AE AWH, AE AHE, AE AWOH, PE, PE AWH, PE AHE, PE AWOH, WE
Other textile product mills (32-314900) for data types AE AWH, AE AHE, AE AWOH, PE, PE AWH, PE AHE, WE; Textile product mills (32-314000) for data type PE AWOH
3152 32-315200 Cut and sew apparel AE AWOH Apparel (32-315000)
3151,9 32-315900 All other apparel manufacturing AE AWOH Apparel (32-315000)
323110 32-323110 Printing
AE AWH, AE AHE, AE AWOH, PE, PE AWH, PE AHE, PE AWOH, WE
Printing and related support activities (32-323000)
323113 32-323113 Commercial screen printing
AE AWH, AE AHE, AE AWOH, PE, PE AWH, PE AHE, PE AWOH, WE
Printing and related support activities (32-323000)
323111,7 32-323117 Commercial printing, except screen
AE AWH, AE AHE, AE AWOH, PE, PE AWH, PE AHE, PE AWOH, WE
Printing and related support activities (32-323000)
Benchmark Article: BLS Establishment Estimates Revised to Incorporate March 2012 Benchmarks
U.S. Bureau of Labor Statistics Page 19 of 51
Back to Top
NAICS Code
CES Industry
Code
CES Industry Title
Discontinued From
Publication
Next Highest Published Industry*
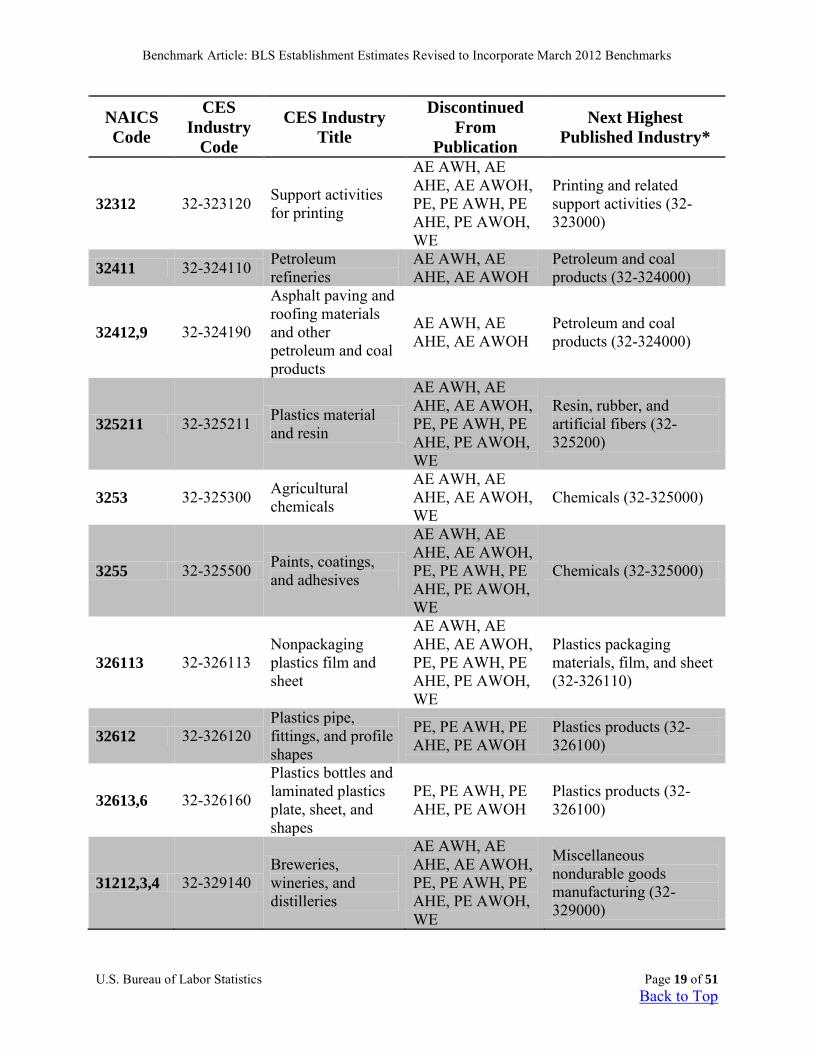
32312 32-323120 Support activities for printing
AE AWH, AE AHE, AE AWOH, PE, PE AWH, PE AHE, PE AWOH, WE
Printing and related support activities (32-323000)
32411 32-324110 Petroleum refineries
AE AWH, AE AHE, AE AWOH
Petroleum and coal products (32-324000)
32412,9 32-324190
Asphalt paving and roofing materials and other petroleum and coal products
AE AWH, AE AHE, AE AWOH
Petroleum and coal products (32-324000)
325211 32-325211 Plastics material and resin
AE AWH, AE AHE, AE AWOH, PE, PE AWH, PE AHE, PE AWOH, WE
Resin, rubber, and artificial fibers (32-325200)
3253 32-325300 Agricultural chemicals
AE AWH, AE AHE, AE AWOH, WE
Chemicals (32-325000)
3255 32-325500 Paints, coatings, and adhesives
AE AWH, AE AHE, AE AWOH, PE, PE AWH, PE AHE, PE AWOH, WE
Chemicals (32-325000)
326113 32-326113 Nonpackaging plastics film and sheet
AE AWH, AE AHE, AE AWOH, PE, PE AWH, PE AHE, PE AWOH, WE
Plastics packaging materials, film, and sheet (32-326110)
32612 32-326120 Plastics pipe, fittings, and profile shapes
PE, PE AWH, PE AHE, PE AWOH
Plastics products (32-326100)
32613,6 32-326160
Plastics bottles and laminated plastics plate, sheet, and shapes
PE, PE AWH, PE AHE, PE AWOH
Plastics products (32-326100)
31212,3,4 32-329140 Breweries, wineries, and distilleries
AE AWH, AE AHE, AE AWOH, PE, PE AWH, PE AHE, PE AWOH, WE
Miscellaneous nondurable goods manufacturing (32-329000)
Benchmark Article: BLS Establishment Estimates Revised to Incorporate March 2012 Benchmarks
U.S. Bureau of Labor Statistics Page 20 of 51
Back to Top
NAICS Code
CES Industry
Code
CES Industry Title
Discontinued From
Publication
Next Highest Published Industry*
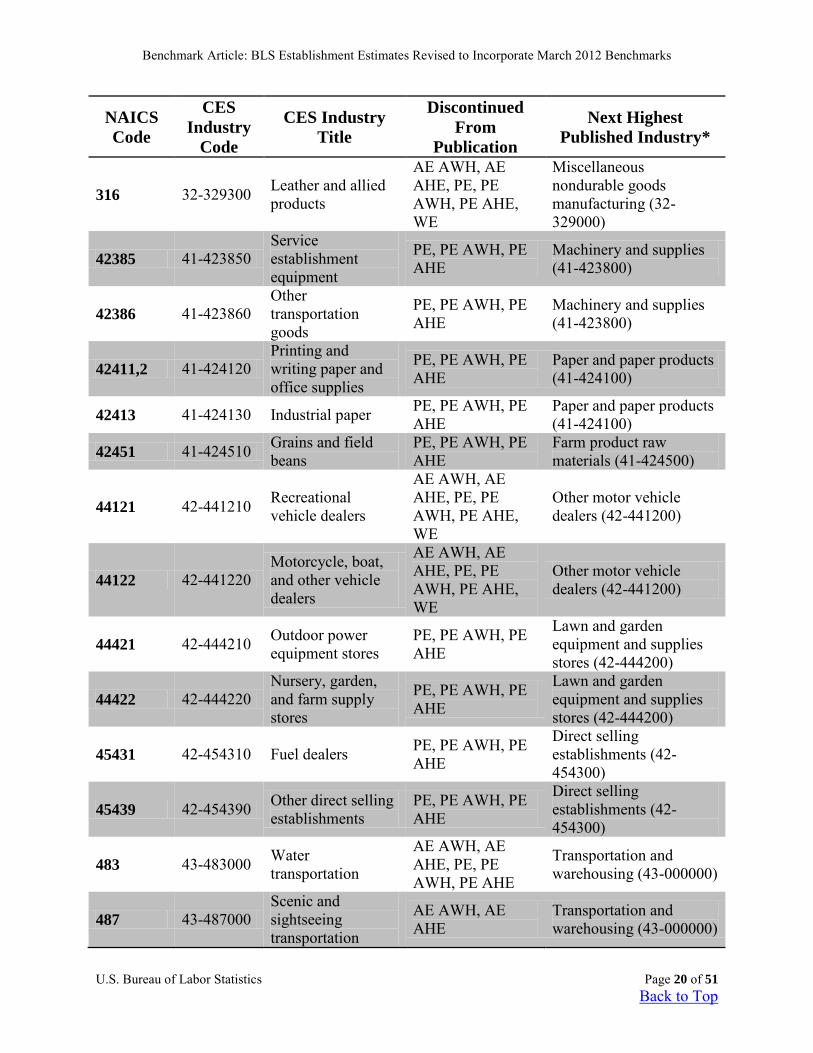
316 32-329300 Leather and allied products
AE AWH, AE AHE, PE, PE AWH, PE AHE, WE
Miscellaneous nondurable goods manufacturing (32-329000)
42385 41-423850 Service establishment equipment
PE, PE AWH, PE AHE
Machinery and supplies (41-423800)
42386 41-423860 Other transportation goods
PE, PE AWH, PE AHE
Machinery and supplies (41-423800)
42411,2 41-424120 Printing and writing paper and office supplies
PE, PE AWH, PE AHE
Paper and paper products (41-424100)
42413 41-424130 Industrial paper PE, PE AWH, PE AHE
Paper and paper products (41-424100)
42451 41-424510 Grains and field beans
PE, PE AWH, PE AHE
Farm product raw materials (41-424500)
44121 42-441210 Recreational vehicle dealers
AE AWH, AE AHE, PE, PE AWH, PE AHE, WE
Other motor vehicle dealers (42-441200)
44122 42-441220 Motorcycle, boat, and other vehicle dealers
AE AWH, AE AHE, PE, PE AWH, PE AHE, WE
Other motor vehicle dealers (42-441200)
44421 42-444210 Outdoor power equipment stores
PE, PE AWH, PE AHE
Lawn and garden equipment and supplies stores (42-444200)
44422 42-444220 Nursery, garden, and farm supply stores
PE, PE AWH, PE AHE
Lawn and garden equipment and supplies stores (42-444200)
45431 42-454310 Fuel dealers PE, PE AWH, PE AHE
Direct selling establishments (42-454300)
45439 42-454390 Other direct selling establishments
PE, PE AWH, PE AHE
Direct selling establishments (42-454300)
483 43-483000 Water transportation
AE AWH, AE AHE, PE, PE AWH, PE AHE
Transportation and warehousing (43-000000)
487 43-487000 Scenic and sightseeing transportation
AE AWH, AE AHE
Transportation and warehousing (43-000000)
Benchmark Article: BLS Establishment Estimates Revised to Incorporate March 2012 Benchmarks
U.S. Bureau of Labor Statistics Page 21 of 51
Back to Top
NAICS Code
CES Industry
Code
CES Industry Title
Discontinued From
Publication
Next Highest Published Industry*
48841 43-488410 Motor vehicle towing
PE, PE AWH, PE AHE
Support activities for road transportation (43-488400)
49312 43-493120 Refrigerated warehousing and storage
PE, PE AWH, PE AHE
Warehousing and storage (43-493000)
49313,9 43-493190 Miscellaneous warehousing and storage
PE, PE AWH, PE AHE
Warehousing and storage (43-493000)
51113 50-511130 Book publishers PE, PE AWH, PE AHE
Newspaper, book, and directory publishers (50-511100)
52231 55-522310 Mortgage and nonmortgage loan brokers
PE, PE AWH, PE AHE
Activities related to credit intermediation (55-522300)
52239 55-522390 Other credit intermediation activities
PE, PE AWH, PE AHE
Activities related to credit intermediation (55-522300)
524113 55-524113 Direct life insurance carriers
AE AWH, AE AHE, PE, PE AWH, PE AHE, WE
Direct life and health insurance carriers (55-524110)
524114 55-524114 Direct health and medical insurance carriers
AE AWH, AE AHE, PE, PE AWH, PE AHE, WE
Direct life and health insurance carriers (55-524110)
524126 55-524126 Direct property and casualty insurers
PE, PE AWH, PE AHE
Direct insurers, except life and health (55-524120)
524127,8 55-524128
Direct title insurance and other direct insurance carriers
PE, PE AWH, PE AHE
Direct insurers, except life and health (55-524120)
524291 55-524291 Claims adjusting PE, PE AWH, PE AHE
Other insurance-related activities (55-524290)
524298 55-524298 All other insurance-related activities
PE, PE AWH, PE AHE
Other insurance-related activities (55-524290)
53113 55-531130 Miniwarehouse and self-storage unit operators
PE, PE AWH, PE AHE
Lessors of real estate (55-531100)
53119 55-531190 Lessors of other real estate property
PE, PE AWH, PE AHE
Lessors of real estate (55-531100)
Benchmark Article: BLS Establishment Estimates Revised to Incorporate March 2012 Benchmarks
U.S. Bureau of Labor Statistics Page 22 of 51
Back to Top
NAICS Code
CES Industry
Code
CES Industry Title
Discontinued From
Publication
Next Highest Published Industry*
53132 55-531320 Offices of real estate appraisers
PE, PE AWH, PE AHE
Activities related to real estate (55-531300)
53139 55-531390 Other activities related to real estate
PE, PE AWH, PE AHE
Activities related to real estate (55-531300)
5321 55-532100 Automotive equipment rental and leasing
PE, PE AWH, PE AHE
Rental and leasing services (55-532000)
5322 55-532200 Consumer goods rental
PE, PE AWH, PE AHE
Rental and leasing services (55-532000)
53223 55-532230 Video tape and disc rental
AE AWH, AE AHE, PE, PE AWH, PE AHE, WE
Consumer goods rental (55-532200) for data types AE AWH, AE AHE, WE; Rental and leasing services (55-532000) for data types PE, PE AWH, PE AHE
53221,2,9 55-532290 Miscellaneous consumer goods rental
AE AWH, AE AHE, PE, PE AWH, PE AHE, WE
Consumer goods rental (55-532200) for data types AE AWH, AE AHE, WE; Rental and leasing services (55-532000) for data types PE, PE AWH, PE AHE
541213 60-541213 Tax preparation services
AE AWH, AE AHE, PE, PE AWH, PE AHE, WE
Accounting and bookkeeping services (60-541200)
541219 60-541219 Other accounting services
AE AWH, AE AHE, PE, PE AWH, PE AHE, WE
Accounting and bookkeeping services (60-541200)
541612 60-541612 Human resource consulting services
AE AWH, AE AHE, PE, PE AWH, PE AHE, WE
Management consulting services (60-541610)
541618 60-541618 Other management consulting services
AE AWH, AE AHE, PE, PE AWH, PE AHE, WE
Management consulting services (60-541610)
54162 60-541620 Environmental consulting services
AE AWH, AE AHE, PE, PE AWH, PE AHE, WE
Management and technical consulting services (60-541600)
Benchmark Article: BLS Establishment Estimates Revised to Incorporate March 2012 Benchmarks
U.S. Bureau of Labor Statistics Page 23 of 51
Back to Top
NAICS Code
CES Industry
Code
CES Industry Title
Discontinued From
Publication
Next Highest Published Industry*
54169 60-541690 Other technical consulting services
AE AWH, AE AHE, PE, PE AWH, PE AHE, WE
Management and technical consulting services (60-541600)
56291 60-562910 Remediation services
AE AWH, AE AHE, PE, PE AWH, PE AHE, WE
Remediation and other waste services (60-562900)
56292,9 60-562990
Materials recovery facilities and other waste management services
AE AWH, AE AHE, PE, PE AWH, PE AHE, WE
Remediation and other waste services (60-562900)
6222 65-622200 Psychiatric and substance abuse hospitals
PE, PE AWH, PE AHE Hospitals (65-622000)
6223 65-622300 Other hospitals PE, PE AWH, PE AHE Hospitals (65-622000)
62421 65-624210 Community food services
PE, PE AWH, PE AHE
Emergency and other relief services (65-624200)
62422,3 65-624230
Community housing, emergency, and relief services
PE, PE AWH, PE AHE
Emergency and other relief services (65-624200)
721211 70-721211 RV parks and campgrounds
AE AWH, AE AHE, PE, PE AWH, PE AHE, WE
RV parks and recreational camps (70-721200)
721214 70-721214 Recreational and vacation camps
AE AWH, AE AHE, PE, PE AWH, PE AHE, WE
RV parks and recreational camps (70-721200)
812111,2 80-812112 Barber shops and beauty salons
PE, PE AWH, PE AHE
Hair, nail, and skin care services (80-812110)
812113 80-812113 Nail salons PE, PE AWH, PE AHE
Hair, nail, and skin care services (80-812110)
81221 80-812210 Funeral homes and funeral services
PE, PE AWH, PE AHE
Death care services (80-812200)
81222 80-812220 Cemeteries and crematories
PE, PE AWH, PE AHE
Death care services (80-812200)
*Unless otherwise noted in the Next Highest Published Industry column, the industry listed is the next highest published industry for all data types discontinued from publication.
To Table of Figures
Benchmark Article: BLS Establishment Estimates Revised to Incorporate March 2012 Benchmarks
U.S. Bureau of Labor Statistics Page 24 of 51
Back to Top
Exhibit 6. Collapsed Non-AE series
NAICS Code
CES Industry
Code CES Industry Title Collapsed into CES
Industry
Data Types
Collapsed 3366* 90-913366 Federal ship building
and repairing Collapsed into Other Federal government (90-919999)
WE
*Contains only federally-owned portion of NAICS code.
Exhibit 7. New Non-AE series
NAICS Code
CES Industry
Code CES Industry Title Data Types Published
312,6 32-329000 Miscellaneous nondurable goods manufacturing
AE AWH, AE AHE, AE AWOH, PE, PE AWH, PE AHE, PE AWOH, WE
To Table of Figures
Reconstructed data
In order to provide a continuous and comparable employment time series, CES decided to reconstruct the history for one CES series, 55-524126 Direct property and casualty insurers, impacted by the changes to noncovered employment incorporated with the 2011 benchmark (see www.bls.gov/ces/cesbmart11.pdf). CES determined that the history of this series did not capture a significant amount of noncovered employment and instead showed a level shift in the series from April 2010 to March 2011, where the noncovered employment, calculated from County Business Patterns (CBP) data, was first included. CES uses CBP data to calculate the majority of noncovered employment. The CBP – which draws from Social Security filings and other records which do include those employees not covered by UI tax laws – is lagged in its publication by approximately two years (e.g. in 2012 the 2010 CBP data was published). For more information about calculating noncovered employment, see www.bls.gov/ces/cestn.htm#NCE. CBP data was used to reconstruct AE data for CES series 55-524126 back to 1991 in order to incorporate the noncovered employment in the history. From the reconstructed AE data, the remaining published data types were produced using the previously published sample ratios. This reconstruction also resulted in revisions back to 1991 for the associated aggregate series, including but not limited to Total nonfarm, in the associated data types.
Seasonally adjusted data publication change
CES began publishing more seasonally adjusted data with the release of January 2013 estimates on February 1, 2013. These data were previously available only by request, but are now available on the public website at www.bls.gov/ces/data.htm. This change in publication status does not impact the seasonally adjusted series published for a given month with the first
Benchmark Article: BLS Establishment Estimates Revised to Incorporate March 2012 Benchmarks
U.S. Bureau of Labor Statistics Page 25 of 51
Back to Top
preliminary release of CES data2. The newly published seasonally adjusted series will be released with the second preliminary estimates for a given month. Approximately 770 more seasonally adjusted AE series and approximately 4,060 more seasonally adjusted non-AE and derivative series will be published3. Seasonally adjusted data for detail series corresponding to CES series 31-336000 Transportation equipment have been updated to reflect strike data from 1998 and were revised back to 1990. These detail series had previously been available upon request, but not published. Seasonally adjusted data for CES series 31-336000 Transportation equipment has also been revised back to 1990. All associated aggregate series, including but not limited to Total nonfarm, and associated data types have also been revised. Specification files and related information necessary for duplicating the seasonal adjustment process has been updated and, for these newly published series, added to the existing documentation available at www.bls.gov/web/empsit/cesseasadj.htm.
Data clarification
CES currently publishes data for both AE and PE aggregate weekly hours, aggregate weekly payrolls, and in manufacturing industries, aggregate weekly overtime hours. These data are produced using two separate sets of sample data. Data are used in the calculation for the AE aggregate hours and earnings series if the establishment has reported both hours and payroll information for all employees for the given month. Data are used in the calculation for the PE aggregate hours and earnings series if the establishment has reported both hours and payroll information for production and nonsupervisory employees for the given month. Since not all establishments report hours and payroll data for both all employees and production and nonsupervisory employees, the data used in the two calculations can vary. Given that the aggregate hours and earnings series may be calculated from two separate sets of sample data, it is possible for the aggregate hours and earnings series for production and nonsupervisory employees to be greater than that of all employees even though by definition this is impossible. The possibility arises because each of the samples is subject to its own nonsampling error. When this occurs, CES does not cap the production and nonsupervisory employees aggregate hours and earnings data to fit the definitional restriction to be less than the all employees aggregate data because each of the estimates separately is supported by their respective samples. CES will be conducting research to examine potential solutions to this issue.
2 Publication status for first preliminary seasonally adjusted series may also be impacted by the CES series changes noted in Exhibit 1 through Exhibit 7 above. 3 Counts of additional series are approximate due to how some of the CES industry code changes, noted in Exhibit 1, impact the additional seasonally adjusted published series.
Benchmark Article: BLS Establishment Estimates Revised to Incorporate March 2012 Benchmarks
U.S. Bureau of Labor Statistics Page 26 of 51
Back to Top
Why benchmarks differ from estimates
A benchmark revision is the difference between the benchmark employment level for a given March and its corresponding sample-based estimate. The overall accuracy of the establishment survey is usually gauged by the size of this difference. The benchmark revision often is regarded as a proxy for total survey error, but this does not take into account error in the universe data. The employment counts obtained from quarterly UI tax forms are administrative data that reflect employer record-keeping practices and differing State laws and procedures. The benchmark revision can be more precisely interpreted as the difference between two independently derived employment counts, each subject to its own error sources. Like all sample surveys, the establishment survey is susceptible to two sources of error: sampling error and nonsampling error. Sampling error is present any time a sample is used to make inferences about a population. The magnitude of the sampling error, or variance, relates directly to sample size and the percentage of the universe covered by that sample. The CES monthly survey captures slightly under one-third of the universe, exceptionally high by usual sampling standards. This coverage ensures a small sampling error at the Total nonfarm employment level. Both the universe counts and the establishment survey estimates are subject to nonsampling errors common to all surveys – coverage, response, and processing errors. The error structures for both the CES monthly survey and the UI universe are complex. Still, the two programs generally produce consistent total employment figures, each validating the other. Over the last decade, annual benchmark revisions at the Total nonfarm level have averaged 0.3 percent (in absolute terms), with an absolute range of 0.1 percent to 0.7 percent.
Benchmark revision effects for other data types
The routine benchmarking process results in revisions to the series for production and nonsupervisory employees and women employees. There are no benchmark employment levels for these series; they are revised by preserving ratios of employment for the particular data type to all employee employment prior to benchmarking, and then applying these ratios to the revised all employee figures. These figures are calculated at the basic cell level and then aggregated to produce the summary estimates. Average weekly hours, average hourly earnings, and in manufacturing industries, average weekly overtime hours are not benchmarked; they are estimated solely from reports supplied by survey respondents at the basic estimating cell level. The aggregate industry levels of the hours and earnings series are derived as a weighted average. The all employee employment estimates or the production and nonsupervisory employee employment estimates for the basic cells are used as weights for their respective hours and earnings estimates for broader industry groupings. Adjustments of the all employee estimates to new benchmarks may alter the weights used for both AE and PE hours and earnings, which, in turn, may change the estimates for both AE and PE hours and earnings at higher levels of aggregation.
Benchmark Article: BLS Establishment Estimates Revised to Incorporate March 2012 Benchmarks
U.S. Bureau of Labor Statistics Page 27 of 51
Back to Top
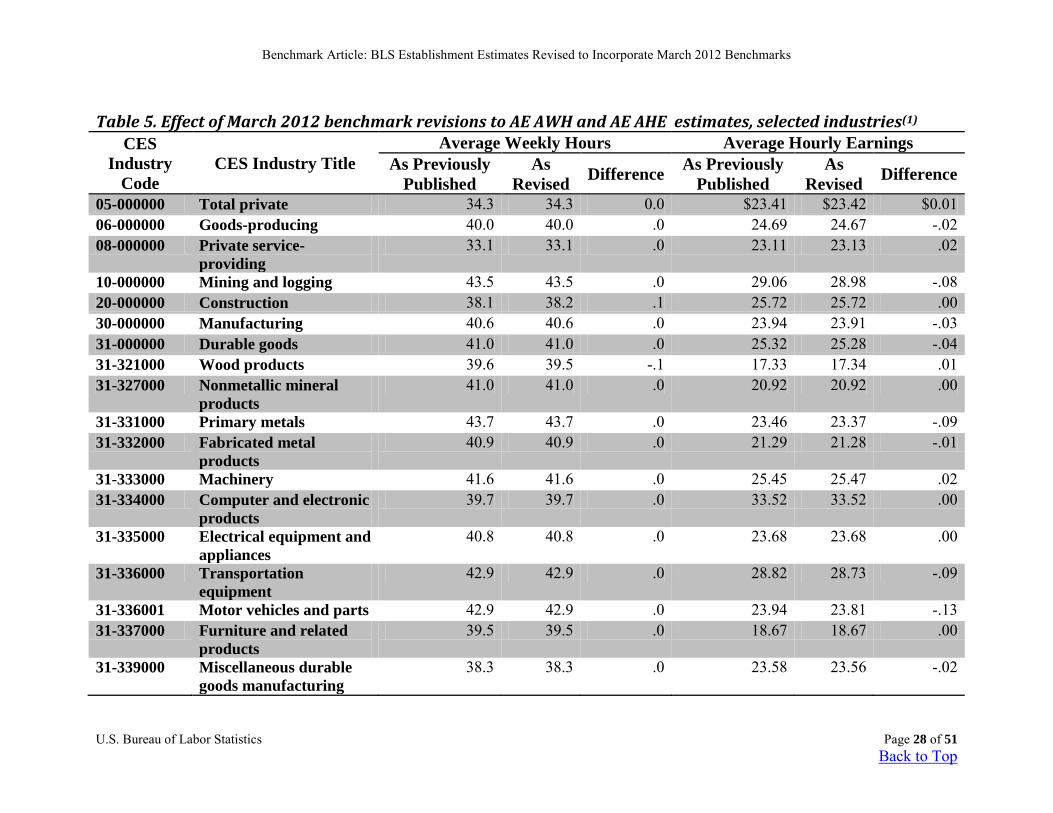
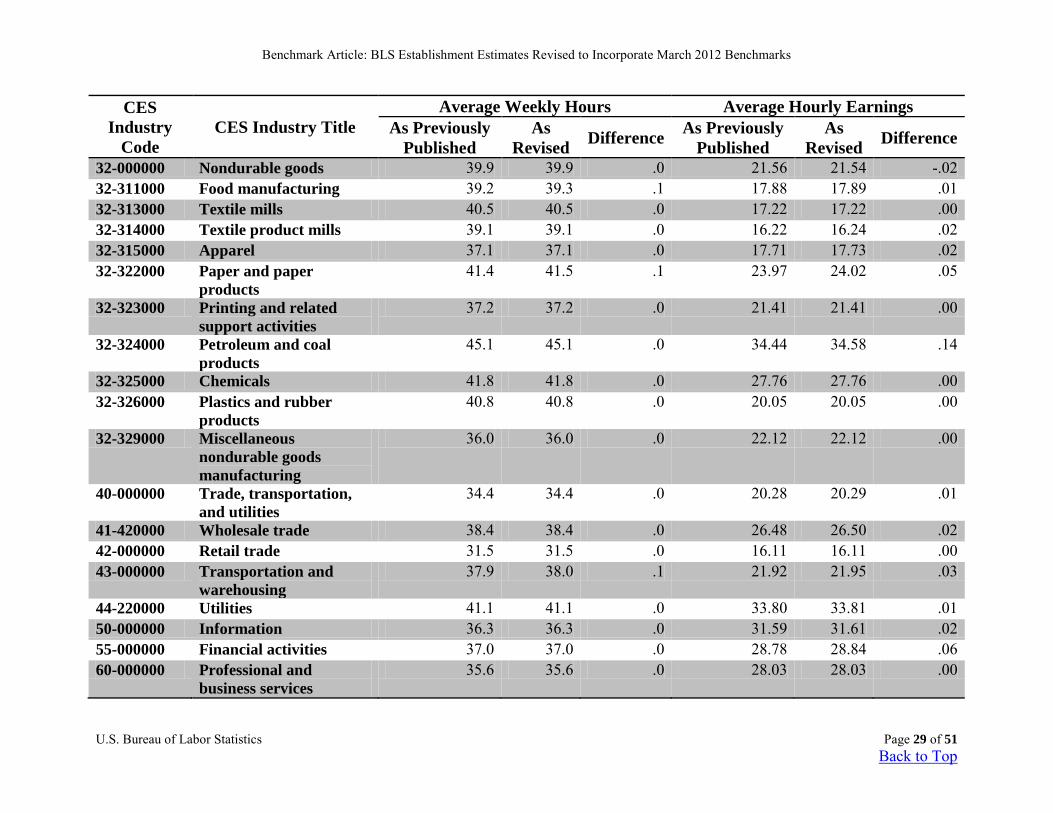
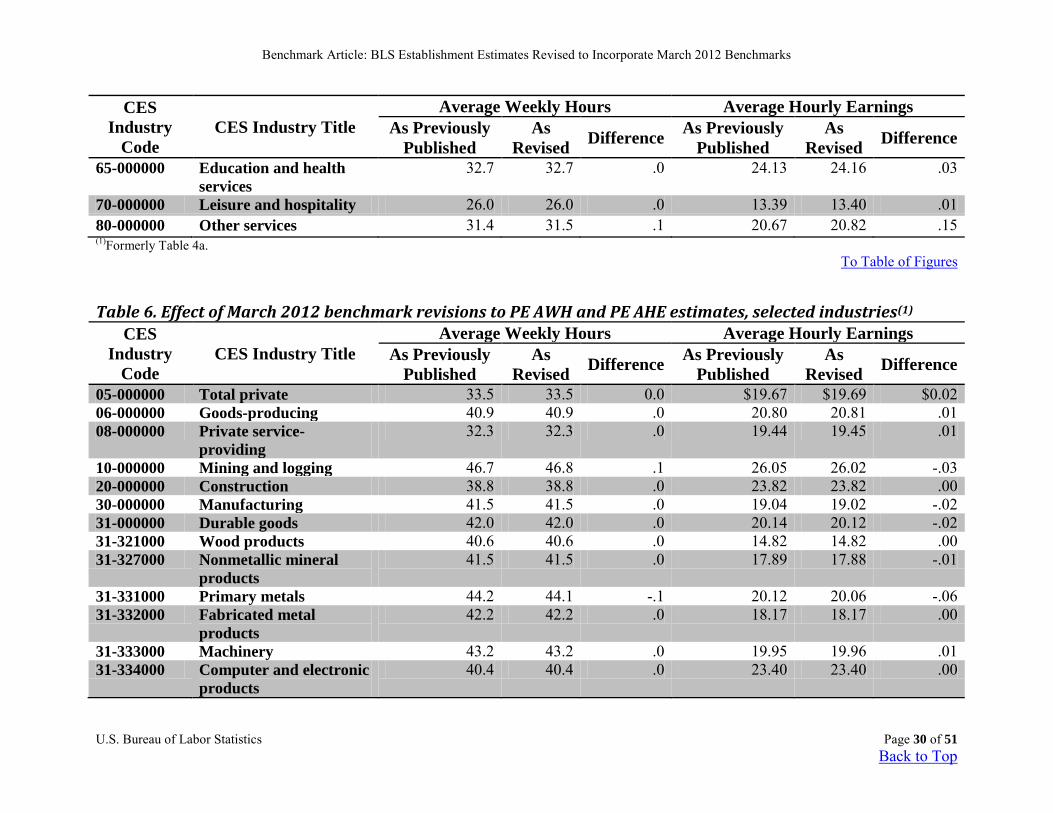
Generally, new employment benchmarks have little effect on hours and earnings estimates for major industry groupings. To influence the hours and earnings estimates of a broader industry group, employment revisions have to be relatively large and must affect industries that have hours or earnings averages that are substantially different from those of other industries in their broader group. Table 5 and Table 6 provide information on the levels of specific hours and earnings series resulting from the March 2012 benchmark. At the Total private level, there was no change in average weekly hours estimates for both AE and PE from the previously published level. Total private average hourly earnings increased by 1 cent for AE and 2 cents for PE from the previously published level.
Benchmark Article: BLS Establishment Estimates Revised to Incorporate March 2012 Benchmarks
U.S. Bureau of Labor Statistics Page 28 of 51
Back to Top
Table 5. Effect of March 2012 benchmark revisions to AE AWH and AE AHE estimates, selected industries(1) CES
Industry Code
CES Industry Title Average Weekly Hours Average Hourly Earnings
As Previously Published
As Revised Difference As Previously
Published As
Revised Difference
05-000000 Total private 34.3 34.3 0.0 $23.41 $23.42 $0.01 06-000000 Goods-producing 40.0 40.0 .0 24.69 24.67 -.02 08-000000 Private service-
providing 33.1 33.1 .0 23.11 23.13 .02
10-000000 Mining and logging 43.5 43.5 .0 29.06 28.98 -.08 20-000000 Construction 38.1 38.2 .1 25.72 25.72 .00 30-000000 Manufacturing 40.6 40.6 .0 23.94 23.91 -.03 31-000000 Durable goods 41.0 41.0 .0 25.32 25.28 -.04 31-321000 Wood products 39.6 39.5 -.1 17.33 17.34 .01 31-327000 Nonmetallic mineral
products 41.0 41.0 .0 20.92 20.92 .00
31-331000 Primary metals 43.7 43.7 .0 23.46 23.37 -.09 31-332000 Fabricated metal
products 40.9 40.9 .0 21.29 21.28 -.01
31-333000 Machinery 41.6 41.6 .0 25.45 25.47 .02 31-334000 Computer and electronic
products 39.7 39.7 .0 33.52 33.52 .00
31-335000 Electrical equipment and appliances
40.8 40.8 .0 23.68 23.68 .00
31-336000 Transportation equipment
42.9 42.9 .0 28.82 28.73 -.09
31-336001 Motor vehicles and parts 42.9 42.9 .0 23.94 23.81 -.13 31-337000 Furniture and related
products 39.5 39.5 .0 18.67 18.67 .00
31-339000 Miscellaneous durable goods manufacturing
38.3 38.3 .0 23.58 23.56 -.02
Benchmark Article: BLS Establishment Estimates Revised to Incorporate March 2012 Benchmarks
U.S. Bureau of Labor Statistics Page 29 of 51
Back to Top
CES Industry
Code CES Industry Title
Average Weekly Hours Average Hourly Earnings As Previously
Published As
Revised Difference As Previously Published
As Revised Difference
32-000000 Nondurable goods 39.9 39.9 .0 21.56 21.54 -.02 32-311000 Food manufacturing 39.2 39.3 .1 17.88 17.89 .01 32-313000 Textile mills 40.5 40.5 .0 17.22 17.22 .00 32-314000 Textile product mills 39.1 39.1 .0 16.22 16.24 .02 32-315000 Apparel 37.1 37.1 .0 17.71 17.73 .02 32-322000 Paper and paper
products 41.4 41.5 .1 23.97 24.02 .05
32-323000 Printing and related support activities
37.2 37.2 .0 21.41 21.41 .00
32-324000 Petroleum and coal products
45.1 45.1 .0 34.44 34.58 .14
32-325000 Chemicals 41.8 41.8 .0 27.76 27.76 .00 32-326000 Plastics and rubber
products 40.8 40.8 .0 20.05 20.05 .00
32-329000 Miscellaneous nondurable goods manufacturing
36.0 36.0 .0 22.12 22.12 .00
40-000000 Trade, transportation, and utilities
34.4 34.4 .0 20.28 20.29 .01
41-420000 Wholesale trade 38.4 38.4 .0 26.48 26.50 .02 42-000000 Retail trade 31.5 31.5 .0 16.11 16.11 .00 43-000000 Transportation and
warehousing 37.9 38.0 .1 21.92 21.95 .03
44-220000 Utilities 41.1 41.1 .0 33.80 33.81 .01 50-000000 Information 36.3 36.3 .0 31.59 31.61 .02 55-000000 Financial activities 37.0 37.0 .0 28.78 28.84 .06 60-000000 Professional and
business services 35.6 35.6 .0 28.03 28.03 .00
Benchmark Article: BLS Establishment Estimates Revised to Incorporate March 2012 Benchmarks
U.S. Bureau of Labor Statistics Page 30 of 51
Back to Top
CES Industry
Code CES Industry Title
Average Weekly Hours Average Hourly Earnings As Previously
Published As
Revised Difference As Previously Published
As Revised Difference
65-000000 Education and health services
32.7 32.7 .0 24.13 24.16 .03
70-000000 Leisure and hospitality 26.0 26.0 .0 13.39 13.40 .01 80-000000 Other services 31.4 31.5 .1 20.67 20.82 .15 (1)Formerly Table 4a.
To Table of Figures
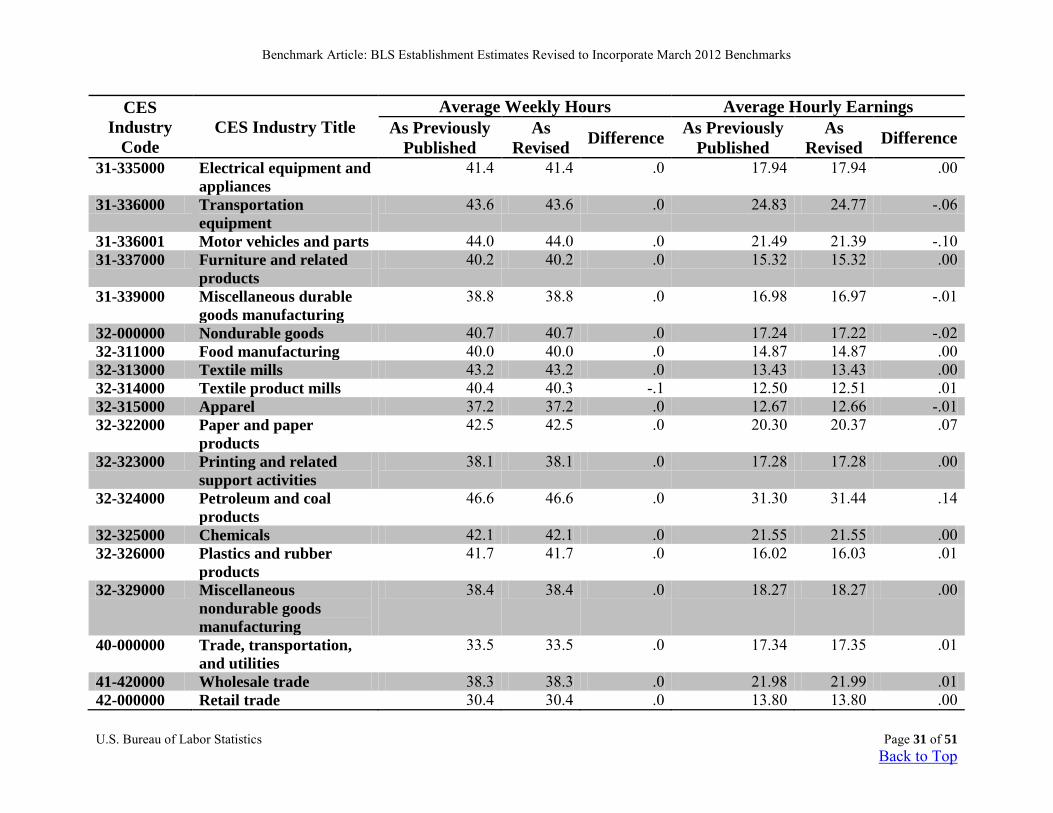
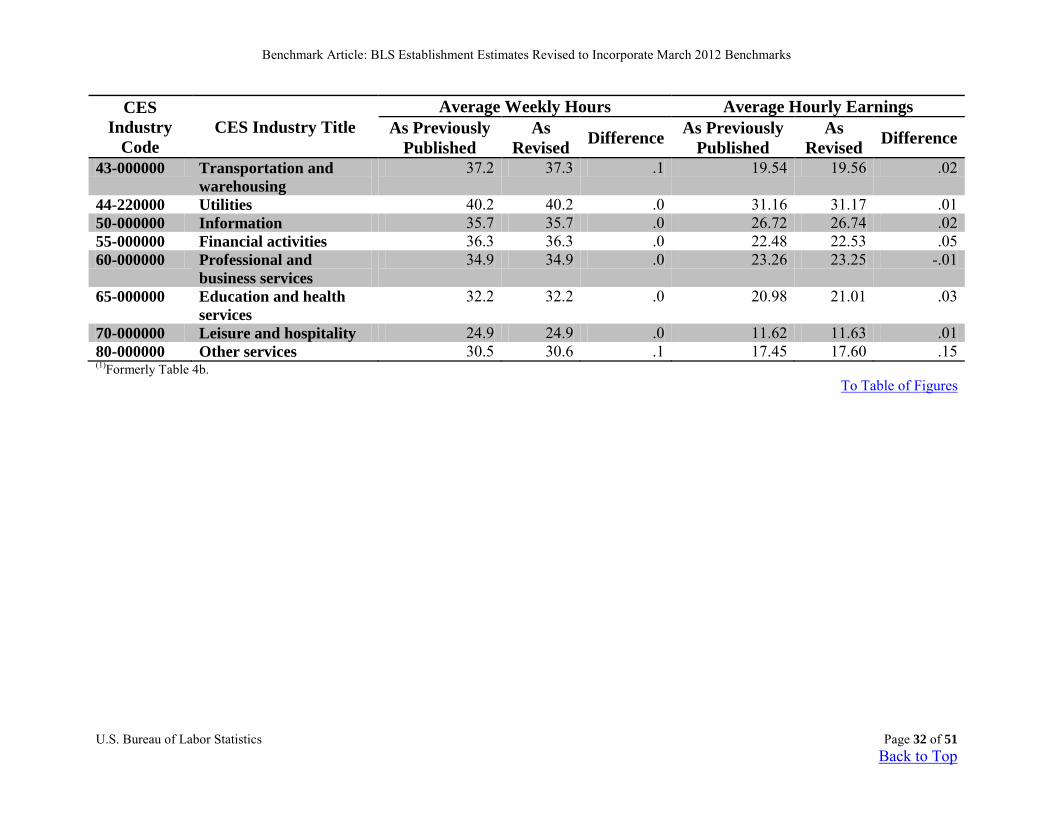
Table 6. Effect of March 2012 benchmark revisions to PE AWH and PE AHE estimates, selected industries(1) CES
Industry Code
CES Industry Title Average Weekly Hours Average Hourly Earnings
As Previously Published
As Revised Difference As Previously
Published As
Revised Difference
05-000000 Total private 33.5 33.5 0.0 $19.67 $19.69 $0.02 06-000000 Goods-producing 40.9 40.9 .0 20.80 20.81 .01 08-000000 Private service-
providing 32.3 32.3 .0 19.44 19.45 .01
10-000000 Mining and logging 46.7 46.8 .1 26.05 26.02 -.03 20-000000 Construction 38.8 38.8 .0 23.82 23.82 .00 30-000000 Manufacturing 41.5 41.5 .0 19.04 19.02 -.02 31-000000 Durable goods 42.0 42.0 .0 20.14 20.12 -.02 31-321000 Wood products 40.6 40.6 .0 14.82 14.82 .00 31-327000 Nonmetallic mineral
products 41.5 41.5 .0 17.89 17.88 -.01
31-331000 Primary metals 44.2 44.1 -.1 20.12 20.06 -.06 31-332000 Fabricated metal
products 42.2 42.2 .0 18.17 18.17 .00
31-333000 Machinery 43.2 43.2 .0 19.95 19.96 .01 31-334000 Computer and electronic
products 40.4 40.4 .0 23.40 23.40 .00
Benchmark Article: BLS Establishment Estimates Revised to Incorporate March 2012 Benchmarks
U.S. Bureau of Labor Statistics Page 31 of 51
Back to Top
CES Industry
Code CES Industry Title
Average Weekly Hours Average Hourly Earnings As Previously
Published As
Revised Difference As Previously Published
As Revised Difference
31-335000 Electrical equipment and appliances
41.4 41.4 .0 17.94 17.94 .00
31-336000 Transportation equipment
43.6 43.6 .0 24.83 24.77 -.06
31-336001 Motor vehicles and parts 44.0 44.0 .0 21.49 21.39 -.10 31-337000 Furniture and related
products 40.2 40.2 .0 15.32 15.32 .00
31-339000 Miscellaneous durable goods manufacturing
38.8 38.8 .0 16.98 16.97 -.01
32-000000 Nondurable goods 40.7 40.7 .0 17.24 17.22 -.02 32-311000 Food manufacturing 40.0 40.0 .0 14.87 14.87 .00 32-313000 Textile mills 43.2 43.2 .0 13.43 13.43 .00 32-314000 Textile product mills 40.4 40.3 -.1 12.50 12.51 .01 32-315000 Apparel 37.2 37.2 .0 12.67 12.66 -.01 32-322000 Paper and paper
products 42.5 42.5 .0 20.30 20.37 .07
32-323000 Printing and related support activities
38.1 38.1 .0 17.28 17.28 .00
32-324000 Petroleum and coal products
46.6 46.6 .0 31.30 31.44 .14
32-325000 Chemicals 42.1 42.1 .0 21.55 21.55 .00 32-326000 Plastics and rubber
products 41.7 41.7 .0 16.02 16.03 .01
32-329000 Miscellaneous nondurable goods manufacturing
38.4 38.4 .0 18.27 18.27 .00
40-000000 Trade, transportation, and utilities
33.5 33.5 .0 17.34 17.35 .01
41-420000 Wholesale trade 38.3 38.3 .0 21.98 21.99 .01 42-000000 Retail trade 30.4 30.4 .0 13.80 13.80 .00
Benchmark Article: BLS Establishment Estimates Revised to Incorporate March 2012 Benchmarks
U.S. Bureau of Labor Statistics Page 32 of 51
Back to Top
CES Industry
Code CES Industry Title
Average Weekly Hours Average Hourly Earnings As Previously
Published As
Revised Difference As Previously Published
As Revised Difference
43-000000 Transportation and warehousing
37.2 37.3 .1 19.54 19.56 .02
44-220000 Utilities 40.2 40.2 .0 31.16 31.17 .01 50-000000 Information 35.7 35.7 .0 26.72 26.74 .02 55-000000 Financial activities 36.3 36.3 .0 22.48 22.53 .05 60-000000 Professional and
business services 34.9 34.9 .0 23.26 23.25 -.01
65-000000 Education and health services
32.2 32.2 .0 20.98 21.01 .03
70-000000 Leisure and hospitality 24.9 24.9 .0 11.62 11.63 .01 80-000000 Other services 30.5 30.6 .1 17.45 17.60 .15 (1)Formerly Table 4b.
To Table of Figures

Benchmark Article: BLS Establishment Estimates Revised to Incorporate March 2012 Benchmarks
U.S. Bureau of Labor Statistics Page 33 of 51
Back to Top
Methods
Benchmark adjustment procedure
Establishment survey benchmarking is done on an annual basis to a population derived primarily from the administrative file of employees covered by UI. The time required to complete the revision process—from the full collection of the UI population data to publication of the revised industry estimates—is about ten months. The benchmark adjustment procedure replaces the March sample-based employment estimates with UI-based population counts for March. The benchmark therefore determines the final employment levels, while sample movements capture month-to-month trends. Benchmarks are established for each basic estimating cell and are aggregated to develop published levels. On a not seasonally adjusted basis, the sample-based estimates for the year preceding and the nine months following the benchmark also are then subject to revision. Employment estimates for the months between the most recent March benchmark and the previous year's benchmark are adjusted using a "wedge-back" procedure. In this process, the difference between the benchmark level and the previously published March estimate for each estimating cell is computed. This difference, or error, is linearly distributed across the 11 months of estimates subsequent to the previous benchmark; eleven-twelfths of the March difference is added to February estimates, ten-twelfths to January estimates, and so on, ending with the previous April estimates, which receive one-twelfth of the March difference. The wedge procedure assumes that the total estimation error accumulated at a steady rate since the last benchmark. Applying previously derived over-the-month sample changes to the revised March level yields revised estimates for the nine months following the March benchmark (also referred to as the post-benchmark period, see Revisions in the post-benchmark period). New net birth/death model estimates also are calculated and applied during post-benchmark estimation. The annual sample update is introduced in the November final sample-based estimates, which are released along with the January first preliminary sample-based estimates that coincide with the Benchmark release. The new sample is used for all subsequent estimates.
Benchmark source material
The principal source of benchmark data for private industries is the Quarterly Census of Employment and Wages (QCEW). Noncovered employment results from a difference in scope between the CES program and the QCEW program. The QCEW only includes employment data provided to State Employment Security Agencies by employers covered by State UI laws. BLS uses several other sources to establish benchmarks for the industries partially covered or exempt from mandatory UI coverage, accounting for nearly 3 percent of the nonfarm employment total. Data on employees covered under Social Security laws, published by the U.S. Census Bureau in County Business Patterns, are used to augment UI data for industries not fully covered by the UI scope, such as Non-office insurance sales workers, child daycare workers, Religious organizations, and Private schools and hospitals. Noncovered employment for State and Local government hospitals and Educational institutions is based on the Annual Survey of Public Employment and Payroll (ASPEP) conducted by the Census Bureau. Noncovered employment
Benchmark Article: BLS Establishment Estimates Revised to Incorporate March 2012 Benchmarks
U.S. Bureau of Labor Statistics Page 34 of 51
Back to Top
data from these sources are available only on a lagged basis. Extrapolation to a current level is accomplished by applying the employment trends from the UI-covered part of the population in these industries to the noncovered part. Universe data for interstate railroads are obtained from the Railroad Retirement Board. More information on calculating noncovered employment in the CES program is available in the CES Technical Notes at www.bls.gov/ces/cestn.htm#NCE.
Business birth and death estimation
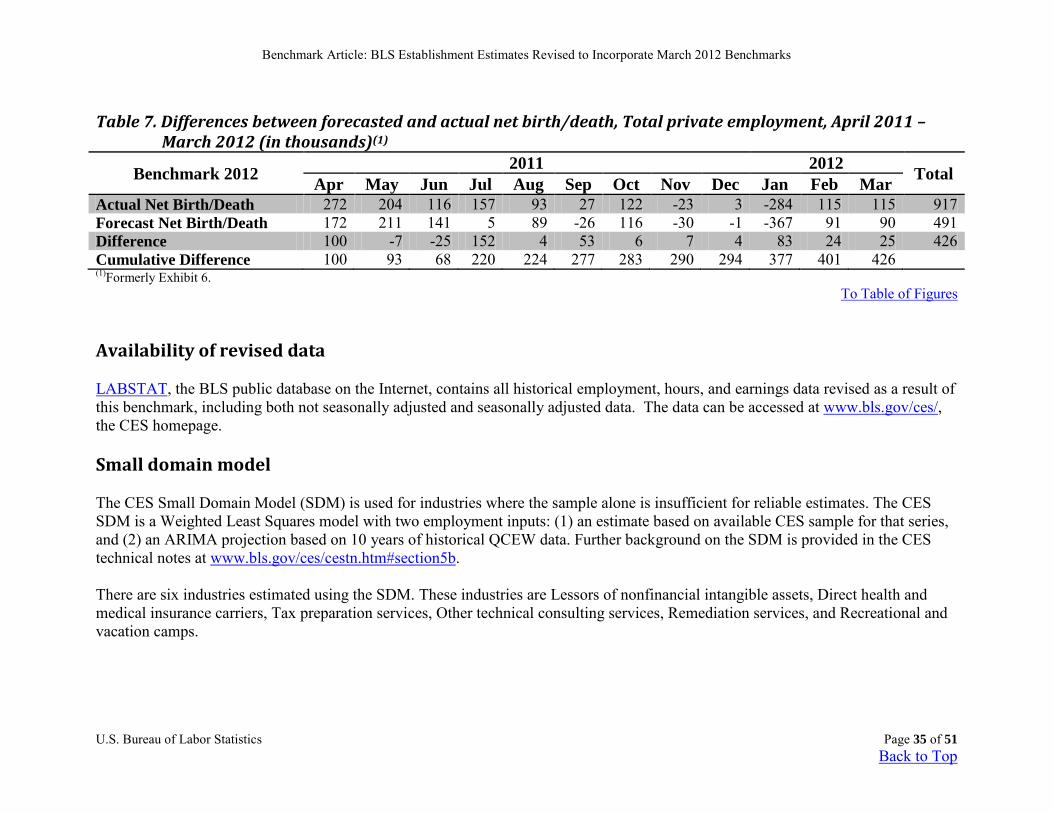
Regular updating of the CES sample frame with information from the UI universe files helps to keep the CES survey current with respect to employment from business births and business deaths. The timeliest UI universe files available, however, always will be a minimum of nine months out of date. The CES survey thus cannot rely on regular frame maintenance alone to provide estimates for business birth and death employment contributions. BLS has researched both sample-based and model-based approaches to measuring birth units that have not yet appeared on the UI universe frame. Since the research demonstrated that sampling for births was not feasible in the very short CES production timeframes, the Bureau is utilizing a model-based approach for this component. Earlier research indicated that while both the business birth and death portions of total employment are generally significant, the net contribution is relatively small and stable. To account for this net birth/death portion of total employment, BLS is utilizing an estimation procedure with two components. The first component excludes employment losses from business deaths from sample-based estimation in order to offset the missing employment gains from business births. This is incorporated into the sample-based link relative estimate procedure by simply not reflecting sample units going out of business, but imputing to them the same trend as the other firms in the sample. The second component is an Autoregressive Integrated Moving Average (ARIMA) time series model designed to estimate the net birth/death employment not accounted for by the imputation. The historical time series used to create and test the ARIMA model was derived from the UI universe micro level database, and reflects the actual net of births and deaths over the past five years. The net birth/death model component figures are unique to each month and include negative adjustments in some months. Furthermore, these figures exhibit a seasonal pattern similar to the seasonal patterns of the continuing businesses. Only error from the second component is directly measurable. Error from this component is measured by comparing the actual net of births and deaths from March 2011-12 — once it becomes available — with the model-based estimate. As Table 7 shows, the actual net birth/death for April 2011 to March 2012 was approximately 426,000 above the forecasted amount used in the CES monthly estimates for the time period.
Benchmark Article: BLS Establishment Estimates Revised to Incorporate March 2012 Benchmarks
U.S. Bureau of Labor Statistics Page 35 of 51
Back to Top
Table 7. Differences between forecasted and actual net birth/death, Total private employment, April 2011 – March 2012 (in thousands)(1)
Benchmark 2012 2011 2012 Total Apr May Jun Jul Aug Sep Oct Nov Dec Jan Feb Mar Actual Net Birth/Death 272 204 116 157 93 27 122 -23 3 -284 115 115 917 Forecast Net Birth/Death 172 211 141 5 89 -26 116 -30 -1 -367 91 90 491 Difference 100 -7 -25 152 4 53 6 7 4 83 24 25 426 Cumulative Difference 100 93 68 220 224 277 283 290 294 377 401 426 (1)Formerly Exhibit 6.
To Table of Figures
Availability of revised data
LABSTAT, the BLS public database on the Internet, contains all historical employment, hours, and earnings data revised as a result of this benchmark, including both not seasonally adjusted and seasonally adjusted data. The data can be accessed at www.bls.gov/ces/, the CES homepage.
Small domain model
The CES Small Domain Model (SDM) is used for industries where the sample alone is insufficient for reliable estimates. The CES SDM is a Weighted Least Squares model with two employment inputs: (1) an estimate based on available CES sample for that series, and (2) an ARIMA projection based on 10 years of historical QCEW data. Further background on the SDM is provided in the CES technical notes at www.bls.gov/ces/cestn.htm#section5b. There are six industries estimated using the SDM. These industries are Lessors of nonfinancial intangible assets, Direct health and medical insurance carriers, Tax preparation services, Other technical consulting services, Remediation services, and Recreational and vacation camps.
Benchmark Article: BLS Establishment Estimates Revised to Incorporate March 2012 Benchmarks
U.S. Bureau of Labor Statistics Page 36 of 51
Back to Top
Estimates for all other data types for these six series previously used the standard weighted link-and-taper methodology, which does not account for insufficient sample. Since item response rates tend to be lower for data types other than AE, BLS discontinued production of all non-AE series where the SDM was used for AE with the 2012 benchmark release in February 2013.
Seasonal adjustment procedure
BLS uses X-12 ARIMA software developed by the U.S. Census Bureau to seasonally adjust National employment, hours, and earnings series derived from the CES program. Individual series are seasonally adjusted using either a multiplicative or an additive model (Table 8 through Table 16). For published AE series, the CES program seasonally adjusts many series at the 3-, 4-, 5-, and 6-digit NAICS level. However, only the seasonally adjusted 3-digit NAICS level estimates are used to aggregate to the higher levels. The seasonally adjusted series that are published at more detailed levels than the 3-digit NAICS are considered to be independent series and are not included in aggregation of seasonally adjusted series4 with the exception of the component series used in indirect seasonal adjustment5. For published AE AWH, AE AHE, PE, PE AWH, and PE AHE series, the CES program seasonally adjusts at the 2 digit NAICS level, or the major industry sector level for all industries except Manufacturing which is seasonally adjusted at the 3-digit NAICS level. These seasonally adjusted series are aggregated from the 3-digit NAICS level in Manufacturing industries and from the major industry sector level for all other industries to get higher level seasonally adjusted series. For published PE and AE overtime series, the CES program seasonally adjusts major industry sectors Durable goods and Nondurable goods. These two seasonally adjusted overtime series are aggregated to the Manufacturing level. For published WE series, the CES program seasonally adjusts at the major industry sector level for all industries. The seasonally adjusted WE are aggregated from the major industry sector level for all industries to the higher level seasonally adjusted series.
Special model adjustments
Variable survey intervals. Beginning with the release of the 1995 benchmark, BLS refined the seasonal adjustment procedures to control for survey interval variations, sometimes referred to as 4 For example, seasonally adjusted data at the 5-digit NAICS are not aggregated to form seasonally adjusted 4-digit NAICS series. Instead the 4-digit NAICS and the 5-digit NAICS level series are independently seasonally adjusted. 5 Most series are seasonally adjusted by directly applying the seasonal adjustment factors to the series. In some cases, 3-digit NAICS series are indirectly seasonally adjusted by aggregating the seasonally adjusted employment level of their component series. For indirectly seasonally adjusted 3-digit NAICS series, the seasonal adjustment factors are applied to the component series rather than to the 3-digit NAICS series. Indirectly seasonally adjusted series are noted in Table 8.

Benchmark Article: BLS Establishment Estimates Revised to Incorporate March 2012 Benchmarks
U.S. Bureau of Labor Statistics Page 37 of 51
Back to Top
the 4- versus 5-week effect. Although the CES survey is referenced to a consistent concept— the pay period including the 12th of each month— inconsistencies arise because there are sometimes four and sometimes five weeks between the week including the 12th in a given pair of months. In highly seasonal industries, these variations can be an important determinant of the magnitude of seasonal hires or layoffs that have occurred at the time the survey is taken, thereby complicating seasonal adjustment. Standard seasonal adjustment methodology relies heavily on the experience of the most recent three years to determine the expected seasonal change in employment for each month of the current year. Prior to the implementation of the adjustment, the procedure did not distinguish between 4- and 5-week survey intervals, and the accuracy of the seasonal expectation depended in large measure on how well the current year’s survey interval corresponded with those of the previous three years. All else the same, the greatest potential for distortion occurred when the current month being estimated had a 5-week interval but the three years preceding it were all 4-week intervals, or conversely when the current month had a 4-week interval but the three years preceding it were all 5-week intervals. BLS adopted REGARIMA (regression with auto-correlated errors) modeling to identify the estimated size and significance of the calendar effect for each published series. REGARIMA combines standard regression analysis, which measures correlation among two or more variables, with ARIMA modeling, which describes and predicts the behavior of data series based on its own past history. For many economic time series, including nonfarm payroll employment, observations are auto-correlated over time; that is, each month’s value is significantly dependent on the observations that precede it. These series, therefore, usually can be successfully fit using ARIMA models. If auto-correlated time series are modeled through regression analysis alone, the measured relationships among other variables of interest may be distorted due to the influence of the auto-correlation. Thus, the REGARIMA technique is appropriate for measuring relationships among variables of interest in series that exhibit auto-correlation, such as nonfarm payroll employment. In this application, the correlations of interest are those between employment levels in individual calendar months and the lengths of the survey intervals for those months. The REGARIMA models evaluate the variation in employment levels attributable to eleven separate survey interval variables, one specified for each month, except March. March is excluded because there are almost always four weeks between the February and March surveys. Models for individual basic series are fit with the most recent ten years of data available, the standard time span used for CES seasonal adjustment. The REGARIMA procedure yields regression coefficients for each of the eleven months specified in the model. These coefficients provide estimates of the strength of the relationship between employment levels and the number of weeks between surveys for the eleven modeled months. The X-12 ARIMA software also produces diagnostic statistics that permit the assessment of the statistical significance of the regression coefficients, and all series are reviewed for model adequacy.

Benchmark Article: BLS Establishment Estimates Revised to Incorporate March 2012 Benchmarks
U.S. Bureau of Labor Statistics Page 38 of 51
Back to Top
Because the eleven coefficients derived from the REGARIMA models provide an estimate of the magnitude of variation in employment levels associated with the length of the survey interval, these coefficients are used to adjust the CES data to remove the calendar effect. These "filtered" series then are seasonally adjusted using the standard X-12 ARIMA software. For a few series, REGARIMA models do not fit well; these series are seasonally adjusted with the X-12 software but without the interval effect adjustment. There are several additional special effects modeled through the REGARIMA process; they are described below. Construction series. Beginning with the 1996 benchmark revision, BLS utilized special treatment to adjust construction industry series. In the application of the interval effect modeling process to the construction series, there initially was difficulty in accurately identifying and measuring the effect because of the strong influence of variable weather patterns on employment movements in the industry. Further research allowed BLS to incorporate interval effect modeling for the construction industry by disaggregating the construction series into its finer industry and geographic estimating cells and tightening outlier designation parameters. This allowed a more precise identification of weather-related outliers that had masked the interval effect and clouded the seasonal adjustment patterns in general. With these outliers removed, interval effect modeling became feasible. The result is a seasonally adjusted series for construction that is improved because it is controlled for two potential distortions: unusual weather events and the 4- versus 5-week effect. Floating holidays. BLS is continuing the practice of making special adjustments for average weekly hours and average weekly overtime series to account for the presence or absence of religious holidays in the April survey reference period and the occurrence of Labor Day in the September reference period, back to the start date of each series. Local government series. A special adjustment also is made in November each year to account for variations in employment due to the presence or absence of poll workers in Local government, excluding educational services. Refinements in hours and earnings seasonal adjustment. With the release of the 1997 benchmark, BLS implemented refinements to the seasonal adjustment process for the hours and earnings series to correct for distortions related to the method of accounting for the varying length of payroll periods across months. There is a significant correlation between over-the-month changes in both the average weekly hours (AWH) and the average hourly earnings (AHE) series and the number of weekdays in a month, resulting in noneconomic fluctuations in these two series. Both AWH and AHE show more growth in "short" months (20 or 21 weekdays) than in "long" months (22 or 23 weekdays). The effect is stronger for the AWH than for the AHE series. The calendar effect is traceable to response and processing errors associated with converting payroll and hours information from sample respondents with semi-monthly or monthly pay periods to a weekly equivalent. The response error comes from sample respondents reporting a fixed number of total hours for workers regardless of the length of the reference month, while the CES conversion process assumes that the hours reporting will be variable. A constant level of
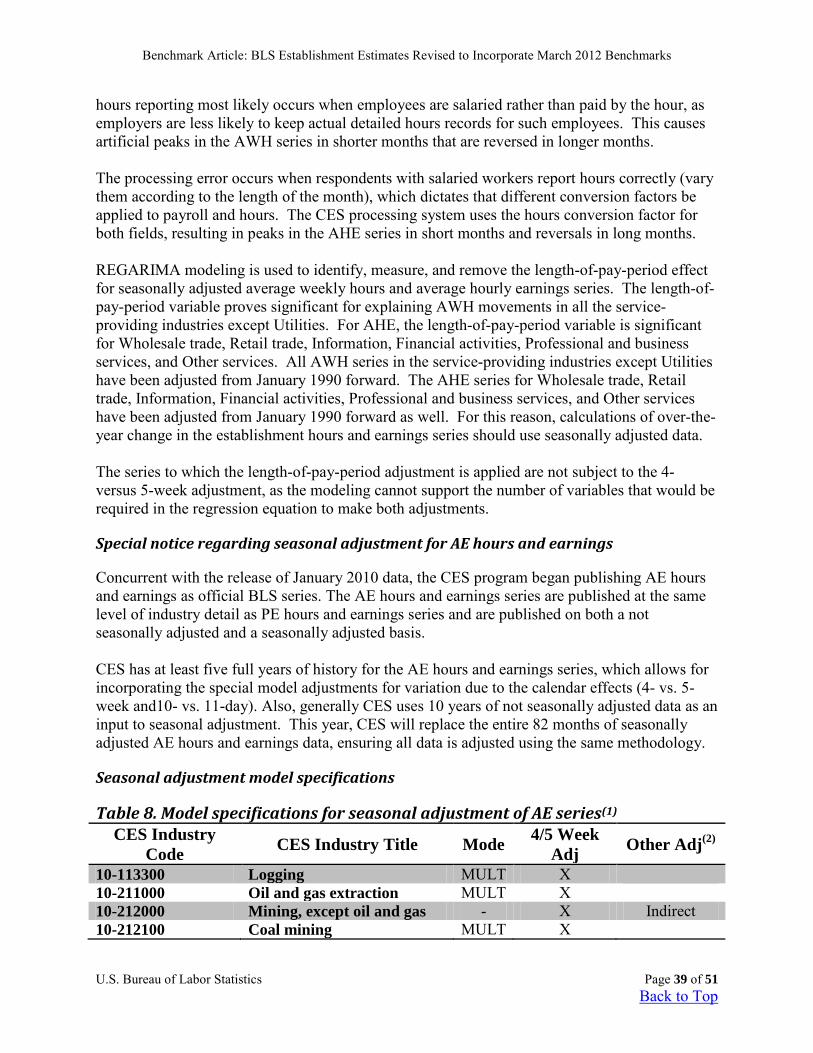
Benchmark Article: BLS Establishment Estimates Revised to Incorporate March 2012 Benchmarks
U.S. Bureau of Labor Statistics Page 39 of 51
Back to Top
hours reporting most likely occurs when employees are salaried rather than paid by the hour, as employers are less likely to keep actual detailed hours records for such employees. This causes artificial peaks in the AWH series in shorter months that are reversed in longer months. The processing error occurs when respondents with salaried workers report hours correctly (vary them according to the length of the month), which dictates that different conversion factors be applied to payroll and hours. The CES processing system uses the hours conversion factor for both fields, resulting in peaks in the AHE series in short months and reversals in long months. REGARIMA modeling is used to identify, measure, and remove the length-of-pay-period effect for seasonally adjusted average weekly hours and average hourly earnings series. The length-of-pay-period variable proves significant for explaining AWH movements in all the service-providing industries except Utilities. For AHE, the length-of-pay-period variable is significant for Wholesale trade, Retail trade, Information, Financial activities, Professional and business services, and Other services. All AWH series in the service-providing industries except Utilities have been adjusted from January 1990 forward. The AHE series for Wholesale trade, Retail trade, Information, Financial activities, Professional and business services, and Other services have been adjusted from January 1990 forward as well. For this reason, calculations of over-the-year change in the establishment hours and earnings series should use seasonally adjusted data. The series to which the length-of-pay-period adjustment is applied are not subject to the 4- versus 5-week adjustment, as the modeling cannot support the number of variables that would be required in the regression equation to make both adjustments.
Special notice regarding seasonal adjustment for AE hours and earnings
Concurrent with the release of January 2010 data, the CES program began publishing AE hours and earnings as official BLS series. The AE hours and earnings series are published at the same level of industry detail as PE hours and earnings series and are published on both a not seasonally adjusted and a seasonally adjusted basis. CES has at least five full years of history for the AE hours and earnings series, which allows for incorporating the special model adjustments for variation due to the calendar effects (4- vs. 5-week and10- vs. 11-day). Also, generally CES uses 10 years of not seasonally adjusted data as an input to seasonal adjustment. This year, CES will replace the entire 82 months of seasonally adjusted AE hours and earnings data, ensuring all data is adjusted using the same methodology.
Seasonal adjustment model specifications
Table 8. Model specifications for seasonal adjustment of AE series(1) CES Industry
Code CES Industry Title Mode 4/5 Week Adj Other Adj(2)
10-113300 Logging MULT X 10-211000 Oil and gas extraction MULT X 10-212000 Mining, except oil and gas - X Indirect 10-212100 Coal mining MULT X
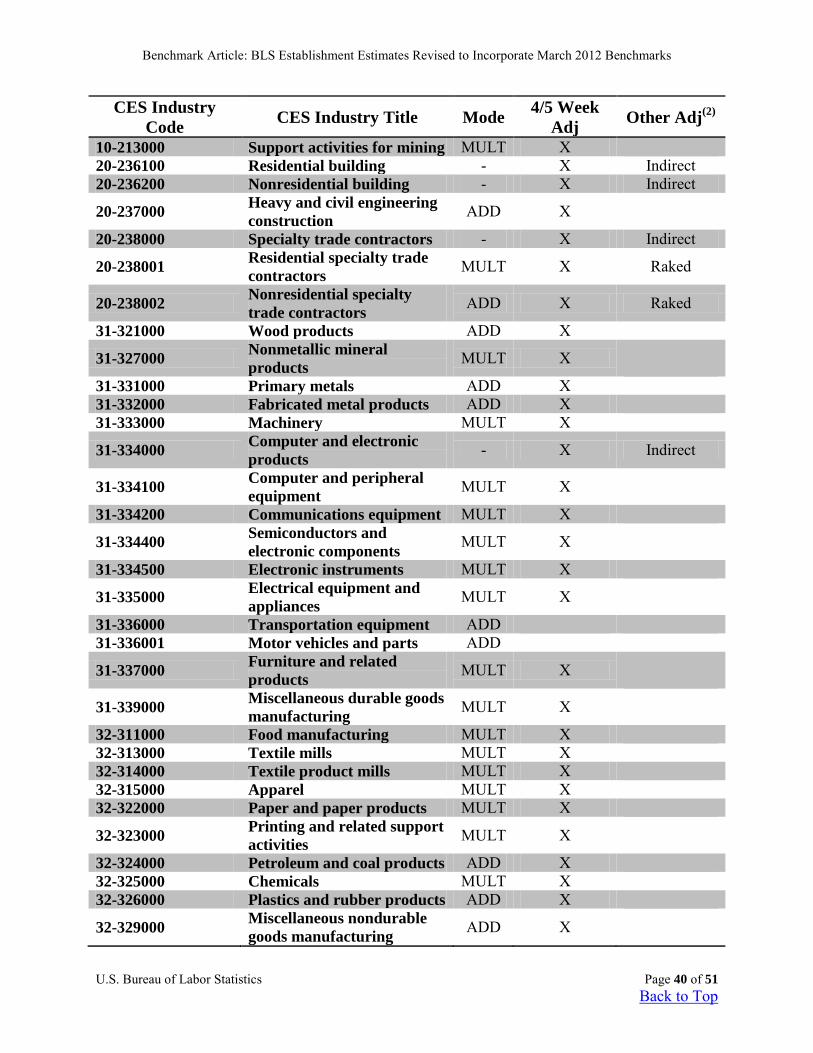
Benchmark Article: BLS Establishment Estimates Revised to Incorporate March 2012 Benchmarks
U.S. Bureau of Labor Statistics Page 40 of 51
Back to Top
CES Industry Code CES Industry Title Mode 4/5 Week
Adj Other Adj(2)
10-213000 Support activities for mining MULT X 20-236100 Residential building - X Indirect 20-236200 Nonresidential building - X Indirect
20-237000 Heavy and civil engineering construction ADD X
20-238000 Specialty trade contractors - X Indirect
20-238001 Residential specialty trade contractors MULT X Raked
20-238002 Nonresidential specialty trade contractors ADD X Raked
31-321000 Wood products ADD X 31-327000 Nonmetallic mineral
products MULT X 31-331000 Primary metals ADD X 31-332000 Fabricated metal products ADD X 31-333000 Machinery MULT X 31-334000 Computer and electronic
products - X Indirect
31-334100 Computer and peripheral equipment MULT X
31-334200 Communications equipment MULT X 31-334400 Semiconductors and
electronic components MULT X 31-334500 Electronic instruments MULT X 31-335000 Electrical equipment and
appliances MULT X 31-336000 Transportation equipment ADD 31-336001 Motor vehicles and parts ADD 31-337000 Furniture and related
products MULT X
31-339000 Miscellaneous durable goods manufacturing MULT X
32-311000 Food manufacturing MULT X 32-313000 Textile mills MULT X 32-314000 Textile product mills MULT X 32-315000 Apparel MULT X 32-322000 Paper and paper products MULT X 32-323000 Printing and related support
activities MULT X 32-324000 Petroleum and coal products ADD X 32-325000 Chemicals MULT X 32-326000 Plastics and rubber products ADD X 32-329000 Miscellaneous nondurable
goods manufacturing ADD X
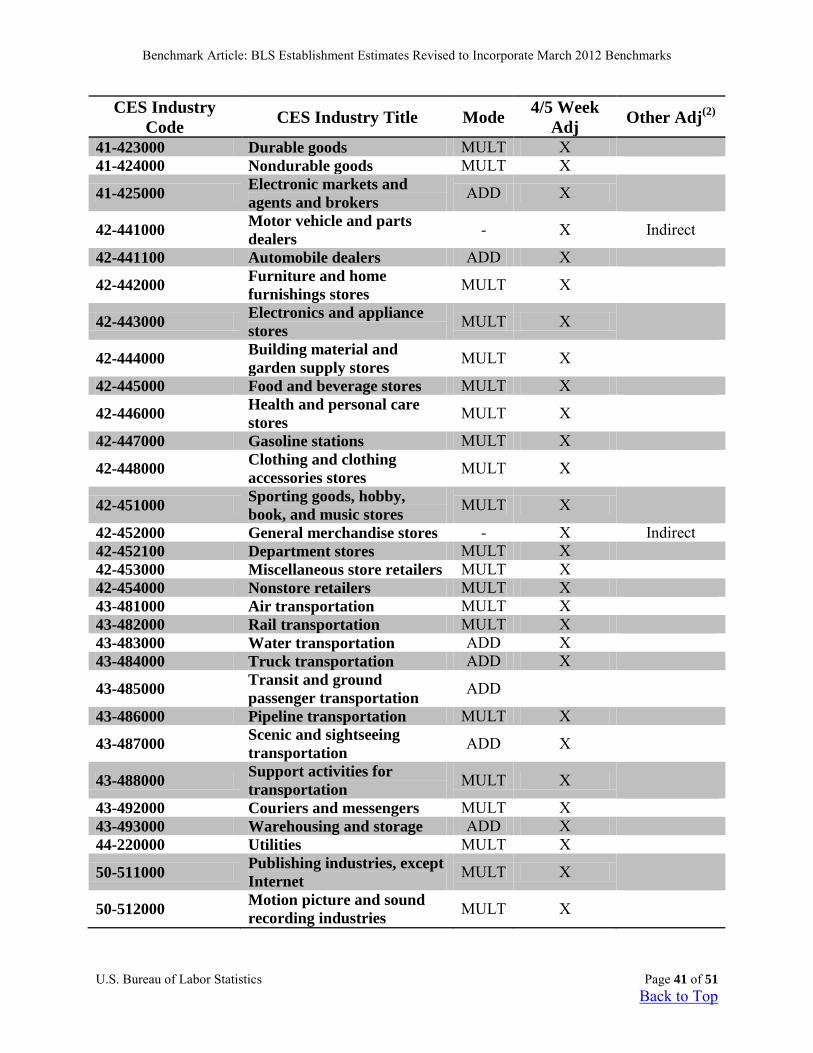
Benchmark Article: BLS Establishment Estimates Revised to Incorporate March 2012 Benchmarks
U.S. Bureau of Labor Statistics Page 41 of 51
Back to Top
CES Industry Code CES Industry Title Mode 4/5 Week
Adj Other Adj(2)
41-423000 Durable goods MULT X 41-424000 Nondurable goods MULT X 41-425000 Electronic markets and
agents and brokers ADD X
42-441000 Motor vehicle and parts dealers - X Indirect
42-441100 Automobile dealers ADD X 42-442000 Furniture and home
furnishings stores MULT X
42-443000 Electronics and appliance stores MULT X
42-444000 Building material and garden supply stores MULT X
42-445000 Food and beverage stores MULT X 42-446000 Health and personal care
stores MULT X 42-447000 Gasoline stations MULT X 42-448000 Clothing and clothing
accessories stores MULT X
42-451000 Sporting goods, hobby, book, and music stores MULT X
42-452000 General merchandise stores - X Indirect 42-452100 Department stores MULT X 42-453000 Miscellaneous store retailers MULT X 42-454000 Nonstore retailers MULT X 43-481000 Air transportation MULT X 43-482000 Rail transportation MULT X 43-483000 Water transportation ADD X 43-484000 Truck transportation ADD X 43-485000 Transit and ground
passenger transportation ADD 43-486000 Pipeline transportation MULT X 43-487000 Scenic and sightseeing
transportation ADD X
43-488000 Support activities for transportation MULT X
43-492000 Couriers and messengers MULT X 43-493000 Warehousing and storage ADD X 44-220000 Utilities MULT X 50-511000 Publishing industries, except
Internet MULT X
50-512000 Motion picture and sound recording industries MULT X
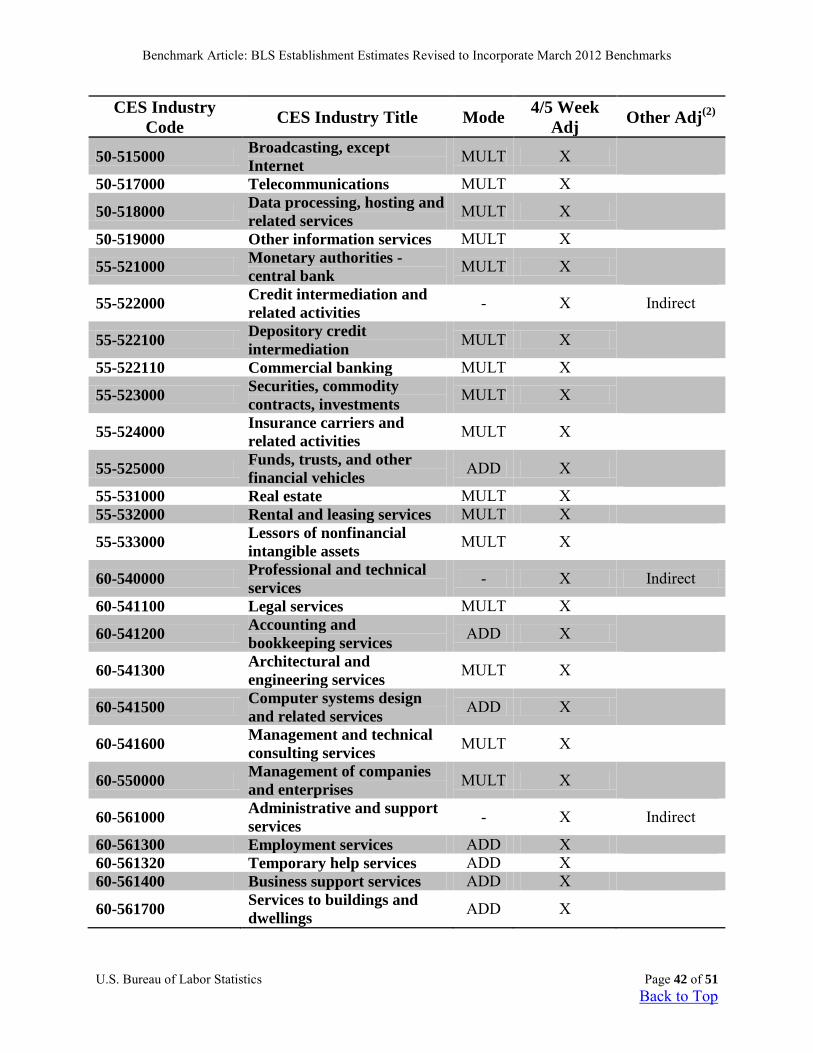
Benchmark Article: BLS Establishment Estimates Revised to Incorporate March 2012 Benchmarks
U.S. Bureau of Labor Statistics Page 42 of 51
Back to Top
CES Industry Code CES Industry Title Mode 4/5 Week
Adj Other Adj(2)
50-515000 Broadcasting, except Internet MULT X
50-517000 Telecommunications MULT X 50-518000 Data processing, hosting and
related services MULT X 50-519000 Other information services MULT X 55-521000 Monetary authorities -
central bank MULT X
55-522000 Credit intermediation and related activities - X Indirect
55-522100 Depository credit intermediation MULT X
55-522110 Commercial banking MULT X 55-523000 Securities, commodity
contracts, investments MULT X
55-524000 Insurance carriers and related activities MULT X
55-525000 Funds, trusts, and other financial vehicles ADD X
55-531000 Real estate MULT X 55-532000 Rental and leasing services MULT X 55-533000 Lessors of nonfinancial
intangible assets MULT X
60-540000 Professional and technical services - X Indirect
60-541100 Legal services MULT X 60-541200 Accounting and
bookkeeping services ADD X
60-541300 Architectural and engineering services MULT X
60-541500 Computer systems design and related services ADD X
60-541600 Management and technical consulting services MULT X
60-550000 Management of companies and enterprises MULT X
60-561000 Administrative and support services - X Indirect
60-561300 Employment services ADD X 60-561320 Temporary help services ADD X 60-561400 Business support services ADD X 60-561700 Services to buildings and
dwellings ADD X
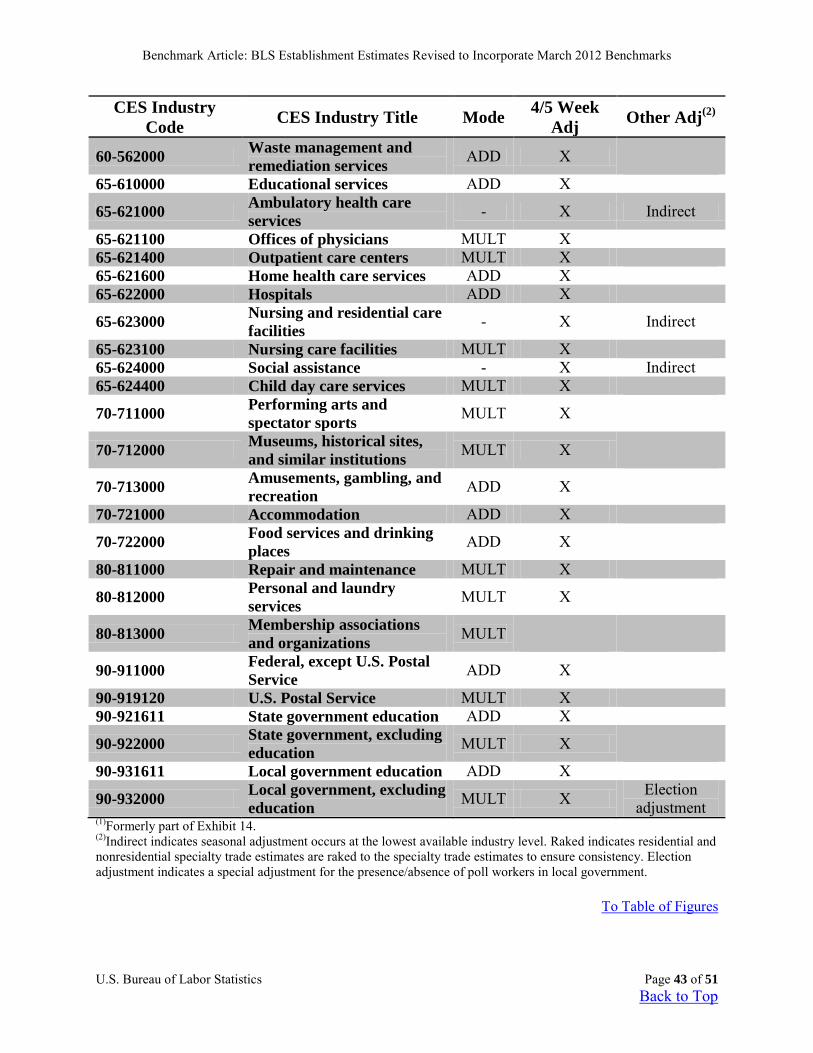
Benchmark Article: BLS Establishment Estimates Revised to Incorporate March 2012 Benchmarks
U.S. Bureau of Labor Statistics Page 43 of 51
Back to Top
CES Industry Code CES Industry Title Mode 4/5 Week
Adj Other Adj(2)
60-562000 Waste management and remediation services ADD X
65-610000 Educational services ADD X 65-621000 Ambulatory health care
services - X Indirect
65-621100 Offices of physicians MULT X 65-621400 Outpatient care centers MULT X 65-621600 Home health care services ADD X 65-622000 Hospitals ADD X 65-623000 Nursing and residential care
facilities - X Indirect
65-623100 Nursing care facilities MULT X 65-624000 Social assistance - X Indirect 65-624400 Child day care services MULT X 70-711000 Performing arts and
spectator sports MULT X
70-712000 Museums, historical sites, and similar institutions MULT X
70-713000 Amusements, gambling, and recreation ADD X
70-721000 Accommodation ADD X 70-722000 Food services and drinking
places ADD X 80-811000 Repair and maintenance MULT X 80-812000 Personal and laundry
services MULT X
80-813000 Membership associations and organizations MULT
90-911000 Federal, except U.S. Postal Service ADD X
90-919120 U.S. Postal Service MULT X 90-921611 State government education ADD X 90-922000 State government, excluding
education MULT X 90-931611 Local government education ADD X 90-932000 Local government, excluding
education MULT X Election adjustment
(1)Formerly part of Exhibit 14. (2)Indirect indicates seasonal adjustment occurs at the lowest available industry level. Raked indicates residential and nonresidential specialty trade estimates are raked to the specialty trade estimates to ensure consistency. Election adjustment indicates a special adjustment for the presence/absence of poll workers in local government.
To Table of Figures
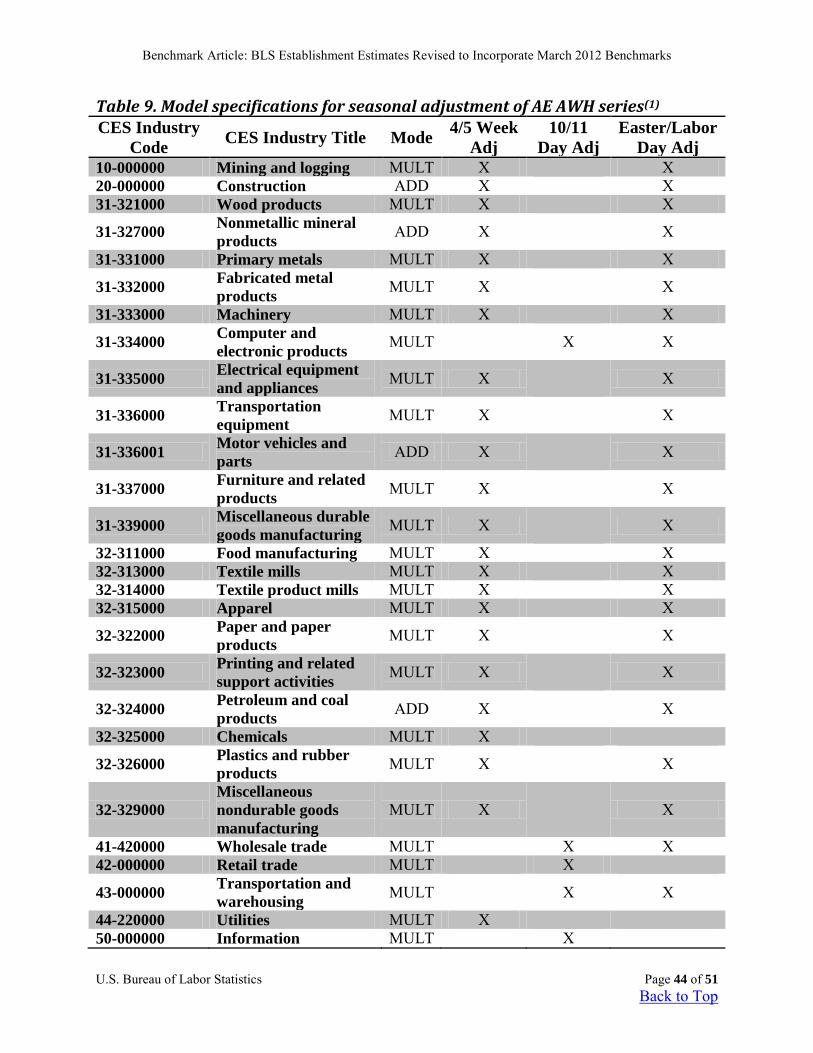
Benchmark Article: BLS Establishment Estimates Revised to Incorporate March 2012 Benchmarks
U.S. Bureau of Labor Statistics Page 44 of 51
Back to Top
Table 9. Model specifications for seasonal adjustment of AE AWH series(1) CES Industry
Code CES Industry Title Mode 4/5 Week Adj
10/11 Day Adj
Easter/Labor Day Adj
10-000000 Mining and logging MULT X X 20-000000 Construction ADD X X 31-321000 Wood products MULT X X
31-327000 Nonmetallic mineral products ADD X X
31-331000 Primary metals MULT X X
31-332000 Fabricated metal products MULT X X
31-333000 Machinery MULT X X
31-334000 Computer and electronic products MULT X X
31-335000 Electrical equipment and appliances MULT X X
31-336000 Transportation equipment MULT X X
31-336001 Motor vehicles and parts ADD X X
31-337000 Furniture and related products MULT X X
31-339000 Miscellaneous durable goods manufacturing MULT X X
32-311000 Food manufacturing MULT X X 32-313000 Textile mills MULT X X 32-314000 Textile product mills MULT X X 32-315000 Apparel MULT X X
32-322000 Paper and paper products MULT X X
32-323000 Printing and related support activities MULT X X
32-324000 Petroleum and coal products ADD X X
32-325000 Chemicals MULT X 32-326000 Plastics and rubber
products MULT X X
32-329000 Miscellaneous nondurable goods manufacturing
MULT X X
41-420000 Wholesale trade MULT X X 42-000000 Retail trade MULT X 43-000000 Transportation and
warehousing MULT X X
44-220000 Utilities MULT X 50-000000 Information MULT X
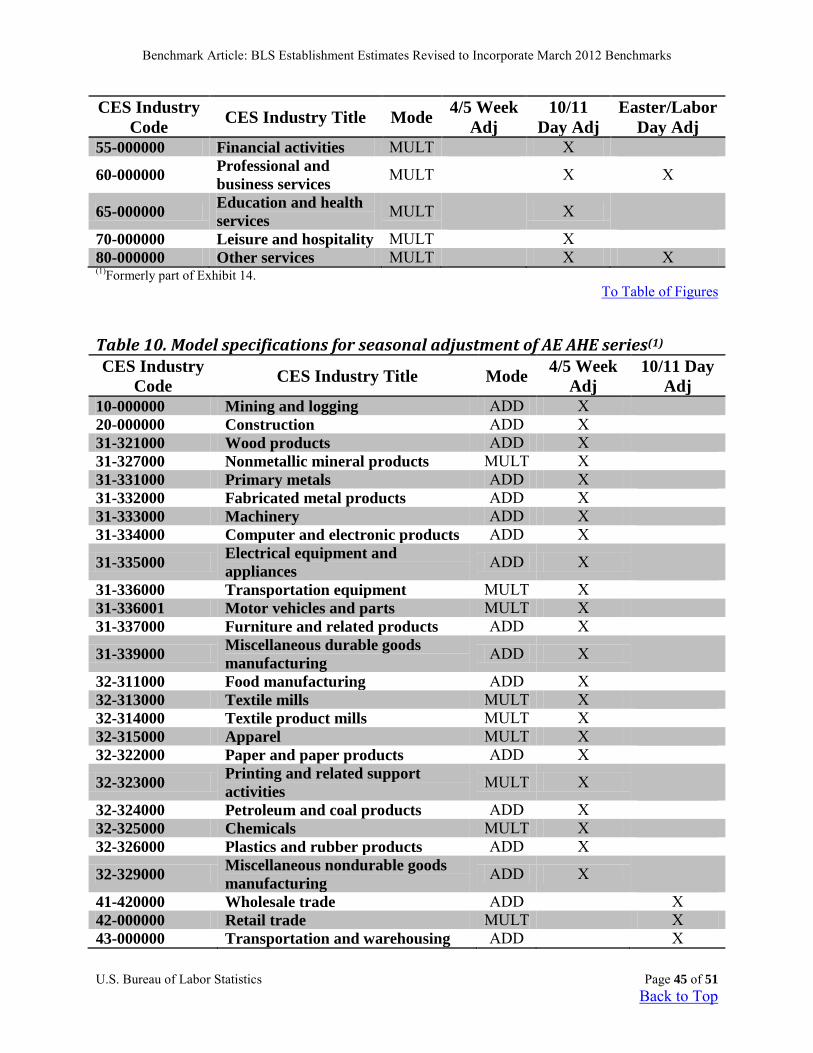
Benchmark Article: BLS Establishment Estimates Revised to Incorporate March 2012 Benchmarks
U.S. Bureau of Labor Statistics Page 45 of 51
Back to Top
CES Industry Code CES Industry Title Mode 4/5 Week
Adj 10/11
Day Adj Easter/Labor
Day Adj 55-000000 Financial activities MULT X 60-000000 Professional and
business services MULT X X
65-000000 Education and health services MULT X
70-000000 Leisure and hospitality MULT X 80-000000 Other services MULT X X (1)Formerly part of Exhibit 14.
To Table of Figures
Table 10. Model specifications for seasonal adjustment of AE AHE series(1) CES Industry
Code CES Industry Title Mode 4/5 Week Adj
10/11 Day Adj
10-000000 Mining and logging ADD X 20-000000 Construction ADD X 31-321000 Wood products ADD X 31-327000 Nonmetallic mineral products MULT X 31-331000 Primary metals ADD X 31-332000 Fabricated metal products ADD X 31-333000 Machinery ADD X 31-334000 Computer and electronic products ADD X 31-335000 Electrical equipment and
appliances ADD X 31-336000 Transportation equipment MULT X 31-336001 Motor vehicles and parts MULT X 31-337000 Furniture and related products ADD X 31-339000 Miscellaneous durable goods
manufacturing ADD X 32-311000 Food manufacturing ADD X 32-313000 Textile mills MULT X 32-314000 Textile product mills MULT X 32-315000 Apparel MULT X 32-322000 Paper and paper products ADD X 32-323000 Printing and related support
activities MULT X 32-324000 Petroleum and coal products ADD X 32-325000 Chemicals MULT X 32-326000 Plastics and rubber products ADD X 32-329000 Miscellaneous nondurable goods
manufacturing ADD X 41-420000 Wholesale trade ADD X 42-000000 Retail trade MULT X 43-000000 Transportation and warehousing ADD X
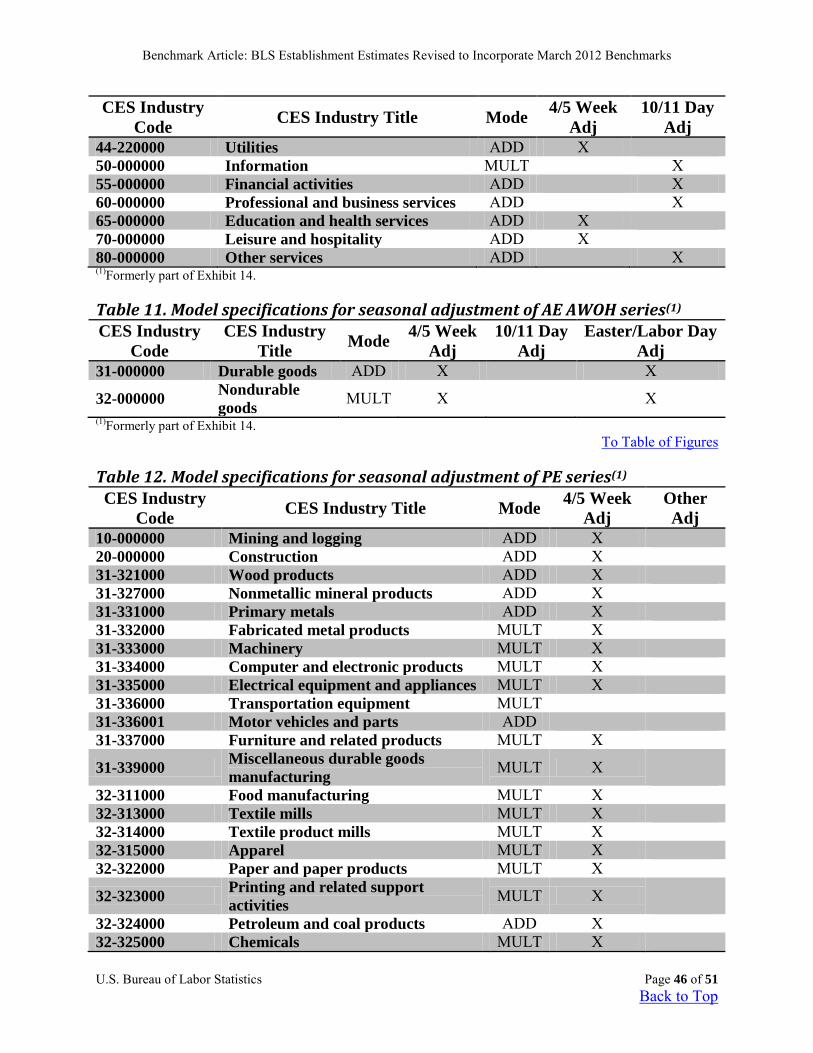
Benchmark Article: BLS Establishment Estimates Revised to Incorporate March 2012 Benchmarks
U.S. Bureau of Labor Statistics Page 46 of 51
Back to Top
CES Industry Code CES Industry Title Mode 4/5 Week
Adj 10/11 Day
Adj 44-220000 Utilities ADD X 50-000000 Information MULT X 55-000000 Financial activities ADD X 60-000000 Professional and business services ADD X 65-000000 Education and health services ADD X 70-000000 Leisure and hospitality ADD X 80-000000 Other services ADD X (1)Formerly part of Exhibit 14.
Table 11. Model specifications for seasonal adjustment of AE AWOH series(1) CES Industry
Code CES Industry
Title Mode 4/5 Week Adj
10/11 Day Adj
Easter/Labor Day Adj
31-000000 Durable goods ADD X X
32-000000 Nondurable goods MULT X X
(1)Formerly part of Exhibit 14. To Table of Figures
Table 12. Model specifications for seasonal adjustment of PE series(1) CES Industry
Code CES Industry Title Mode 4/5 Week Adj
Other Adj
10-000000 Mining and logging ADD X 20-000000 Construction ADD X 31-321000 Wood products ADD X 31-327000 Nonmetallic mineral products ADD X 31-331000 Primary metals ADD X 31-332000 Fabricated metal products MULT X 31-333000 Machinery MULT X 31-334000 Computer and electronic products MULT X 31-335000 Electrical equipment and appliances MULT X 31-336000 Transportation equipment MULT 31-336001 Motor vehicles and parts ADD 31-337000 Furniture and related products MULT X 31-339000 Miscellaneous durable goods
manufacturing MULT X 32-311000 Food manufacturing MULT X 32-313000 Textile mills MULT X 32-314000 Textile product mills MULT X 32-315000 Apparel MULT X 32-322000 Paper and paper products MULT X 32-323000 Printing and related support
activities MULT X 32-324000 Petroleum and coal products ADD X 32-325000 Chemicals MULT X
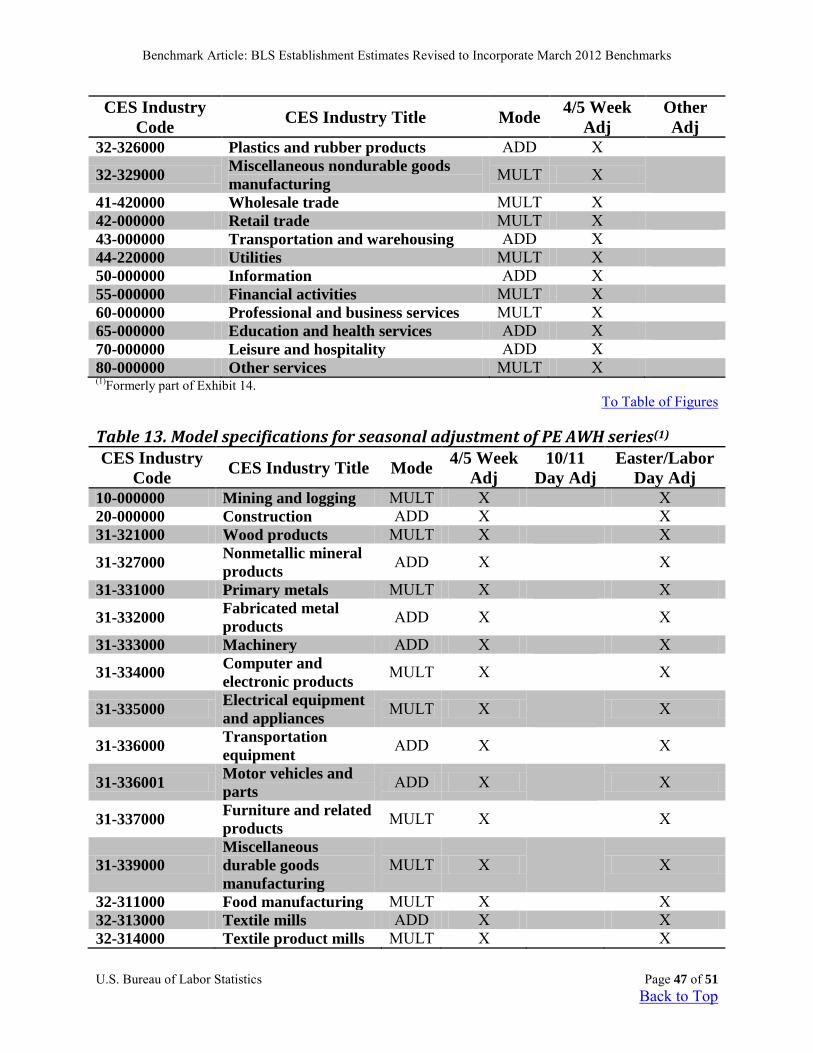
Benchmark Article: BLS Establishment Estimates Revised to Incorporate March 2012 Benchmarks
U.S. Bureau of Labor Statistics Page 47 of 51
Back to Top
CES Industry Code CES Industry Title Mode 4/5 Week
Adj Other Adj
32-326000 Plastics and rubber products ADD X 32-329000 Miscellaneous nondurable goods
manufacturing MULT X 41-420000 Wholesale trade MULT X 42-000000 Retail trade MULT X 43-000000 Transportation and warehousing ADD X 44-220000 Utilities MULT X 50-000000 Information ADD X 55-000000 Financial activities MULT X 60-000000 Professional and business services MULT X 65-000000 Education and health services ADD X 70-000000 Leisure and hospitality ADD X 80-000000 Other services MULT X (1)Formerly part of Exhibit 14.
To Table of Figures
Table 13. Model specifications for seasonal adjustment of PE AWH series(1) CES Industry
Code CES Industry Title Mode 4/5 Week Adj
10/11 Day Adj
Easter/Labor Day Adj
10-000000 Mining and logging MULT X X 20-000000 Construction ADD X X 31-321000 Wood products MULT X X
31-327000 Nonmetallic mineral products ADD X X
31-331000 Primary metals MULT X X
31-332000 Fabricated metal products ADD X X
31-333000 Machinery ADD X X
31-334000 Computer and electronic products MULT X X
31-335000 Electrical equipment and appliances MULT X X
31-336000 Transportation equipment ADD X X
31-336001 Motor vehicles and parts ADD X X
31-337000 Furniture and related products MULT X X
31-339000 Miscellaneous durable goods manufacturing
MULT X X
32-311000 Food manufacturing MULT X X 32-313000 Textile mills ADD X X 32-314000 Textile product mills MULT X X
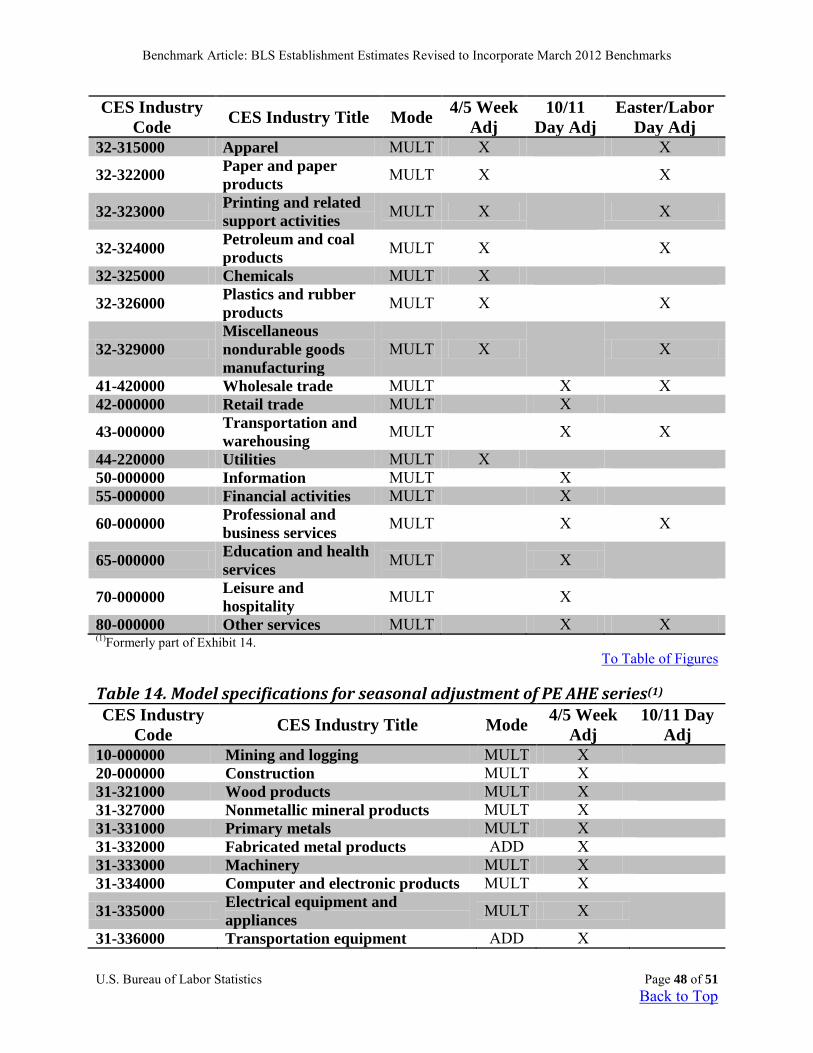
Benchmark Article: BLS Establishment Estimates Revised to Incorporate March 2012 Benchmarks
U.S. Bureau of Labor Statistics Page 48 of 51
Back to Top
CES Industry Code CES Industry Title Mode 4/5 Week
Adj 10/11
Day Adj Easter/Labor
Day Adj 32-315000 Apparel MULT X X
32-322000 Paper and paper products MULT X X
32-323000 Printing and related support activities MULT X X
32-324000 Petroleum and coal products MULT X X
32-325000 Chemicals MULT X 32-326000 Plastics and rubber
products MULT X X
32-329000 Miscellaneous nondurable goods manufacturing
MULT X X
41-420000 Wholesale trade MULT X X 42-000000 Retail trade MULT X 43-000000 Transportation and
warehousing MULT X X
44-220000 Utilities MULT X 50-000000 Information MULT X 55-000000 Financial activities MULT X 60-000000 Professional and
business services MULT X X
65-000000 Education and health services MULT X
70-000000 Leisure and hospitality MULT X
80-000000 Other services MULT X X (1)Formerly part of Exhibit 14.
To Table of Figures
Table 14. Model specifications for seasonal adjustment of PE AHE series(1) CES Industry
Code CES Industry Title Mode 4/5 Week Adj
10/11 Day Adj
10-000000 Mining and logging MULT X 20-000000 Construction MULT X 31-321000 Wood products MULT X 31-327000 Nonmetallic mineral products MULT X 31-331000 Primary metals MULT X 31-332000 Fabricated metal products ADD X 31-333000 Machinery MULT X 31-334000 Computer and electronic products MULT X 31-335000 Electrical equipment and
appliances MULT X 31-336000 Transportation equipment ADD X
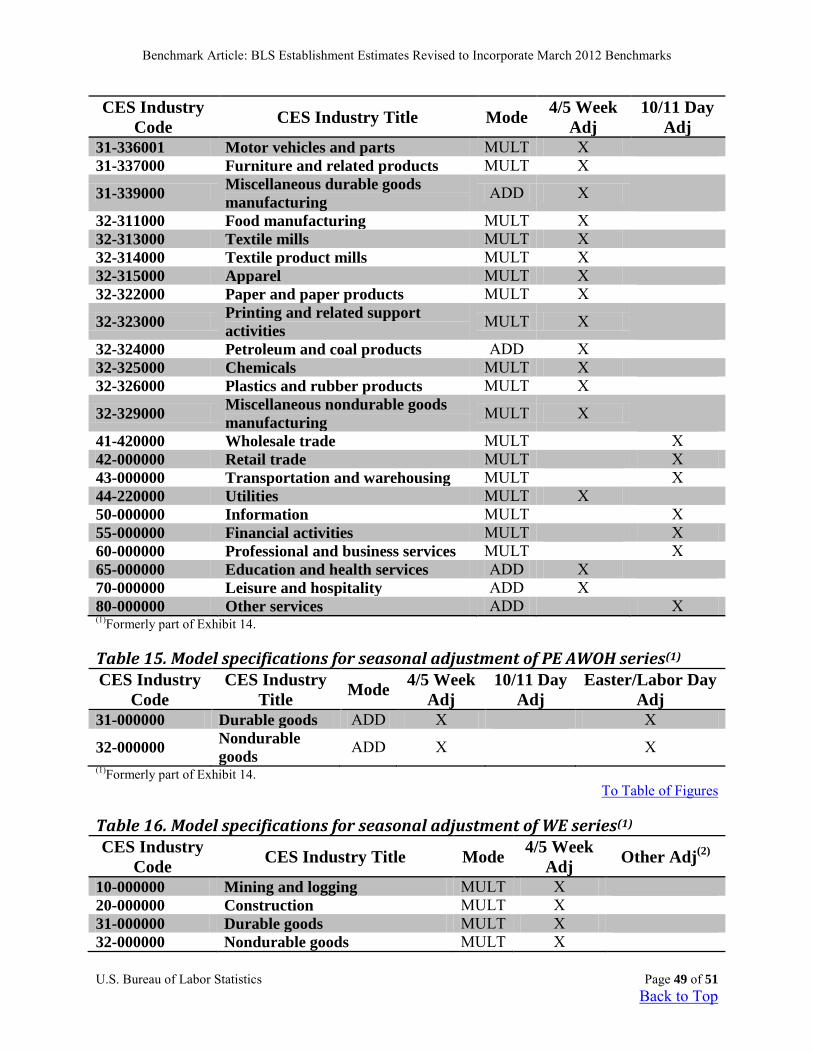
Benchmark Article: BLS Establishment Estimates Revised to Incorporate March 2012 Benchmarks
U.S. Bureau of Labor Statistics Page 49 of 51
Back to Top
CES Industry Code CES Industry Title Mode 4/5 Week
Adj 10/11 Day
Adj 31-336001 Motor vehicles and parts MULT X 31-337000 Furniture and related products MULT X 31-339000 Miscellaneous durable goods
manufacturing ADD X 32-311000 Food manufacturing MULT X 32-313000 Textile mills MULT X 32-314000 Textile product mills MULT X 32-315000 Apparel MULT X 32-322000 Paper and paper products MULT X 32-323000 Printing and related support
activities MULT X 32-324000 Petroleum and coal products ADD X 32-325000 Chemicals MULT X 32-326000 Plastics and rubber products MULT X 32-329000 Miscellaneous nondurable goods
manufacturing MULT X 41-420000 Wholesale trade MULT X 42-000000 Retail trade MULT X 43-000000 Transportation and warehousing MULT X 44-220000 Utilities MULT X 50-000000 Information MULT X 55-000000 Financial activities MULT X 60-000000 Professional and business services MULT X 65-000000 Education and health services ADD X 70-000000 Leisure and hospitality ADD X 80-000000 Other services ADD X (1)Formerly part of Exhibit 14.
Table 15. Model specifications for seasonal adjustment of PE AWOH series(1) CES Industry
Code CES Industry
Title Mode 4/5 Week Adj
10/11 Day Adj
Easter/Labor Day Adj
31-000000 Durable goods ADD X X
32-000000 Nondurable goods ADD X X
(1)Formerly part of Exhibit 14. To Table of Figures
Table 16. Model specifications for seasonal adjustment of WE series(1) CES Industry
Code CES Industry Title Mode 4/5 Week Adj Other Adj(2)
10-000000 Mining and logging MULT X 20-000000 Construction MULT X 31-000000 Durable goods MULT X 32-000000 Nondurable goods MULT X
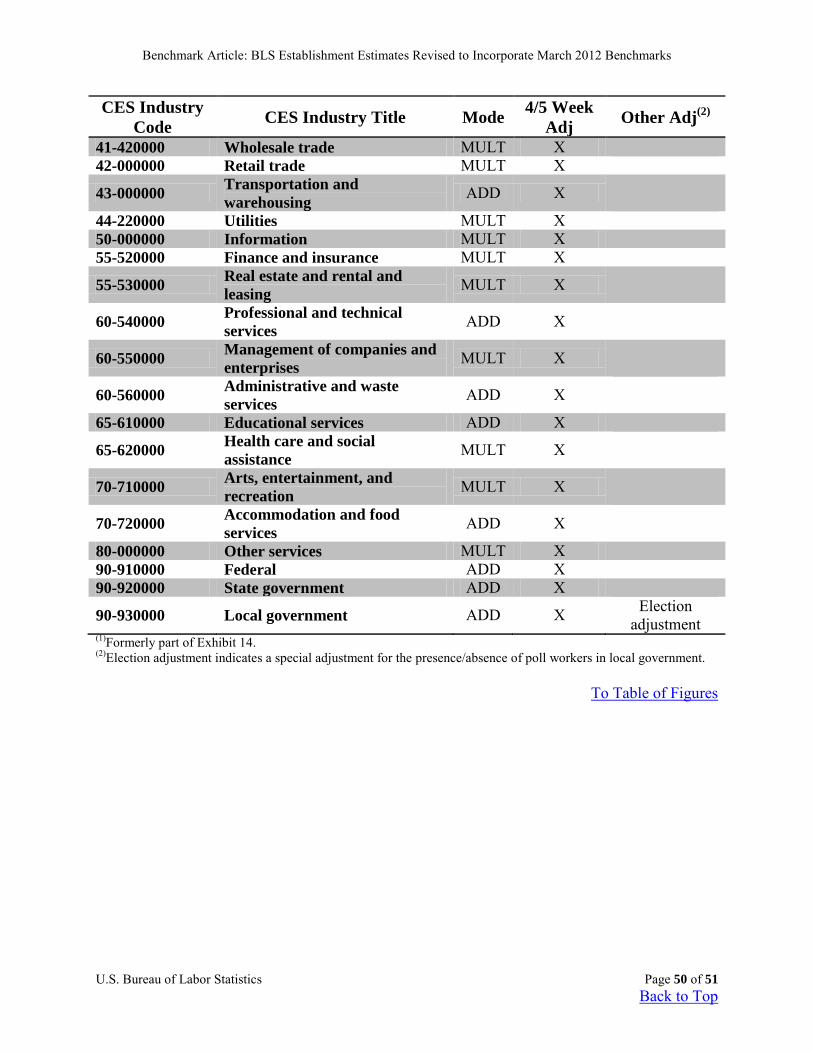
Benchmark Article: BLS Establishment Estimates Revised to Incorporate March 2012 Benchmarks
U.S. Bureau of Labor Statistics Page 50 of 51
Back to Top
CES Industry Code CES Industry Title Mode 4/5 Week
Adj Other Adj(2)
41-420000 Wholesale trade MULT X 42-000000 Retail trade MULT X 43-000000 Transportation and
warehousing ADD X 44-220000 Utilities MULT X 50-000000 Information MULT X 55-520000 Finance and insurance MULT X 55-530000 Real estate and rental and
leasing MULT X
60-540000 Professional and technical services ADD X
60-550000 Management of companies and enterprises MULT X
60-560000 Administrative and waste services ADD X
65-610000 Educational services ADD X 65-620000 Health care and social
assistance MULT X
70-710000 Arts, entertainment, and recreation MULT X
70-720000 Accommodation and food services ADD X
80-000000 Other services MULT X 90-910000 Federal ADD X 90-920000 State government ADD X 90-930000 Local government ADD X Election
adjustment (1)Formerly part of Exhibit 14. (2)Election adjustment indicates a special adjustment for the presence/absence of poll workers in local government.
To Table of Figures
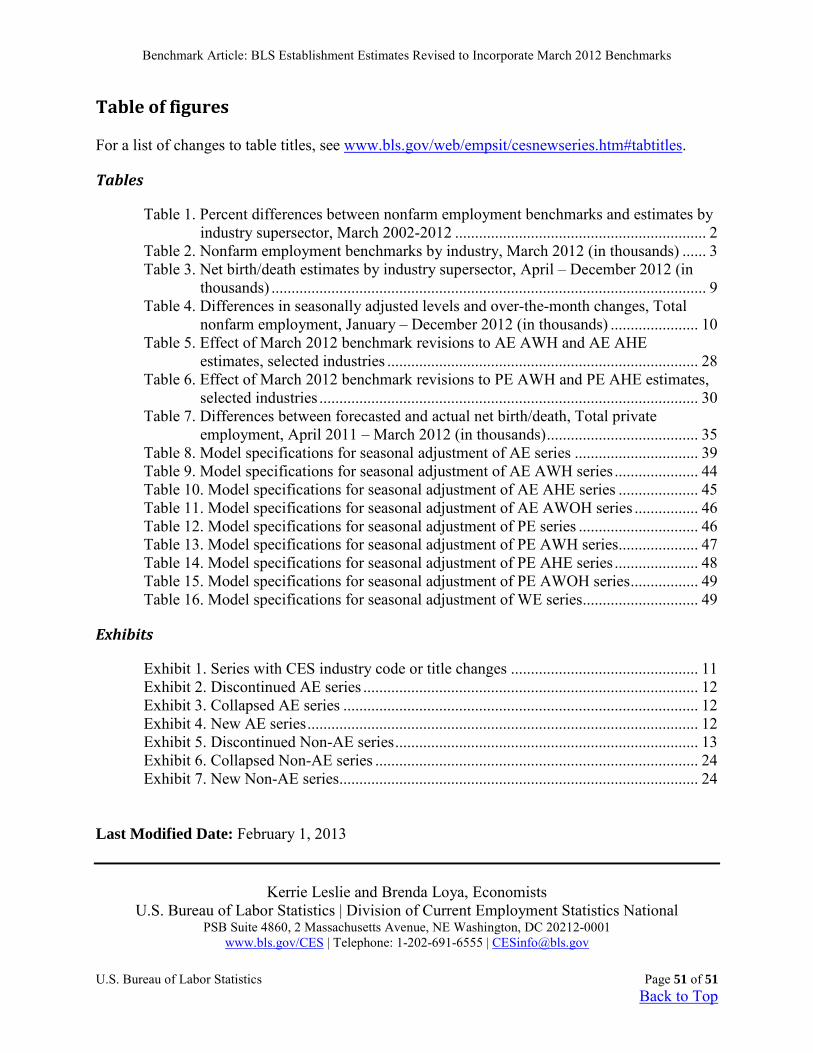
Benchmark Article: BLS Establishment Estimates Revised to Incorporate March 2012 Benchmarks
U.S. Bureau of Labor Statistics Page 51 of 51
Back to Top
Table of figures
For a list of changes to table titles, see www.bls.gov/web/empsit/cesnewseries.htm#tabtitles.
Tables
Table 1. Percent differences between nonfarm employment benchmarks and estimates by industry supersector, March 2002-2012 ............................................................... 2
Table 2. Nonfarm employment benchmarks by industry, March 2012 (in thousands) ...... 3 Table 3. Net birth/death estimates by industry supersector, April – December 2012 (in
thousands) ............................................................................................................. 9 Table 4. Differences in seasonally adjusted levels and over-the-month changes, Total
nonfarm employment, January – December 2012 (in thousands) ...................... 10 Table 5. Effect of March 2012 benchmark revisions to AE AWH and AE AHE
estimates, selected industries .............................................................................. 28 Table 6. Effect of March 2012 benchmark revisions to PE AWH and PE AHE estimates,
selected industries ............................................................................................... 30 Table 7. Differences between forecasted and actual net birth/death, Total private
employment, April 2011 – March 2012 (in thousands) ...................................... 35 Table 8. Model specifications for seasonal adjustment of AE series ............................... 39 Table 9. Model specifications for seasonal adjustment of AE AWH series ..................... 44 Table 10. Model specifications for seasonal adjustment of AE AHE series .................... 45 Table 11. Model specifications for seasonal adjustment of AE AWOH series ................ 46 Table 12. Model specifications for seasonal adjustment of PE series .............................. 46 Table 13. Model specifications for seasonal adjustment of PE AWH series.................... 47 Table 14. Model specifications for seasonal adjustment of PE AHE series ..................... 48 Table 15. Model specifications for seasonal adjustment of PE AWOH series ................. 49 Table 16. Model specifications for seasonal adjustment of WE series ............................. 49
Exhibits
Exhibit 1. Series with CES industry code or title changes ............................................... 11 Exhibit 2. Discontinued AE series .................................................................................... 12 Exhibit 3. Collapsed AE series ......................................................................................... 12 Exhibit 4. New AE series .................................................................................................. 12 Exhibit 5. Discontinued Non-AE series ............................................................................ 13 Exhibit 6. Collapsed Non-AE series ................................................................................. 24 Exhibit 7. New Non-AE series.......................................................................................... 24
Last Modified Date: February 1, 2013
Kerrie Leslie and Brenda Loya, Economists
U.S. Bureau of Labor Statistics | Division of Current Employment Statistics National PSB Suite 4860, 2 Massachusetts Avenue, NE Washington, DC 20212-0001
www.bls.gov/CES | Telephone: 1-202-691-6555 | [email protected]