current developments and future expansions of...
TRANSCRIPT

CURRENT DEVELOPMENTS AND
FUTURE EXPANSIONS OF
TRADE IN VALUE-ADDED PROJECT
IN OECD
Norihiko YAMANO
OECD Directorate for Science, Technology and Innovation Primer Foro sobre Model de Insumo Producto aplicado a la Economia Costarricense San Jose, Costa Rica 27-28 November 2014
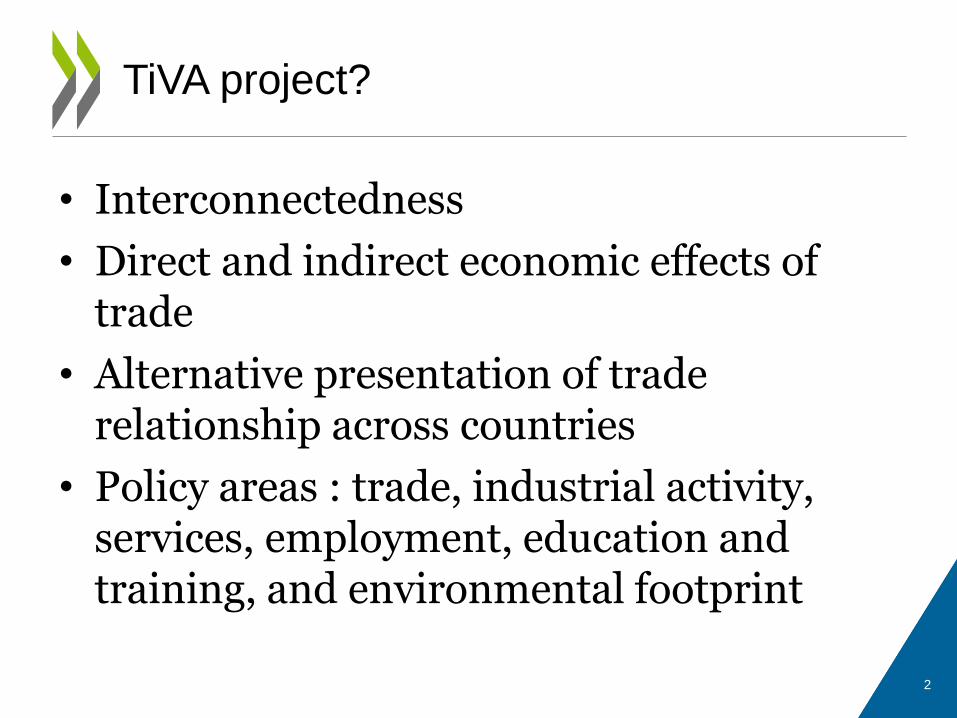
• Interconnectedness
• Direct and indirect economic effects of trade
• Alternative presentation of trade relationship across countries
• Policy areas : trade, industrial activity, services, employment, education and training, and environmental footprint
TiVA project?
2
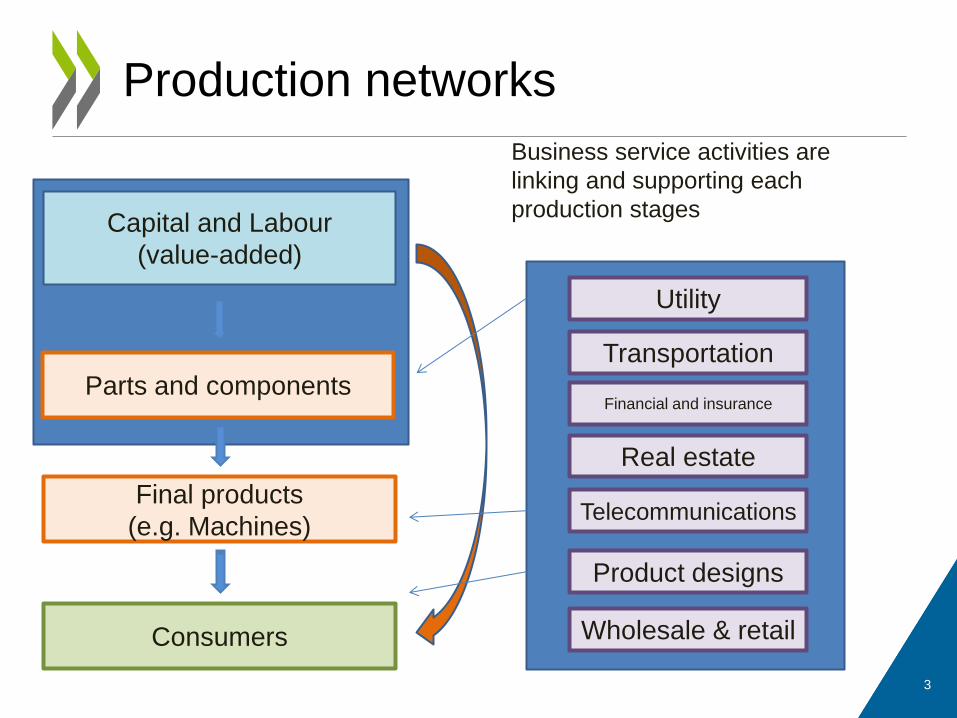
Production networks
Capital and Labour
(value-added)
Parts and components
Final products
(e.g. Machines)
Consumers
Business service activities are
linking and supporting each
production stages
Utility
Financial and insurance
Wholesale & retail
Telecommunications
Product designs
Transportation
Real estate
3
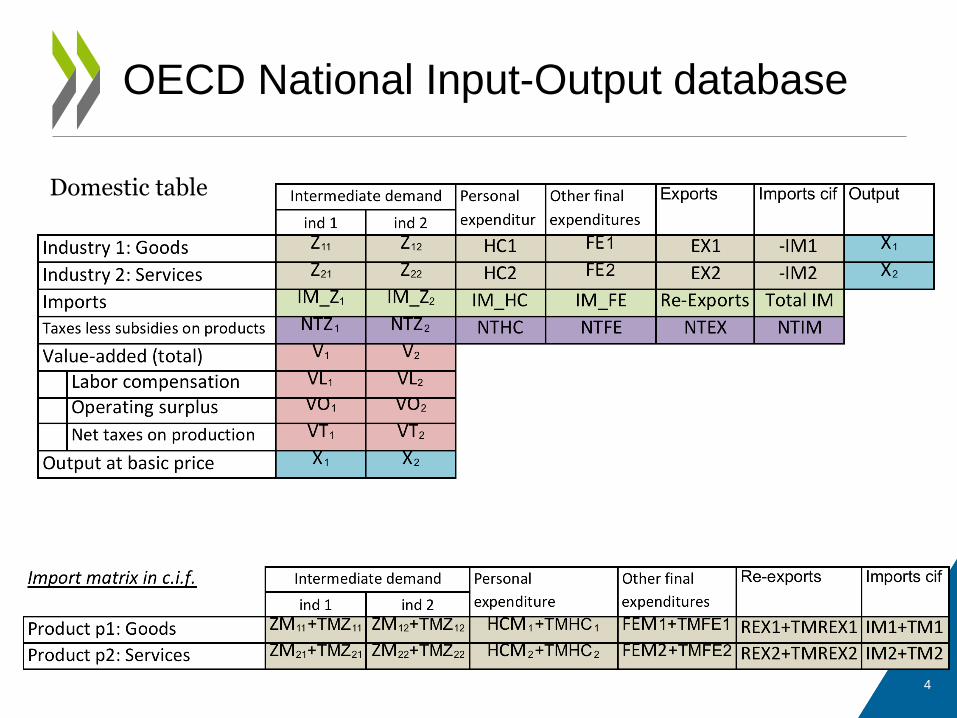
OECD National Input-Output database
Domestic table
4
5 / 57
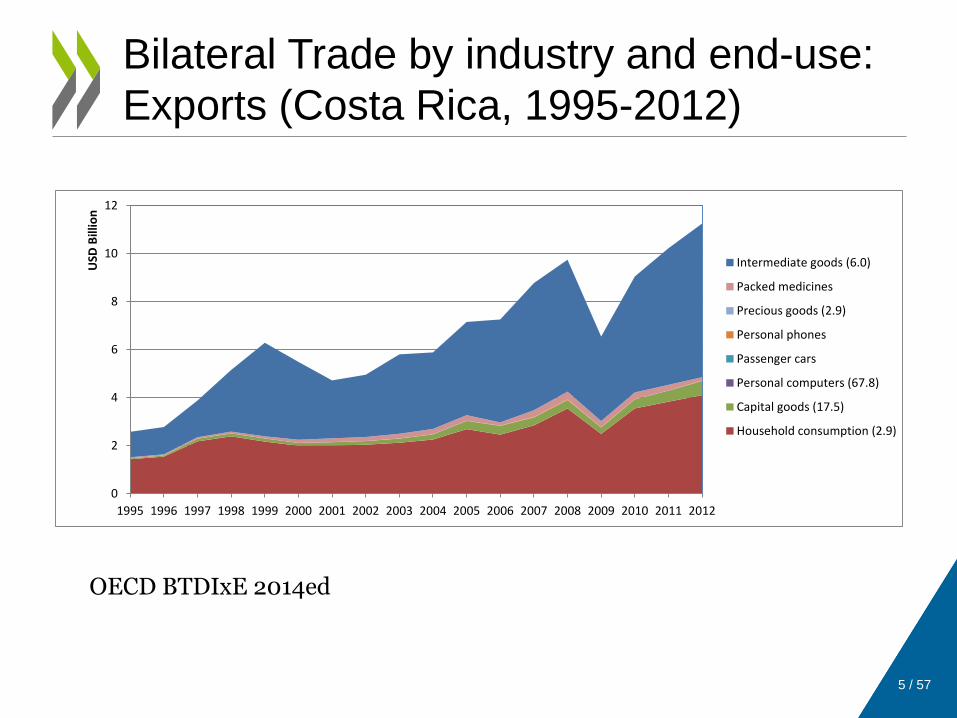
Bilateral Trade by industry and end-use:
Exports (Costa Rica, 1995-2012)
0
2
4
6
8
10
12
1995 1996 1997 1998 1999 2000 2001 2002 2003 2004 2005 2006 2007 2008 2009 2010 2011 2012
USD
Bill
ion
Intermediate goods (6.0)
Packed medicines
Precious goods (2.9)
Personal phones
Passenger cars
Personal computers (67.8)
Capital goods (17.5)
Household consumption (2.9)
OECD BTDIxE 2014ed
6 / 57
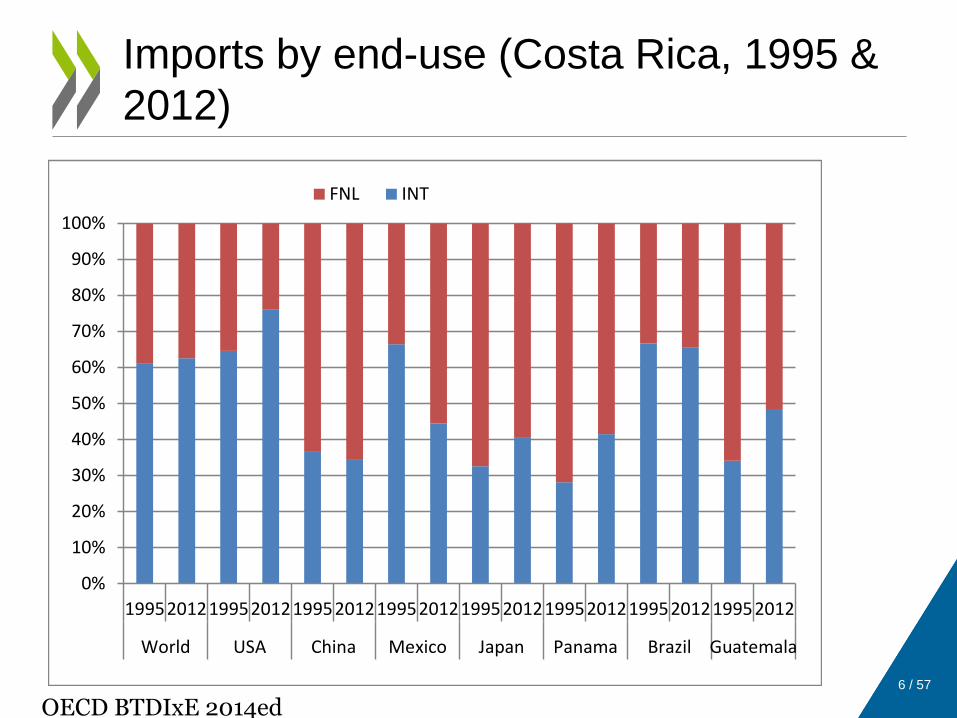
Imports by end-use (Costa Rica, 1995 &
2012)
0%
10%
20%
30%
40%
50%
60%
70%
80%
90%
100%
1995201219952012199520121995201219952012199520121995201219952012
World USA China Mexico Japan Panama Brazil Guatemala
FNL INT
OECD BTDIxE 2014ed
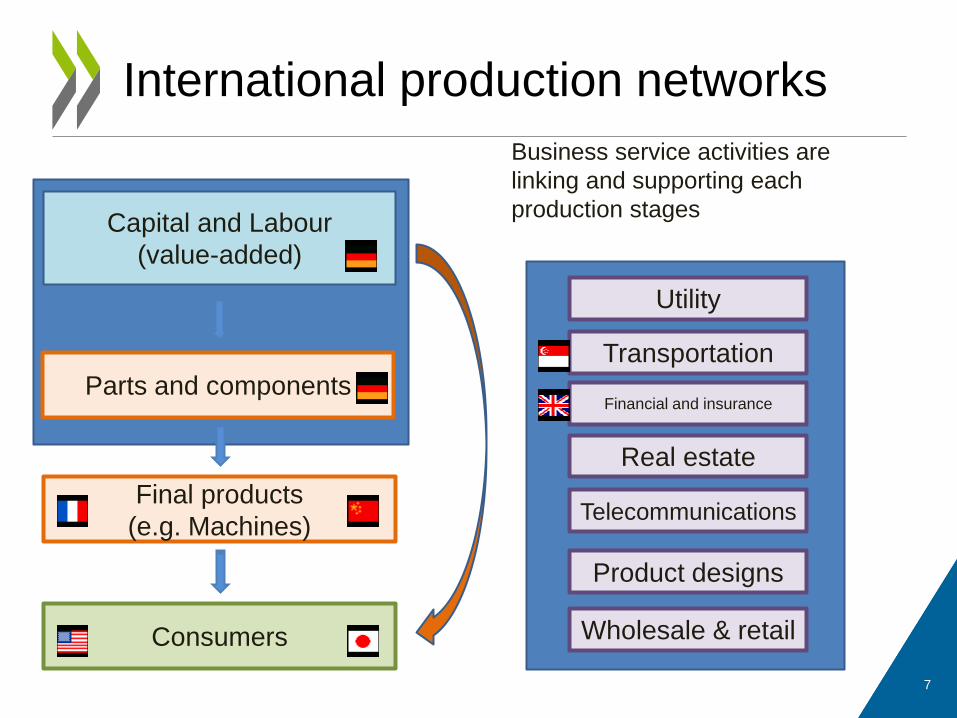
International production networks
Capital and Labour
(value-added)
Parts and components
Final products
(e.g. Machines)
Consumers
Business service activities are
linking and supporting each
production stages
Utility
Financial and insurance
Wholesale & retail
Telecommunications
Product designs
Transportation
Real estate
7
8 / 57
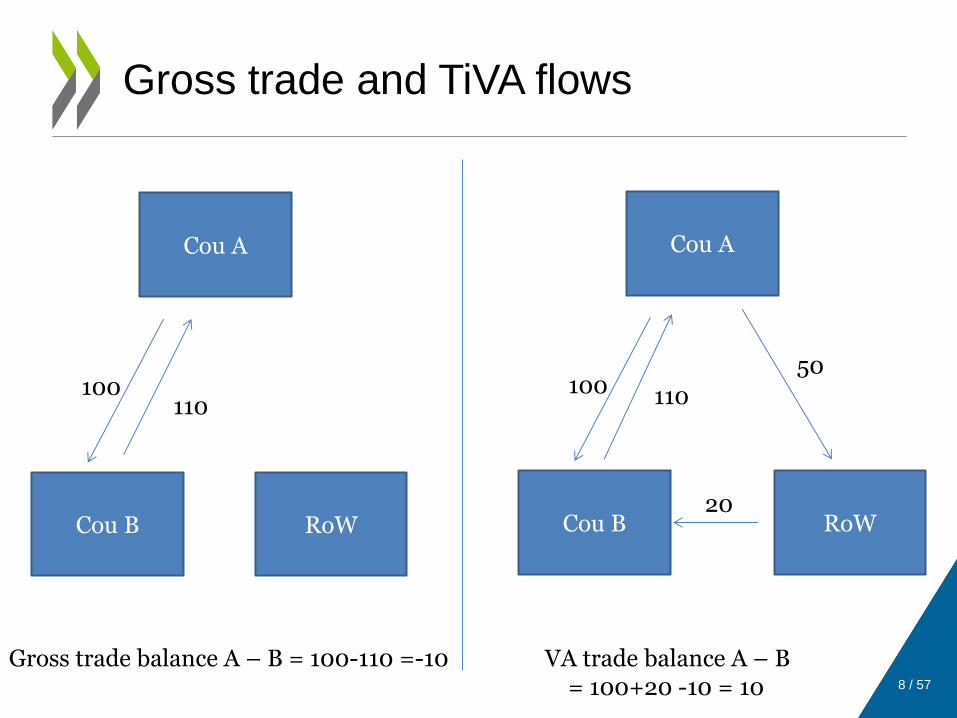
Gross trade and TiVA flows
Cou A
Cou B RoW
100 110
Cou A
Cou B RoW
100 110
50
20
Gross trade balance A – B = 100-110 =-10 VA trade balance A – B = 100+20 -10 = 10
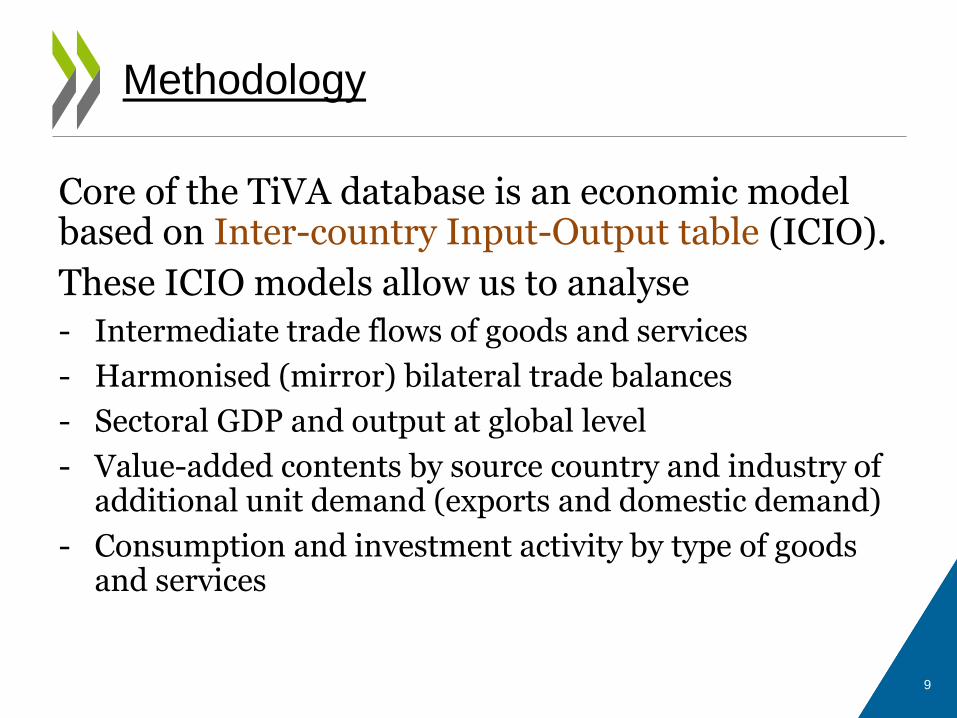
Core of the TiVA database is an economic model based on Inter-country Input-Output table (ICIO).
These ICIO models allow us to analyse
- Intermediate trade flows of goods and services
- Harmonised (mirror) bilateral trade balances
- Sectoral GDP and output at global level
- Value-added contents by source country and industry of additional unit demand (exports and domestic demand)
- Consumption and investment activity by type of goods and services
Methodology
9
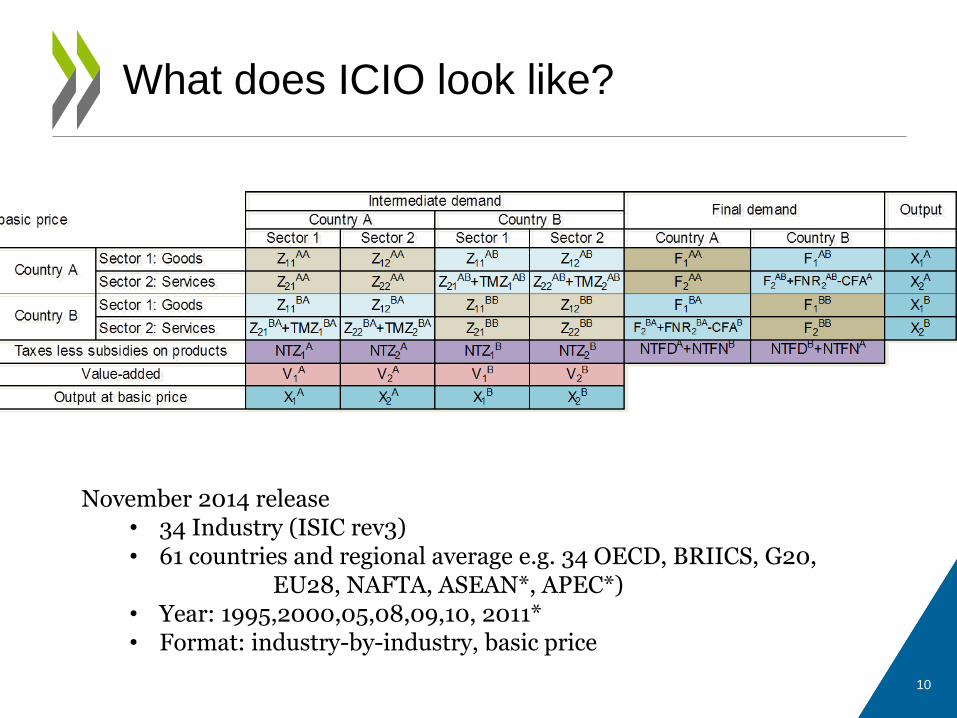
What does ICIO look like?
10
November 2014 release • 34 Industry (ISIC rev3) • 61 countries and regional average e.g. 34 OECD, BRIICS, G20, EU28, NAFTA, ASEAN*, APEC*) • Year: 1995,2000,05,08,09,10, 2011* • Format: industry-by-industry, basic price
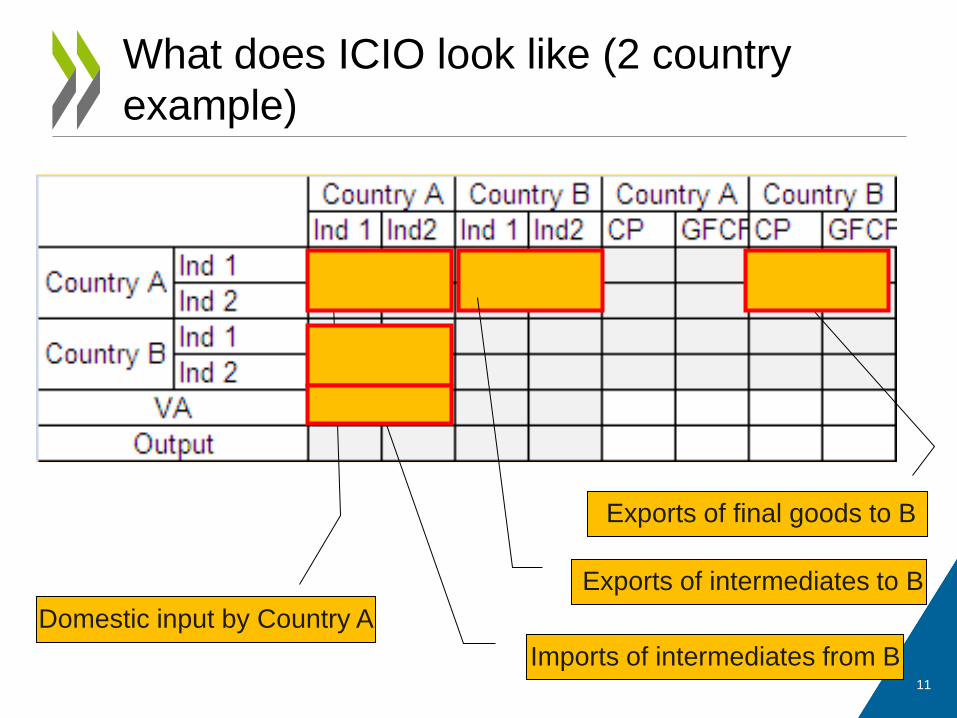
Domestic input by Country A
Imports of intermediates from B
Exports of final goods to B
Exports of intermediates to B
What does ICIO look like (2 country
example)
11
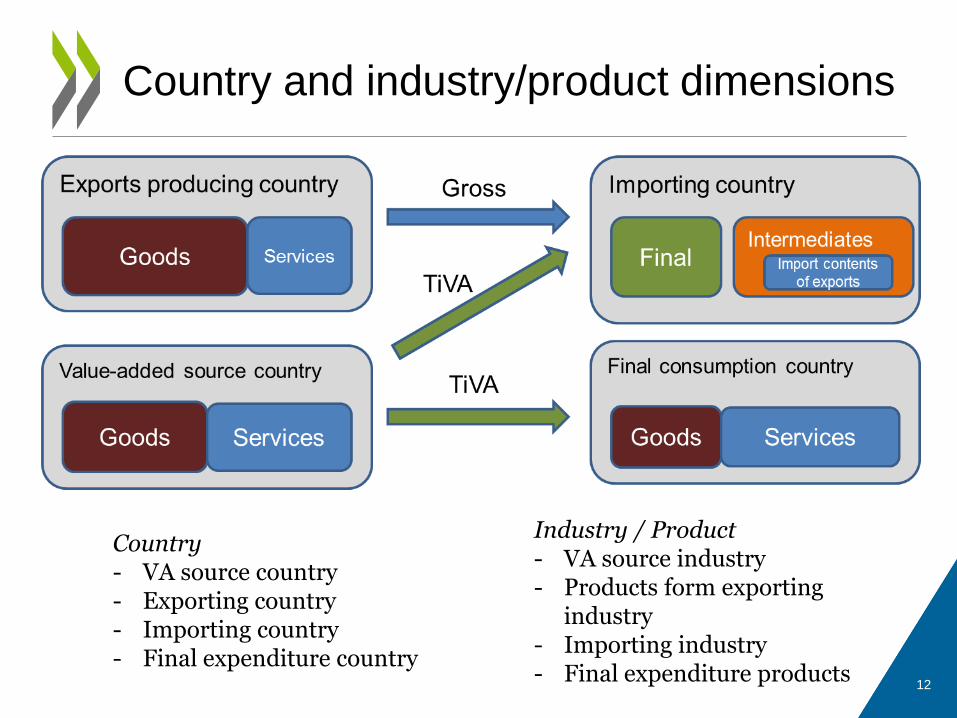
Country and industry/product dimensions
Country - VA source country - Exporting country - Importing country - Final expenditure country
Industry / Product - VA source industry - Products form exporting
industry - Importing industry - Final expenditure products
12
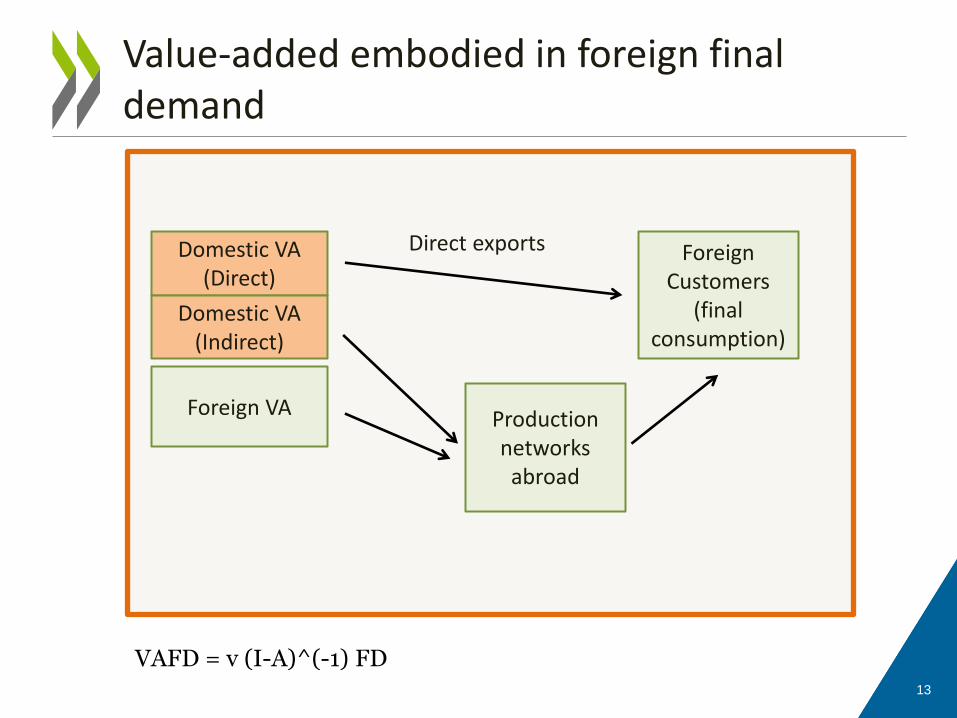
Value-added embodied in foreign final demand
Domestic VA (Direct)
Foreign VA
Direct exports Foreign Customers
(final consumption)
Domestic VA (Indirect)
Production networks
abroad
13
VAFD = v (I-A)^(-1) FD
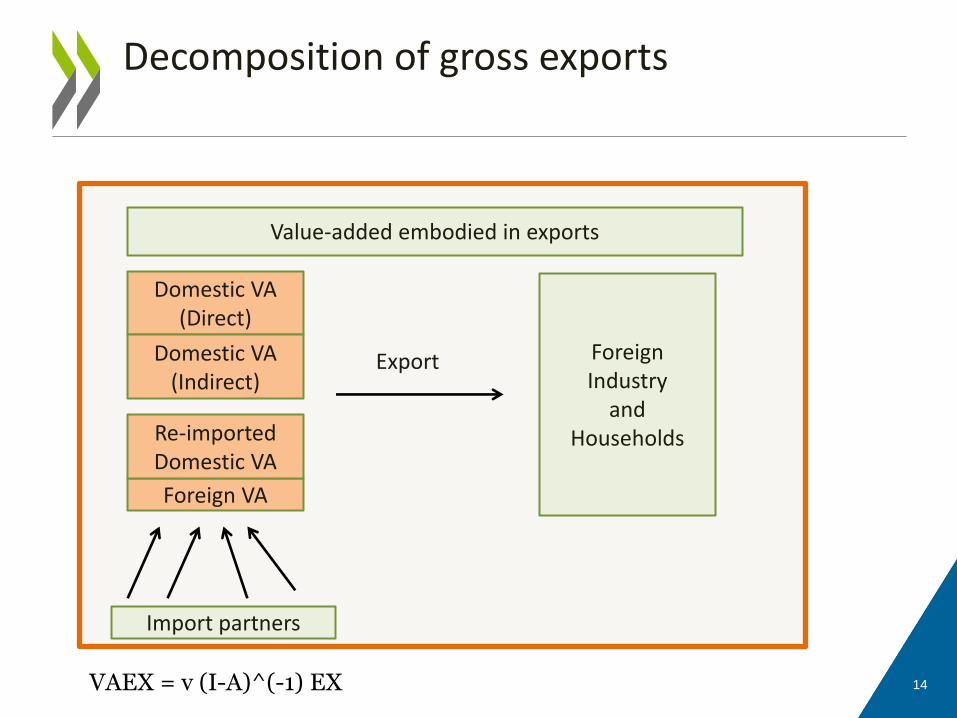
Value-added embodied in exports
Domestic VA (Direct)
Domestic VA (Indirect)
Foreign VA
Re-imported Domestic VA
Export Foreign Industry
and Households
Import partners
14
Decomposition of gross exports
VAEX = v (I-A)^(-1) EX
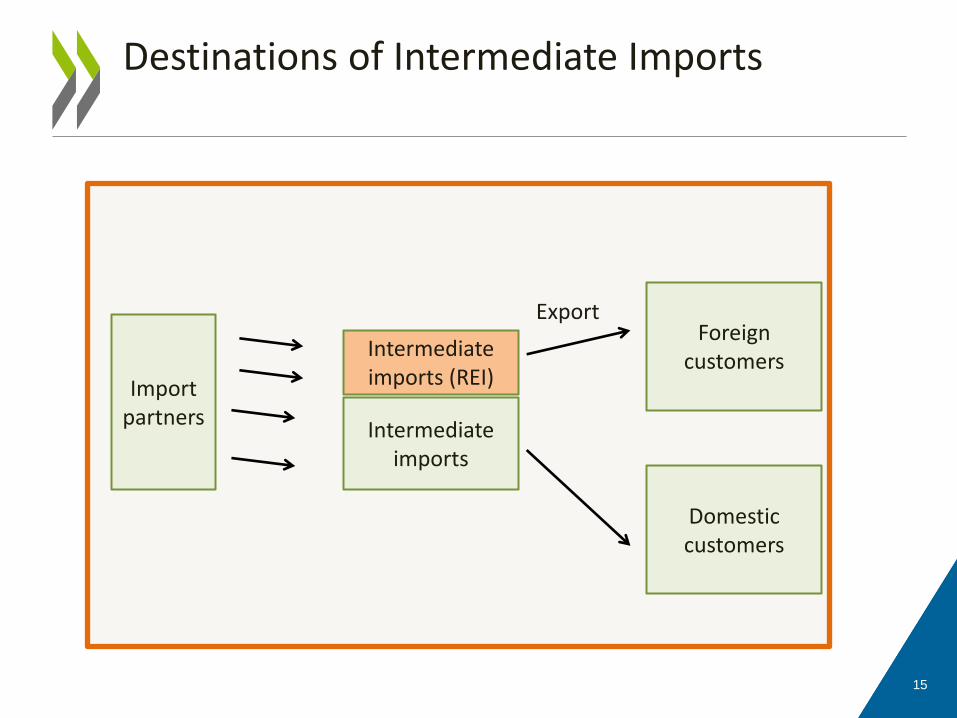
Intermediate imports (REI)
Intermediate imports
Export Foreign
customers Import
partners
Domestic customers
15
Destinations of Intermediate Imports
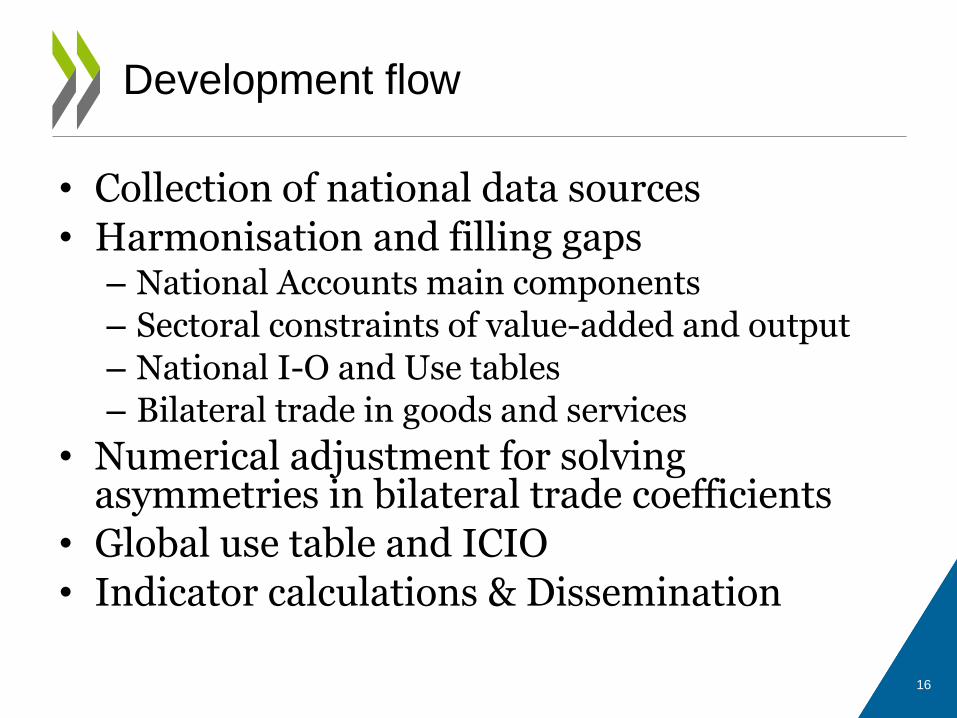
• Collection of national data sources
• Harmonisation and filling gaps – National Accounts main components
– Sectoral constraints of value-added and output
– National I-O and Use tables
– Bilateral trade in goods and services
• Numerical adjustment for solving asymmetries in bilateral trade coefficients
• Global use table and ICIO
• Indicator calculations & Dissemination
Development flow
16
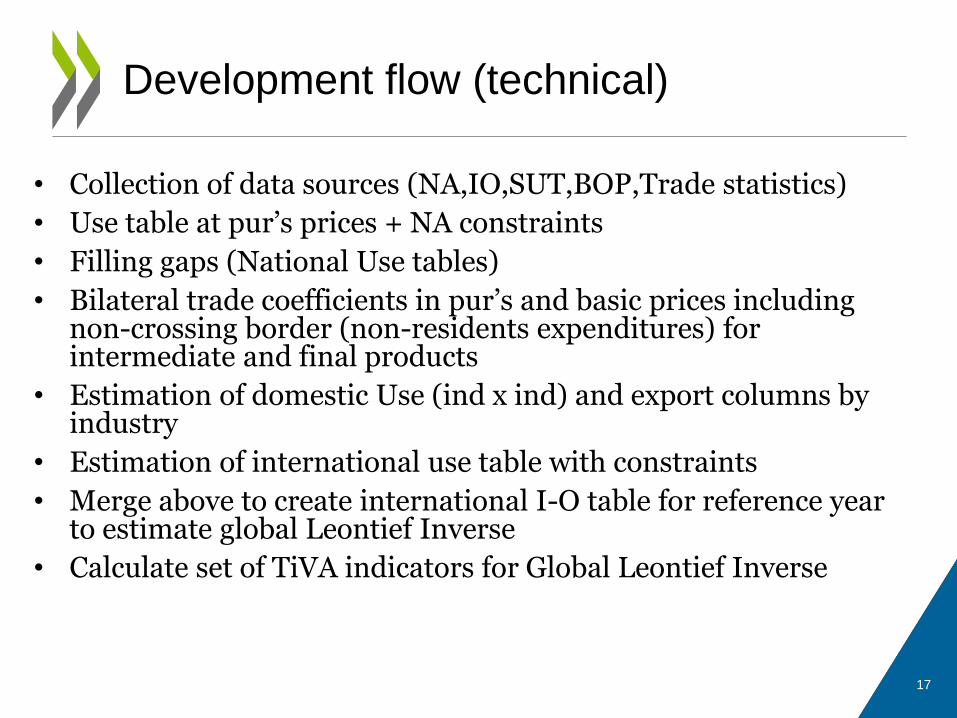
• Collection of data sources (NA,IO,SUT,BOP,Trade statistics)
• Use table at pur’s prices + NA constraints
• Filling gaps (National Use tables)
• Bilateral trade coefficients in pur’s and basic prices including non-crossing border (non-residents expenditures) for intermediate and final products
• Estimation of domestic Use (ind x ind) and export columns by industry
• Estimation of international use table with constraints
• Merge above to create international I-O table for reference year to estimate global Leontief Inverse
• Calculate set of TiVA indicators for Global Leontief Inverse
Development flow (technical)
17
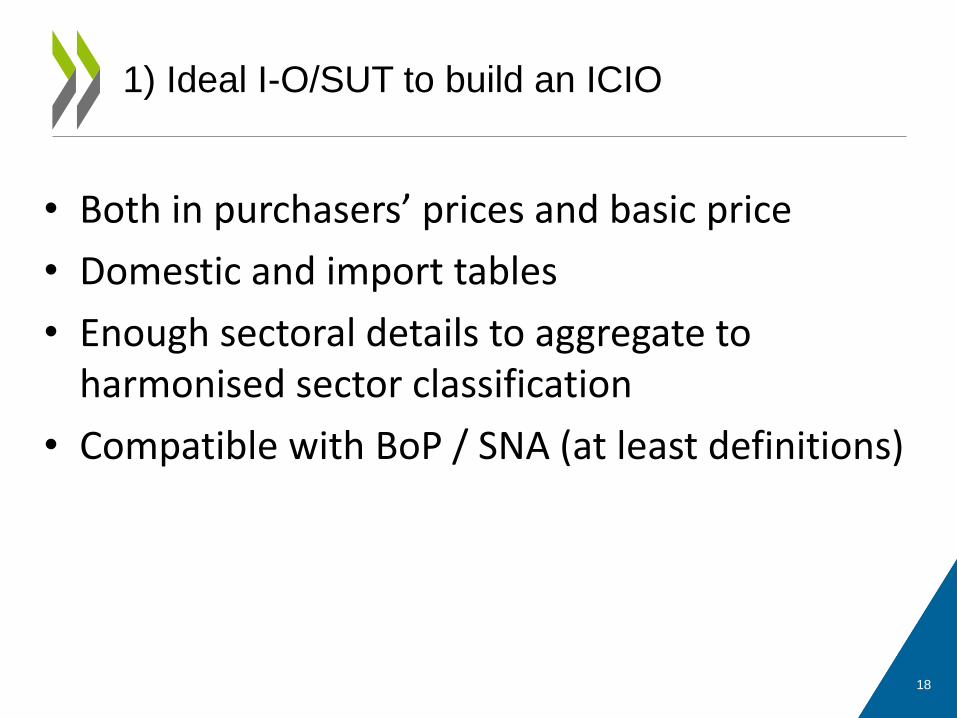
• Both in purchasers’ prices and basic price
• Domestic and import tables
• Enough sectoral details to aggregate to harmonised sector classification
• Compatible with BoP / SNA (at least definitions)
1) Ideal I-O/SUT to build an ICIO
18
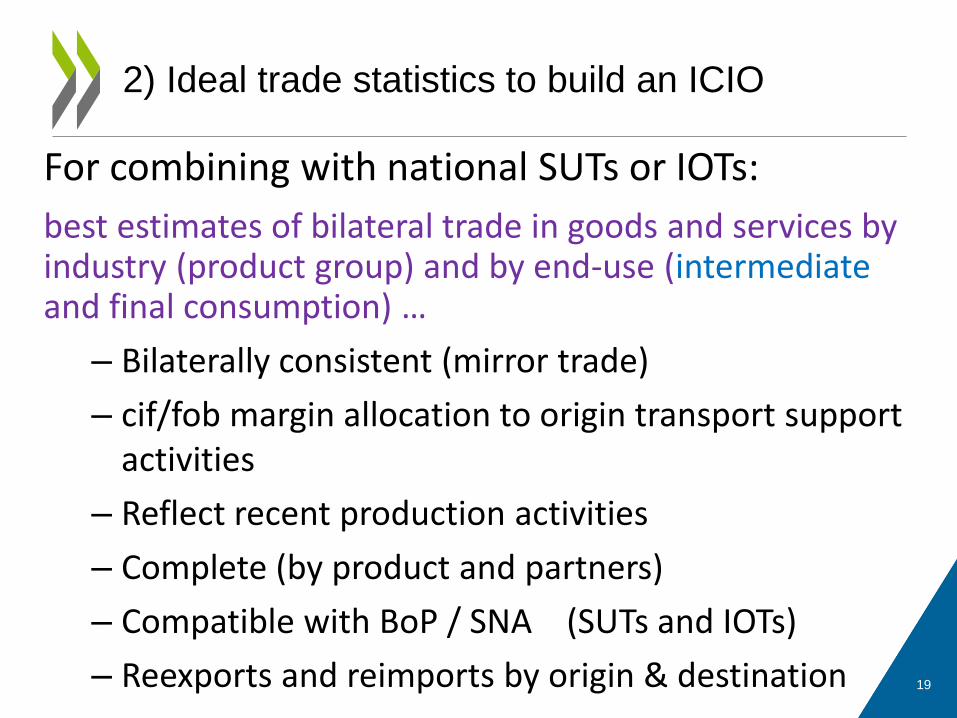
For combining with national SUTs or IOTs:
best estimates of bilateral trade in goods and services by industry (product group) and by end-use (intermediate and final consumption) …
– Bilaterally consistent (mirror trade)
– cif/fob margin allocation to origin transport support activities
– Reflect recent production activities
– Complete (by product and partners)
– Compatible with BoP / SNA (SUTs and IOTs)
– Reexports and reimports by origin & destination
2) Ideal trade statistics to build an ICIO
19
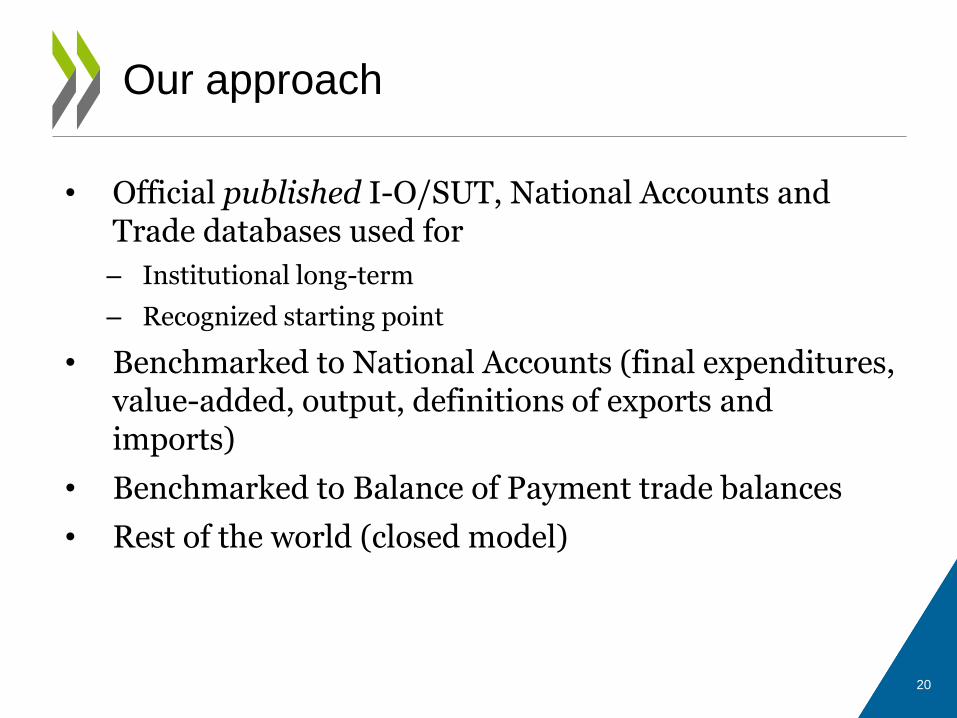
• Official published I-O/SUT, National Accounts and Trade databases used for
– Institutional long-term
– Recognized starting point
• Benchmarked to National Accounts (final expenditures, value-added, output, definitions of exports and imports)
• Benchmarked to Balance of Payment trade balances
• Rest of the world (closed model)
Our approach
20
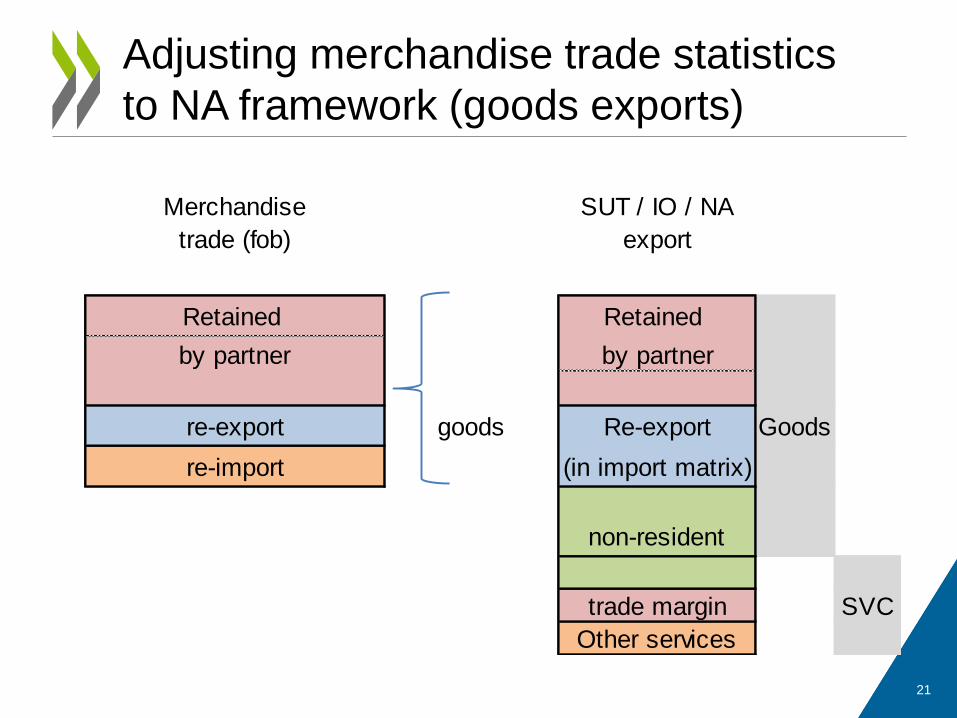
Adjusting merchandise trade statistics
to NA framework (goods exports)
Merchandise SUT / IO / NA
trade (fob) export
Retained Retained
by partner by partner
re-export goods Re-export Goods
re-import (in import matrix)
non-resident
trade margin SVC
Other services
21
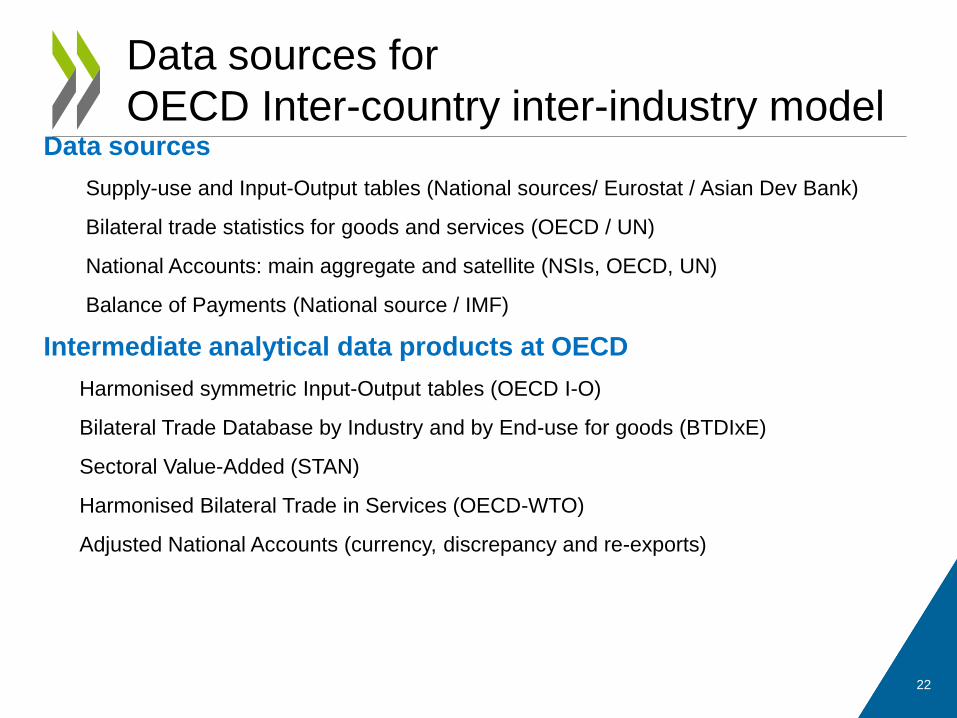
Data sources
Supply-use and Input-Output tables (National sources/ Eurostat / Asian Dev Bank)
Bilateral trade statistics for goods and services (OECD / UN)
National Accounts: main aggregate and satellite (NSIs, OECD, UN)
Balance of Payments (National source / IMF)
Intermediate analytical data products at OECD
Harmonised symmetric Input-Output tables (OECD I-O)
Bilateral Trade Database by Industry and by End-use for goods (BTDIxE)
Sectoral Value-Added (STAN)
Harmonised Bilateral Trade in Services (OECD-WTO)
Adjusted National Accounts (currency, discrepancy and re-exports)
Data sources for
OECD Inter-country inter-industry model
22
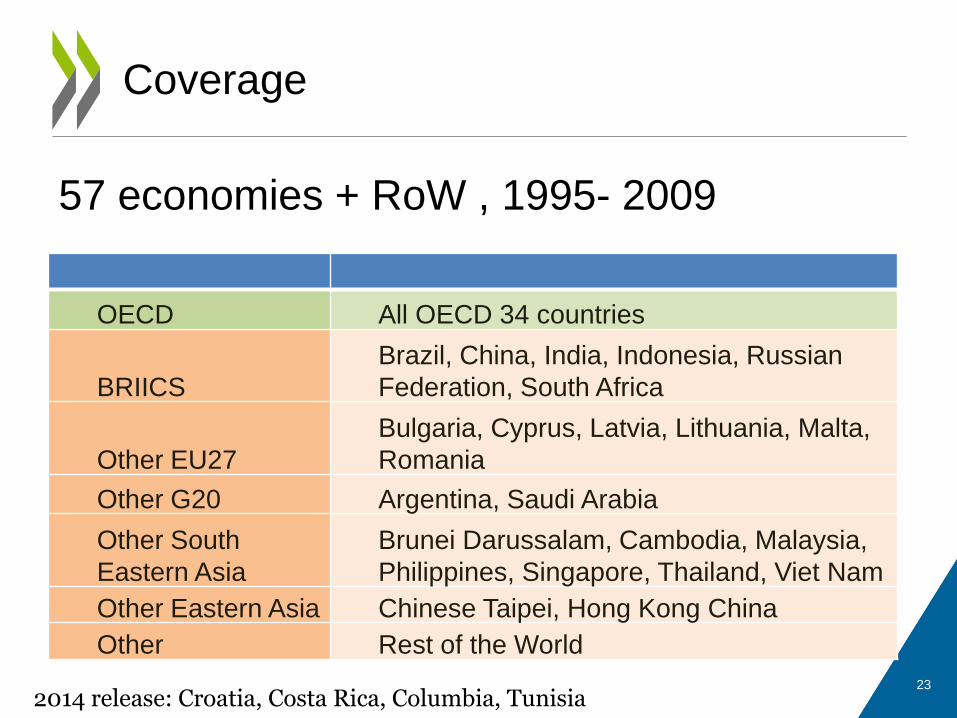
OECD All OECD 34 countries
BRIICS
Brazil, China, India, Indonesia, Russian
Federation, South Africa
Other EU27
Bulgaria, Cyprus, Latvia, Lithuania, Malta,
Romania
Other G20 Argentina, Saudi Arabia
Other South
Eastern Asia
Brunei Darussalam, Cambodia, Malaysia,
Philippines, Singapore, Thailand, Viet Nam
Other Eastern Asia Chinese Taipei, Hong Kong China
Other Rest of the World
Coverage
57 economies + RoW , 1995- 2009
2014 release: Croatia, Costa Rica, Columbia, Tunisia 23
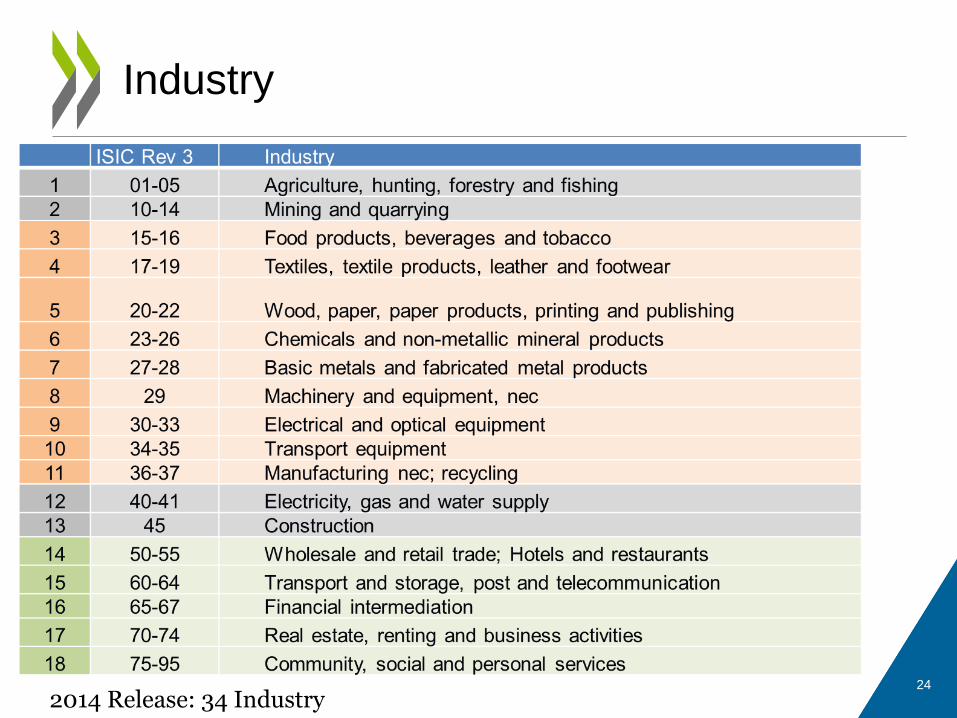
Industry
2014 Release: 34 Industry 24
• Exports require more imports
• Services matter (business services)
• New trade patterns emerge
• Global value chains v. Regional production chains
Results
25
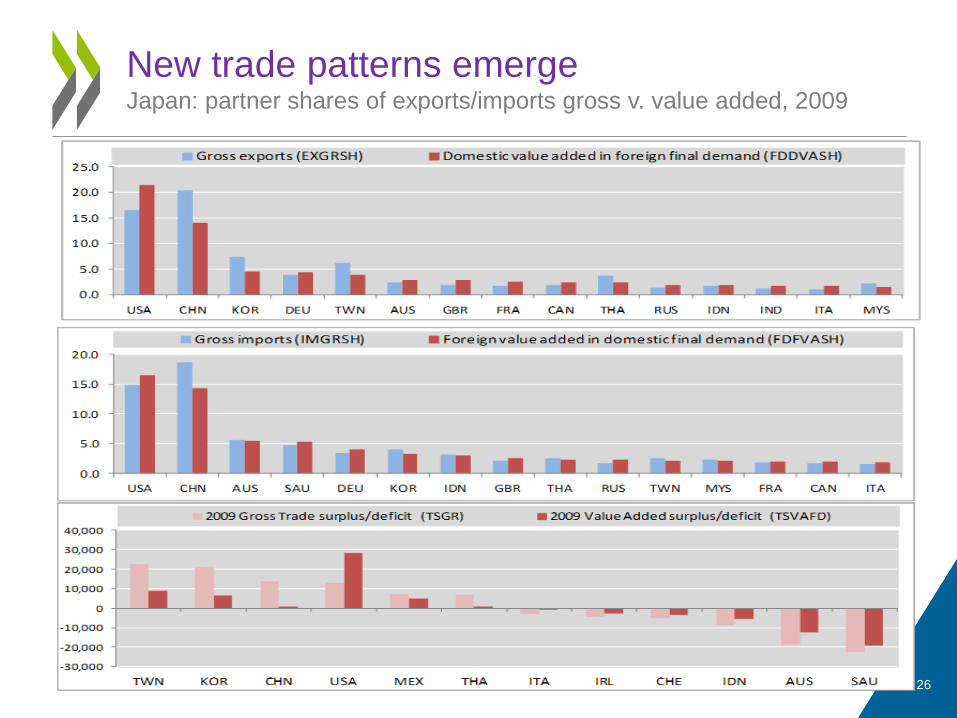
New trade patterns emerge Japan: partner shares of exports/imports gross v. value added, 2009
26
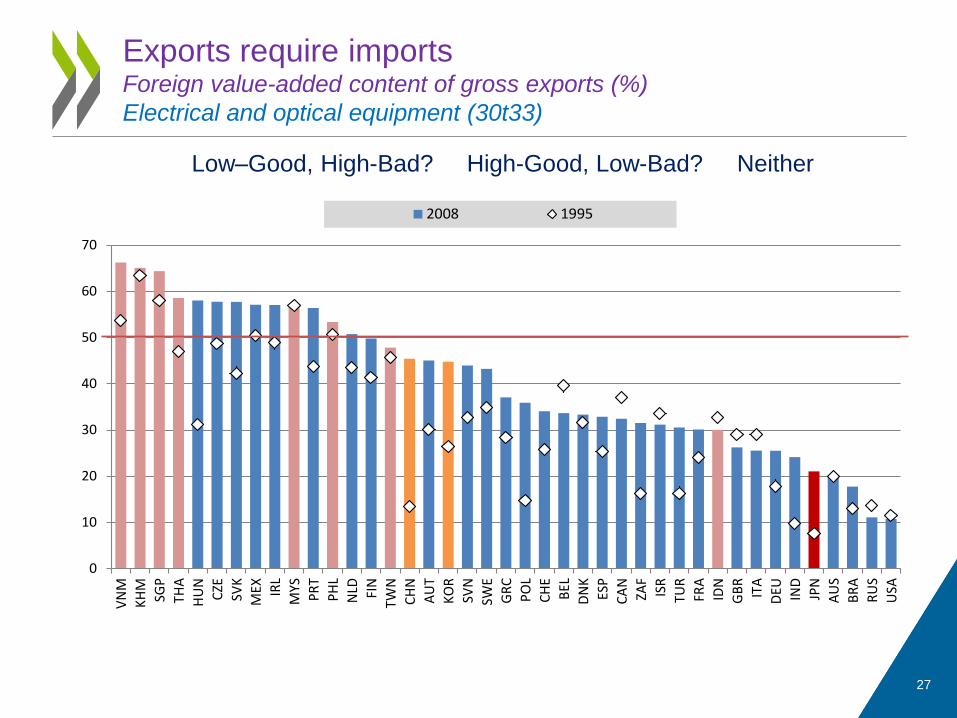
Exports require imports Foreign value-added content of gross exports (%)
Electrical and optical equipment (30t33)
Low–Good, High-Bad? High-Good, Low-Bad? Neither
0
10
20
30
40
50
60
70
VN
M
KH
M
SGP
THA
HU
N
CZE
SVK
MEX IR
L
MYS
PR
T
PH
L
NLD FIN
TWN
CH
N
AU
T
KO
R
SVN
SWE
GR
C
PO
L
CH
E
BEL
DN
K
ESP
CA
N
ZAF
ISR
TUR
FRA
IDN
GB
R
ITA
DEU IN
D
JPN
AU
S
BR
A
RU
S
USA
2008 1995
27
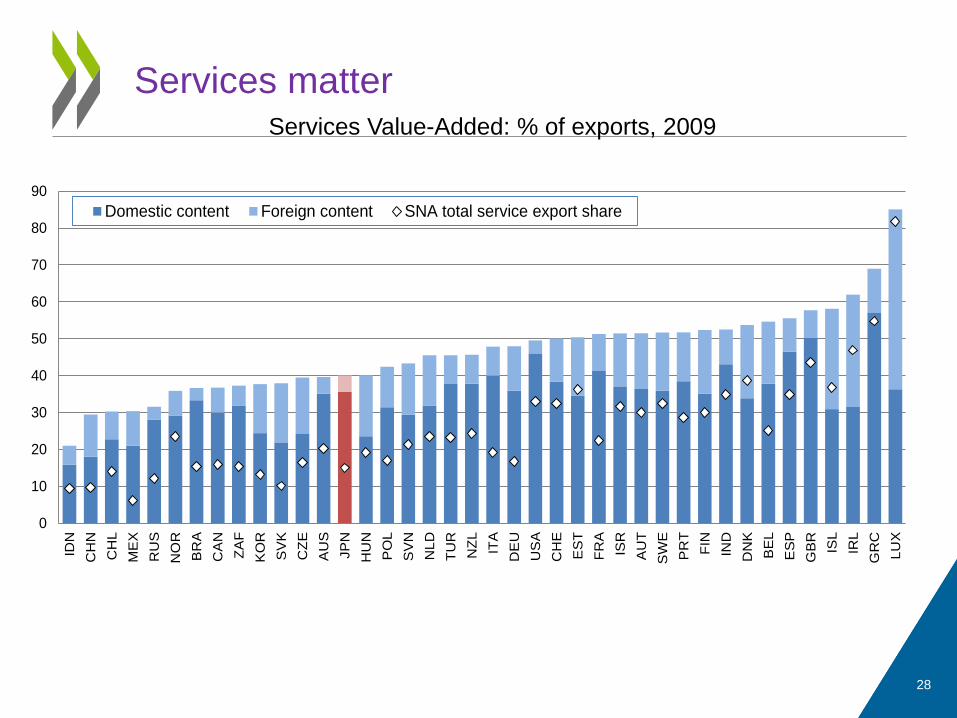
Services matter Services Value-Added: % of exports, 2009
0
10
20
30
40
50
60
70
80
90
IDN
CH
N
CH
L
ME
X
RU
S
NO
R
BR
A
CA
N
ZA
F
KO
R
SV
K
CZ
E
AU
S
JP
N
HU
N
PO
L
SV
N
NL
D
TU
R
NZ
L
ITA
DE
U
US
A
CH
E
ES
T
FR
A
ISR
AU
T
SW
E
PR
T
FIN
IND
DN
K
BE
L
ES
P
GB
R
ISL
IRL
GR
C
LU
X
Domestic content Foreign content SNA total service export share
28
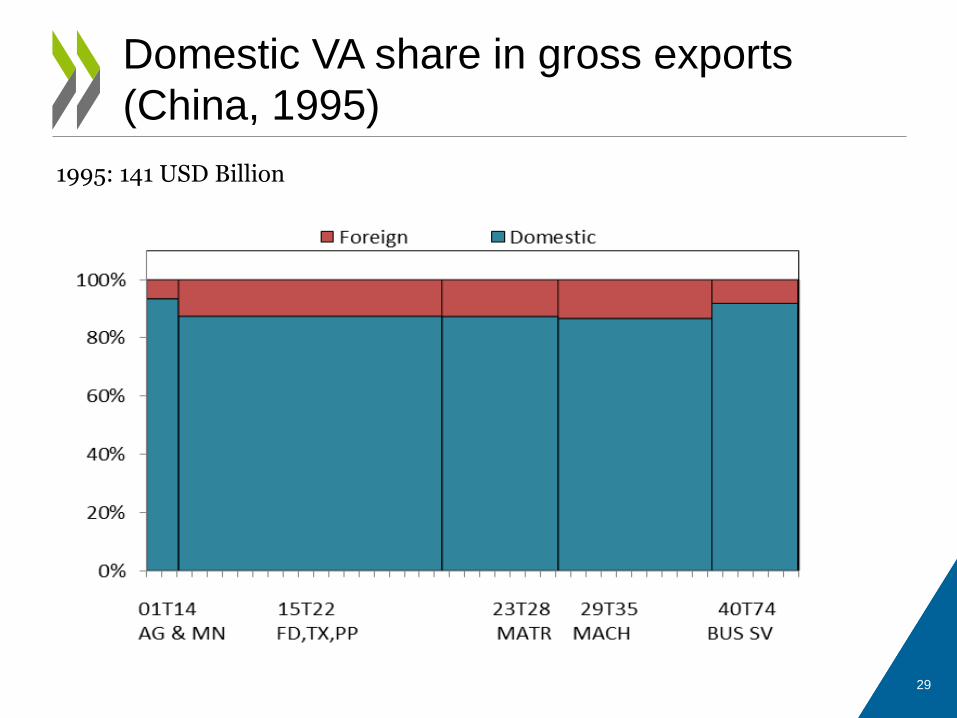
Domestic VA share in gross exports
(China, 1995)
1995: 141 USD Billion
29
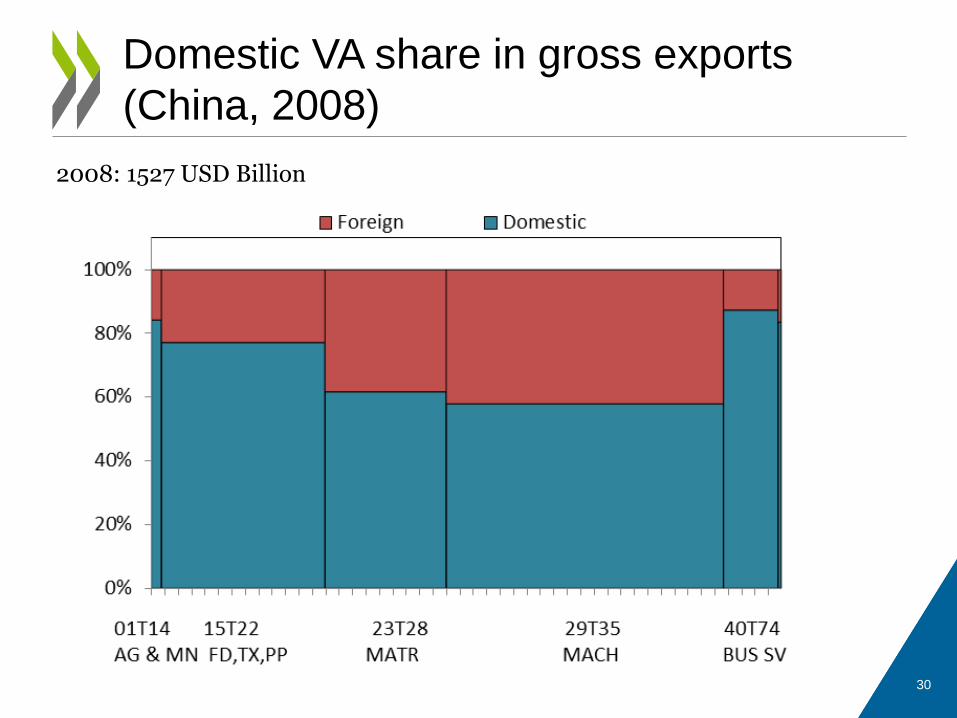
Domestic VA share in gross exports
(China, 2008)
2008: 1527 USD Billion
30
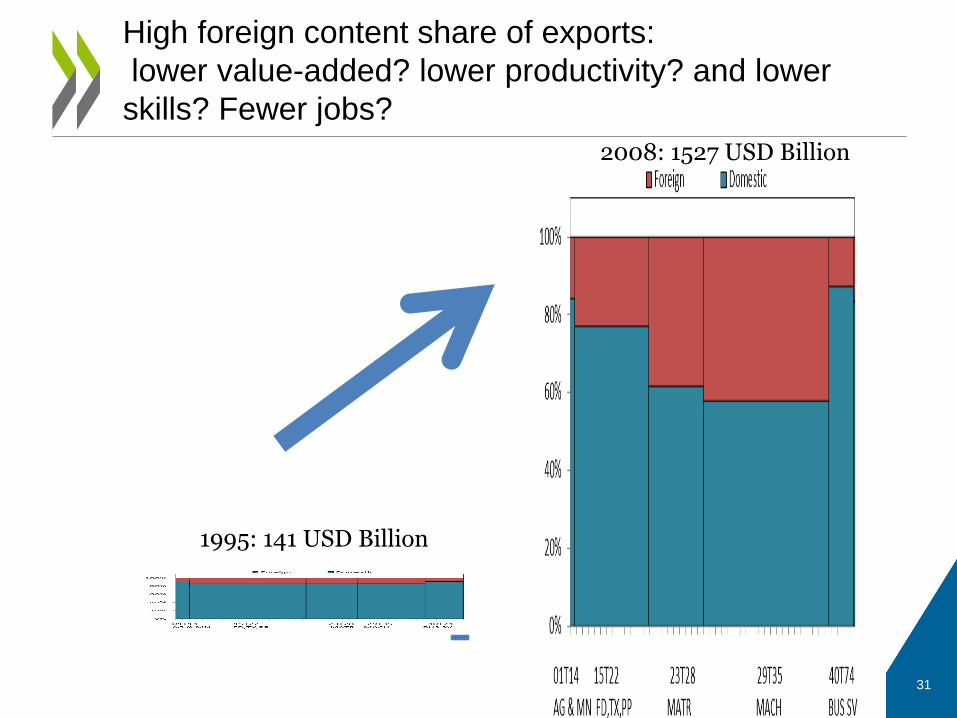
1995: 141 USD Billion
2008: 1527 USD Billion
High foreign content share of exports:
lower value-added? lower productivity? and lower
skills? Fewer jobs?
31
• Data and Model
– Industry details
– Procurement of imported goods are assumed to be proportional for all sectors
– Rest of the world (more developing economies)
– Heterogeneity within a country (e.g. different production system of exporters and non-exporters)
– Transition to SNA2008 and new industry classification(NACE2/ISIC4)
• TiVA Indicator Calculation
– Better presentation and dissemination tools
– Region-to-Region rather than Country-to-country
Issues and extensions
32
• Statistics that are timely and nationally consistent (across sources)
• Statistics with appropriate detailed breakdowns (by country and industry/product category) which are internationally comparable
• An international trade matrix that is perfectly symmetrical, complete (no missing values), consistent with data in IO/SUT/NA, and converted to end-use categories
Wishlist (short-term)
33
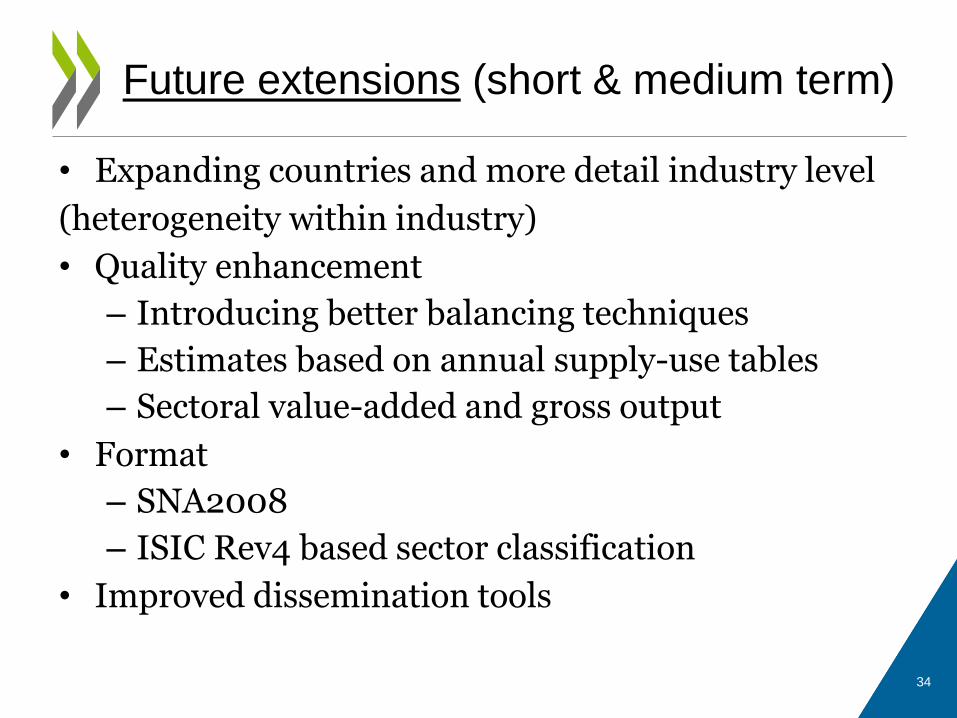
• Expanding countries and more detail industry level
(heterogeneity within industry)
• Quality enhancement
– Introducing better balancing techniques
– Estimates based on annual supply-use tables
– Sectoral value-added and gross output
• Format
– SNA2008
– ISIC Rev4 based sector classification
• Improved dissemination tools
Future extensions (short & medium term)
34
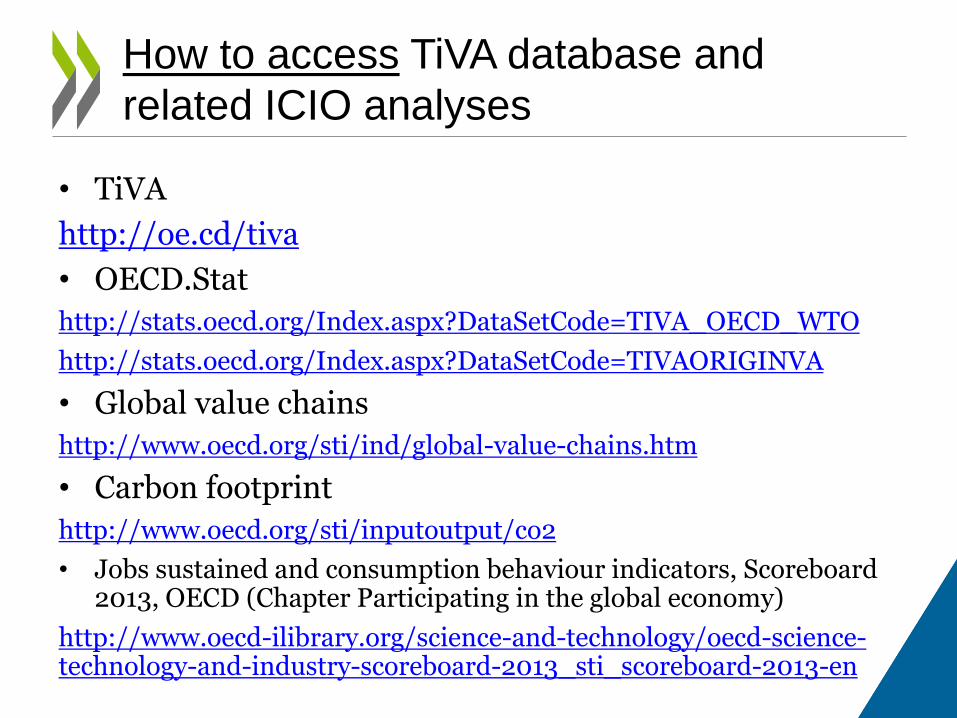
• TiVA
http://oe.cd/tiva
• OECD.Stat
http://stats.oecd.org/Index.aspx?DataSetCode=TIVA_OECD_WTO
http://stats.oecd.org/Index.aspx?DataSetCode=TIVAORIGINVA
• Global value chains
http://www.oecd.org/sti/ind/global-value-chains.htm
• Carbon footprint
http://www.oecd.org/sti/inputoutput/co2
• Jobs sustained and consumption behaviour indicators, Scoreboard 2013, OECD (Chapter Participating in the global economy)
http://www.oecd-ilibrary.org/science-and-technology/oecd-science-technology-and-industry-scoreboard-2013_sti_scoreboard-2013-en
How to access TiVA database and
related ICIO analyses
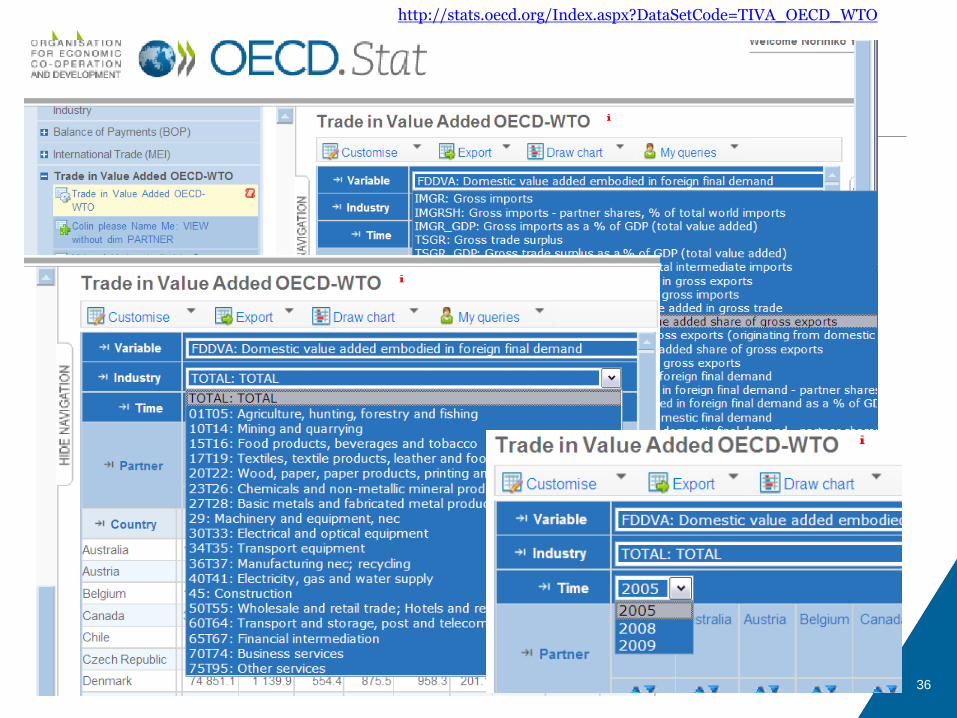
http://stats.oecd.org/Index.aspx?DataSetCode=TIVA_OECD_WTO
36
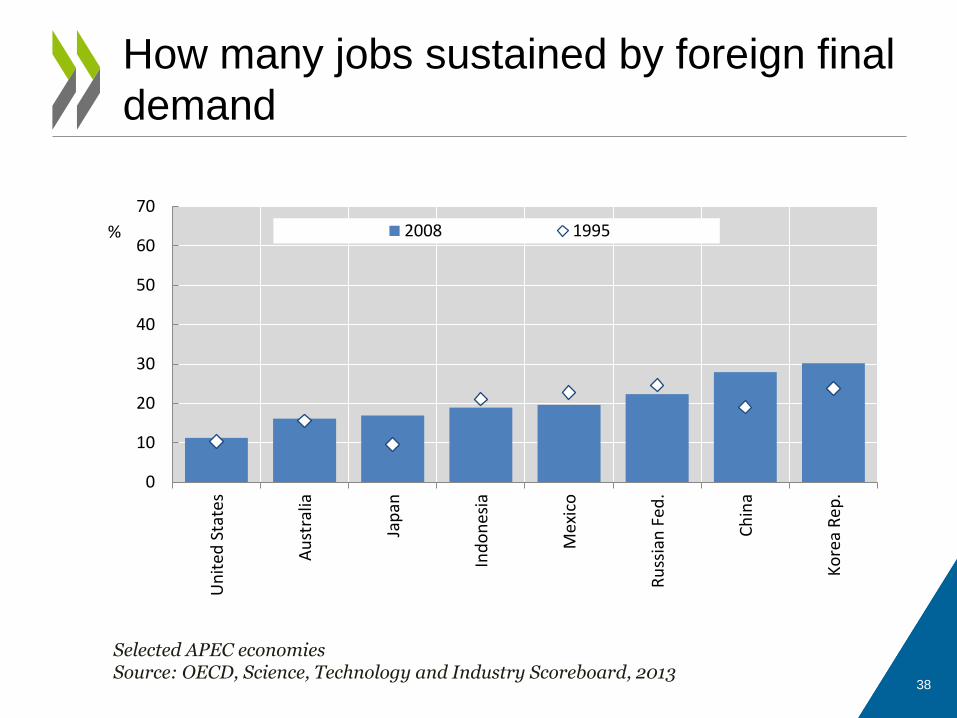
How many jobs sustained by foreign final
demand
38
0
10
20
30
40
50
60
70
Ko
rea
Re
p.
Ch
ina
Ru
ssia
n F
ed.
Mex
ico
Ind
on
esia
Jap
an
Au
stra
lia
Un
ited
Sta
tes
% 2008 1995
Selected APEC economies Source: OECD, Science, Technology and Industry Scoreboard, 2013
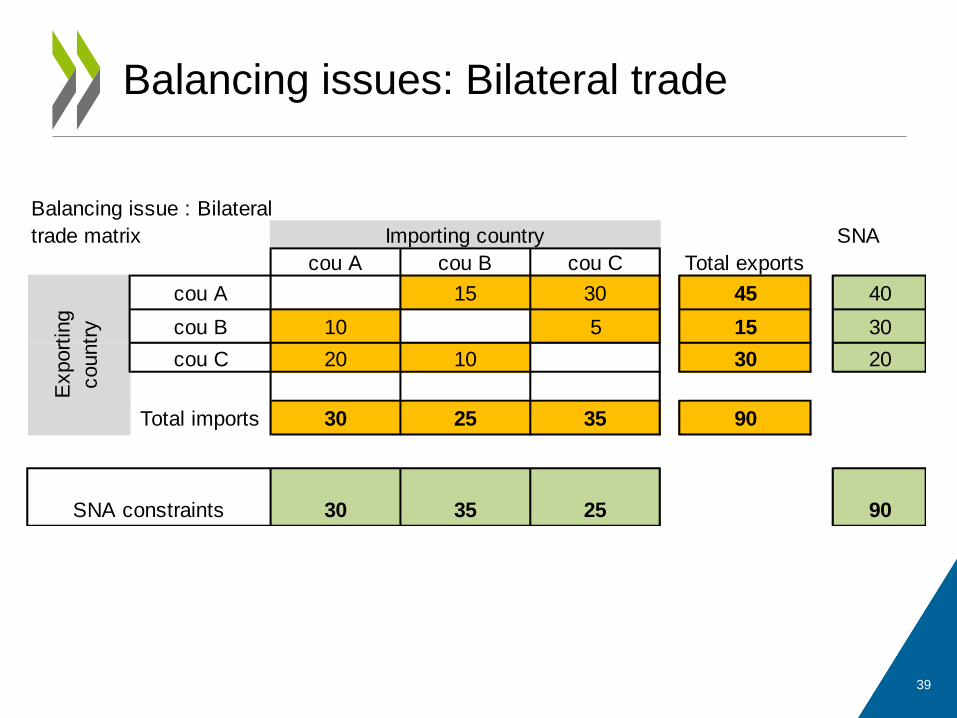
Balancing issues: Bilateral trade
Balancing issue : Bilateral
trade matrix SNA
cou A cou B cou C Total exports
cou A 15 30 45 40
cou B 10 5 15 30
cou C 20 10 30 20
Total imports 30 25 35 90
30 35 25 90
Export
ing
countr
y
Importing country
SNA constraints
39
40
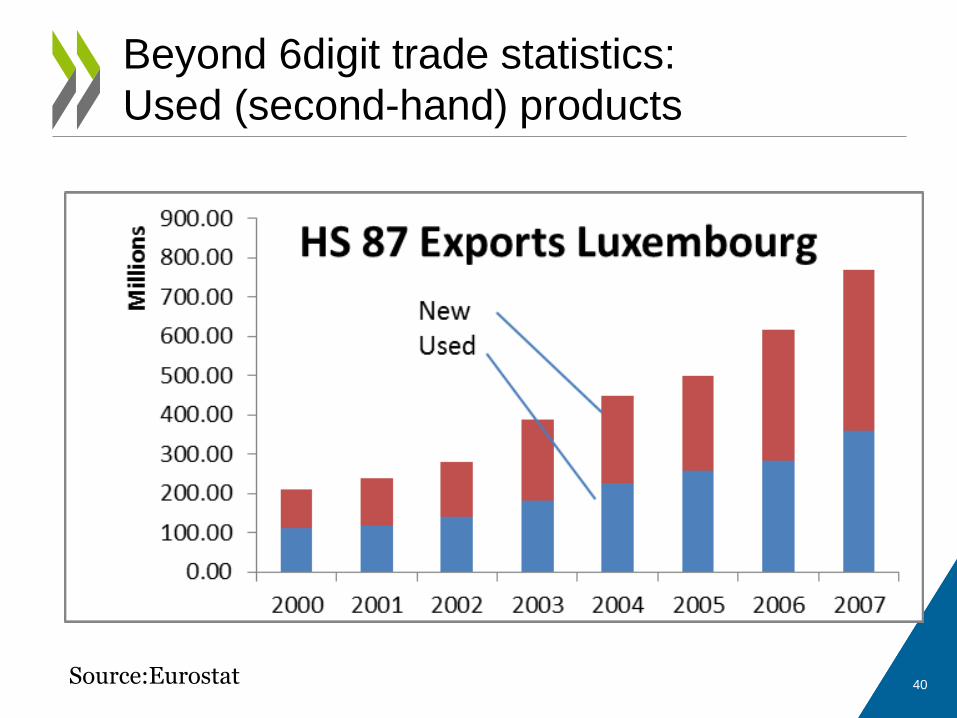
Beyond 6digit trade statistics:
Used (second-hand) products
Source:Eurostat
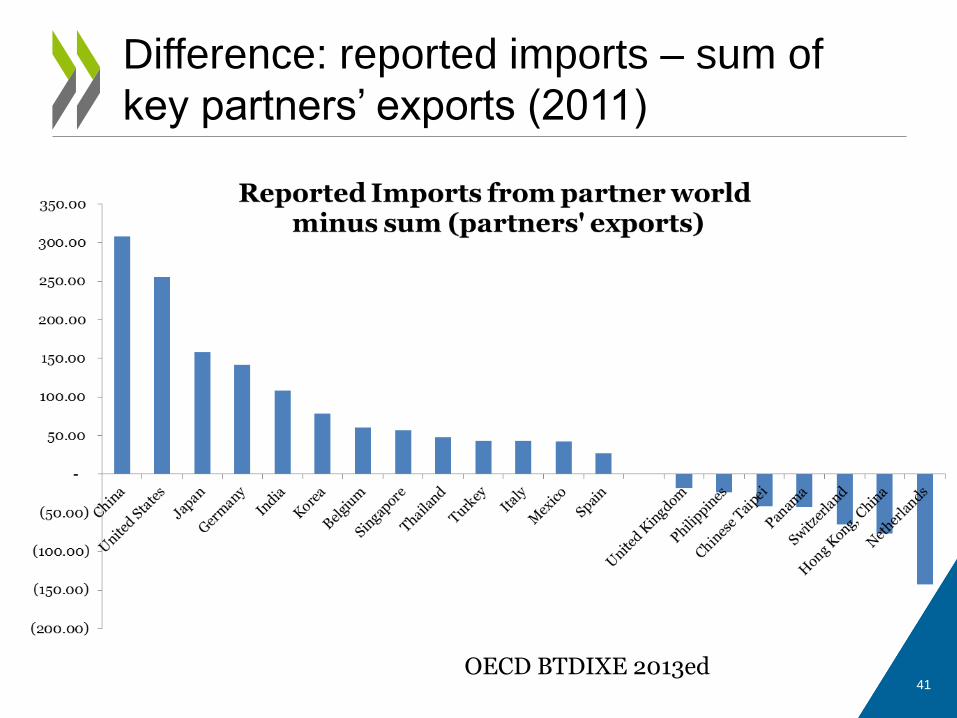
Difference: reported imports – sum of
key partners’ exports (2011)
OECD BTDIXE 2013ed 41