current and future levels of mercury ... - atmos-chem … · atmos. chem. phys., 16, 12495–12511,...
TRANSCRIPT
Atmos. Chem. Phys., 16, 12495–12511, 2016www.atmos-chem-phys.net/16/12495/2016/doi:10.5194/acp-16-12495-2016© Author(s) 2016. CC Attribution 3.0 License.
Current and future levels of mercury atmospheric pollutionon a global scaleJozef M. Pacyna1,6, Oleg Travnikov2, Francesco De Simone3, Ian M. Hedgecock3, Kyrre Sundseth1,Elisabeth G. Pacyna1, Frits Steenhuisen4, Nicola Pirrone5, John Munthe7, and Karin Kindbom7
1NILU – Norwegian Institute for Air Research, Instituttveien 18, P.O. Box 100, 2027 Kjeller, Norway2Meteorological Synthesizing Centre – East of EMEP, 2nd Roshchinsky proezd, 8/5, office 207,115419 Moscow, Russia3CNR – Institute of Atmospheric Pollution Research, Division of Rende, UNICAL-Polifunzionalie, Rende 87036, Italy4University of Groningen, Arctic Centre, Aweg 30, 9718 CW Groningen, the Netherlands5CNR – Institute of Atmospheric Pollution Research, Area della Ricerca Roma 1, Via Salaria Km 29 300,00015 Monterotondo (Rome), Italy6AGH University of Science and Technology, al. Mickiewicza 30, 30-059 Krakow, Poland7IVL Swedish Environmental Research Institute, P.O. Box 53201, 400 14 Gothenburg, Sweden
Correspondence to: Jozef M. Pacyna ([email protected])
Received: 2 May 2016 – Published in Atmos. Chem. Phys. Discuss.: 25 May 2016Revised: 24 August 2016 – Accepted: 29 August 2016 – Published: 6 October 2016
Abstract. An assessment of current and future emissions,air concentrations, and atmospheric deposition of mercuryworldwide is presented on the basis of results obtained dur-ing the performance of the EU GMOS (Global Mercury Ob-servation System) project. Emission estimates for mercurywere prepared with the main goal of applying them in mod-els to assess current (2013) and future (2035) air concentra-tions and atmospheric deposition of this contaminant. Thecombustion of fossil fuels (mainly coal) for energy and heatproduction in power plants and in industrial and residen-tial boilers, as well as artisanal and small-scale gold min-ing, is one of the major anthropogenic sources of Hg emis-sions to the atmosphere at present. These sources accountfor about 37 and 25 % of the total anthropogenic Hg emis-sions globally, estimated to be about 2000 t. Emissions inAsian countries, particularly in China and India, dominatethe total emissions of Hg. The current estimates of mercuryemissions from natural processes (primary mercury emis-sions and re-emissions), including mercury depletion events,were estimated to be 5207 t year−1, which represents nearly70 % of the global mercury emission budget. Oceans are themost important sources (36 %), followed by biomass burning(9 %). A comparison of the 2035 anthropogenic emissionsestimated for three different scenarios with current anthro-
pogenic emissions indicates a reduction of these emissionsin 2035 up to 85 % for the best-case scenario.
Two global chemical transport models (GLEMOS andECHMERIT) have been used for the evaluation of futuremercury pollution levels considering future emission scenar-ios. Projections of future changes in mercury deposition ona global scale simulated by these models for three anthro-pogenic emissions scenarios of 2035 indicate a decrease inup to 50 % deposition in the Northern Hemisphere and up to35 % in Southern Hemisphere for the best-case scenario.
The EU GMOS project has proved to be a very impor-tant research instrument for supporting the scientific justifi-cation for the Minamata Convention and monitoring of theimplementation of targets of this convention, as well as theEU Mercury Strategy. This project provided the state of theart with regard to the development of the latest emission in-ventories for mercury, future emission scenarios, dispersionmodelling of atmospheric mercury on a global and regionalscale, and source–receptor techniques for mercury emissionapportionment on a global scale.
Published by Copernicus Publications on behalf of the European Geosciences Union.
12496 J. M. Pacyna et al.: Current and future levels of mercury atmospheric pollution on a global scale
1 Introduction
Mercury (Hg) has been recognized as a toxic, persistent, andmobile contaminant. This contaminant does not degrade inthe environment, and it is mobile because of the volatility ofthe element and several of its compounds. It has the abilityto be transported within air masses over very long distances.High doses of organic compounds of mercury, particularlymethylmercury (MeHg), can be fatal to humans, but evenrelatively low doses can seriously affect the human nervoussystem. Mercury has also been linked with possible harmfuleffects on the cardiovascular, immune, and reproductive sys-tems. Methylmercury passes through both the placenta andthe blood–brain barrier, so exposure of women of childbear-ing age and of children to methylmercury is of greatest con-cern. Consequently, several studies have been conducted onthe behaviour of mercury in the environment (e.g. Pirroneand Mason, 2009; AMAP/UNEP, 2013a) and its environmen-tal (e.g. Lindberg et al., 2002; Sunderland and Mason, 2007;Mason, 2009; Pacyna et al., 2010; Amos et al., 2012; Leiet al., 2013, Driscoll et al., 2013; Chen et al., 2014; Songet al., 2015, Cohen et al., 2016; Gustin et al., 2016), humanhealth (e.g. AMAP, 2009; Karagas et al., 2012; Sundseth etal., 2015), and economic consequences (e.g. Ambio, 2007;Sundseth et al., 2010).
The major conclusion drawn from recent studies on theimpacts of mercury on the environment and human health isthat there is a need for international action to reduce emis-sions of and human exposure to mercury on a regional andglobal scale. The EU Mercury Strategy was launched in 2005(and reviewed in 2010) to support and encourage Europe-wide action on mercury reduction and to ban its use. TheEU’s Mercury Strategy provided a comprehensive plan in-corporating actions addressing mercury pollution both in theEU and globally. It identified a variety of actions to decreasemercury emissions, cut supply, reduce demand, and protectagainst exposure, especially to methylmercury found in fish.An overview of EU regulations and directives on mercuryemissions can be found in Sundseth (2012).
In 2013, as part of the United Nations Environment Pro-gramme (UNEP), countries signed the Minamata Conventionon Mercury, a legally binding agreement intended to “pro-tect human health and the environment from anthropogenicemissions and releases of mercury and mercury compounds”(Article 1 in UNEP, 2013). The Minamata Convention buildsupon scientific knowledge of global sources and supply,sinks, and reservoirs of mercury, coupled to linkages withhuman and wildlife exposures and related health impacts.
Implementation of targets of the Minamata Convention,the EU Mercury Strategy, and other policies aiming at the re-duction of mercury emissions and their impacts requires anaccurate assessment of the behaviour of mercury in the en-vironment. It became clear that the atmosphere is the majortransport pathway for the global distribution of mercury. Apart of the emissions entering the atmosphere is locally de-
posited to aquatic and terrestrial ecosystems. Another part istransported with air masses in directions dependent on manyfactors, including wind direction and speed and mercury be-haviour during this transport. As a consequence, mercuryemitted in one part of the world can be transported to an-other. However, the spatial distribution of mercury concen-trations and deposition is quite uneven. The question arisesfrom decision makers as to whether analytical tools are nowavailable to accurately assess these source–receptor relation-ships for mercury. The Global Mercury Observation System(GMOS) project (http://www.gmos.eu) has undertaken stud-ies addressing this question. Both monitoring and model sim-ulations were used for this purpose. The main results fromthe assessment of current and future emissions, air concen-trations, and atmospheric deposition of mercury worldwideare presented in this paper.
2 Assessment of emissions and future emissionscenarios
Emission estimates for mercury were prepared with the maingoal of applying them in models to assess current (2013) andfuture (2035) air concentrations and atmospheric depositionof this contaminant.
2.1 Methodology
The approach to estimate the current and future mercuryemissions consisted of three steps: (i) compilation of the cur-rent and future activity data, such as data on consumption offuels and raw materials and production of industrial goods;(ii) linking these activities to a compilation of unabated emis-sion factors (UEFs) to derive estimates of unabated emis-sions to air; and (iii) characterization of the effectiveness ofair pollution control devices (APCDs) or waste practices andtheir current and future degree of application. The conceptualapproach used to produce the scenario inventories is basedon the methodology developed in AMAP/UNEP (2013a), il-lustrated in Appendix A1. Detailed descriptions of all datasources, calculation methodology, and results for 2010, in-cluding a comparison with results from national officialemission inventories and other publications, can be found inAMAP/UNEP (2013a). The methodology for estimating fu-ture mercury emissions is consistent with the methodologydeveloped in AMAP/UNEP (2013a) for the year 2010. It in-cludes the development of two database modules – one on theprojected future activities and the other one on emission fac-tors and emission reduction technology employed in the fu-ture for different countries. In this way the emission changesbetween 2010 and 2035 can be analysed.
2.2 Database on activities
Sector activities relate to national statistics on consumptionor production of industrial raw materials or outputs for each
Atmos. Chem. Phys., 16, 12495–12511, 2016 www.atmos-chem-phys.net/16/12495/2016/
J. M. Pacyna et al.: Current and future levels of mercury atmospheric pollution on a global scale 12497
mercury-emitting economic sector. Current (2010) statisti-cal data presented in AMAP/UNEP (2013a) were collectedfrom national and international experts, international organi-zations (such as UNEP and the International Energy Agency– IEA), industry associations, and national bureaus (such asthe US Geological Survey – USGS). These current statis-tics were then linked to future projections, supported by sev-eral official database sources, such as the IEA, the Inter-national Monetary Fund (IMF), the World Bank (WB), theOrganisation for Economic Co-operation and Development(OECD), and the United Nations (UN). Future activity datafor the year 2035 were estimated and compiled from threedata sources/methodologies in the following way:
– To estimate future energy consumption and productiondata, the UNEP 2010 estimates were projected in linewith the IEA projections presented in the World EnergyOutlook (WEO, 2012).
– To estimate the various country-specific industrialgoods consumption and production data in the future,a methodology consisting of a year 2035 forecast wasdeveloped based on a simple regression model that re-lates industrial production to a nation’s gross domesticproduct (GDP) per capita (representing the per capitamarket value of all goods and services produced withina country). The model fitted a straight line through theset of points for all countries, with the resulting sloperepresenting the correlation between national GDP percapita PPP (purchasing power parity) and national an-nual production of industrial goods. The future projec-tion was then estimated on the basis of forecasting in-dustrial production on the expectations of developmentof GDP per capita PPP in various countries, based onthe OECD database on previous and current GDP percapita PPP as well as the IMF future expectations onGDP per capita PPP.
– To estimate the intentional use of mercury in prod-ucts, an assumption on voluntary future reductions wasmade. Assumptions on various degrees of reduced useof mercury in products were based on previously ob-served trends for different regions (AMAP, 2010) incombination with expectations on implementation ofthe Minamata Convention. Regional consumption fig-ures used as the basis for the scenarios are presented inAMAP/UNEP (2013a), distributed between countries ineach region, based on GDP PPP comparisons.
2.3 Database on emission factors and future emissionreduction technology employed
Country-specific unabated emission factors based on ex-pert evaluation and national data were compiled forAMAP/UNEP (2013a). Furthermore, using the method de-veloped in AMAP/UNEP (2013a), countries have been as-
signed to five groupings representing different levels of tech-nological implementation (technological profiles) of APCDs.These technologies were characterized by their effectivenessof emission control and degree of application in a given in-dustrial technology. Various assumptions on future applica-tion were then made by assuming various step-by-step tech-nology improvements for each country compared to the 2010situation. The technological profiles were then applied to the2010 uncontrolled emission estimates and the future activi-ties for the countries/sectors, resulting in national sector esti-mates of unintentional mercury emissions to the atmosphere.
Mercury emissions to air from waste associated withsectors using mercury intentionally for the various coun-tries were based on world region consumption data as wellas on assumptions regarding rates of breakage, degrees ofwaste handling/incineration, and suitable emission factors.The consumption data were distributed between the coun-tries based on GDP per capita PPPs; see Appendices A3 andA4 in AMAP/UNEP (2013a). Four different categories ofwaste management practices (such as waste recycling, con-trolled or uncontrolled incineration and landfilling) were as-signed to individual countries, based on GDP PPP, wheregroup 1 is the most advanced, while group 4 has the leastdeveloped practices. Various assumptions on future projec-tions on consumption as well as the waste management prac-tices and emission factors constituted the emission scenariofrom sectors using mercury intentionally. Emissions fromthe use of mercury in artisanal gold mining was estimatedbased on consumption patterns and assumed emissions to airfrom different methods employed in different regions; seeAppendix A2 in AMAP/UNEP (2013a).
2.4 Definition of emission scenarios
Three main sets of projections were chosen as the basis forcompiling future (2035) mercury emissions:
– The Current Policies Scenario (CPS). The scenario as-sumes that governmental policies and measures exist-ing in 2010 are adopted, including those that have notbeen fully implemented. This includes not only the im-plementation of traditional APCDs but also those mea-sures designed to prevent climate change as well as ad-dress other environmental problems through energy ef-ficiency and switching to lower-carbon fuels. The WEOCPS for 2035 was adopted for the energy sector. Thescenario does not include likely but yet undecided futurepolicy initiatives. Thus, it does not forecast the futuresituation but instead gives a baseline picture of energy,industrial goods, consumption and production, as wellas the use of APCDs and waste management practicesthat are likely to change given no additional effort withregard to policymaking.
– The New Policies Scenario (NPS). The scenario as-sumes that policy commitments and plans announced by
www.atmos-chem-phys.net/16/12495/2016/ Atmos. Chem. Phys., 16, 12495–12511, 2016
12498 J. M. Pacyna et al.: Current and future levels of mercury atmospheric pollution on a global scale
countries worldwide to reduce greenhouse gas (GHG)emissions, as well as phase out fossil-energy subsidies,are fully implemented. National climate commitmentsrelate to the period of 2020, but additional measuresare assumed to be implemented at the 2010 to 2020pace for the period 2020 to 2035. Future consump-tion/production of industrial goods is assumed to be atthe same level as in the CPS, while the use of mercuryin products is assumed to be reduced by 70 % in 2035compared to the 2010 situation as a result of agreementswithin the Minamata Convention. It is furthermore as-sumed that all countries will move one step up into moreadvanced waste practices compared to 2010.
– The 450 [ppm] Scenario (450 ppm). The scenario setsout a target of all countries reaching the highest feasi-ble/available reduction efficiency in each emission sec-tor. The scenario is not a very realistic one, but it illus-trates the maximum possible mercury emission reduc-tions that could be achieved if no other constraints aretaken into account, such as economy and increased de-mand. It can be seen as a “green scenario” that is aimingfor a maximum reduction of negative externalities. Inthe energy sector, it is consistent with a 50 % chance oflimiting the average global temperature to 2 ◦C (com-pared to pre-industrial levels). This requires that theconcentrations of greenhouse gases in the atmospherebe 450 ppm of carbon dioxide equivalents. The scenariothus features the participation of major economies, suchas China and India, in the OECD global cap-and-tradescheme after 2020.
A ratio similar to the difference in the IPCC A11 and IPCCB12 scenario was applied to estimate the future consump-tion/production of industrial goods.
Consumption of mercury in mercury-added products is as-sumed to be lowered by 95 % in 2035 compared to the aver-age in 2010, and a highest possible combination of measuresis being applied by all countries which includes collectionand safe storage of 15 % of mercury in mercury-added prod-ucts, recycling of 45 % of mercury in the waste stream, anda lower emission factor (0.03) for controlled waste incinera-tion, assuming at the same time that 100% of waste incinera-tion is applied and that 80 % of waste to landfills is safelycontrolled. Similarly, the use of mercury in artisanal goldmining was assumed to be reduced by 46 and 76 % for theNPS and 450 ppm scenarios, respectively.
1The A1 scenario describes the future world of very rapid eco-nomic growth and a rapid introduction of new and more efficienttechnologies. It also assumes a substantial reduction in regional dif-ferences in per capita income.
2The B1 scenario assumes a more environmental focus on arapid change in economic structures towards a service and infor-mation economy which reduces material intensity, as well as the in-troduction of clean and resource-efficient technologies. It assumes,however, no additional climate initiatives.
2.5 Assessment of 2010 global emissions andemission factors
The recent estimate of mercury emissions to the atmo-sphere (targeting the year 2010) has found artisanal andsmall-scale gold mining as well as combustion of fossil fu-els (mainly coal) for energy and heat production in powerplants and in industrial and residential boilers as the ma-jor anthropogenic sources of mercury emissions to the at-mosphere. These sources account for about 37 and 25 % ofthe total mercury emissions globally, estimated to be about2000 t. Next, primary non-ferrous metals production and ce-ment production account for relatively large contributionsto the emission inventory, being responsible for about 10and 9 %, respectively. Large-scale gold production and wastefrom consumer products (mostly landfill but also incinera-tion) both contribute about 5 %, while contaminated sites areresponsible for about 4 %. Pig iron production contributesabout 2.3 %, while the remainder results from the chlor-alkali industry (1.4 %), oil refining (0.8 %), mercury produc-tion (0.6 %), cremation (0.2 %), and natural gas combustion(AMAP/UNEP, 2013a).
It should be noted that emission estimates from large-scalegold production are considered preliminary and have largeassociated uncertainties (AMAP/UNEP, 2013a). The infor-mation needed for emission estimates includes the informa-tion on the gold content of ore, mercury content of ore, andamount of ore mined per tonne of gold produced. This in-formation varies considerably both between individual coun-tries and within countries – as well as over time. Currentlyavailable information on the above mentioned factors anddetails on emission estimates for mercury for this sector isavailable in AMAP/UNEP (2013a).
The emissions in Asian countries, particularly in Chinaand India, dominate the total emissions of mercury. Thistrend was observed from 2005 to 2010. In fact, Asian emis-sions also dominated the global anthropogenic emissions ofmercury in the 1990s, as concluded in Pacyna et al. (2010).A mercury emission trend assessment has revealed that, afterhaving peaked in the 1970s, the total anthropogenic mercuryemissions to the atmosphere appear to have been relativelystable between 1990 and 2005 (AMAP, 2010). A decreasein emissions in Europe and North America during the timeperiod has been offset by an increase in Asia. The largest in-crease in emissions is generally due to an increase in coalburning for power and heat generation and for industrial pur-poses. Increased use of air pollution controls, removing mer-cury as a co-benefit (and some mercury-specific removingtechnologies), has slowed down or even reduced the emis-sions from the increased energy demand. This is especiallythe case for Europe and North America, but it is also re-flected in new coal-fired power plants with state-of-art pollu-tion controls implemented in China (AMAP/UNEP, 2013a).
The above-mentioned emission inventory for mercuryfrom anthropogenic sources is the state of the art. It is
Atmos. Chem. Phys., 16, 12495–12511, 2016 www.atmos-chem-phys.net/16/12495/2016/
J. M. Pacyna et al.: Current and future levels of mercury atmospheric pollution on a global scale 12499
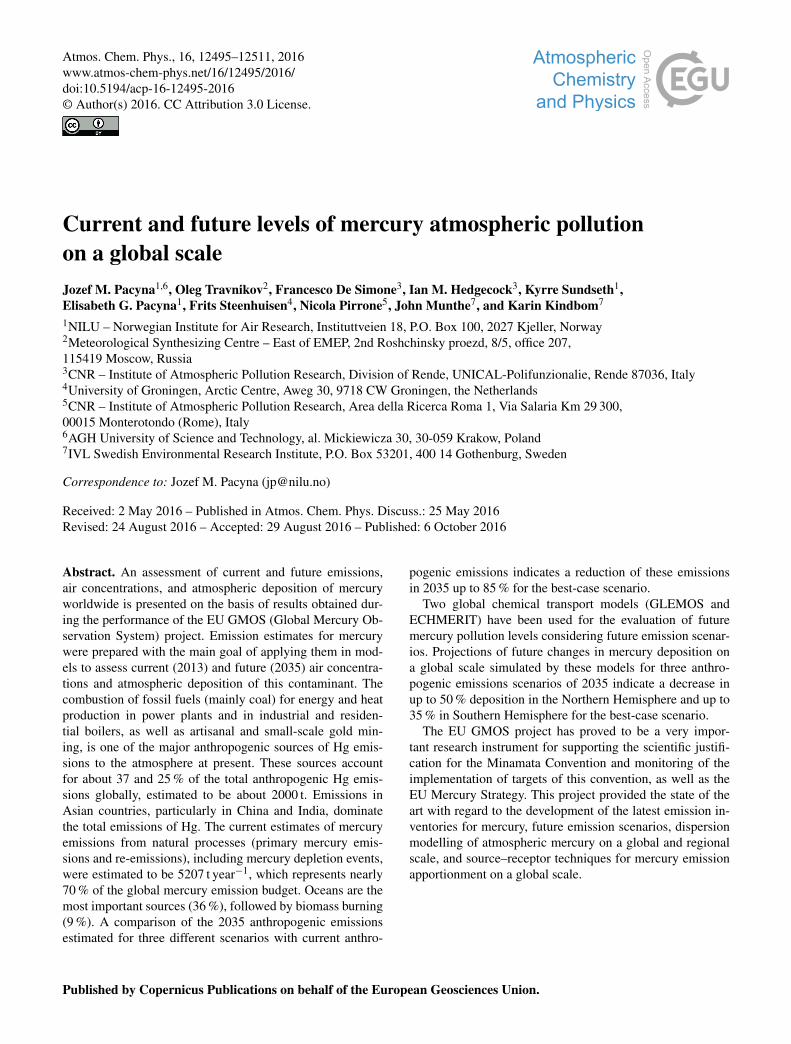
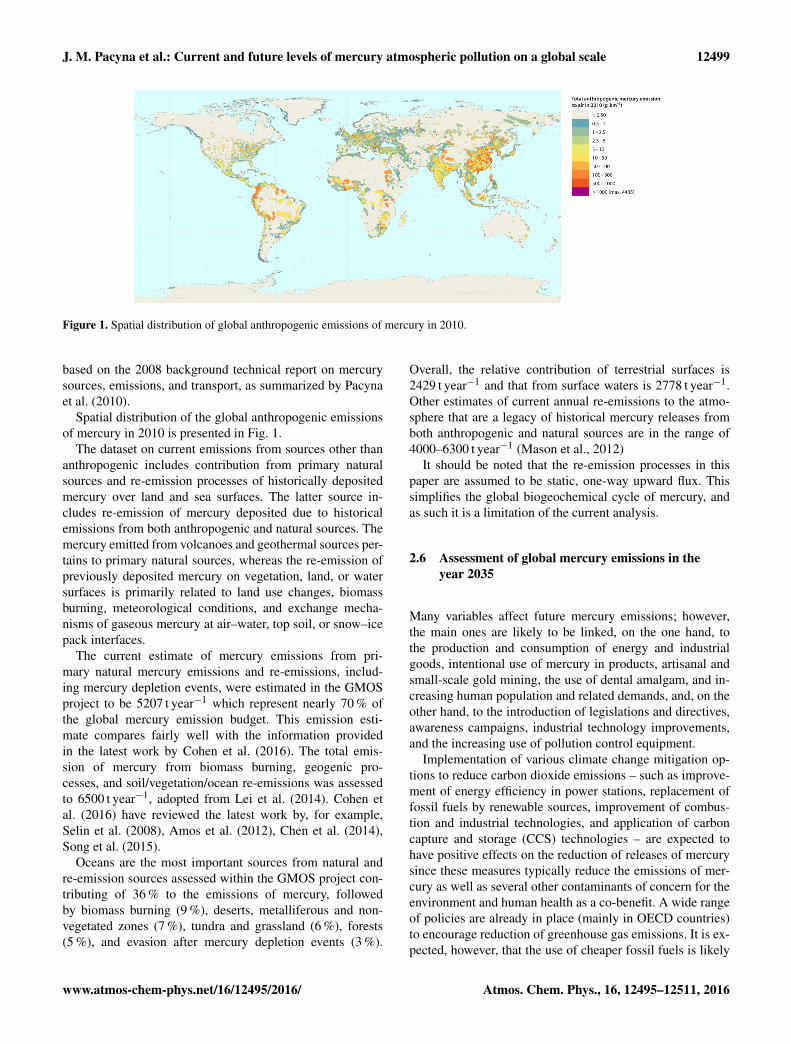
Figure 1. Spatial distribution of global anthropogenic emissions of mercury in 2010.
based on the 2008 background technical report on mercurysources, emissions, and transport, as summarized by Pacynaet al. (2010).
Spatial distribution of the global anthropogenic emissionsof mercury in 2010 is presented in Fig. 1.
The dataset on current emissions from sources other thananthropogenic includes contribution from primary naturalsources and re-emission processes of historically depositedmercury over land and sea surfaces. The latter source in-cludes re-emission of mercury deposited due to historicalemissions from both anthropogenic and natural sources. Themercury emitted from volcanoes and geothermal sources per-tains to primary natural sources, whereas the re-emission ofpreviously deposited mercury on vegetation, land, or watersurfaces is primarily related to land use changes, biomassburning, meteorological conditions, and exchange mecha-nisms of gaseous mercury at air–water, top soil, or snow–icepack interfaces.
The current estimate of mercury emissions from pri-mary natural mercury emissions and re-emissions, includ-ing mercury depletion events, were estimated in the GMOSproject to be 5207 t year−1 which represent nearly 70 % ofthe global mercury emission budget. This emission esti-mate compares fairly well with the information providedin the latest work by Cohen et al. (2016). The total emis-sion of mercury from biomass burning, geogenic pro-cesses, and soil/vegetation/ocean re-emissions was assessedto 6500 t year−1, adopted from Lei et al. (2014). Cohen etal. (2016) have reviewed the latest work by, for example,Selin et al. (2008), Amos et al. (2012), Chen et al. (2014),Song et al. (2015).
Oceans are the most important sources from natural andre-emission sources assessed within the GMOS project con-tributing of 36 % to the emissions of mercury, followedby biomass burning (9 %), deserts, metalliferous and non-vegetated zones (7 %), tundra and grassland (6 %), forests(5 %), and evasion after mercury depletion events (3 %).
Overall, the relative contribution of terrestrial surfaces is2429 t year−1 and that from surface waters is 2778 t year−1.Other estimates of current annual re-emissions to the atmo-sphere that are a legacy of historical mercury releases fromboth anthropogenic and natural sources are in the range of4000–6300 t year−1 (Mason et al., 2012)
It should be noted that the re-emission processes in thispaper are assumed to be static, one-way upward flux. Thissimplifies the global biogeochemical cycle of mercury, andas such it is a limitation of the current analysis.
2.6 Assessment of global mercury emissions in theyear 2035
Many variables affect future mercury emissions; however,the main ones are likely to be linked, on the one hand, tothe production and consumption of energy and industrialgoods, intentional use of mercury in products, artisanal andsmall-scale gold mining, the use of dental amalgam, and in-creasing human population and related demands, and, on theother hand, to the introduction of legislations and directives,awareness campaigns, industrial technology improvements,and the increasing use of pollution control equipment.
Implementation of various climate change mitigation op-tions to reduce carbon dioxide emissions – such as improve-ment of energy efficiency in power stations, replacement offossil fuels by renewable sources, improvement of combus-tion and industrial technologies, and application of carboncapture and storage (CCS) technologies – are expected tohave positive effects on the reduction of releases of mercurysince these measures typically reduce the emissions of mer-cury as well as several other contaminants of concern for theenvironment and human health as a co-benefit. A wide rangeof policies are already in place (mainly in OECD countries)to encourage reduction of greenhouse gas emissions. It is ex-pected, however, that the use of cheaper fossil fuels is likely
www.atmos-chem-phys.net/16/12495/2016/ Atmos. Chem. Phys., 16, 12495–12511, 2016
12500 J. M. Pacyna et al.: Current and future levels of mercury atmospheric pollution on a global scale
to remain dominant in most regions to meet increasing en-ergy demands.
Changes in energy production and consumption until theyears 2035 and 2050 have been presented by the IEA WEOand Energy Technology Perspectives (ETP), respectively. Inthe projections, WEO focuses on certain key aspects, such asenergy prices, concerns regarding greenhouse gas emissions,and impacts on energy investments, the increasing use of re-newable energy, changes in regulations and directives, andrecent developments in technologies for energy production.
The IEA projects that, for all the scenarios, the popula-tion is assumed to increase from 6.7 billion (in 2008) to8.5 billion (in 2035), with population in non-OECD coun-tries continuing to grow most rapidly. In the same period, theGDP is assumed to grow worldwide by 3.2 % per year onaverage. India, China and Middle East are assumed to growmost rapidly in terms of GDP as well as increase in energydemand. The OECD projects that, in the next 20–50 years,China will become the world’s largest economy, whilst Indiawill surpass Japan and catch up with the Euro area before2030. On average, the GDP per capita PPP growth will beroughly 3 % annually in the non-OECD area compared to1.7 % in the OECD area. The IEA projects that, in the NP(New Policy) scenario, energy demand continues to increaseby 40 % from 2008 to 2035. In the same period, the energydemand will be about 8 % higher in the CP (Current Policy)scenario and 11 % lower in the 450 ppm scenario in compar-ison to the CP scenario. Coal remains the dominant energysource in the NP scenario, but the share declines by 7 % inthe period to 2035. Coal demand increases by about 25 %(mostly up to 2020), while electricity demand increases by80 % by 2035. Coal use is assumed to be critically influencedby government policies related to climate change. No changein government policies, strong global economic growth, andincreased energy demand in non-OECD countries increasesglobal fossil fuels demand substantially in the CP scenario. Incontrast, implementation of measures to meet climate targetsand policies reduce, for example, coal demand by a quarter inthe New Policies Scenario and more than half in the 450 ppmscenario in comparison to the CP scenario. Less coal use isseen for the OECD countries in all scenarios between 2010and 2035 (WEO, 2012). An illustration of the assumed coaluse until 2035 under the WEO CP, NP, and 450 scenario as-sumptions is presented in the Supplement Sect. S1.
The Intergovernmental Panel on Climate Change (IPCC)Special Report on Emission Scenarios (SRES) (baseline sce-nario A1, A2, B1, and B2) on climate change does not projectany additional policies above current ones until the year2100; however, they focus on socio-economic, demographic,and technological change.
An overview of the assumed future consumption ofmercury-containing products is available in Tables A1, A2,and A3.
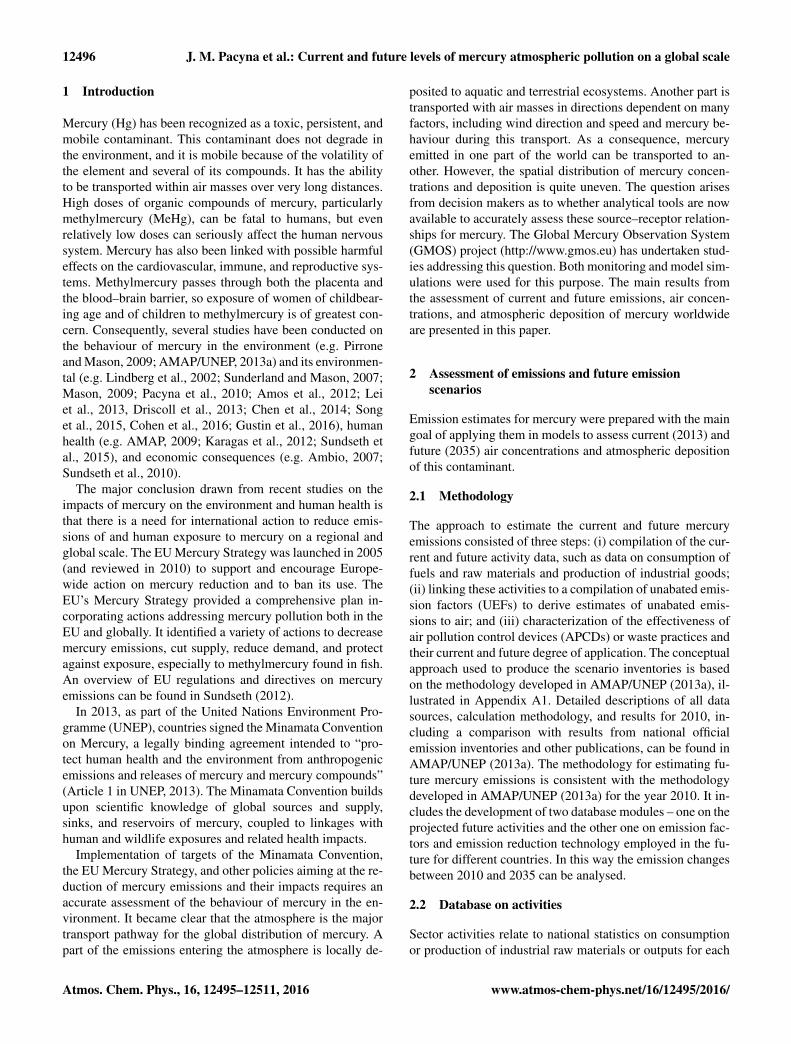
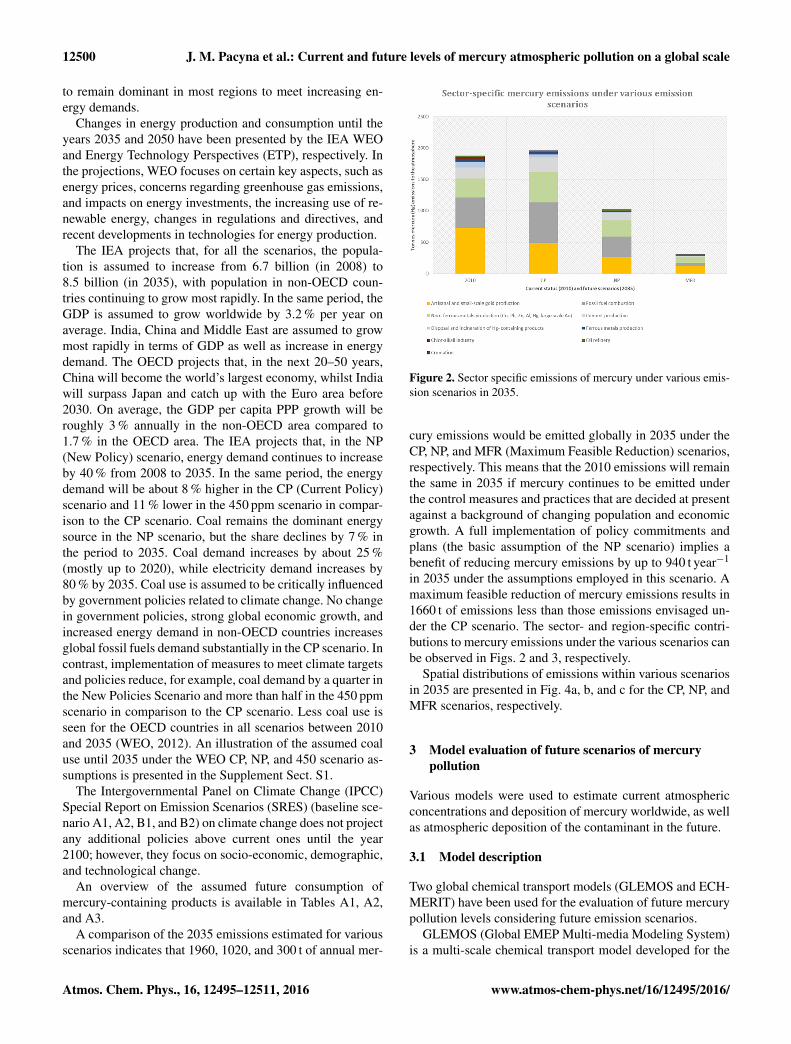
A comparison of the 2035 emissions estimated for variousscenarios indicates that 1960, 1020, and 300 t of annual mer-
Figure 2. Sector specific emissions of mercury under various emis-sion scenarios in 2035.
cury emissions would be emitted globally in 2035 under theCP, NP, and MFR (Maximum Feasible Reduction) scenarios,respectively. This means that the 2010 emissions will remainthe same in 2035 if mercury continues to be emitted underthe control measures and practices that are decided at presentagainst a background of changing population and economicgrowth. A full implementation of policy commitments andplans (the basic assumption of the NP scenario) implies abenefit of reducing mercury emissions by up to 940 t year−1
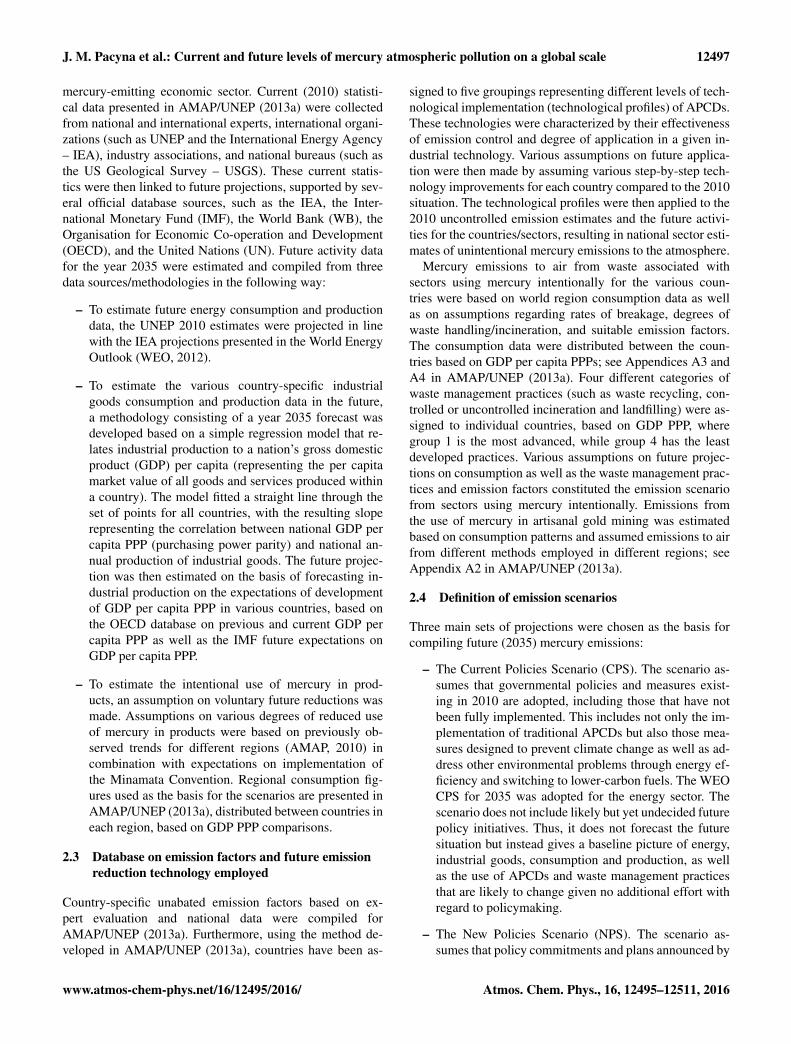
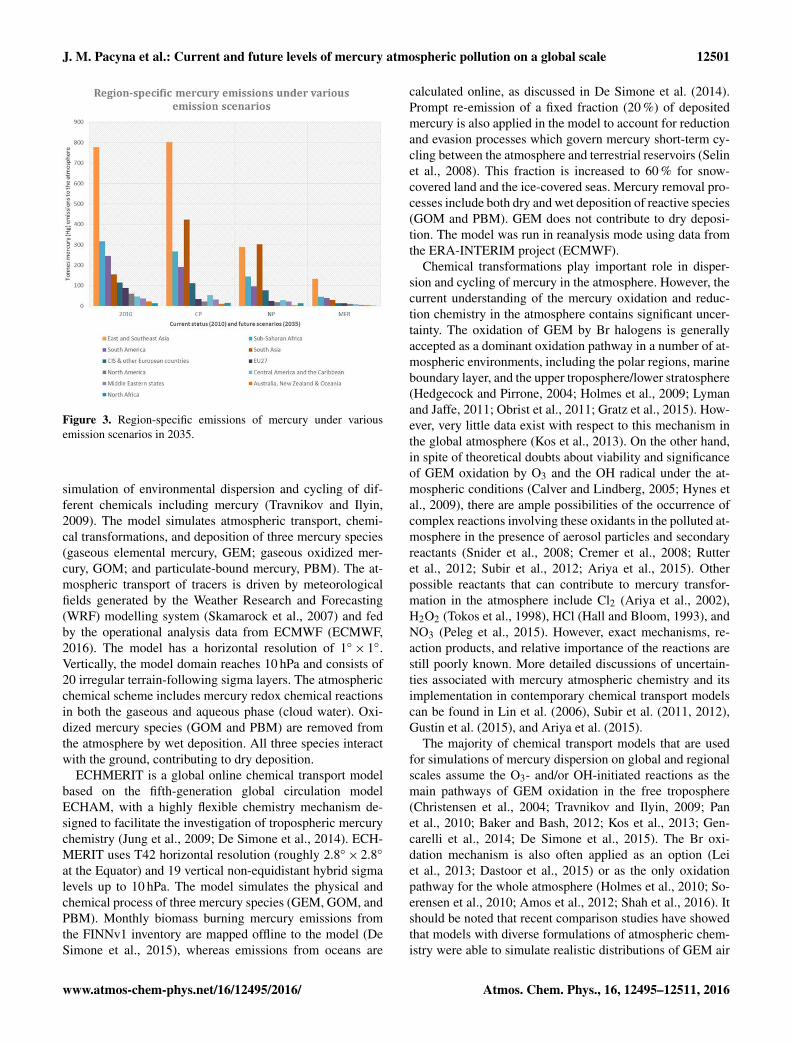
in 2035 under the assumptions employed in this scenario. Amaximum feasible reduction of mercury emissions results in1660 t of emissions less than those emissions envisaged un-der the CP scenario. The sector- and region-specific contri-butions to mercury emissions under the various scenarios canbe observed in Figs. 2 and 3, respectively.
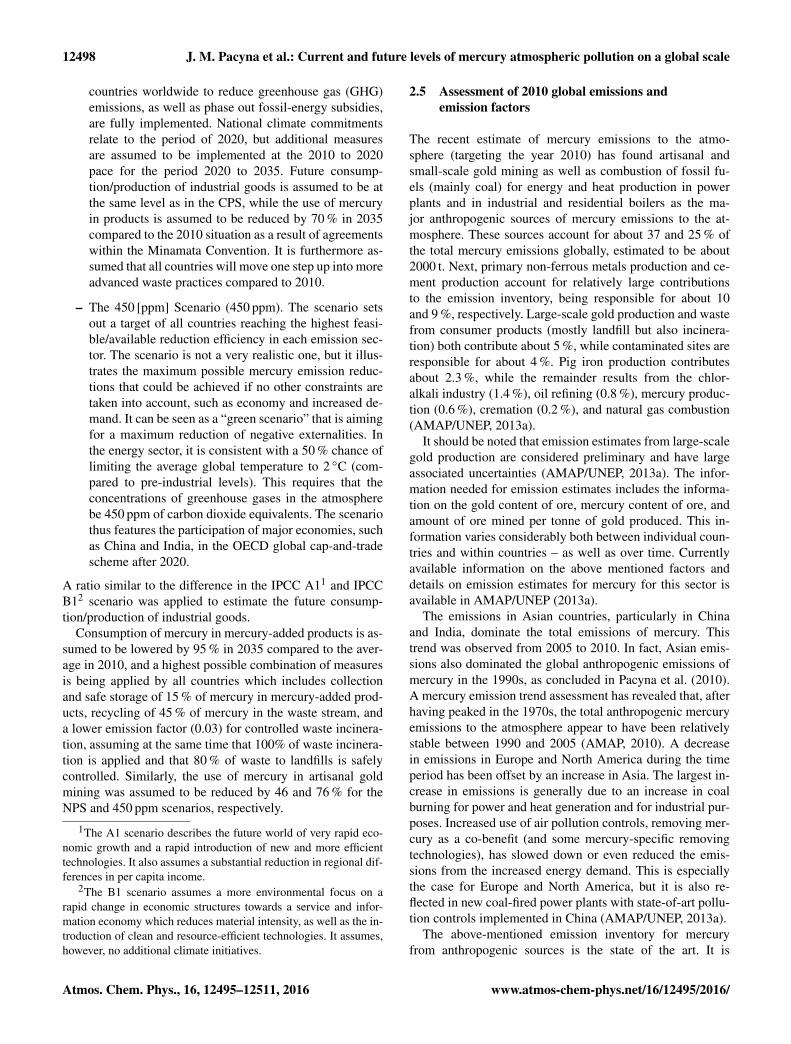
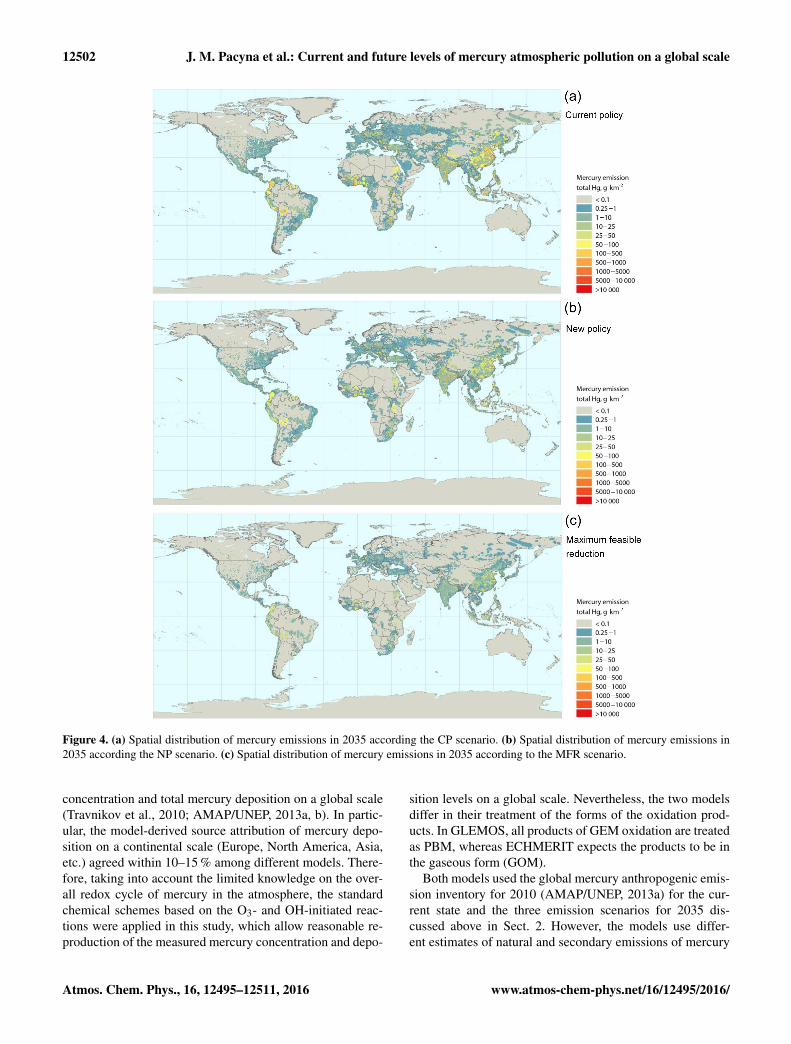
Spatial distributions of emissions within various scenariosin 2035 are presented in Fig. 4a, b, and c for the CP, NP, andMFR scenarios, respectively.
3 Model evaluation of future scenarios of mercurypollution
Various models were used to estimate current atmosphericconcentrations and deposition of mercury worldwide, as wellas atmospheric deposition of the contaminant in the future.
3.1 Model description
Two global chemical transport models (GLEMOS and ECH-MERIT) have been used for the evaluation of future mercurypollution levels considering future emission scenarios.
GLEMOS (Global EMEP Multi-media Modeling System)is a multi-scale chemical transport model developed for the
Atmos. Chem. Phys., 16, 12495–12511, 2016 www.atmos-chem-phys.net/16/12495/2016/
J. M. Pacyna et al.: Current and future levels of mercury atmospheric pollution on a global scale 12501
Figure 3. Region-specific emissions of mercury under variousemission scenarios in 2035.
simulation of environmental dispersion and cycling of dif-ferent chemicals including mercury (Travnikov and Ilyin,2009). The model simulates atmospheric transport, chemi-cal transformations, and deposition of three mercury species(gaseous elemental mercury, GEM; gaseous oxidized mer-cury, GOM; and particulate-bound mercury, PBM). The at-mospheric transport of tracers is driven by meteorologicalfields generated by the Weather Research and Forecasting(WRF) modelling system (Skamarock et al., 2007) and fedby the operational analysis data from ECMWF (ECMWF,2016). The model has a horizontal resolution of 1◦× 1◦.Vertically, the model domain reaches 10 hPa and consists of20 irregular terrain-following sigma layers. The atmosphericchemical scheme includes mercury redox chemical reactionsin both the gaseous and aqueous phase (cloud water). Oxi-dized mercury species (GOM and PBM) are removed fromthe atmosphere by wet deposition. All three species interactwith the ground, contributing to dry deposition.
ECHMERIT is a global online chemical transport modelbased on the fifth-generation global circulation modelECHAM, with a highly flexible chemistry mechanism de-signed to facilitate the investigation of tropospheric mercurychemistry (Jung et al., 2009; De Simone et al., 2014). ECH-MERIT uses T42 horizontal resolution (roughly 2.8◦× 2.8◦
at the Equator) and 19 vertical non-equidistant hybrid sigmalevels up to 10 hPa. The model simulates the physical andchemical process of three mercury species (GEM, GOM, andPBM). Monthly biomass burning mercury emissions fromthe FINNv1 inventory are mapped offline to the model (DeSimone et al., 2015), whereas emissions from oceans are
calculated online, as discussed in De Simone et al. (2014).Prompt re-emission of a fixed fraction (20 %) of depositedmercury is also applied in the model to account for reductionand evasion processes which govern mercury short-term cy-cling between the atmosphere and terrestrial reservoirs (Selinet al., 2008). This fraction is increased to 60 % for snow-covered land and the ice-covered seas. Mercury removal pro-cesses include both dry and wet deposition of reactive species(GOM and PBM). GEM does not contribute to dry deposi-tion. The model was run in reanalysis mode using data fromthe ERA-INTERIM project (ECMWF).
Chemical transformations play important role in disper-sion and cycling of mercury in the atmosphere. However, thecurrent understanding of the mercury oxidation and reduc-tion chemistry in the atmosphere contains significant uncer-tainty. The oxidation of GEM by Br halogens is generallyaccepted as a dominant oxidation pathway in a number of at-mospheric environments, including the polar regions, marineboundary layer, and the upper troposphere/lower stratosphere(Hedgecock and Pirrone, 2004; Holmes et al., 2009; Lymanand Jaffe, 2011; Obrist et al., 2011; Gratz et al., 2015). How-ever, very little data exist with respect to this mechanism inthe global atmosphere (Kos et al., 2013). On the other hand,in spite of theoretical doubts about viability and significanceof GEM oxidation by O3 and the OH radical under the at-mospheric conditions (Calver and Lindberg, 2005; Hynes etal., 2009), there are ample possibilities of the occurrence ofcomplex reactions involving these oxidants in the polluted at-mosphere in the presence of aerosol particles and secondaryreactants (Snider et al., 2008; Cremer et al., 2008; Rutteret al., 2012; Subir et al., 2012; Ariya et al., 2015). Otherpossible reactants that can contribute to mercury transfor-mation in the atmosphere include Cl2 (Ariya et al., 2002),H2O2 (Tokos et al., 1998), HCl (Hall and Bloom, 1993), andNO3 (Peleg et al., 2015). However, exact mechanisms, re-action products, and relative importance of the reactions arestill poorly known. More detailed discussions of uncertain-ties associated with mercury atmospheric chemistry and itsimplementation in contemporary chemical transport modelscan be found in Lin et al. (2006), Subir et al. (2011, 2012),Gustin et al. (2015), and Ariya et al. (2015).
The majority of chemical transport models that are usedfor simulations of mercury dispersion on global and regionalscales assume the O3- and/or OH-initiated reactions as themain pathways of GEM oxidation in the free troposphere(Christensen et al., 2004; Travnikov and Ilyin, 2009; Panet al., 2010; Baker and Bash, 2012; Kos et al., 2013; Gen-carelli et al., 2014; De Simone et al., 2015). The Br oxi-dation mechanism is also often applied as an option (Leiet al., 2013; Dastoor et al., 2015) or as the only oxidationpathway for the whole atmosphere (Holmes et al., 2010; So-erensen et al., 2010; Amos et al., 2012; Shah et al., 2016). Itshould be noted that recent comparison studies have showedthat models with diverse formulations of atmospheric chem-istry were able to simulate realistic distributions of GEM air
www.atmos-chem-phys.net/16/12495/2016/ Atmos. Chem. Phys., 16, 12495–12511, 2016
12502 J. M. Pacyna et al.: Current and future levels of mercury atmospheric pollution on a global scale
Figure 4. (a) Spatial distribution of mercury emissions in 2035 according the CP scenario. (b) Spatial distribution of mercury emissions in2035 according the NP scenario. (c) Spatial distribution of mercury emissions in 2035 according to the MFR scenario.
concentration and total mercury deposition on a global scale(Travnikov et al., 2010; AMAP/UNEP, 2013a, b). In partic-ular, the model-derived source attribution of mercury depo-sition on a continental scale (Europe, North America, Asia,etc.) agreed within 10–15 % among different models. There-fore, taking into account the limited knowledge on the over-all redox cycle of mercury in the atmosphere, the standardchemical schemes based on the O3- and OH-initiated reac-tions were applied in this study, which allow reasonable re-production of the measured mercury concentration and depo-
sition levels on a global scale. Nevertheless, the two modelsdiffer in their treatment of the forms of the oxidation prod-ucts. In GLEMOS, all products of GEM oxidation are treatedas PBM, whereas ECHMERIT expects the products to be inthe gaseous form (GOM).
Both models used the global mercury anthropogenic emis-sion inventory for 2010 (AMAP/UNEP, 2013a) for the cur-rent state and the three emission scenarios for 2035 dis-cussed above in Sect. 2. However, the models use differ-ent estimates of natural and secondary emissions of mercury
Atmos. Chem. Phys., 16, 12495–12511, 2016 www.atmos-chem-phys.net/16/12495/2016/
J. M. Pacyna et al.: Current and future levels of mercury atmospheric pollution on a global scale 12503
to the atmosphere. GLEMOS utilized prescribed monthlymean fields of mercury emission fluxes from geogenic andlegacy sources (Travnikov and Ilyin, 2009), whereas ECH-MERIT applied parameterization of dynamic air–seawaterexchange as a function of ambient parameters but using aconstant value of mercury concentration in seawater (De Si-mone et al., 2014). As a result, the total estimate of mer-cury global natural and secondary emissions by ECHMERIT(8600 t year−1) is a factor of 2 higher than the total valueused in GLEMOS (3995 t year−1). The higher emissions inthe former model are compensated for by higher depositionof GEM in the air–surface exchange process. Therefore, thenet fluxes of mercury exchange between the atmosphere andthe surface are comparable in the models.
Meteorological data for 2013 were used in all simulationsto exclude the influence of inter-annual meteorological vari-ability on the analysis results. Each model run consisted ofa multi-year spin-up to reach steady-state conditions and a1-year control simulation for the analysis. It should be notedthat the geogenic and legacy sources were assumed to be un-changed during the simulation period (2013–2035) by usingstatic fluxes of natural and secondary emissions in one modeland constant mercury concentration in seawater in the other.Thus, the results presented reflect the response of mercuryatmospheric deposition to changes in direct anthropogenicemissions and do not take into account the possible feed-back of the ocean and terrestrial reservoirs to these changes.Indeed, application of an atmospheric chemical transportmodel coupled with a mechanistic model of mercury cy-cling in soil shows that reductions in anthropogenic mercuryemissions will lead to rapid decrease in mercury emissionsfrom soil (Smith-Downey et al., 2010). In addition, Amoset al. (2013) applied a fully coupled biogeochemical modeland showed that even if anthropogenic emissions stay un-changeable, mercury deposition will continue to increase dueto effect of the legacy of anthropogenic production emis-sions accumulated in the ocean. Generally, the atmosphereresponds quickly to the termination of future emissions, butlong-term changes are sensitive to a number of factors, in-cluding historical changes in anthropogenic emissions, air–sea exchange, and mercury burial in deep ocean and coastalsediments (Amos et al., 2014, 2015).
3.2 Assessment of current air concentrations andatmospheric deposition of mercury
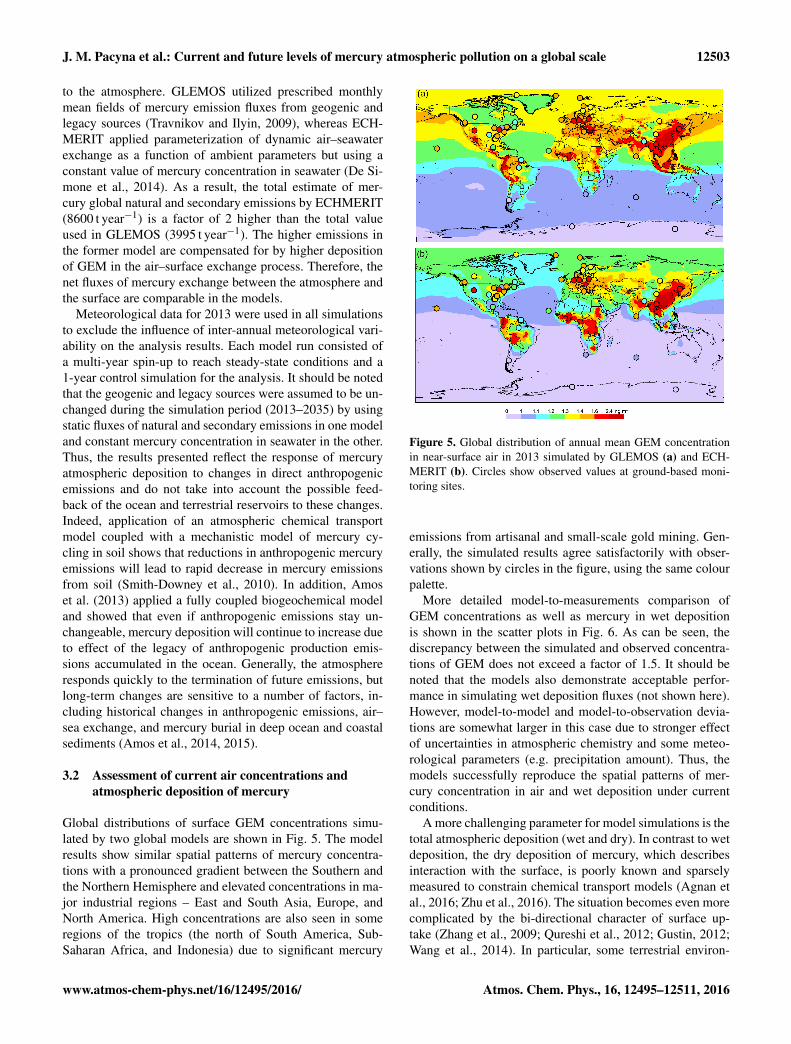
Global distributions of surface GEM concentrations simu-lated by two global models are shown in Fig. 5. The modelresults show similar spatial patterns of mercury concentra-tions with a pronounced gradient between the Southern andthe Northern Hemisphere and elevated concentrations in ma-jor industrial regions – East and South Asia, Europe, andNorth America. High concentrations are also seen in someregions of the tropics (the north of South America, Sub-Saharan Africa, and Indonesia) due to significant mercury
Figure 5. Global distribution of annual mean GEM concentrationin near-surface air in 2013 simulated by GLEMOS (a) and ECH-MERIT (b). Circles show observed values at ground-based moni-toring sites.
emissions from artisanal and small-scale gold mining. Gen-erally, the simulated results agree satisfactorily with obser-vations shown by circles in the figure, using the same colourpalette.
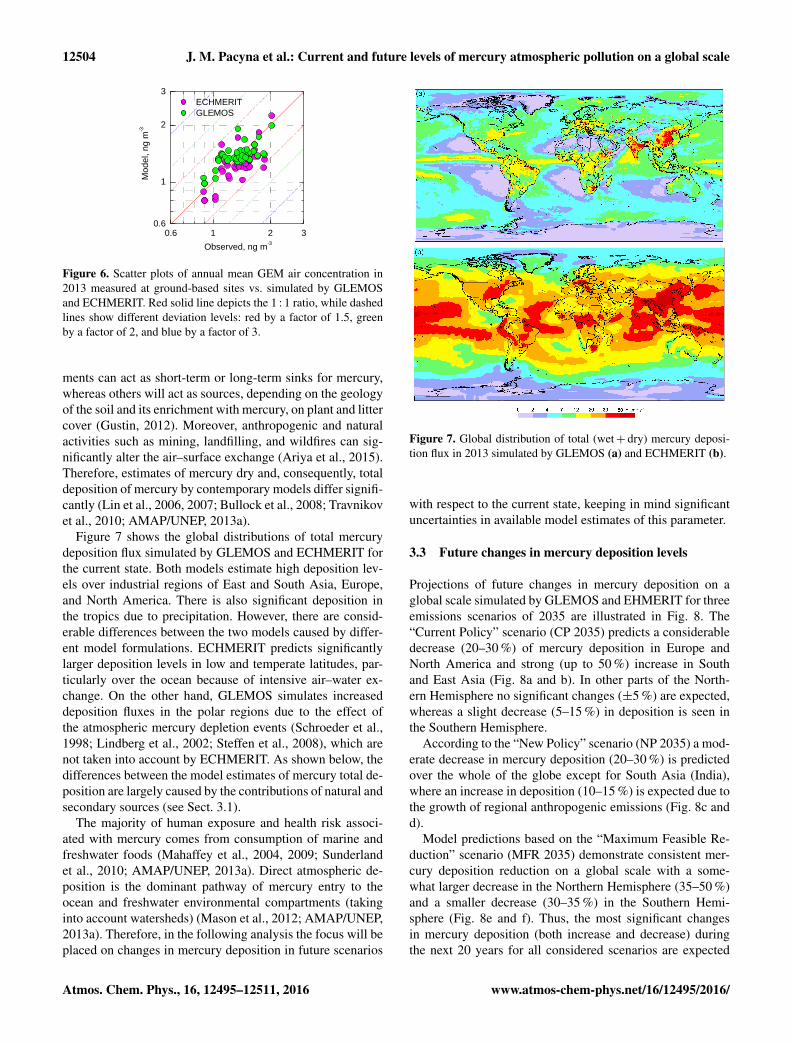
More detailed model-to-measurements comparison ofGEM concentrations as well as mercury in wet depositionis shown in the scatter plots in Fig. 6. As can be seen, thediscrepancy between the simulated and observed concentra-tions of GEM does not exceed a factor of 1.5. It should benoted that the models also demonstrate acceptable perfor-mance in simulating wet deposition fluxes (not shown here).However, model-to-model and model-to-observation devia-tions are somewhat larger in this case due to stronger effectof uncertainties in atmospheric chemistry and some meteo-rological parameters (e.g. precipitation amount). Thus, themodels successfully reproduce the spatial patterns of mer-cury concentration in air and wet deposition under currentconditions.
A more challenging parameter for model simulations is thetotal atmospheric deposition (wet and dry). In contrast to wetdeposition, the dry deposition of mercury, which describesinteraction with the surface, is poorly known and sparselymeasured to constrain chemical transport models (Agnan etal., 2016; Zhu et al., 2016). The situation becomes even morecomplicated by the bi-directional character of surface up-take (Zhang et al., 2009; Qureshi et al., 2012; Gustin, 2012;Wang et al., 2014). In particular, some terrestrial environ-
www.atmos-chem-phys.net/16/12495/2016/ Atmos. Chem. Phys., 16, 12495–12511, 2016
12504 J. M. Pacyna et al.: Current and future levels of mercury atmospheric pollution on a global scale
0.6 1 2 30.6
1
2
3
ECHMERIT
GLEMOS
Model, n
g m
- 3
Observed, ng m- 3
1
Figure 6. Scatter-plots of annual mean GEM air concentration in 2013 measured at ground-based sites (Annex A, 2 Table A.1) vs. simulated by GLEMOS and ECHMERIT. Red solid line depicts the 1:1 ratio; dashed lines show 3 different deviation levels: red – by factor of 1.5, green – by factor of 2, blue – by factor of 3. 4
Figure 6. Scatter plots of annual mean GEM air concentration in2013 measured at ground-based sites vs. simulated by GLEMOSand ECHMERIT. Red solid line depicts the 1 : 1 ratio, while dashedlines show different deviation levels: red by a factor of 1.5, greenby a factor of 2, and blue by a factor of 3.
ments can act as short-term or long-term sinks for mercury,whereas others will act as sources, depending on the geologyof the soil and its enrichment with mercury, on plant and littercover (Gustin, 2012). Moreover, anthropogenic and naturalactivities such as mining, landfilling, and wildfires can sig-nificantly alter the air–surface exchange (Ariya et al., 2015).Therefore, estimates of mercury dry and, consequently, totaldeposition of mercury by contemporary models differ signifi-cantly (Lin et al., 2006, 2007; Bullock et al., 2008; Travnikovet al., 2010; AMAP/UNEP, 2013a).
Figure 7 shows the global distributions of total mercurydeposition flux simulated by GLEMOS and ECHMERIT forthe current state. Both models estimate high deposition lev-els over industrial regions of East and South Asia, Europe,and North America. There is also significant deposition inthe tropics due to precipitation. However, there are consid-erable differences between the two models caused by differ-ent model formulations. ECHMERIT predicts significantlylarger deposition levels in low and temperate latitudes, par-ticularly over the ocean because of intensive air–water ex-change. On the other hand, GLEMOS simulates increaseddeposition fluxes in the polar regions due to the effect ofthe atmospheric mercury depletion events (Schroeder et al.,1998; Lindberg et al., 2002; Steffen et al., 2008), which arenot taken into account by ECHMERIT. As shown below, thedifferences between the model estimates of mercury total de-position are largely caused by the contributions of natural andsecondary sources (see Sect. 3.1).
The majority of human exposure and health risk associ-ated with mercury comes from consumption of marine andfreshwater foods (Mahaffey et al., 2004, 2009; Sunderlandet al., 2010; AMAP/UNEP, 2013a). Direct atmospheric de-position is the dominant pathway of mercury entry to theocean and freshwater environmental compartments (takinginto account watersheds) (Mason et al., 2012; AMAP/UNEP,2013a). Therefore, in the following analysis the focus will beplaced on changes in mercury deposition in future scenarios
Figure 7. Global distribution of total (wet+ dry) mercury deposi-tion flux in 2013 simulated by GLEMOS (a) and ECHMERIT (b).
with respect to the current state, keeping in mind significantuncertainties in available model estimates of this parameter.
3.3 Future changes in mercury deposition levels
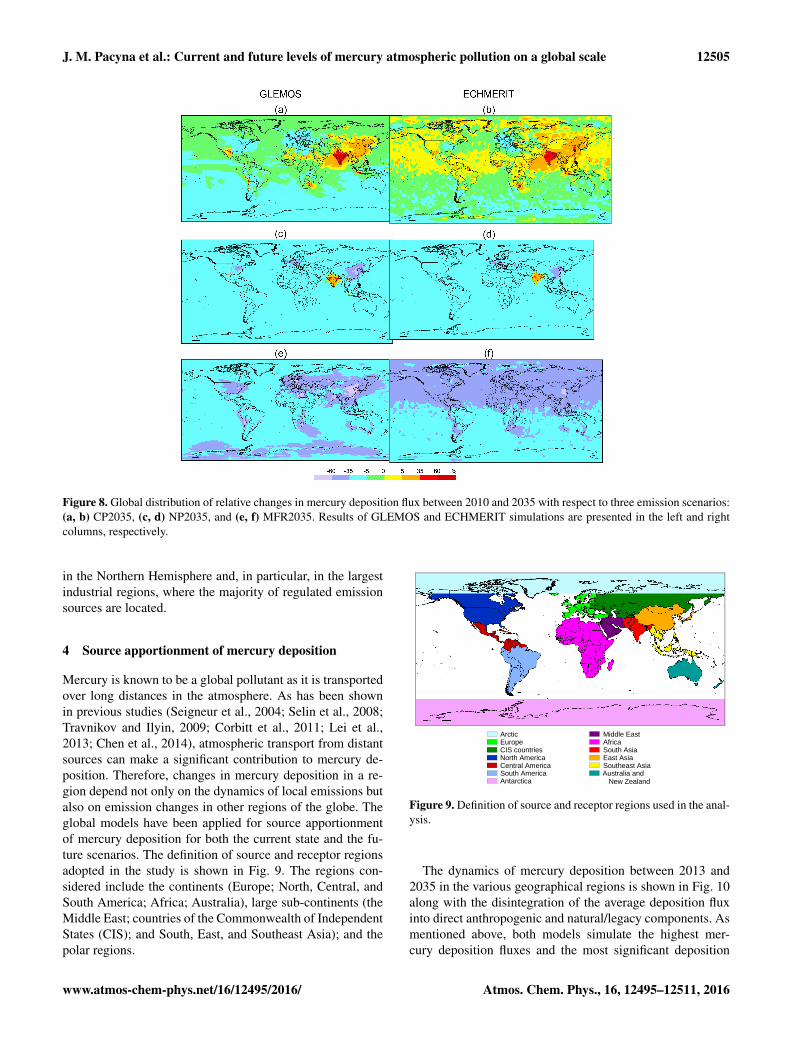
Projections of future changes in mercury deposition on aglobal scale simulated by GLEMOS and EHMERIT for threeemissions scenarios of 2035 are illustrated in Fig. 8. The“Current Policy” scenario (CP 2035) predicts a considerabledecrease (20–30 %) of mercury deposition in Europe andNorth America and strong (up to 50 %) increase in Southand East Asia (Fig. 8a and b). In other parts of the North-ern Hemisphere no significant changes (±5 %) are expected,whereas a slight decrease (5–15 %) in deposition is seen inthe Southern Hemisphere.
According to the “New Policy” scenario (NP 2035) a mod-erate decrease in mercury deposition (20–30 %) is predictedover the whole of the globe except for South Asia (India),where an increase in deposition (10–15 %) is expected due tothe growth of regional anthropogenic emissions (Fig. 8c andd).
Model predictions based on the “Maximum Feasible Re-duction” scenario (MFR 2035) demonstrate consistent mer-cury deposition reduction on a global scale with a some-what larger decrease in the Northern Hemisphere (35–50 %)and a smaller decrease (30–35 %) in the Southern Hemi-sphere (Fig. 8e and f). Thus, the most significant changesin mercury deposition (both increase and decrease) duringthe next 20 years for all considered scenarios are expected
Atmos. Chem. Phys., 16, 12495–12511, 2016 www.atmos-chem-phys.net/16/12495/2016/
J. M. Pacyna et al.: Current and future levels of mercury atmospheric pollution on a global scale 12505
Figure 8. Global distribution of relative changes in mercury deposition flux between 2010 and 2035 with respect to three emission scenarios:(a, b) CP2035, (c, d) NP2035, and (e, f) MFR2035. Results of GLEMOS and ECHMERIT simulations are presented in the left and rightcolumns, respectively.
in the Northern Hemisphere and, in particular, in the largestindustrial regions, where the majority of regulated emissionsources are located.
4 Source apportionment of mercury deposition
Mercury is known to be a global pollutant as it is transportedover long distances in the atmosphere. As has been shownin previous studies (Seigneur et al., 2004; Selin et al., 2008;Travnikov and Ilyin, 2009; Corbitt et al., 2011; Lei et al.,2013; Chen et al., 2014), atmospheric transport from distantsources can make a significant contribution to mercury de-position. Therefore, changes in mercury deposition in a re-gion depend not only on the dynamics of local emissions butalso on emission changes in other regions of the globe. Theglobal models have been applied for source apportionmentof mercury deposition for both the current state and the fu-ture scenarios. The definition of source and receptor regionsadopted in the study is shown in Fig. 9. The regions con-sidered include the continents (Europe; North, Central, andSouth America; Africa; Australia), large sub-continents (theMiddle East; countries of the Commonwealth of IndependentStates (CIS); and South, East, and Southeast Asia); and thepolar regions.
1
Europe Africa
Middle East
North America
Central America
South America
South Asia
East Asia
Southeast Asia
Australia and New Zealand
CIS countries
Antarctica
Arctic
2
Figure 9 . Definition of source and receptor regions used in the analysis. 3
Figure 9. Definition of source and receptor regions used in the anal-ysis.
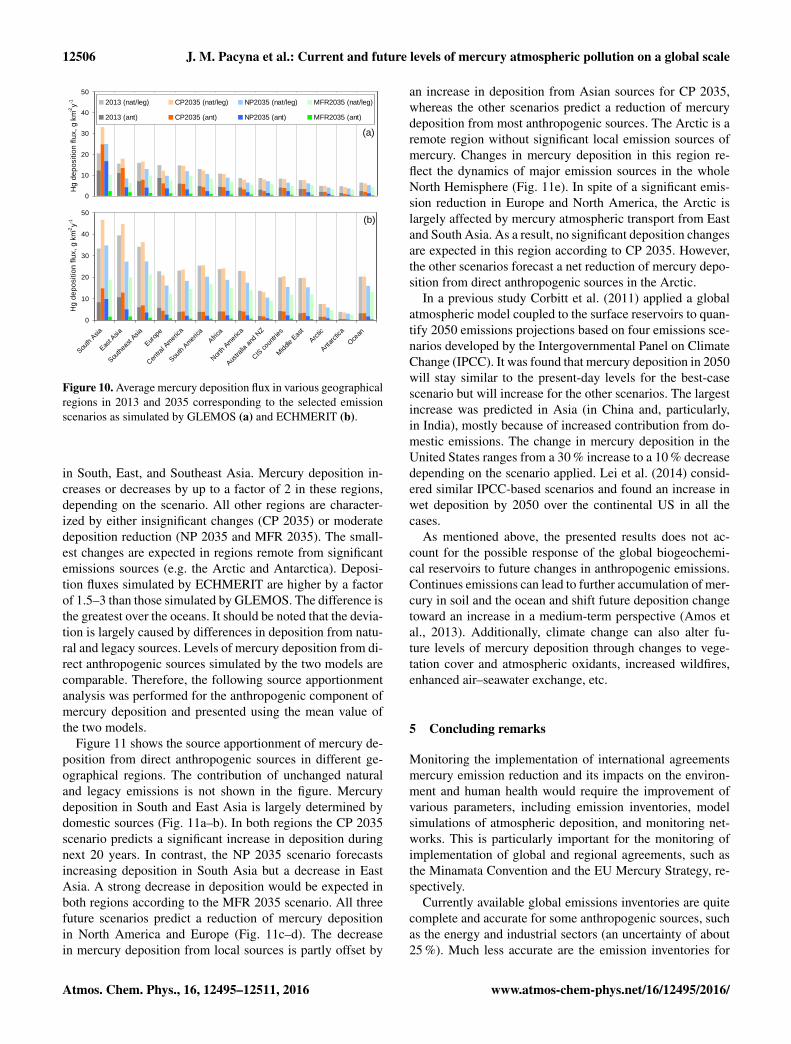
The dynamics of mercury deposition between 2013 and2035 in the various geographical regions is shown in Fig. 10along with the disintegration of the average deposition fluxinto direct anthropogenic and natural/legacy components. Asmentioned above, both models simulate the highest mer-cury deposition fluxes and the most significant deposition
www.atmos-chem-phys.net/16/12495/2016/ Atmos. Chem. Phys., 16, 12495–12511, 2016
12506 J. M. Pacyna et al.: Current and future levels of mercury atmospheric pollution on a global scale
a0
10
20
30
40
50
2013 (nat/leg) CP2035 (nat/leg) NP2035 (nat/leg) MFR2035 (nat/leg)
2013 (ant) CP2035 (ant) NP2035 (ant) MFR2035 (ant)
1
b
0
10
20
30
40
50
Sou
th A
sia
Eas
t Asia
Sou
thea
st A
sia
Eur
ope
Cen
tral A
mer
ica
Sou
th A
mer
ica
Afri
ca
Nor
th A
mer
ica
Aus
tralia
and
NZ
CIS
cou
ntrie
s
Mid
dle
Eas
t
Arc
tic
Ant
arct
ica
Oce
an
Hg
de
po
sitio
n f
lux,
g k
m 2-
y
2 3 Figure 10. Average mercury deposition flux in various geographical regions in 2013 and 2035 4 corresponding to the selected emission scenarios as simulated by GLEMOS (a) and ECHMERIT (b). 5
- 1H
g d
ep
ositio
n f
lux,
gkm
2- y
- 1
(a)
(b)
Figure 10. Average mercury deposition flux in various geographicalregions in 2013 and 2035 corresponding to the selected emissionscenarios as simulated by GLEMOS (a) and ECHMERIT (b).
in South, East, and Southeast Asia. Mercury deposition in-creases or decreases by up to a factor of 2 in these regions,depending on the scenario. All other regions are character-ized by either insignificant changes (CP 2035) or moderatedeposition reduction (NP 2035 and MFR 2035). The small-est changes are expected in regions remote from significantemissions sources (e.g. the Arctic and Antarctica). Deposi-tion fluxes simulated by ECHMERIT are higher by a factorof 1.5–3 than those simulated by GLEMOS. The difference isthe greatest over the oceans. It should be noted that the devia-tion is largely caused by differences in deposition from natu-ral and legacy sources. Levels of mercury deposition from di-rect anthropogenic sources simulated by the two models arecomparable. Therefore, the following source apportionmentanalysis was performed for the anthropogenic component ofmercury deposition and presented using the mean value ofthe two models.
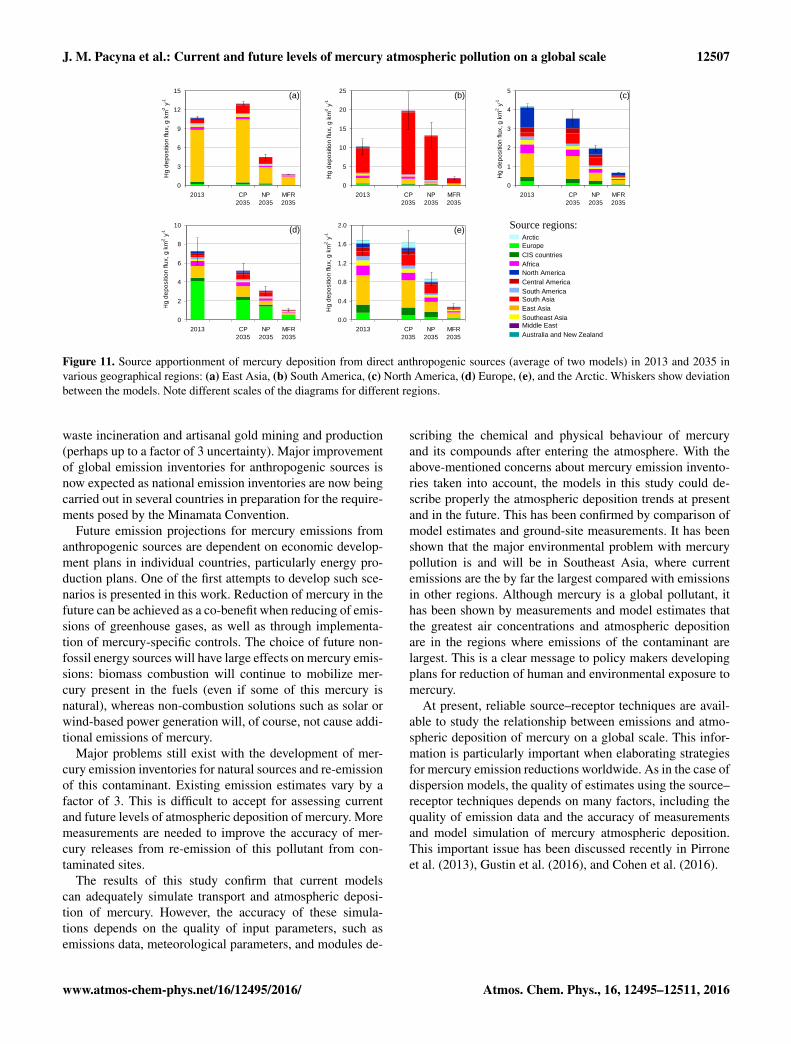
Figure 11 shows the source apportionment of mercury de-position from direct anthropogenic sources in different ge-ographical regions. The contribution of unchanged naturaland legacy emissions is not shown in the figure. Mercurydeposition in South and East Asia is largely determined bydomestic sources (Fig. 11a–b). In both regions the CP 2035scenario predicts a significant increase in deposition duringnext 20 years. In contrast, the NP 2035 scenario forecastsincreasing deposition in South Asia but a decrease in EastAsia. A strong decrease in deposition would be expected inboth regions according to the MFR 2035 scenario. All threefuture scenarios predict a reduction of mercury depositionin North America and Europe (Fig. 11c–d). The decreasein mercury deposition from local sources is partly offset by
an increase in deposition from Asian sources for CP 2035,whereas the other scenarios predict a reduction of mercurydeposition from most anthropogenic sources. The Arctic is aremote region without significant local emission sources ofmercury. Changes in mercury deposition in this region re-flect the dynamics of major emission sources in the wholeNorth Hemisphere (Fig. 11e). In spite of a significant emis-sion reduction in Europe and North America, the Arctic islargely affected by mercury atmospheric transport from Eastand South Asia. As a result, no significant deposition changesare expected in this region according to CP 2035. However,the other scenarios forecast a net reduction of mercury depo-sition from direct anthropogenic sources in the Arctic.
In a previous study Corbitt et al. (2011) applied a globalatmospheric model coupled to the surface reservoirs to quan-tify 2050 emissions projections based on four emissions sce-narios developed by the Intergovernmental Panel on ClimateChange (IPCC). It was found that mercury deposition in 2050will stay similar to the present-day levels for the best-casescenario but will increase for the other scenarios. The largestincrease was predicted in Asia (in China and, particularly,in India), mostly because of increased contribution from do-mestic emissions. The change in mercury deposition in theUnited States ranges from a 30 % increase to a 10 % decreasedepending on the scenario applied. Lei et al. (2014) consid-ered similar IPCC-based scenarios and found an increase inwet deposition by 2050 over the continental US in all thecases.
As mentioned above, the presented results does not ac-count for the possible response of the global biogeochemi-cal reservoirs to future changes in anthropogenic emissions.Continues emissions can lead to further accumulation of mer-cury in soil and the ocean and shift future deposition changetoward an increase in a medium-term perspective (Amos etal., 2013). Additionally, climate change can also alter fu-ture levels of mercury deposition through changes to vege-tation cover and atmospheric oxidants, increased wildfires,enhanced air–seawater exchange, etc.
5 Concluding remarks
Monitoring the implementation of international agreementsmercury emission reduction and its impacts on the environ-ment and human health would require the improvement ofvarious parameters, including emission inventories, modelsimulations of atmospheric deposition, and monitoring net-works. This is particularly important for the monitoring ofimplementation of global and regional agreements, such asthe Minamata Convention and the EU Mercury Strategy, re-spectively.
Currently available global emissions inventories are quitecomplete and accurate for some anthropogenic sources, suchas the energy and industrial sectors (an uncertainty of about25 %). Much less accurate are the emission inventories for
Atmos. Chem. Phys., 16, 12495–12511, 2016 www.atmos-chem-phys.net/16/12495/2016/
J. M. Pacyna et al.: Current and future levels of mercury atmospheric pollution on a global scale 12507
0
3
6
9
12
15
2013 CP
2035
NP
2035
MFR
2035
0
5
10
15
20
25
2013 CP
2035
NP
2035
MFR
2035
0
1
2
3
4
5
2013 CP
2035
NP
2035
MFR
2035
0
2
4
6
8
10
2013 CP
2035
NP
2035
MFR
2035
Hg
de
po
sitio
n flu
x, g
km
2-
y
0.0
0.4
0.8
1.2
1.6
2.0
2013 CP
2035
NP
2035
MFR
2035
Source regions:
Europe
Africa
North America
Central America
Australia and New Zealand
South Asia
East Asia
Southeast Asia
Middle East
CIS countries
South America
Arctic
1 Figure 11. Source apportionment of mercury deposition from direct anthropogenic sources (average of two models) in 2 2013 and 2035 in various geographical regions: (a) – East Asia; (b) – South America; (c) – North America a; (d) – 3 Europe; (e) – Arctic. Whiskers show deviation between the models. Note different scales of the diagrams for different 4 regions. 5
(a) (b) (c)
(d) (e)1- H
g d
ep
ositio
n flu
x, g
km
2- y
1-
Hg
de
po
sitio
n flu
x, g
km
2- y
1- H
g d
ep
ositio
n flu
x, g
km
2- y
1-
Hg
de
po
sitio
n flu
x, g
km
2- y
1-
Figure 11. Source apportionment of mercury deposition from direct anthropogenic sources (average of two models) in 2013 and 2035 invarious geographical regions: (a) East Asia, (b) South America, (c) North America, (d) Europe, (e), and the Arctic. Whiskers show deviationbetween the models. Note different scales of the diagrams for different regions.
waste incineration and artisanal gold mining and production(perhaps up to a factor of 3 uncertainty). Major improvementof global emission inventories for anthropogenic sources isnow expected as national emission inventories are now beingcarried out in several countries in preparation for the require-ments posed by the Minamata Convention.
Future emission projections for mercury emissions fromanthropogenic sources are dependent on economic develop-ment plans in individual countries, particularly energy pro-duction plans. One of the first attempts to develop such sce-narios is presented in this work. Reduction of mercury in thefuture can be achieved as a co-benefit when reducing of emis-sions of greenhouse gases, as well as through implementa-tion of mercury-specific controls. The choice of future non-fossil energy sources will have large effects on mercury emis-sions: biomass combustion will continue to mobilize mer-cury present in the fuels (even if some of this mercury isnatural), whereas non-combustion solutions such as solar orwind-based power generation will, of course, not cause addi-tional emissions of mercury.
Major problems still exist with the development of mer-cury emission inventories for natural sources and re-emissionof this contaminant. Existing emission estimates vary by afactor of 3. This is difficult to accept for assessing currentand future levels of atmospheric deposition of mercury. Moremeasurements are needed to improve the accuracy of mer-cury releases from re-emission of this pollutant from con-taminated sites.
The results of this study confirm that current modelscan adequately simulate transport and atmospheric deposi-tion of mercury. However, the accuracy of these simula-tions depends on the quality of input parameters, such asemissions data, meteorological parameters, and modules de-
scribing the chemical and physical behaviour of mercuryand its compounds after entering the atmosphere. With theabove-mentioned concerns about mercury emission invento-ries taken into account, the models in this study could de-scribe properly the atmospheric deposition trends at presentand in the future. This has been confirmed by comparison ofmodel estimates and ground-site measurements. It has beenshown that the major environmental problem with mercurypollution is and will be in Southeast Asia, where currentemissions are the by far the largest compared with emissionsin other regions. Although mercury is a global pollutant, ithas been shown by measurements and model estimates thatthe greatest air concentrations and atmospheric depositionare in the regions where emissions of the contaminant arelargest. This is a clear message to policy makers developingplans for reduction of human and environmental exposure tomercury.
At present, reliable source–receptor techniques are avail-able to study the relationship between emissions and atmo-spheric deposition of mercury on a global scale. This infor-mation is particularly important when elaborating strategiesfor mercury emission reductions worldwide. As in the case ofdispersion models, the quality of estimates using the source–receptor techniques depends on many factors, including thequality of emission data and the accuracy of measurementsand model simulation of mercury atmospheric deposition.This important issue has been discussed recently in Pirroneet al. (2013), Gustin et al. (2016), and Cohen et al. (2016).
www.atmos-chem-phys.net/16/12495/2016/ Atmos. Chem. Phys., 16, 12495–12511, 2016
12508 J. M. Pacyna et al.: Current and future levels of mercury atmospheric pollution on a global scale
The Supplement related to this article is available onlineat doi:10.5194/acp-16-12495-2016-supplement.
Acknowledgements. The results presented in this paper were ob-tained within the EU Global Mercury Observation System (GMOS)project (http://www.gmos.eu). The GMOS project was carried outwith financial support from the EC (grant agreement no. 265113).The authors are grateful for this support. Financial and other contri-butions to the development of the methodology for emission inven-tories and projections from UNEP Chemicals and AMAP are alsoacknowledged.
The authors would also like to thank other scientists from theGMOS project for the possibility of using the measurement datawhen discussing the outcome of model simulations with monitoreddata.
Edited by: R. EbinghausReviewed by: two anonymous referees
References
Agnan, Y., Le Dantec, T., Moore, C. W., Edwards, G. C., and ObristD.: New Constraints on Terrestrial Surface–Atmosphere Fluxesof Gaseous Elemental Mercury Using a Global Database, Envi-ron. Sci. Technol., 50, 507–524, 2016.
AMAP: AMAP Assessment 2009: Human health in the Arctic, Arc-tic Monitoring and Assessment Programme (AMAP), Oslo, Nor-way, 2009.
AMAP: Updating Historical Global Inventories of AnthropogenicMercury Emissions to Air, AMAP Technical Report No. 3, Arc-tic Monitoring and Assessment Programme (AMAP), Oslo, Nor-way, 2010.
AMAP/UNEP: Technical Background Report for the Global Mer-cury Assessment 2013, Arctic Monitoring and AssessmentProgramme, Oslo, Norway/UNEP Chemicals Branch, Geneva,Switzerland, vi+ 263 pp., available at: http://www.amap.no/documents/download/1265 (last access: 12 June 2015), 2013a.
AMAP/UNEP: Geospatially distributed mercury emissions dataset2010v1, http://www.amap.no/mercury-emissions (last access: 1August 2016), 2013b.
Ambio: Special issue: Swain, E. B., Jakus, P. M., Rice, G., Lupi,F., Maxson, P. A., Pacyna, J. M., Penn, A. F., Spiegel, S. J., andVeiga, M. M.: Socioeconomic consequences of mercury use andpollution, Ambio, 36, 45–61, 2007.
Amos, H. M., Jacob, D. J., Holmes, C. D., Fisher, J. A., Wang,Q., Yantosca, R. M., Corbitt, E. S., Galarneau, E., Rutter, A. P.,Gustin, M. S., Steffen, A., Schauer, J. J., Graydon, J. A., Louis,V. L. St., Talbot, R. W., Edgerton, E. S., Zhang, Y., and Sunder-land, E. M.: Gas-particle partitioning of atmospheric Hg(II) andits effect on global mercury deposition, Atmos. Chem. Phys., 12,591–603, doi:10.5194/acp-12-591-2012, 2012.
Amos, H. M., Jacob, D. J., Streets, D. G., and Sunderland, E.M.: Legacy impacts of all-time anthropogenic emissions on theglobal mercury cycle, Global Biogeochem. Cy., 27, 410–421,2013.
Amos, H. M., Jacob, D. J., Kocman, D., Horowitz, H. M., Zhang,Y., Dutkiewicz, S., Horvat, M., Corbitt, E. S., Krabbenhoft, D. P.,and Sunderland, E. M.: Global Biogeochemical Implications ofMercury Discharges from Rivers and Sediment Burial, Environ.Sci. Technol., 48, 9514–9522, 2014.
Amos, H. M., Sonke, J. E., Obrist, D., Robins, N., Hagan, N.,Horowitz, H. M., Mason, R. P., Witt, M., Hedgecock, I. M., Cor-bitt, E. S., and Sunderland, E. M.: Observational and ModelingConstraints on Global Anthropogenic Enrichment of Mercury,Environ. Sci. Technol., 49, 4036–4047, 2015.
Ariya, P. A., Khalizov, A., and Gidas, A.: Reactions of GaseousMercury with Atomic and Molecular Halogens: Kinetics, Prod-uct Studies, and Atmospheric Implications, J. Phys. Chem. A,106, 7310–7320, 2002.
Ariya, P. A., Amyot, M., Dastoor, A., Deeds, D., Feinberg, A., Kos,G., Poulain, A., Ryjkov, A., Semeniuk, K., Subir, M., and Toy-ota, K.: Mercury Physicochemical and Biogeochemical Trans-formation in the Atmosphere and at Atmospheric Interfaces:A Review and Future Directions, Chem. Rev., 15, 3760–3802,doi:10.1021/cr500667e, 2015.
Baker, K. R. and Bash, J. O.: Regional Scale Photochemical ModelEvaluation of Total Mercury Wet Deposition and Speciated Am-bient Mercury, Atmos. Environ., 49, 151–162, 2012.
Bullock, O. R., Atkinson, D., Braverman, T., Civerolo, K., Dastoor,A., Davignon, D., Ku, J.-Y., Lohman, K., Myers, T. C., Park,R. J., Seigneur, C., Selin, N. E., Sistla, G., and Vijayaragha-van, K.: The North American Mercury Model IntercomparisonStudy (NAMMIS): Study description and model-to-model com-parisons, J. Geophys. Res., 113, D17310, 2008.
Calvert, J. G. and Lindberg, S. E.: echanisms of mercury removal byO3 and OH in the atmosphere, Atmos. Environ., 39, 3355–3367,doi:10.1016/j.atmosenv.2005.01.055, 2005.
Chen, L., Wang, H. H., Liu, J. F., Tong, Y. D., Ou, L. B., Zhang,W., Hu, D., Chen, C., and Wang, X. J.: Intercontinental trans-port and deposition patterns of atmospheric mercury from an-thropogenic emissions, Atmos. Chem. Phys., 14, 10163–10176,doi:10.5194/acp-14-10163-2014, 2014.
Christensen, J. H., Brandt, J., Frohn, L. M., and Skov, H.: Modellingof Mercury in the Arctic with the Danish Eulerian HemisphericModel, Atmos. Chem. Phys., 4, 2251–2257, doi:10.5194/acp-4-2251-2004, 2004.
Cohen, M. D., Draxler, R. R., Artz, R. S., Gustin, M., Han, Y.-J.,Holsen, T. M., Jaffe, D., Kelley, P., Lei, H., Loughner, C., Luke,W., Lyman, S., Niemi, D., Pacyna, J. M., Pilote, M., Poissant,L., Ratte, D., Ren, X., Steenhouisen, F., Tordon, R., and Wil-son, S.: Modeling the global atmospheric transport and deposi-tion of mercury to the Great Lakes, Elementa: Science of the An-thropocene, 4, 000118, doi:10.12952/journal.elementa.000118,2016.
Corbitt, E. S., Jacob, D. J., Holmes, C. D., Streets, D. G., and Sun-derland, E. M.: Global source-receptor relationships for mercurydeposition under present-day and 2050 emissions scenarios, En-viron. Sci. Technol., 45, 10477–10484, 2011.
Cremer, D., Kraka, E., and Filatov, M.: Bonding in MercuryMolecules Described by the Normalized Elimination of theSmall Component and Coupled Cluster Theory, Chem. Phys.Chem., 9, 2510–2521, doi:10.1002/cphc.200800510, 2008.
Dastoor, A., Ryzhkov, A., Durnford, D., Lehnherr, I., Steffen, A.,and Morrison, H.: Atmospheric mercury in the Canadian Arctic.
Atmos. Chem. Phys., 16, 12495–12511, 2016 www.atmos-chem-phys.net/16/12495/2016/
J. M. Pacyna et al.: Current and future levels of mercury atmospheric pollution on a global scale 12509
Part II: Insight from modeling, Sci. Total Environ., 509–510, 16–27, doi:10.1016/j.scitotenv.2014.10.112, 2015
De Simone, F., Gencarelli, C., Hedgecock, I., and Pirrone, N.:Global atmospheric cycle of mercury: a model study on the im-pact of oxidation mechanisms, Environ. Sci. Poll. Res., 21, 4110–4123, 2014.
De Simone, F., Cinnirella, S., Gencarelli, C. N., Yang, X., Hedge-cock, I. M., Pirrone, N.: Model Study of Global Mercury Depo-sition from Biomass Burning, Environ. Sci. Technol., 49, 6712–6721, 2015.
Driscoll, C. T., Mason, R. P., Chan, H. M., Jacob, D. J., and Pirrone,N.: Mercury as a global pollutant: sources, pathways, and effects,Environ. Sci. Technol., 47, 4967–4983, 2013.
Gencarelli, C. N., De Simone, F., Hedgecock, I. M., Sprovieri, F.,and Pirrone, N.: Development and Application of a Regional-Scale Atmospheric Mercury Model Based on WRF/Chem: AMediterranean Area Investigation, Environ. Sci. Poll. Res., 21,4095–4109, 2014.
Gratz, L. E., Ambrose, J. L., Jaffe, D. A., Shah, V., Jaeglé, L., Stutz,J., Festa, J., Spolaor, M., Tsai, C., Selin, N. E., Song, S., Zhou,X., Weinheimer, A. J., Knapp, D. J., Montzka, D. D., Flocke, F.M., Campos, T. L., Apel, E., Hornbrook, R., Blake, N. J., Hall,S., Tyndall, G. S., Reeves, M., Stechman, D., and Stell, M.: Oxi-dation of mercury by bromine in the subtropical Pacific free tro-posphere, Geophys. Res. Lett., 42, 10494–10502, 2015.
Gustin, M.: Exchange of mercury between the atmosphereand terrestrial ecosystems, in: Environmental Chemistry andToxicology of Mercury, edited by: Liu, G., Cai, Y., andO’Driscoll, N., John Wiley & Sons, Inc., Hoboken, NJ, USA,doi:10.1002/9781118146644.ch10, 2012.
Gustin, M. S., Amos, H. M., Huang, J., Miller, M. B., and Hei-decorn, K.: Measuring and modeling mercury in the atmo-sphere: a critical review, Atmos. Chem. Phys., 15, 5697–5713,doi:10.5194/acp-15-5697-2015, 2015.
Gustin, M. S., Evers, D. C., Bank, M. S., Hammerschmidt, C.R., Pierce, A., Basu, N., Blum, J., Bustamante, P., Chen, C.,Driscoll, C. T., Horvat, M., Jaffe, D., Pacyna, J. M., Pirrone,N. and Selin, N.: Importance of integration and implementa-tion of emerging and future mercury research into the Mi-namata Convention, Environ. Sci. Technol., 50, 2767–2770,doi:10.1021/acs.est.6b00573, 2016.
ECMWF: European Centre for Medium-Range Weather Forecasts,available at: http://www.ecmwf.int/en/forecasts/datasets, last ac-cess: 20 January 2016.
Hall, B. and Bloom, N.: Investigation of the Chemical Kineticsof Mercury Reactions, EPRI, Electric Power Research Institute:Palo Alto, CA, 1993.
Hedgecock, I. M. and Pirrone, N.: Chasing quicksilver: Model-ing the atmospheric lifetime of Hg-(g)(0) in the marine bound-ary layer at various latitudes, Environ. Sci. Technol., 38, 69–76,2004.
Holmes, C. D., Jacob, D. J., Mason, R. P., and Jaffe, D. A.: Sourcesand deposition of reactive gaseous mercury in the marine atmo-sphere, Atmos. Environ., 43, 2278–2285, 2009.
Holmes, C. D., Jacob, D. J., Corbitt, E. S., Mao, J., Yang, X., Tal-bot, R., and Slemr, F.: Global atmospheric model for mercuryincluding oxidation by bromine atoms, Atmos. Chem. Phys., 10,12037–12057, doi:10.5194/acp-10-12037-2010, 2010.
Hynes, A. J., Donohoue, D. L., Goodsite, M. E., and Hedgecock,I. M.: Our current understanding of major chemical and physi-cal processes affecting mercury dynamics in the atmosphere andat the air-water/terrestrial interfaces, in: Mercury Fate and Trans-port in the Global Atmosphere, edited by: Mason, R. and Pirrone,N., Springer, New York, 427–457, 2009.
Jung, G., Hedgecock, I. M., and Pirrone, N.: ECHMERIT V1.0– a new global fully coupled mercury-chemistry and transportmodel, Geosci. Model Dev., 2, 175–195, doi:10.5194/gmd-2-175-2009, 2009.
Karagas, M., Choi, A. L., Oken, E., Horvat, M., Schoeny, R., Ka-mai, E., Grandjean, P., and Korrick, S.: Evidence on the humanhealth effects of low level methylmercury exposure, Environ.Health Persp., 120, 799–806, 2012.
Kos, G., Ryzhkov, A., Dastoor, A., Narayan, J., Steffen, A., Ariya, P.A., and Zhang, L.: Evaluation of discrepancy between measuredand modelled oxidized mercury species, Atmos. Chem. Phys.,13, 4839–4863, doi:10.5194/acp-13-4839-2013, 2013.
Lei, H., Liang, X.-Z., Wuebbles, D. J., and Tao, Z.: Model anal-yses of atmospheric mercury: present air quality and effects oftranspacific transport on the United States, Atmos. Chem. Phys.,13, 10807–10825, doi:10.5194/acp-13-10807-2013, 2013.
Lei, H., Wuebbles, D. J., Liang, X.-Z., Tao, Z., Olsen, S., Artz, R.,Ren, X., and Cohen, M.: Projections of atmospheric mercury lev-els and their effect on air quality in the United States, Atmos.Chem. Phys., 14, 783–795, doi:10.5194/acp-14-783-2014, 2014.
Lin, C.-J., Pongprueksa, P., Lindberg, S. E., Pehkonen, S. O., Byun,D., and Jang, C.: Scientific uncertainties in atmospheric mercurymodels I: Model science evaluation, Atmos. Environ., 40, 2911–2928, 2006.
Lin, C.-J., Pongprueksa, P., Lindberg, S. E., Pehkonen, S. O., Jang,C., Braverman, T., and Ho, T. C.: Scientific uncertainties in atmo-spheric mercury models II: Sensitivity analysis in the CONUSdomain, Atmos. Environ., 41, 6544–6560, 2007.
Lindberg, S. E., Brooks, S., Lin, C.-J., Scott, K. J., Landis, M. S.,Stevens, R. K., Goodsite, M., and Richter, A.: Dynamic oxidationof gaseous mercury in the Arctic troposphere at polar sunrise,Environ. Sci. Technol., 36, 1245–1256, 2002.
Lyman, S. N. and Jaffe, D. A.: Formation and fate of oxidizedmercury in the upper troposphere and lower stratosphere, Nat.Geosci., 5, 114–117, 2011.
Mahaffey, K. R., Clickner, R. F., and Bodurow, C. C.: Blood or-ganic mercury and dietary mercury intake: National Health andNutrition Examination Survey, 1999 and 2000, Environ. HealthPersp., 112, 562–670, 2004.
Mahaffey, K. R., Clickner, R. F., and Jeffries, R. A.: Adult women’sblood mercury concentrations vary regionally in USA: Associa-tion with patterns of fish consumption (NHANES 1999–2004),Environ. Health Persp., 117, 47–53, 2009.
Mason, R.: Mercury emissions from natural sources and their im-portance in the global mercury cycle, in: Mercury Fate and Trans-port in the Global Atmosphere, edited by: Pirrone, N. and Mason,R., Springer Science+Business Media, Berlin/Heidelberg, Ger-many, 2009.
Mason, R. P., Choi, A. L., Fitzgerald, W. F., Hammerschmidt, C.R., Lamborg, C. H., Soerensen, A. L., and Sunderland, E. M.:Mercury biogeochemical cycling in the ocean and policy impli-cations, Environ. Res., 119, 101–117, 2012.
www.atmos-chem-phys.net/16/12495/2016/ Atmos. Chem. Phys., 16, 12495–12511, 2016
12510 J. M. Pacyna et al.: Current and future levels of mercury atmospheric pollution on a global scale
Obrist, D., Tas, E., Peleg, M., Matveev, V., Faïn, X., Asaf, D., andLuria, M.: Bromine-induced oxidation of mercury in the mid-latitude atmosphere, Nat. Geosci., 4, 22–26, 2011.
Qureshi, A., Macleod, M., Sunderland, E., and Hungerbüh-ler, K.: Exchange of elemental mercury between the oceansand the atmosphere, in: Environmental Chemistry and Tox-icology of Mercury, edited by: Liu, G., Cai, Y., andO’Driscoll, N., John Wiley & Sons, Inc., Hoboken, NJ, USA,doi:10.1002/9781118146644.ch10, 2012.
Pacyna, E. G., Pacyna, J. M., Sundseth, K., Munthe, J., Kindbom,K., Wilson, S., Steenhuisen, F., and Maxson, P.: Global emis-sion of mercury to the atmosphere from anthropogenic sources in2005 and projections to 2020, Atmos. Environ., 44, 2487–2499,2010.
Pan, L., Lin, C.-J., Carmichael, G. R., Streets, D. G., Tang, Y.,Woo, J.-H., Shetty, S. K., Chu, H.-W., Ho, T. C., and Friedli,H. R.: Study of Atmospheric Mercury Budget in East Asia Us-ing STEM-Hg Modeling System, Sci. Total Environ., 408, 3277–3291, 2010.
Peleg, M., Tas, E., Obrist, D., Matveev, V., Moore, C., Gabay, M.,and Luria, M.: Observational Evidence for Involvement of Ni-trate Radicals in Nighttime Oxidation of Mercury, Environ. Sci.Technol., 49, 14008–14018, 2015.
Pirrone N. and Mason, R. (Eds.): Mercury fate and transport inthe global atmosphere: Emissions, Measurements and Models,Springer, Dordrecht, 2009.
Pirrone, N., Aas, W., Cinnirella, S., Ebinghaus, R., Hedgecock, I.M., Pacyna, J. M., Sprovieri, F., and Sunderland, E. M.: Towardto next generation of air quality monitoring: Mercury, Atmos.Environ., 80, 599–611, 2013.
Rutter, A. P., Shakya, K. M., Lehr, R., Schauer, J. J., and Griffin,R. J.: Oxidation of gaseous elemental mercury in the presence ofsecondary organic aerosols, Atmos. Environ., 59, 86–92, 2012.
Schroeder, W. H., Anlauf, K. G., Barrie, L. A., Lu, J. Y., Steffen, A.,Schneeberger, D. R., and Berg, T.: Arctic springtime depletion ofmercury, Nature, 394, 331–332, 1998.
Seigneur, C., Vijayaraghavan, K., Lohman, K., Karamchandani, P.,and Scott, C.: Global source attribution for mercury depositionin the United States, Environ. Sci. Technol., 38, 555–569, 2004.
Selin, N. E., Jacob, D. J., Yantosca, R. M., Strode, S., Jaegle, L., andSunderland, E. M.: Global 3-D land-ocean-atmosphere modelfor mercury: Present-day versus preindustrial cycles and anthro-pogenic enrichment factors for deposition, Global Biogeochem.Cy., 22, GB2011, doi:10.1029/2007GB003040, 2008.
Shah, V., Jaeglé, L., Gratz, L. E., Ambrose, J. L., Jaffe, D. A., Selin,N. E., Song, S., Campos, T. L., Flocke, F. M., Reeves, M., Stech-man, D., Stell, M., Festa, J., Stutz, J., Weinheimer, A. J., Knapp,D. J., Montzka, D. D., Tyndall, G. S., Apel, E. C., Hornbrook, R.S., Hills, A. J., Riemer, D. D., Blake, N. J., Cantrell, C. A., andMauldin III, R. L.: Origin of oxidized mercury in the summer-time free troposphere over the southeastern US, Atmos. Chem.Phys., 16, 1511–1530, doi:10.5194/acp-16-1511-2016, 2016.
Skamarock, W. C., Klemp, J. B., Dudhia, J., Gill, D. O., Barker,D. M., Wang, W., and Powers, J. G.: A description of the Ad-vanced Research WRF Version 2. NCAR/TN-468+STR, NCARTechnical Note, Boulder, CO, USA, 2007.
Smith-Downey, N. V., Sunderland, E. M., and Jacob, D. J.: An-thropogenic impacts on global storage and emissions of mercury
from terrestrial soils: Insights from a new global model, J. Geo-phys. Res., 115, G03008, doi:10.1029/2009jg001124, 2010.
Snider, G., Raofie, F., and Ariya, P. A. A.: Effects of relative humid-ity and CO(g) on the O3-initiated oxidation reaction of Hg0(g):Kinetic & product studies, Phys. Chem. Chem. Phys., 10, 5616–5623, doi:10.1039/B801226A, 2008.
Soerensen, A. L., Skov, H., Jacob, D. J., Soerensen, B. T., and John-son, M. S.: Global concentrations of gaseous elemental mercuryand reactive gaseous mercury in the marine boundary layer, En-viron. Sci. Technol., 44, 425–427, 2010.
Song, S., Selin, N. E., Soerensen, A. L., Angot, H., Artz, R., Brooks,S., Brunke, E.-G., Conley, G., Dommergue, A., Ebinghaus, R.,Holsen, T. M., Jaffe, D. A., Kang, S., Kelley, P., Luke, W. T., Ma-gand, O., Marumoto, K., Pfaffhuber, K. A., Ren, X., Sheu, G.-R.,Slemr, F., Warneke, T., Weigelt, A., Weiss-Penzias, P., Wip, D.C., and Zhang, Q.: Top-down constraints on atmospheric mer-cury emissions and implications for global biogeochemical cy-cling, Atmos. Chem. Phys., 15, 7103–7125, doi:10.5194/acp-15-7103-2015, 2015.
Steffen, A., Douglas, T., Amyot, M., Ariya, P., Aspmo, K., Berg, T.,Bottenheim, J., Brooks, S., Cobbett, F., Dastoor, A., Dommergue,A., Ebinghaus, R., Ferrari, C., Gardfeldt, K., Goodsite, M. E.,Lean, D., Poulain, A. J., Scherz, C., Skov, H., Sommar, J., andTemme, C.: A synthesis of atmospheric mercury depletion eventchemistry in the atmosphere and snow, Atmos. Chem. Phys., 8,1445–1482, doi:10.5194/acp-8-1445-2008, 2008.
Subir, M., Ariya, P. A., and Dastoor, A. P.: A review of uncertain-ties in atmospheric modeling of mercury chemistry I. Uncertain-ties in existing kinetic parameters – Fundamental limitations andthe importance of heterogeneous chemistry, Atmos. Environ., 45,5664–5676, 2011.
Subir, M., Ariya, P. A., and Dastoor, A. P.: A review of the sourcesof uncertainties in atmospheric mercury modeling II. Mercurysurface and heterogeneous chemistry – A missing link, Atmos.Environ., 46, 1–10, 2012.
Sunderland, E. M. and Mason, R. P.: Human impacts on open oceanmercury concentrations, Global Biogeochem. Cy., 21, GB4022,doi:10.1029/2006GB002876, 2007.
Sunderland, E., Corbitt, E., Cossa, D., Evers, D., Friedli, H.,Krabbenhoft, D., Levin, L., Pirrone, N., and Rice, G.: Impactsof Intercontinental Mercury Transport on Human & EcologicalHealth, in: Hemispheric Transport of Air Pollution 2010. Part B:Mercury, edited by: Pirrone, N. and Keating, T., 97–144, Air Pol-lution Studies No. 16, United Nations, 2010.
Sundseth, K.: A novel combination of methods developed for deci-sion support on abatement of mercury in Europe, Doctoral The-sis, Gdansk University of Technology (GUT), Chemical Depart-ment, Gdansk, Poland, 2012.
Sundseth, K., Pacyna, J. M., Pacyna, E. G., Munthe, J., Belhej, M.,and Astrom, S.: Societal costs of continuing the status-quo ofmercury pollution, J. Clean. Prod., 18, 386–394, 2010.
Sundseth, K., Pacyna, J. M., Banel, A., Pacyna, E. G., and Rautio,A.: Climate change impacts on environmental and human expo-sure to mercury in the Arctic, Int. J. Environ. Res. Public Health,12, 3579–3599, doi:10.3390/ijerph120403579, 2015.
Tokos, J. J., Hall, B. O., Calhoun, J. A., and Prestbo, E. M.: Ho-mogeneous Gas-Phase Reaction of Hg0 with H2O2, O3, CH3I,and (CH3)2S: Implications for Atmospheric Hg Cycling, Atmos.Environ., 32, 823–827, 1998.
Atmos. Chem. Phys., 16, 12495–12511, 2016 www.atmos-chem-phys.net/16/12495/2016/
J. M. Pacyna et al.: Current and future levels of mercury atmospheric pollution on a global scale 12511
Travnikov, O. and Ilyin, I.: The EMEP/MSC-E Mercury ModelingSystem, in: Mercury Fate and Transport in the Global Atmo-sphere: Emissions, Measurements, and Models, edited by: Pir-rone, N. and Mason, R. P., Springer, 571–587, 2009.
Travnikov, O., Lin, C. J., Dastoor, A., Bullock, O. R., Hedgecock, I.,Holmes, C., Ilyin, I., Jaegle, L., Jung, G., Pan, L., Pongprueksa,P., Ryzhkov, A., Seigneur, C., and Skov, H.: Global and RegionalModeling, in: Hemispheric Transport of Air Pollution. Part B:Mercury, edited by: Pirrone, N. and Keating, T., United Nations,97–144, 2010.
UNEP: The Minamata Convention on Mercury, available at:http://www.mercuryconvention.org/Convention/tabid/3426/Default.aspx (last access: 5 October 2016), 2013.
Wang, X., Lin, C.-J., and Feng, X.: Sensitivity analysis ofan updated bidirectional air–surface exchange model for ele-mental mercury vapor, Atmos. Chem. Phys., 14, 6273–6287,doi:10.5194/acp-14-6273-2014, 2014.
WEO: World Energy Outlook 2012, International Energy Agency(IEA), Paris, France, 2012.
Zhang, L., Wright, L. P., and Blanchard, P. A.: Review of CurrentKnowledge Concerning Dry Deposition of Atmospheric Mer-cury, Atmos. Environ., 43, 5853–5864, 2009.
Zhu, W., Lin, C.-J., Wang, X., Sommar, J., Fu, X., and Feng, X.:Global observations and modeling of atmosphere–surface ex-change of elemental mercury: a critical review, Atmos. Chem.Phys., 16, 4451–4480, doi:10.5194/acp-16-4451-2016, 2016.
www.atmos-chem-phys.net/16/12495/2016/ Atmos. Chem. Phys., 16, 12495–12511, 2016