cultural evolution: the case of babies’ first names
TRANSCRIPT
Physica A 406 (2014) 139–144
Contents lists available at ScienceDirect
Physica A
journal homepage: www.elsevier.com/locate/physa
Cultural evolution: The case of babies’ first namesNing Xi a, Zi-Ke Zhang b,c,∗, Yi-Cheng Zhang a,c,d, Zehui Ge e, Li She c, Kui Zhang b
a Research Center for Complex Systems Science, University of Shanghai for Science and Technology - Shanghai 200093, PR Chinab College of Communication Engineering, Chongqing University - Chongqing 400044, PR Chinac Alibaba Research Center for Complexity Sciences, Hangzhou Normal University - Hangzhou 311121, PR Chinad Department of Physics, University of Fribourg - Chemin du Musée 3, Fribourg 1700, Switzerlande Dongling School of Economics and Management, University of Science and Technology Beijing - Beijing 100083, PR China
h i g h l i g h t s
• We take baby names as an example to study cultural evolution.• Rank–frequency distribution and temporal correlation of baby names are presented.• We propose a stochastic model to illustrate observed empirical observations.
a r t i c l e i n f o
Article history:Received 5 October 2013Received in revised form 11 February 2014Available online 20 March 2014
Keywords:Social influenceIndividual preferenceInequalitySimpson’s index
a b s t r a c t
In social sciences, there is currently rare consensus on the underlying mechanism forcultural evolution, partially due to lack of suitable data. The evolution of first names ofnewborn babies offers a remarkable example for such researches. In this paper, we employthe historical data on baby names from the United States to investigate the evolutionaryprocess of culture, in particular focusing on how inequality among baby names changesover time. Then we propose a stochastic model where individual choice is determined byboth individual preference and social influence, and show that the decrease in the strengthof social influence can account for all the observed empirical features. Therefore, we claimthat the weakening of social influence drives cultural evolution.
© 2014 Elsevier B.V. All rights reserved.
1. Introduction
Cultural evolution is the dynamical process by which the popularity of cultural traits changes over time. Remarkably, atall times the evolution presents the similar patterns: a relatively small number of cultural traits are highly popular whilethe majority gets little attention [1–5]. Moreover, the level of such inequality varies along with the evolution of culture.
In the past decades, a wide range of studies have been carried out to uncover the mechanism generating inequality. Oneexplanation, presented by Rosen and MacDonald, is that inequality is caused by the differential quality of cultural traitsand can be reproduced by the convexity of the mapping from quality to popularity [6,7]. An alternative explanation, firstlyproposed by Adler, asserts that individual decision is influenced by the behaviors of others, which lead to inequality [8–10].
In order to test the validity of the theories, Hamlen empirically examined the relationship between voice qualityand record sales in the popular music industry [11], and discovered that the percentage change in record sales wassmaller than that in voice quality. This repudiated the explanation of Rosen and MacDonald. Recently, Salganik and Watts
∗ Corresponding author at: College of Communication Engineering, Chongqing University - Chongqing 400044, PR China. Tel.: +86 18657192267.E-mail address: [email protected] (Z.-K. Zhang).
http://dx.doi.org/10.1016/j.physa.2014.03.0420378-4371/© 2014 Elsevier B.V. All rights reserved.
140 N. Xi et al. / Physica A 406 (2014) 139–144
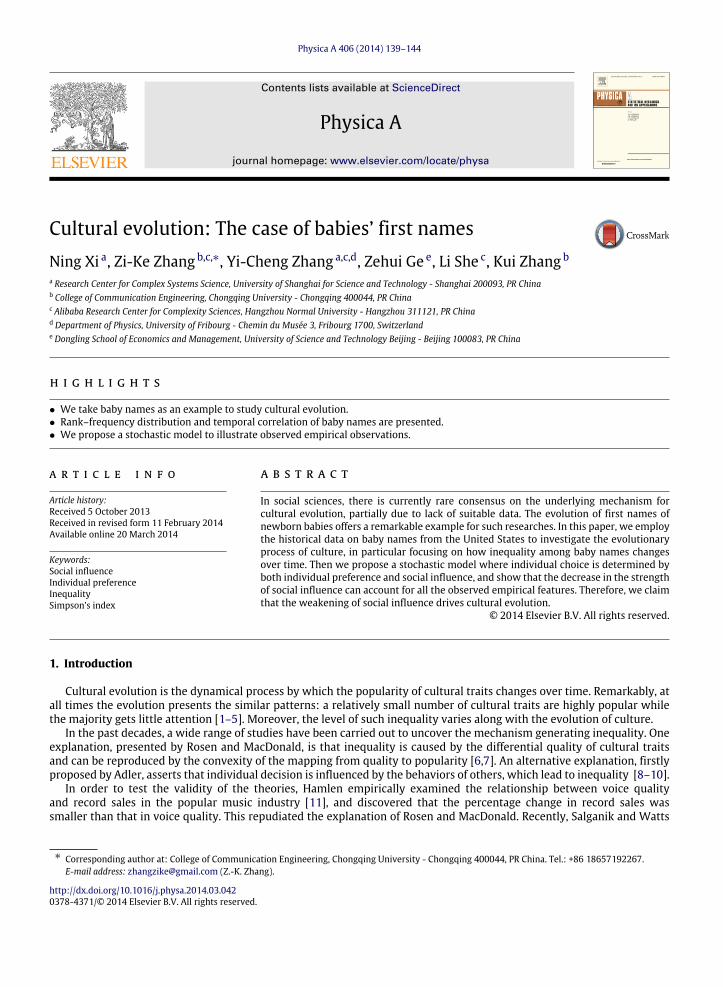
Fig. 1. The rank–frequency distribution of baby names. (a) shows the distributions in 1940. (b) shows the distributions of baby girl names in 1880, 1940,1970 and 2010. By comparison, one can find that the shape of the distribution becomes increasingly flat over time. Baby boy names have similar statisticalcharacteristics.
investigated social influence in cultural markets by a well-designed web-based experiment. In the experiment, participantsmay download previously unknown songs either with or without knowledge of previous participants’ choices [12,13].Comparative experiment shows that social influence plays a vital role in the emergence of inequality. Some theoreticalexplanations for the experimental findings have been proposed [14,15].
Besides the mechanism of inequality, how inequality evolves is also a core topic for cultural evolution. Because thisevolution is a relatively slow process in human society [16,17], the related researches demand the data over large timescale. However, it is difficult to obtain such data. Therefore, so far little has been known about it. Luckily, the evolution offirst names of newborn babies offers a remarkable example for the researches. The data on baby names from the UnitedStates span over 130 years. In this paper, we ground our analysis on the data and use standard statistical tools to gain someempirical facts concerning inequality and its evolution over time. Guided by these empirical facts, we propose a stochasticmodelwhere individual choice is determined by both individual preference and social influence.We show that such amodel,despite its simplicity, can account for the empirical observations with a high accuracy.
2. Data analysis
The data on first names are taken fromUS Social Security Administration, and contain the top 1000 boys’ and girls’ namesevery year from 1880 to 2010 [18]. All names are from Social Security Card applications for births that occurred in the UnitedStates after 1879. All data are from a 100% sample of the records on Social Security card applications as of the end of February2011.
Firstly,we analyze the distribution of baby names and its evolution. The data suggest that the rank–frequency distributionof baby names, which presents amathematical relation between the rank of each name ordered by decreasing frequency andits frequency, is downward sloping [19]. As an example, the rank–frequency distributions of baby names in 1940 are shownin Fig. 1(a). They present significant inequality. Through data analysis, we also find that the distribution of baby names is notstable. For illustration, we choose four different years and present the respective distributions of baby girl names in Fig. 1(b),
N. Xi et al. / Physica A 406 (2014) 139–144 141
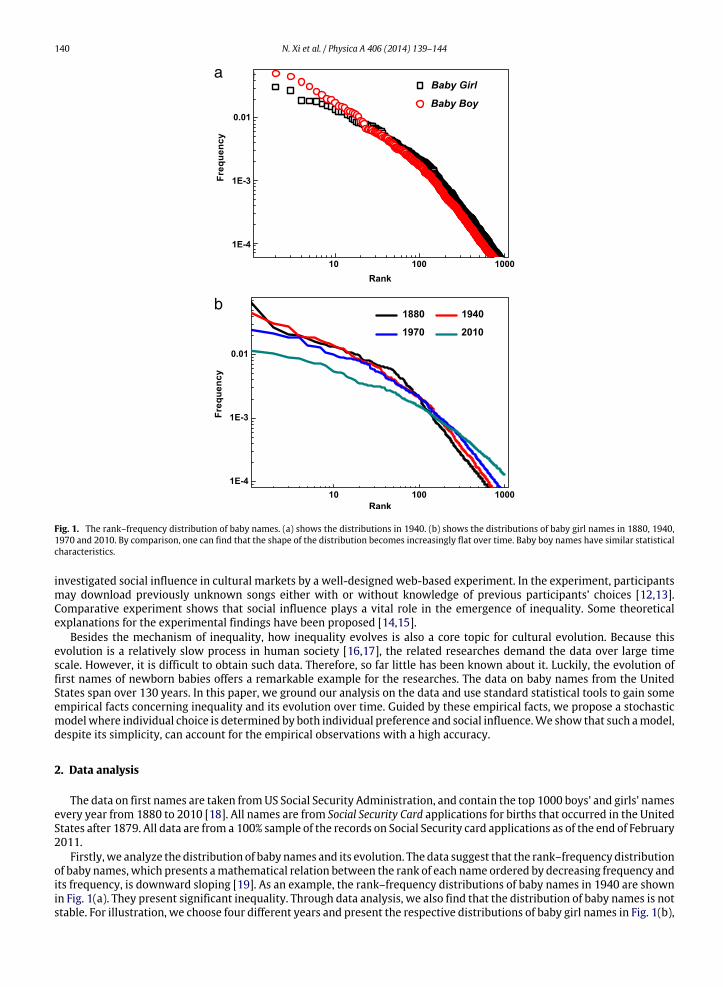
Fig. 2. The evolution of inequality. We employ Simpson’s index to measure inequality. We find that inequality level sustainedly declines with time exceptfor the period from 1909 to 1945.
fromwhich we can clearly see the evolution of the distribution. The given names change from few take all to a more equallydistributed way over time.
Secondly, we focus on the evolution of inequality. We use Simpson’s index to measure inequality among baby names[20–22]. Simpson’s index is defined as the probability of any two individuals drawn at random from newborn babieschoosing the same first name, and is expressed as follows [23]:
I =
ni=1
p2i , (1)
where pi denotes the frequency of baby name i, and n is the total number of first names. It ranges from 1/n (completeequality) to one (maximum inequality). Simpson’s index is heavily weighted towards the frequently used names, whilebeing less sensitive to the total number of names [24]. Our data omit the names outside the top 1000, and thus Simpson’sindex is the most suitable measure of inequality for our studies. We calculate Simpson’s index for each year, and the resultsare shown in Fig. 2, fromwhichwe can see that the level of inequality has a sustained decline except for the period from1909to 1945. The data suggest that there is a sharp increase in the number of newborn babies during that period. The increase ismost likely caused by the huge influx of immigrants to the USA, which has a tremendous impact on cultural evolution andleads to anomalous changes in inequality level [25].
Finally, we estimate temporal autocorrelation for the data on baby names. Consider two years t and t + △t . Thefrequencies of the same baby names are picked up from the data in the two years, and are placed in two sequences Xtand Xt+△t , respectively. Correlation is defined as Pearson’s correlation coefficient between the two sequences. Denote thefrequency of baby name i in the year t by xi,t . Then correlation can be computed as follows:
C(t, △t) =
ni=1
(xi,t − x̄t)(xi,t+△t − x̄t+△t)n
i=1(xi,t − x̄t)2
n
i=1(xi,t+△t − x̄t+△t)2
, (2)
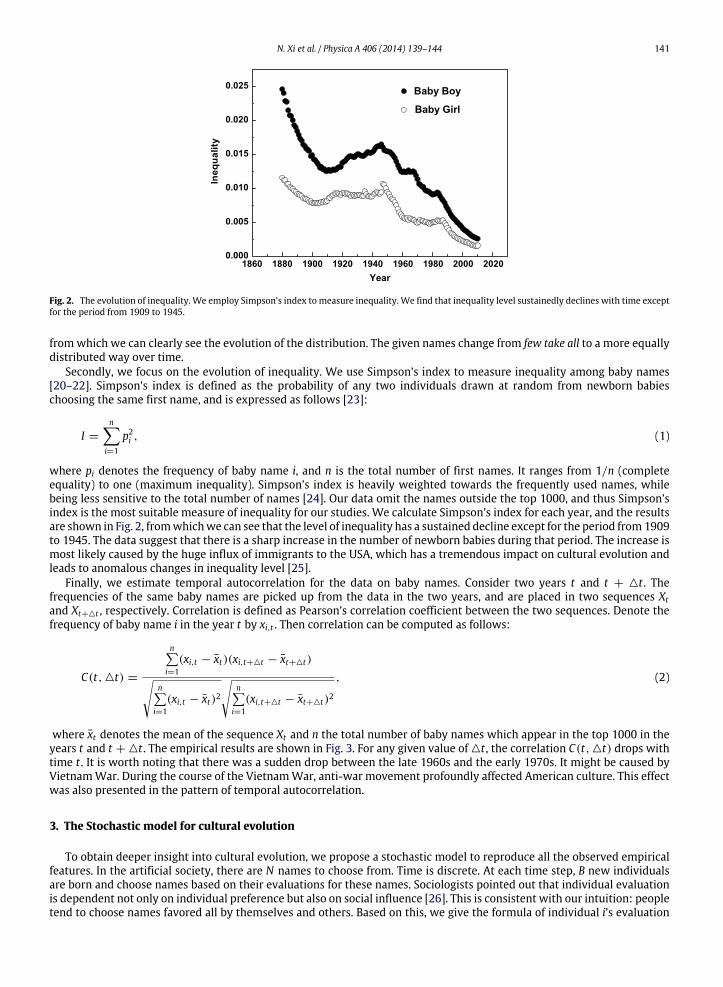
where x̄t denotes the mean of the sequence Xt and n the total number of baby names which appear in the top 1000 in theyears t and t + △t . The empirical results are shown in Fig. 3. For any given value of △t , the correlation C(t, △t) drops withtime t . It is worth noting that there was a sudden drop between the late 1960s and the early 1970s. It might be caused byVietnamWar. During the course of the VietnamWar, anti-war movement profoundly affected American culture. This effectwas also presented in the pattern of temporal autocorrelation.
3. The Stochastic model for cultural evolution
To obtain deeper insight into cultural evolution, we propose a stochastic model to reproduce all the observed empiricalfeatures. In the artificial society, there are N names to choose from. Time is discrete. At each time step, B new individualsare born and choose names based on their evaluations for these names. Sociologists pointed out that individual evaluationis dependent not only on individual preference but also on social influence [26]. This is consistent with our intuition: peopletend to choose names favored all by themselves and others. Based on this, we give the formula of individual i’s evaluation
142 N. Xi et al. / Physica A 406 (2014) 139–144
Fig. 3. The temporal autocorrelation plots for different values of △t . The linear fits to the data show that the correlation C(t, △t) drops with time t .
0.1
0.01
1E-3
1E-4
1E-5
1E-6
Fre
qu
ency
1 10 100 1000 10000
Rank
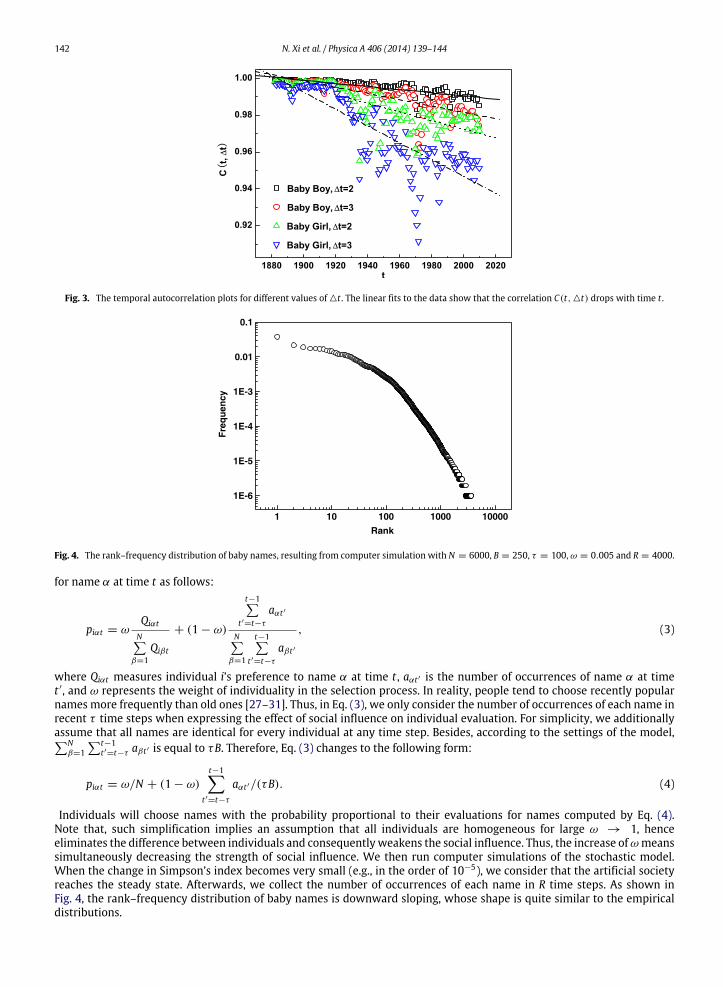
Fig. 4. The rank–frequency distribution of baby names, resulting from computer simulation with N = 6000, B = 250, τ = 100, ω = 0.005 and R = 4000.
for name α at time t as follows:
piαt = ωQiαt
Nβ=1
Qiβt
+ (1 − ω)
t−1t ′=t−τ
aαt ′
Nβ=1
t−1t ′=t−τ
aβt ′
, (3)
where Qiαt measures individual i’s preference to name α at time t , aαt ′ is the number of occurrences of name α at timet ′, and ω represents the weight of individuality in the selection process. In reality, people tend to choose recently popularnames more frequently than old ones [27–31]. Thus, in Eq. (3), we only consider the number of occurrences of each name inrecent τ time steps when expressing the effect of social influence on individual evaluation. For simplicity, we additionallyassume that all names are identical for every individual at any time step. Besides, according to the settings of the model,N
β=1t−1
t ′=t−τ aβt ′ is equal to τB. Therefore, Eq. (3) changes to the following form:
piαt = ω/N + (1 − ω)
t−1t ′=t−τ
aαt ′/(τB). (4)
Individuals will choose names with the probability proportional to their evaluations for names computed by Eq. (4).Note that, such simplification implies an assumption that all individuals are homogeneous for large ω → 1, henceeliminates the difference between individuals and consequentlyweakens the social influence. Thus, the increase ofω meanssimultaneously decreasing the strength of social influence. We then run computer simulations of the stochastic model.When the change in Simpson’s index becomes very small (e.g., in the order of 10−5), we consider that the artificial societyreaches the steady state. Afterwards, we collect the number of occurrences of each name in R time steps. As shown inFig. 4, the rank–frequency distribution of baby names is downward sloping, whose shape is quite similar to the empiricaldistributions.
N. Xi et al. / Physica A 406 (2014) 139–144 143
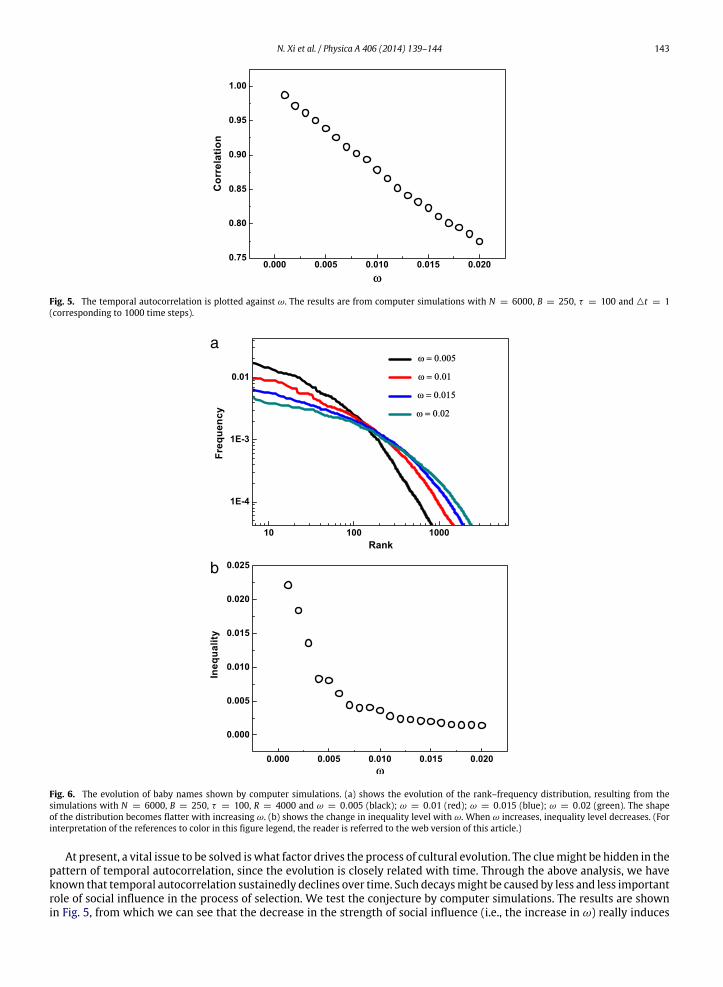
Fig. 5. The temporal autocorrelation is plotted against ω. The results are from computer simulations with N = 6000, B = 250, τ = 100 and △t = 1(corresponding to 1000 time steps).
a
b
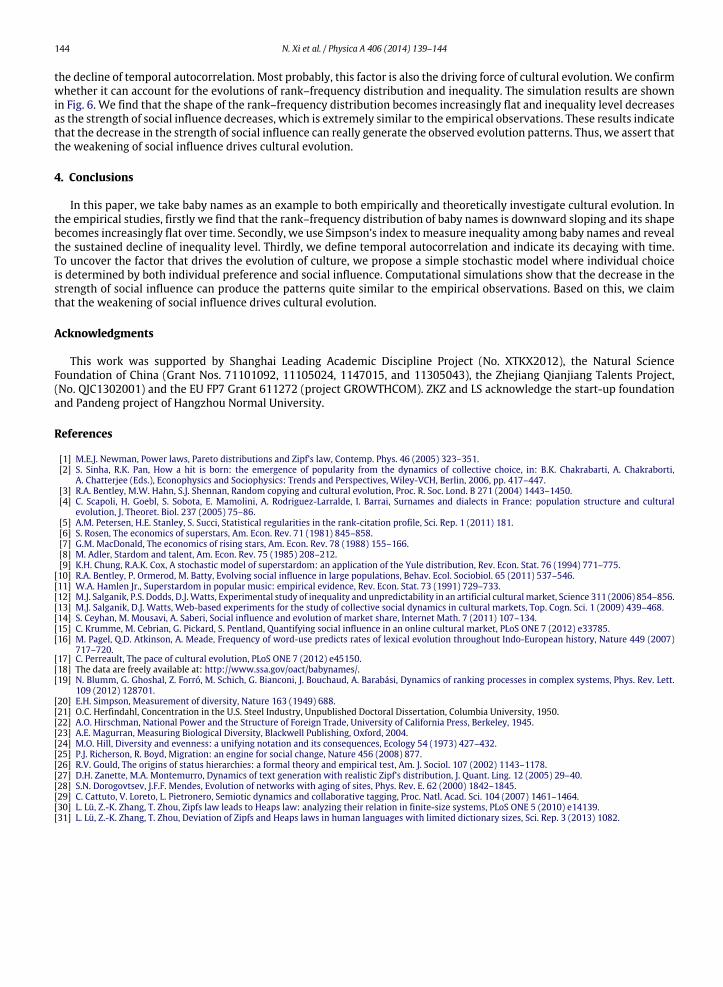
Fig. 6. The evolution of baby names shown by computer simulations. (a) shows the evolution of the rank–frequency distribution, resulting from thesimulations with N = 6000, B = 250, τ = 100, R = 4000 and ω = 0.005 (black); ω = 0.01 (red); ω = 0.015 (blue); ω = 0.02 (green). The shapeof the distribution becomes flatter with increasing ω. (b) shows the change in inequality level with ω. When ω increases, inequality level decreases. (Forinterpretation of the references to color in this figure legend, the reader is referred to the web version of this article.)
At present, a vital issue to be solved iswhat factor drives the process of cultural evolution. The cluemight be hidden in thepattern of temporal autocorrelation, since the evolution is closely related with time. Through the above analysis, we haveknown that temporal autocorrelation sustainedly declines over time. Such decaysmight be caused by less and less importantrole of social influence in the process of selection. We test the conjecture by computer simulations. The results are shownin Fig. 5, from which we can see that the decrease in the strength of social influence (i.e., the increase in ω) really induces
144 N. Xi et al. / Physica A 406 (2014) 139–144
the decline of temporal autocorrelation. Most probably, this factor is also the driving force of cultural evolution. We confirmwhether it can account for the evolutions of rank–frequency distribution and inequality. The simulation results are shownin Fig. 6. We find that the shape of the rank–frequency distribution becomes increasingly flat and inequality level decreasesas the strength of social influence decreases, which is extremely similar to the empirical observations. These results indicatethat the decrease in the strength of social influence can really generate the observed evolution patterns. Thus, we assert thatthe weakening of social influence drives cultural evolution.
4. Conclusions
In this paper, we take baby names as an example to both empirically and theoretically investigate cultural evolution. Inthe empirical studies, firstly we find that the rank–frequency distribution of baby names is downward sloping and its shapebecomes increasingly flat over time. Secondly, we use Simpson’s index tomeasure inequality among baby names and revealthe sustained decline of inequality level. Thirdly, we define temporal autocorrelation and indicate its decaying with time.To uncover the factor that drives the evolution of culture, we propose a simple stochastic model where individual choiceis determined by both individual preference and social influence. Computational simulations show that the decrease in thestrength of social influence can produce the patterns quite similar to the empirical observations. Based on this, we claimthat the weakening of social influence drives cultural evolution.
Acknowledgments
This work was supported by Shanghai Leading Academic Discipline Project (No. XTKX2012), the Natural ScienceFoundation of China (Grant Nos. 71101092, 11105024, 1147015, and 11305043), the Zhejiang Qianjiang Talents Project,(No. QJC1302001) and the EU FP7 Grant 611272 (project GROWTHCOM). ZKZ and LS acknowledge the start-up foundationand Pandeng project of Hangzhou Normal University.
References
[1] M.E.J. Newman, Power laws, Pareto distributions and Zipf’s law, Contemp. Phys. 46 (2005) 323–351.[2] S. Sinha, R.K. Pan, How a hit is born: the emergence of popularity from the dynamics of collective choice, in: B.K. Chakrabarti, A. Chakraborti,
A. Chatterjee (Eds.), Econophysics and Sociophysics: Trends and Perspectives, Wiley-VCH, Berlin, 2006, pp. 417–447.[3] R.A. Bentley, M.W. Hahn, S.J. Shennan, Random copying and cultural evolution, Proc. R. Soc. Lond. B 271 (2004) 1443–1450.[4] C. Scapoli, H. Goebl, S. Sobota, E. Mamolini, A. Rodriguez-Larralde, I. Barrai, Surnames and dialects in France: population structure and cultural
evolution, J. Theoret. Biol. 237 (2005) 75–86.[5] A.M. Petersen, H.E. Stanley, S. Succi, Statistical regularities in the rank-citation profile, Sci. Rep. 1 (2011) 181.[6] S. Rosen, The economics of superstars, Am. Econ. Rev. 71 (1981) 845–858.[7] G.M. MacDonald, The economics of rising stars, Am. Econ. Rev. 78 (1988) 155–166.[8] M. Adler, Stardom and talent, Am. Econ. Rev. 75 (1985) 208–212.[9] K.H. Chung, R.A.K. Cox, A stochastic model of superstardom: an application of the Yule distribution, Rev. Econ. Stat. 76 (1994) 771–775.
[10] R.A. Bentley, P. Ormerod, M. Batty, Evolving social influence in large populations, Behav. Ecol. Sociobiol. 65 (2011) 537–546.[11] W.A. Hamlen Jr., Superstardom in popular music: empirical evidence, Rev. Econ. Stat. 73 (1991) 729–733.[12] M.J. Salganik, P.S. Dodds, D.J.Watts, Experimental study of inequality and unpredictability in an artificial culturalmarket, Science 311 (2006) 854–856.[13] M.J. Salganik, D.J. Watts, Web-based experiments for the study of collective social dynamics in cultural markets, Top. Cogn. Sci. 1 (2009) 439–468.[14] S. Ceyhan, M. Mousavi, A. Saberi, Social influence and evolution of market share, Internet Math. 7 (2011) 107–134.[15] C. Krumme, M. Cebrian, G. Pickard, S. Pentland, Quantifying social influence in an online cultural market, PLoS ONE 7 (2012) e33785.[16] M. Pagel, Q.D. Atkinson, A. Meade, Frequency of word-use predicts rates of lexical evolution throughout Indo-European history, Nature 449 (2007)
717–720.[17] C. Perreault, The pace of cultural evolution, PLoS ONE 7 (2012) e45150.[18] The data are freely available at: http://www.ssa.gov/oact/babynames/.[19] N. Blumm, G. Ghoshal, Z. Forró, M. Schich, G. Bianconi, J. Bouchaud, A. Barabási, Dynamics of ranking processes in complex systems, Phys. Rev. Lett.
109 (2012) 128701.[20] E.H. Simpson, Measurement of diversity, Nature 163 (1949) 688.[21] O.C. Herfindahl, Concentration in the U.S. Steel Industry, Unpublished Doctoral Dissertation, Columbia University, 1950.[22] A.O. Hirschman, National Power and the Structure of Foreign Trade, University of California Press, Berkeley, 1945.[23] A.E. Magurran, Measuring Biological Diversity, Blackwell Publishing, Oxford, 2004.[24] M.O. Hill, Diversity and evenness: a unifying notation and its consequences, Ecology 54 (1973) 427–432.[25] P.J. Richerson, R. Boyd, Migration: an engine for social change, Nature 456 (2008) 877.[26] R.V. Gould, The origins of status hierarchies: a formal theory and empirical test, Am. J. Sociol. 107 (2002) 1143–1178.[27] D.H. Zanette, M.A. Montemurro, Dynamics of text generation with realistic Zipf’s distribution, J. Quant. Ling. 12 (2005) 29–40.[28] S.N. Dorogovtsev, J.F.F. Mendes, Evolution of networks with aging of sites, Phys. Rev. E. 62 (2000) 1842–1845.[29] C. Cattuto, V. Loreto, L. Pietronero, Semiotic dynamics and collaborative tagging, Proc. Natl. Acad. Sci. 104 (2007) 1461–1464.[30] L. Lü, Z.-K. Zhang, T. Zhou, Zipfs law leads to Heaps law: analyzing their relation in finite-size systems, PLoS ONE 5 (2010) e14139.[31] L. Lü, Z.-K. Zhang, T. Zhou, Deviation of Zipfs and Heaps laws in human languages with limited dictionary sizes, Sci. Rep. 3 (2013) 1082.