csh literature review of supportive housing: by study · csh literature review of supportive...
TRANSCRIPT
CSH Literature Review of Supportive Housing:
By Study
Please do not distribute or share without permission from CSH.
Information listed in the Outcomes table has been taken directly from the relevant study. Such outcomes do not constitute analysis or advice.
Please direct all questions and concerns about the literature review to Lauren Fulton ([email protected]).
2
Please note that some text is copied directly from source material in order to most accurately capture results conveyed. Please check the source materials and cite appropriately.
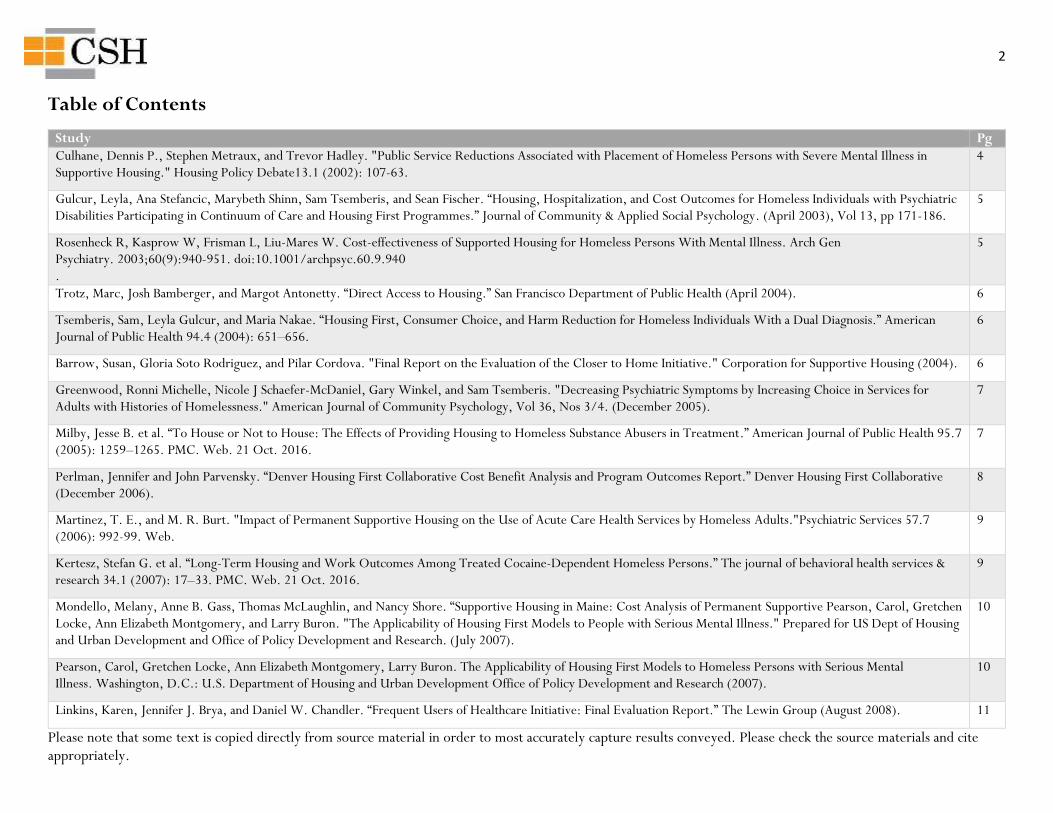
Table of Contents
Study Pg
Culhane, Dennis P., Stephen Metraux, and Trevor Hadley. "Public Service Reductions Associated with Placement of Homeless Persons with Severe Mental Illness in Supportive Housing." Housing Policy Debate13.1 (2002): 107-63.
4
Gulcur, Leyla, Ana Stefancic, Marybeth Shinn, Sam Tsemberis, and Sean Fischer. “Housing, Hospitalization, and Cost Outcomes for Homeless Individuals with Psychiatric Disabilities Participating in Continuum of Care and Housing First Programmes.” Journal of Community & Applied Social Psychology. (April 2003), Vol 13, pp 171-186.
5
Rosenheck R, Kasprow W, Frisman L, Liu-Mares W. Cost-effectiveness of Supported Housing for Homeless Persons With Mental Illness. Arch Gen Psychiatry. 2003;60(9):940-951. doi:10.1001/archpsyc.60.9.940 .
5
Trotz, Marc, Josh Bamberger, and Margot Antonetty. “Direct Access to Housing.” San Francisco Department of Public Health (April 2004).
6
Tsemberis, Sam, Leyla Gulcur, and Maria Nakae. “Housing First, Consumer Choice, and Harm Reduction for Homeless Individuals With a Dual Diagnosis.” American Journal of Public Health 94.4 (2004): 651–656.
6
Barrow, Susan, Gloria Soto Rodriguez, and Pilar Cordova. "Final Report on the Evaluation of the Closer to Home Initiative." Corporation for Supportive Housing (2004).
6
Greenwood, Ronni Michelle, Nicole J Schaefer-McDaniel, Gary Winkel, and Sam Tsemberis. "Decreasing Psychiatric Symptoms by Increasing Choice in Services for Adults with Histories of Homelessness." American Journal of Community Psychology, Vol 36, Nos 3/4. (December 2005).
7
Milby, Jesse B. et al. “To House or Not to House: The Effects of Providing Housing to Homeless Substance Abusers in Treatment.” American Journal of Public Health 95.7 (2005): 1259–1265. PMC. Web. 21 Oct. 2016.
7
Perlman, Jennifer and John Parvensky. “Denver Housing First Collaborative Cost Benefit Analysis and Program Outcomes Report.” Denver Housing First Collaborative (December 2006).
8
Martinez, T. E., and M. R. Burt. "Impact of Permanent Supportive Housing on the Use of Acute Care Health Services by Homeless Adults."Psychiatric Services 57.7 (2006): 992-99. Web.
9
Kertesz, Stefan G. et al. “Long-Term Housing and Work Outcomes Among Treated Cocaine-Dependent Homeless Persons.” The journal of behavioral health services & research 34.1 (2007): 17–33. PMC. Web. 21 Oct. 2016.
9
Mondello, Melany, Anne B. Gass, Thomas McLaughlin, and Nancy Shore. “Supportive Housing in Maine: Cost Analysis of Permanent Supportive Pearson, Carol, Gretchen Locke, Ann Elizabeth Montgomery, and Larry Buron. "The Applicability of Housing First Models to People with Serious Mental Illness." Prepared for US Dept of Housing and Urban Development and Office of Policy Development and Research. (July 2007).
10
Pearson, Carol, Gretchen Locke, Ann Elizabeth Montgomery, Larry Buron. The Applicability of Housing First Models to Homeless Persons with Serious Mental Illness. Washington, D.C.: U.S. Department of Housing and Urban Development Office of Policy Development and Research (2007).
10
Linkins, Karen, Jennifer J. Brya, and Daniel W. Chandler. “Frequent Users of Healthcare Initiative: Final Evaluation Report.” The Lewin Group (August 2008).
11
3
Please note that some text is copied directly from source material in order to most accurately capture results conveyed. Please check the source materials and cite appropriately.
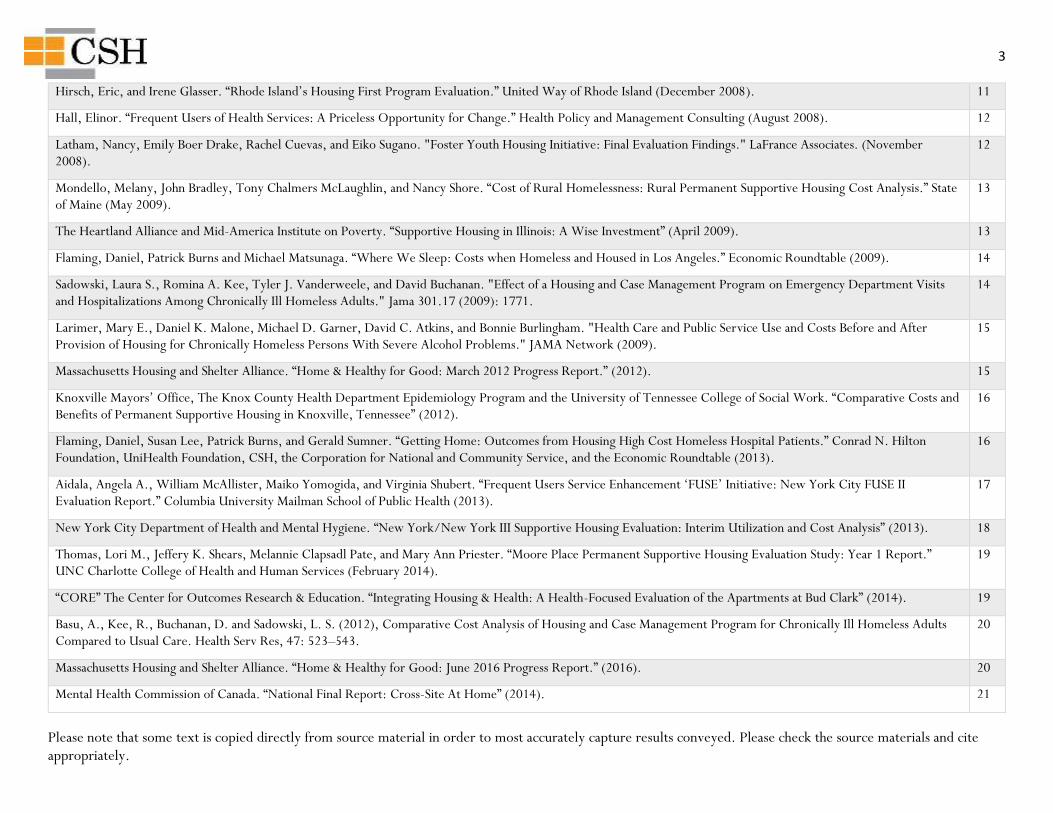
Hirsch, Eric, and Irene Glasser. “Rhode Island’s Housing First Program Evaluation.” United Way of Rhode Island (December 2008).
11
Hall, Elinor. “Frequent Users of Health Services: A Priceless Opportunity for Change.” Health Policy and Management Consulting (August 2008).
12
Latham, Nancy, Emily Boer Drake, Rachel Cuevas, and Eiko Sugano. "Foster Youth Housing Initiative: Final Evaluation Findings." LaFrance Associates. (November 2008).
12
Mondello, Melany, John Bradley, Tony Chalmers McLaughlin, and Nancy Shore. “Cost of Rural Homelessness: Rural Permanent Supportive Housing Cost Analysis.” State of Maine (May 2009).
13
The Heartland Alliance and Mid-America Institute on Poverty. “Supportive Housing in Illinois: A Wise Investment” (April 2009).
13
Flaming, Daniel, Patrick Burns and Michael Matsunaga. “Where We Sleep: Costs when Homeless and Housed in Los Angeles.” Economic Roundtable (2009).
14
Sadowski, Laura S., Romina A. Kee, Tyler J. Vanderweele, and David Buchanan. "Effect of a Housing and Case Management Program on Emergency Department Visits and Hospitalizations Among Chronically Ill Homeless Adults." Jama 301.17 (2009): 1771.
14
Larimer, Mary E., Daniel K. Malone, Michael D. Garner, David C. Atkins, and Bonnie Burlingham. "Health Care and Public Service Use and Costs Before and After Provision of Housing for Chronically Homeless Persons With Severe Alcohol Problems." JAMA Network (2009).
15
Massachusetts Housing and Shelter Alliance. “Home & Healthy for Good: March 2012 Progress Report.” (2012).
15
Knoxville Mayors’ Office, The Knox County Health Department Epidemiology Program and the University of Tennessee College of Social Work. “Comparative Costs and Benefits of Permanent Supportive Housing in Knoxville, Tennessee” (2012).
16
Flaming, Daniel, Susan Lee, Patrick Burns, and Gerald Sumner. “Getting Home: Outcomes from Housing High Cost Homeless Hospital Patients.” Conrad N. Hilton Foundation, UniHealth Foundation, CSH, the Corporation for National and Community Service, and the Economic Roundtable (2013).
16
Aidala, Angela A., William McAllister, Maiko Yomogida, and Virginia Shubert. “Frequent Users Service Enhancement ‘FUSE’ Initiative: New York City FUSE II Evaluation Report.” Columbia University Mailman School of Public Health (2013).
17
New York City Department of Health and Mental Hygiene. “New York/New York III Supportive Housing Evaluation: Interim Utilization and Cost Analysis” (2013).
18
Thomas, Lori M., Jeffery K. Shears, Melannie Clapsadl Pate, and Mary Ann Priester. “Moore Place Permanent Supportive Housing Evaluation Study: Year 1 Report.” UNC Charlotte College of Health and Human Services (February 2014).
19
“CORE” The Center for Outcomes Research & Education. “Integrating Housing & Health: A Health-Focused Evaluation of the Apartments at Bud Clark” (2014).
19
Basu, A., Kee, R., Buchanan, D. and Sadowski, L. S. (2012), Comparative Cost Analysis of Housing and Case Management Program for Chronically Ill Homeless Adults Compared to Usual Care. Health Serv Res, 47: 523–543.
20
Massachusetts Housing and Shelter Alliance. “Home & Healthy for Good: June 2016 Progress Report.” (2016).
20
Mental Health Commission of Canada. “National Final Report: Cross-Site At Home” (2014).
21
4
Please note that some text is copied directly from source material in order to most accurately capture results conveyed. Please check the source materials and cite appropriately.
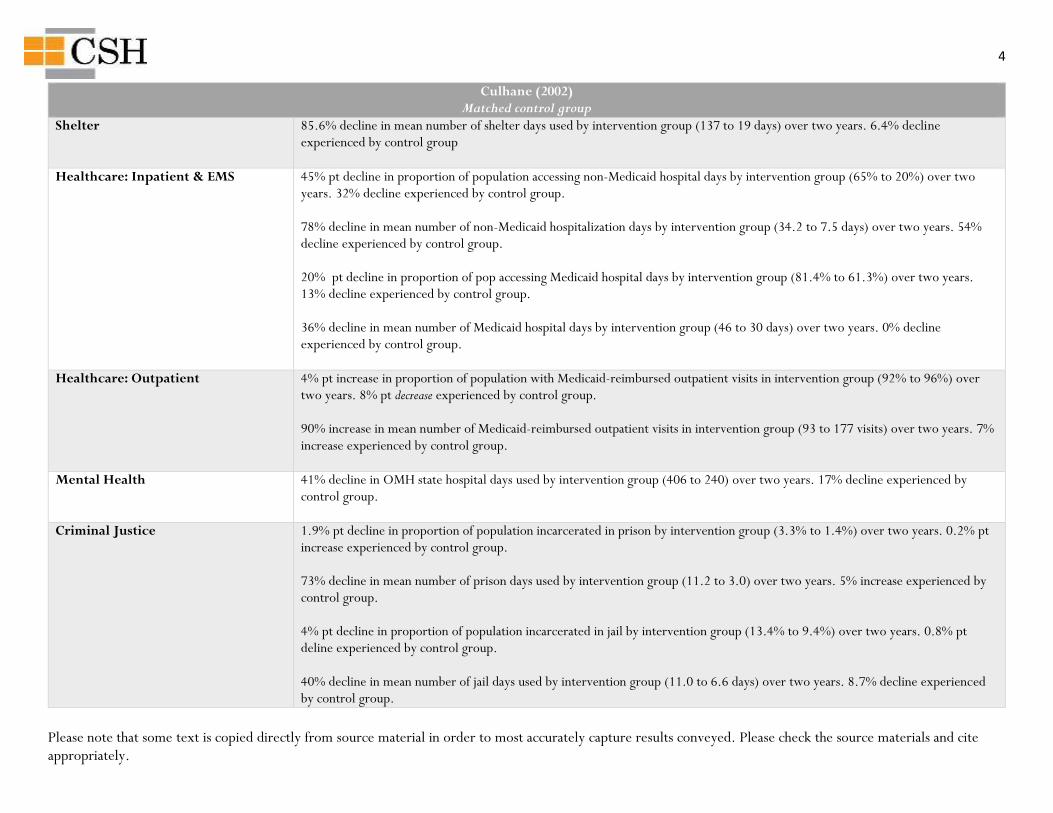
Culhane (2002) Matched control group
Shelter 85.6% decline in mean number of shelter days used by intervention group (137 to 19 days) over two years. 6.4% decline experienced by control group
Healthcare: Inpatient & EMS 45% pt decline in proportion of population accessing non-Medicaid hospital days by intervention group (65% to 20%) over two years. 32% decline experienced by control group. 78% decline in mean number of non-Medicaid hospitalization days by intervention group (34.2 to 7.5 days) over two years. 54% decline experienced by control group. 20% pt decline in proportion of pop accessing Medicaid hospital days by intervention group (81.4% to 61.3%) over two years. 13% decline experienced by control group. 36% decline in mean number of Medicaid hospital days by intervention group (46 to 30 days) over two years. 0% decline experienced by control group.
Healthcare: Outpatient 4% pt increase in proportion of population with Medicaid-reimbursed outpatient visits in intervention group (92% to 96%) over two years. 8% pt decrease experienced by control group. 90% increase in mean number of Medicaid-reimbursed outpatient visits in intervention group (93 to 177 visits) over two years. 7% increase experienced by control group.
Mental Health 41% decline in OMH state hospital days used by intervention group (406 to 240) over two years. 17% decline experienced by control group.
Criminal Justice 1.9% pt decline in proportion of population incarcerated in prison by intervention group (3.3% to 1.4%) over two years. 0.2% pt increase experienced by control group. 73% decline in mean number of prison days used by intervention group (11.2 to 3.0) over two years. 5% increase experienced by control group. 4% pt decline in proportion of population incarcerated in jail by intervention group (13.4% to 9.4%) over two years. 0.8% pt deline experienced by control group. 40% decline in mean number of jail days used by intervention group (11.0 to 6.6 days) over two years. 8.7% decline experienced by control group.
5
Please note that some text is copied directly from source material in order to most accurately capture results conveyed. Please check the source materials and cite appropriately.
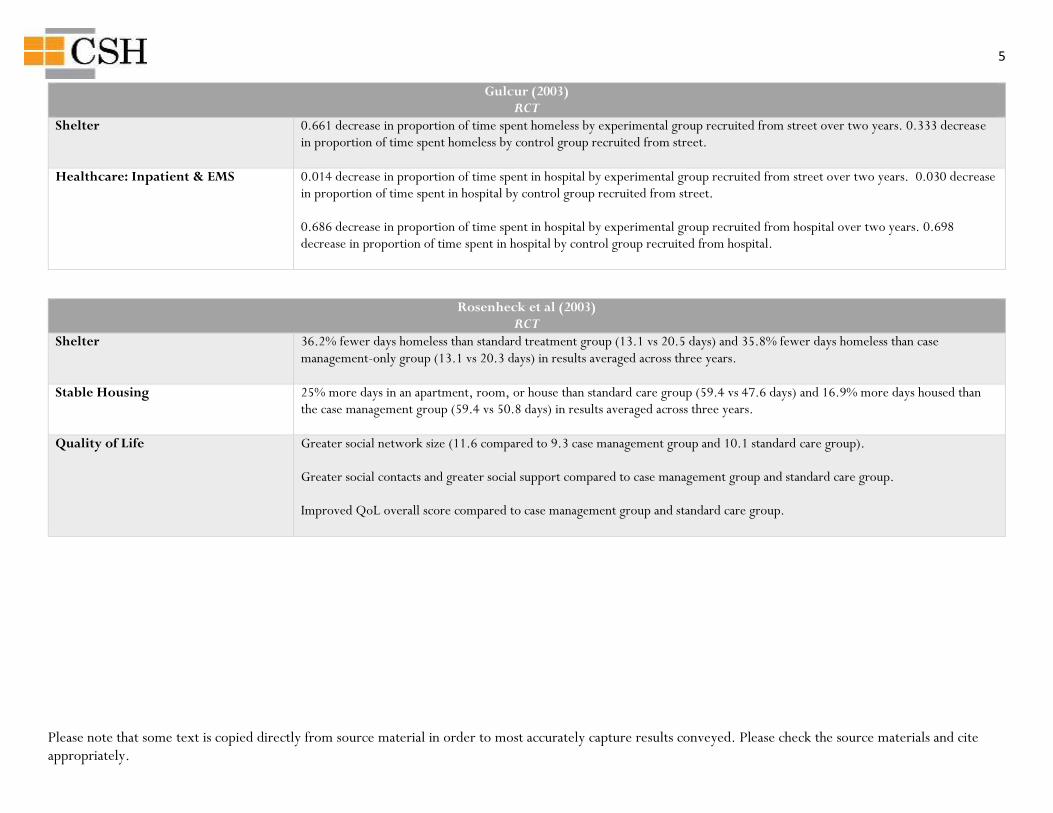
Gulcur (2003) RCT
Shelter 0.661 decrease in proportion of time spent homeless by experimental group recruited from street over two years. 0.333 decrease in proportion of time spent homeless by control group recruited from street.
Healthcare: Inpatient & EMS 0.014 decrease in proportion of time spent in hospital by experimental group recruited from street over two years. 0.030 decrease in proportion of time spent in hospital by control group recruited from street. 0.686 decrease in proportion of time spent in hospital by experimental group recruited from hospital over two years. 0.698 decrease in proportion of time spent in hospital by control group recruited from hospital.
Rosenheck et al (2003) RCT
Shelter 36.2% fewer days homeless than standard treatment group (13.1 vs 20.5 days) and 35.8% fewer days homeless than case management-only group (13.1 vs 20.3 days) in results averaged across three years.
Stable Housing 25% more days in an apartment, room, or house than standard care group (59.4 vs 47.6 days) and 16.9% more days housed than the case management group (59.4 vs 50.8 days) in results averaged across three years.
Quality of Life Greater social network size (11.6 compared to 9.3 case management group and 10.1 standard care group). Greater social contacts and greater social support compared to case management group and standard care group. Improved QoL overall score compared to case management group and standard care group.
6
Please note that some text is copied directly from source material in order to most accurately capture results conveyed. Please check the source materials and cite appropriately.
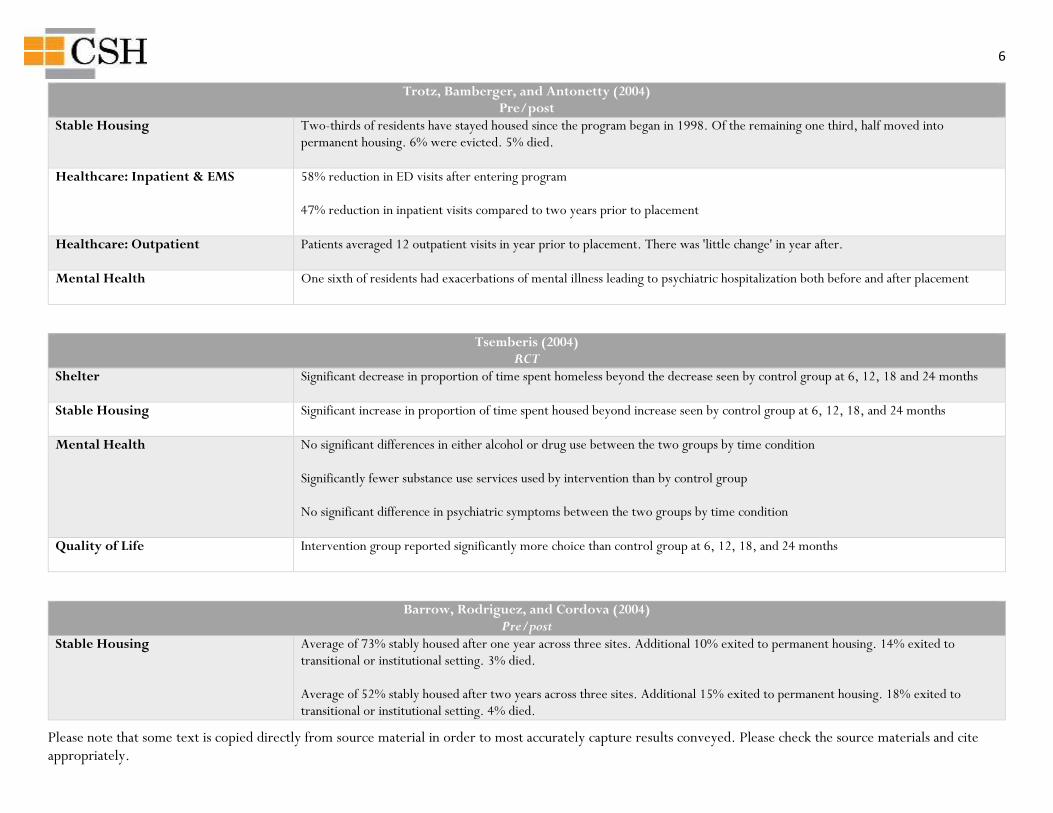
Trotz, Bamberger, and Antonetty (2004) Pre/post
Stable Housing Two-thirds of residents have stayed housed since the program began in 1998. Of the remaining one third, half moved into permanent housing. 6% were evicted. 5% died.
Healthcare: Inpatient & EMS 58% reduction in ED visits after entering program 47% reduction in inpatient visits compared to two years prior to placement
Healthcare: Outpatient Patients averaged 12 outpatient visits in year prior to placement. There was 'little change' in year after.
Mental Health One sixth of residents had exacerbations of mental illness leading to psychiatric hospitalization both before and after placement
Tsemberis (2004) RCT
Shelter Significant decrease in proportion of time spent homeless beyond the decrease seen by control group at 6, 12, 18 and 24 months
Stable Housing Significant increase in proportion of time spent housed beyond increase seen by control group at 6, 12, 18, and 24 months
Mental Health No significant differences in either alcohol or drug use between the two groups by time condition Significantly fewer substance use services used by intervention than by control group No significant difference in psychiatric symptoms between the two groups by time condition
Quality of Life Intervention group reported significantly more choice than control group at 6, 12, 18, and 24 months
Barrow, Rodriguez, and Cordova (2004) Pre/post
Stable Housing Average of 73% stably housed after one year across three sites. Additional 10% exited to permanent housing. 14% exited to transitional or institutional setting. 3% died. Average of 52% stably housed after two years across three sites. Additional 15% exited to permanent housing. 18% exited to transitional or institutional setting. 4% died.
7
Please note that some text is copied directly from source material in order to most accurately capture results conveyed. Please check the source materials and cite appropriately.
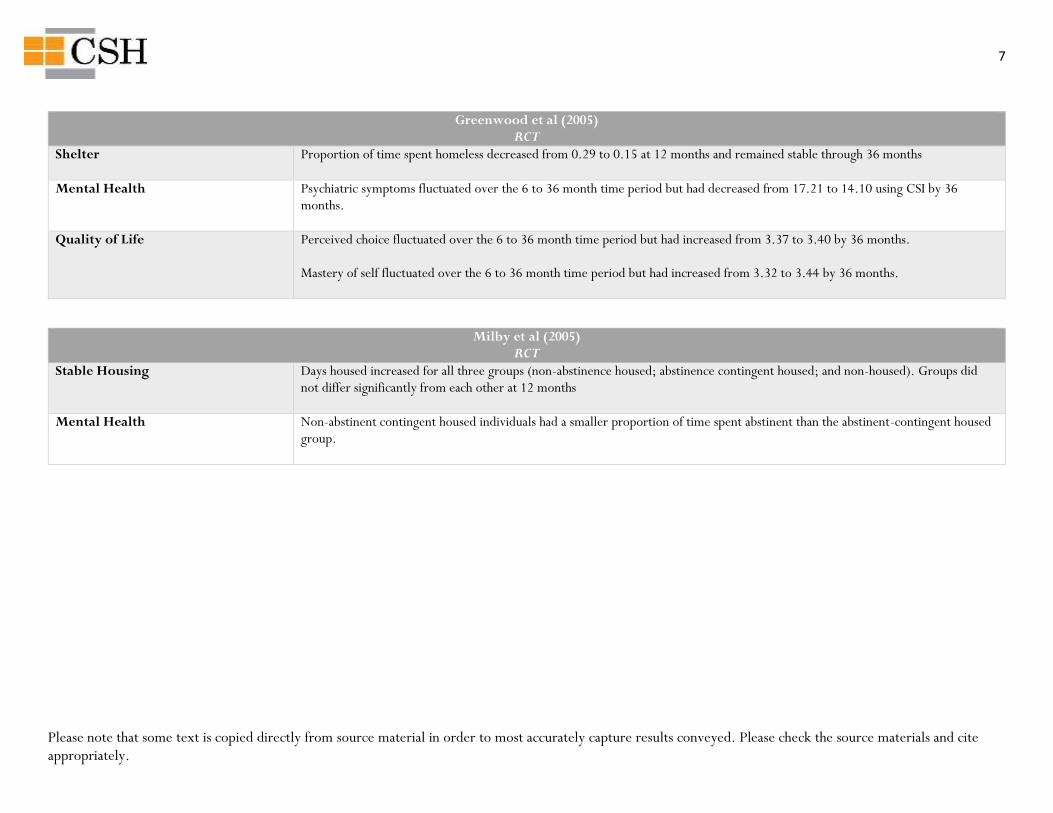
Greenwood et al (2005) RCT
Shelter Proportion of time spent homeless decreased from 0.29 to 0.15 at 12 months and remained stable through 36 months
Mental Health Psychiatric symptoms fluctuated over the 6 to 36 month time period but had decreased from 17.21 to 14.10 using CSI by 36 months.
Quality of Life Perceived choice fluctuated over the 6 to 36 month time period but had increased from 3.37 to 3.40 by 36 months. Mastery of self fluctuated over the 6 to 36 month time period but had increased from 3.32 to 3.44 by 36 months.
Milby et al (2005) RCT
Stable Housing Days housed increased for all three groups (non-abstinence housed; abstinence contingent housed; and non-housed). Groups did not differ significantly from each other at 12 months
Mental Health Non-abstinent contingent housed individuals had a smaller proportion of time spent abstinent than the abstinent-contingent housed group.
8
Please note that some text is copied directly from source material in order to most accurately capture results conveyed. Please check the source materials and cite appropriately.
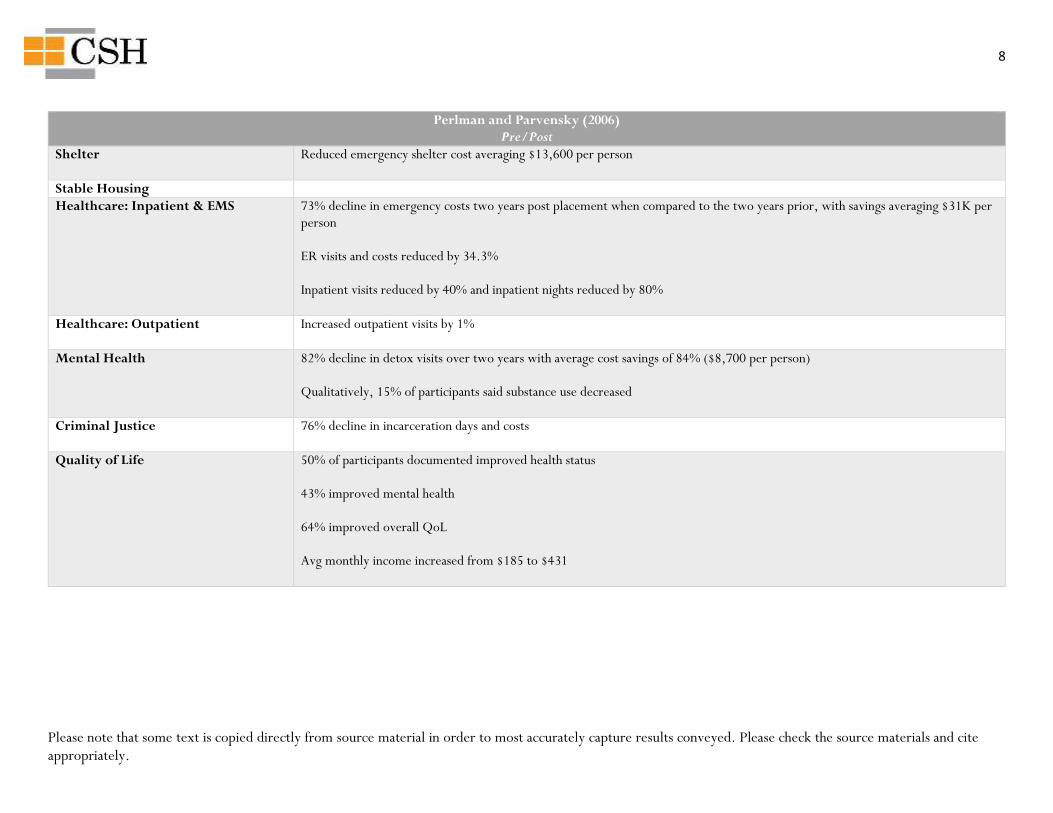
Perlman and Parvensky (2006) Pre/Post
Shelter Reduced emergency shelter cost averaging $13,600 per person
Stable Housing
Healthcare: Inpatient & EMS 73% decline in emergency costs two years post placement when compared to the two years prior, with savings averaging $31K per person ER visits and costs reduced by 34.3% Inpatient visits reduced by 40% and inpatient nights reduced by 80%
Healthcare: Outpatient Increased outpatient visits by 1%
Mental Health 82% decline in detox visits over two years with average cost savings of 84% ($8,700 per person) Qualitatively, 15% of participants said substance use decreased
Criminal Justice 76% decline in incarceration days and costs
Quality of Life 50% of participants documented improved health status 43% improved mental health 64% improved overall QoL Avg monthly income increased from $185 to $431
9
Please note that some text is copied directly from source material in order to most accurately capture results conveyed. Please check the source materials and cite appropriately.
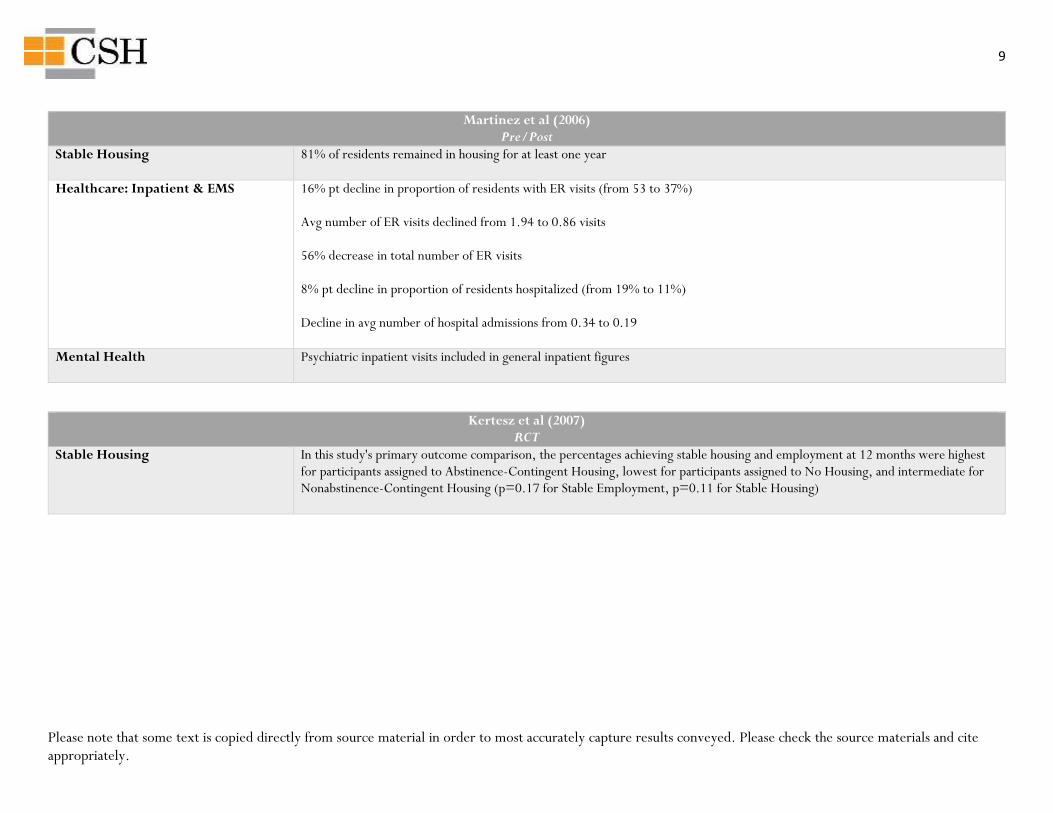
Martinez et al (2006) Pre/Post
Stable Housing 81% of residents remained in housing for at least one year
Healthcare: Inpatient & EMS 16% pt decline in proportion of residents with ER visits (from 53 to 37%) Avg number of ER visits declined from 1.94 to 0.86 visits 56% decrease in total number of ER visits 8% pt decline in proportion of residents hospitalized (from 19% to 11%) Decline in avg number of hospital admissions from 0.34 to 0.19
Mental Health Psychiatric inpatient visits included in general inpatient figures
Kertesz et al (2007) RCT
Stable Housing In this study's primary outcome comparison, the percentages achieving stable housing and employment at 12 months were highest for participants assigned to Abstinence-Contingent Housing, lowest for participants assigned to No Housing, and intermediate for Nonabstinence-Contingent Housing (p=0.17 for Stable Employment, p=0.11 for Stable Housing)
10
Please note that some text is copied directly from source material in order to most accurately capture results conveyed. Please check the source materials and cite appropriately.
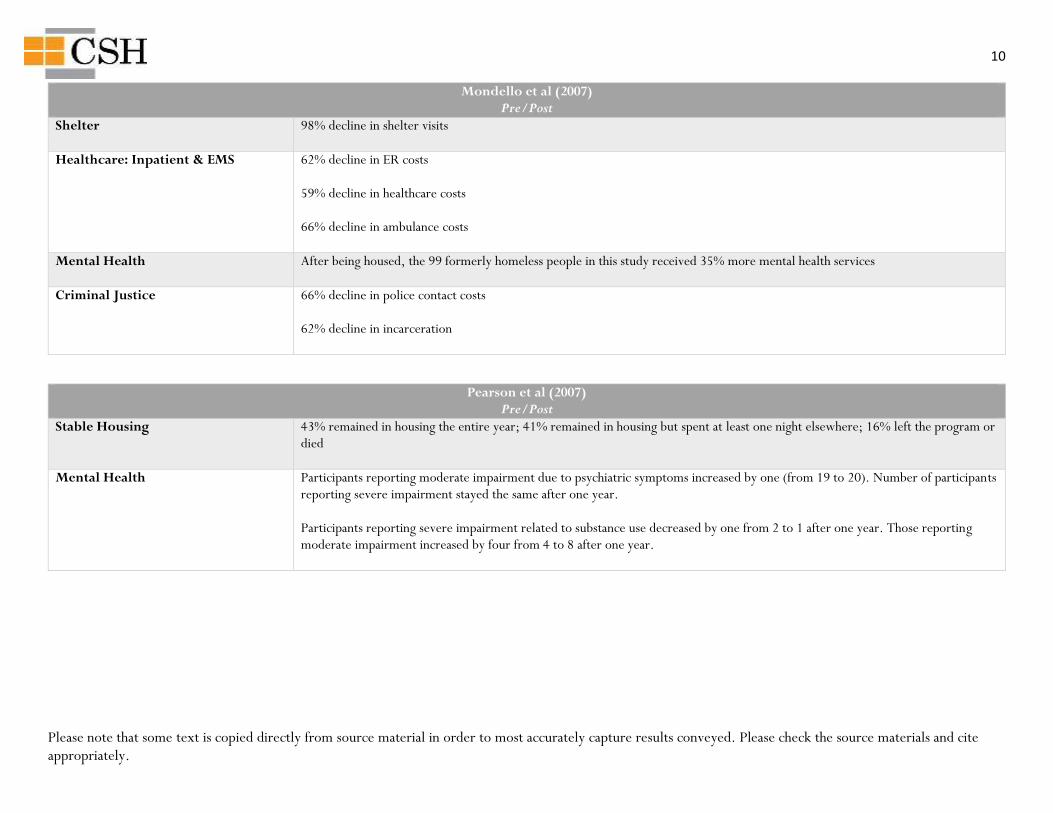
Mondello et al (2007) Pre/Post
Shelter 98% decline in shelter visits
Healthcare: Inpatient & EMS 62% decline in ER costs 59% decline in healthcare costs 66% decline in ambulance costs
Mental Health After being housed, the 99 formerly homeless people in this study received 35% more mental health services
Criminal Justice 66% decline in police contact costs 62% decline in incarceration
Pearson et al (2007) Pre/Post
Stable Housing 43% remained in housing the entire year; 41% remained in housing but spent at least one night elsewhere; 16% left the program or died
Mental Health Participants reporting moderate impairment due to psychiatric symptoms increased by one (from 19 to 20). Number of participants reporting severe impairment stayed the same after one year. Participants reporting severe impairment related to substance use decreased by one from 2 to 1 after one year. Those reporting moderate impairment increased by four from 4 to 8 after one year.
11
Please note that some text is copied directly from source material in order to most accurately capture results conveyed. Please check the source materials and cite appropriately.
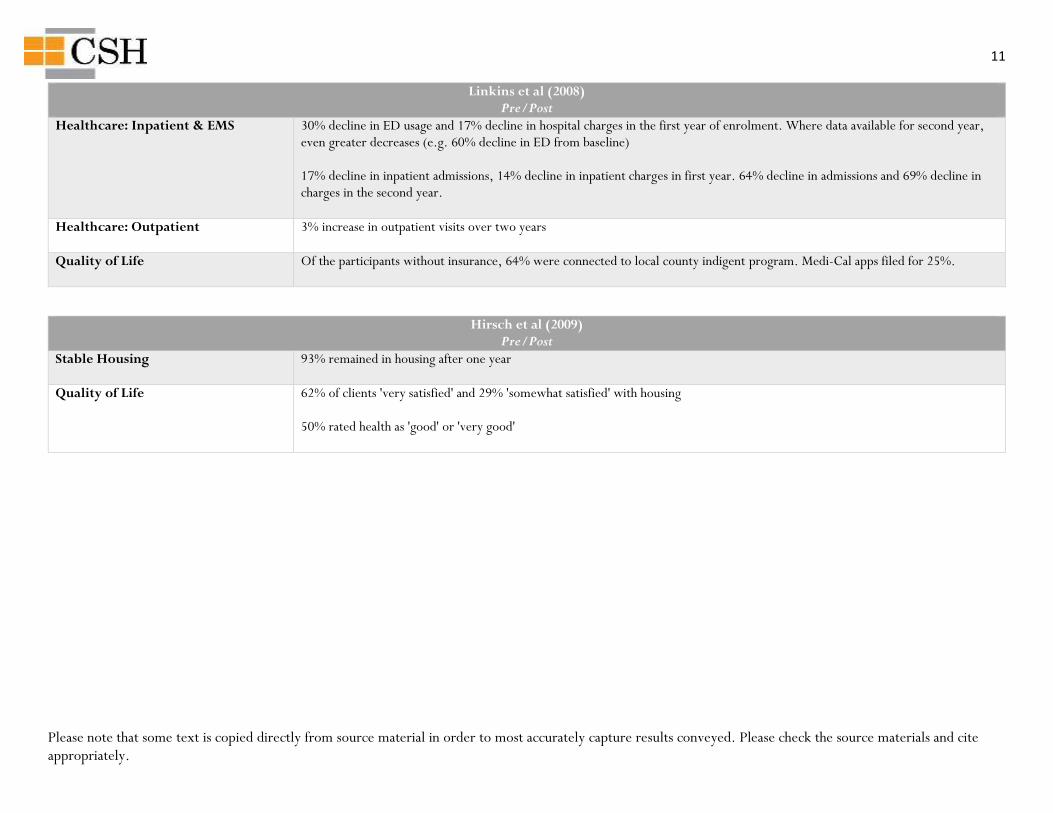
Linkins et al (2008) Pre/Post
Healthcare: Inpatient & EMS 30% decline in ED usage and 17% decline in hospital charges in the first year of enrolment. Where data available for second year, even greater decreases (e.g. 60% decline in ED from baseline) 17% decline in inpatient admissions, 14% decline in inpatient charges in first year. 64% decline in admissions and 69% decline in charges in the second year.
Healthcare: Outpatient 3% increase in outpatient visits over two years
Quality of Life Of the participants without insurance, 64% were connected to local county indigent program. Medi-Cal apps filed for 25%.
Hirsch et al (2009) Pre/Post
Stable Housing 93% remained in housing after one year
Quality of Life 62% of clients 'very satisfied' and 29% 'somewhat satisfied' with housing 50% rated health as 'good' or 'very good'
12
Please note that some text is copied directly from source material in order to most accurately capture results conveyed. Please check the source materials and cite appropriately.
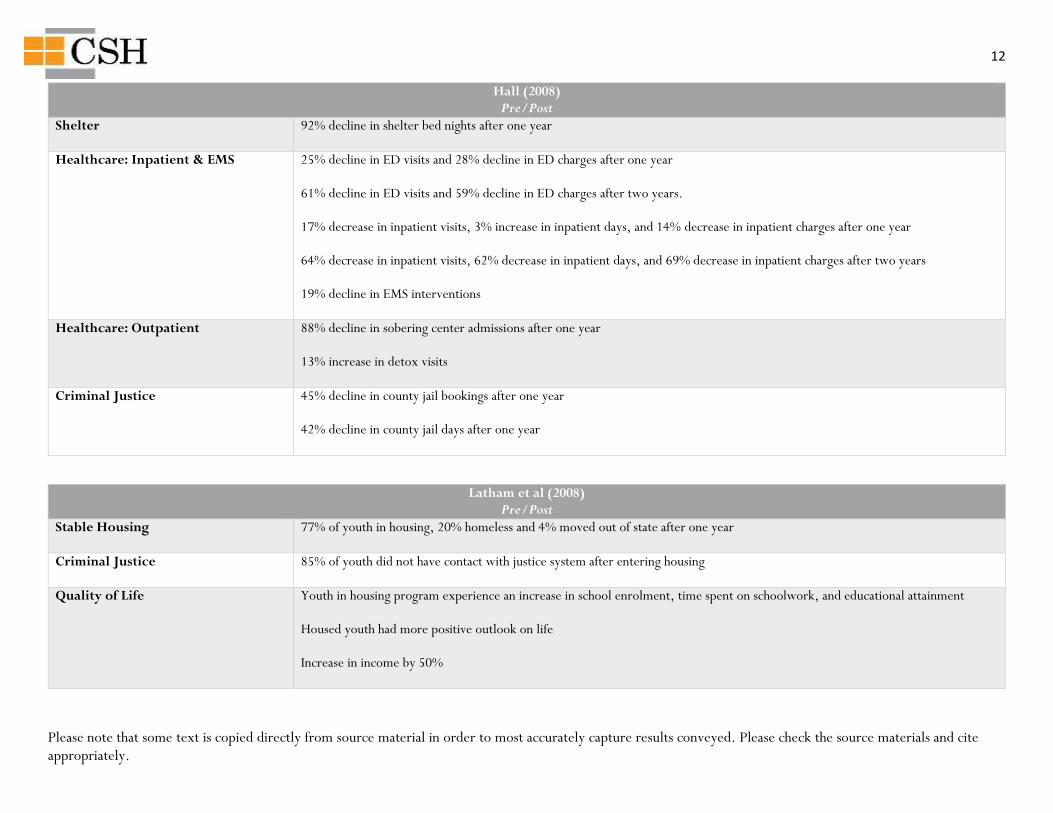
Hall (2008) Pre/Post
Shelter 92% decline in shelter bed nights after one year
Healthcare: Inpatient & EMS 25% decline in ED visits and 28% decline in ED charges after one year 61% decline in ED visits and 59% decline in ED charges after two years. 17% decrease in inpatient visits, 3% increase in inpatient days, and 14% decrease in inpatient charges after one year 64% decrease in inpatient visits, 62% decrease in inpatient days, and 69% decrease in inpatient charges after two years 19% decline in EMS interventions
Healthcare: Outpatient 88% decline in sobering center admissions after one year 13% increase in detox visits
Criminal Justice 45% decline in county jail bookings after one year 42% decline in county jail days after one year
Latham et al (2008) Pre/Post
Stable Housing 77% of youth in housing, 20% homeless and 4% moved out of state after one year
Criminal Justice 85% of youth did not have contact with justice system after entering housing
Quality of Life Youth in housing program experience an increase in school enrolment, time spent on schoolwork, and educational attainment Housed youth had more positive outlook on life Increase in income by 50%
13
Please note that some text is copied directly from source material in order to most accurately capture results conveyed. Please check the source materials and cite appropriately.
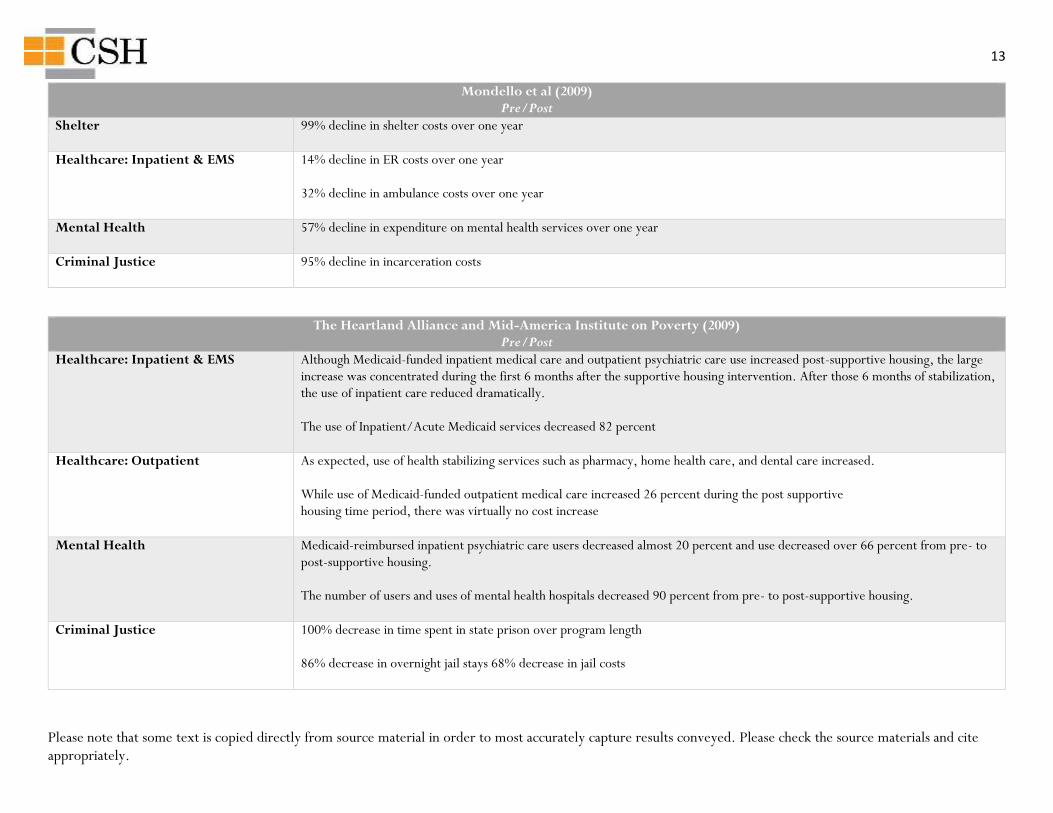
Mondello et al (2009) Pre/Post
Shelter 99% decline in shelter costs over one year
Healthcare: Inpatient & EMS 14% decline in ER costs over one year 32% decline in ambulance costs over one year
Mental Health 57% decline in expenditure on mental health services over one year
Criminal Justice 95% decline in incarceration costs
The Heartland Alliance and Mid-America Institute on Poverty (2009) Pre/Post
Healthcare: Inpatient & EMS Although Medicaid-funded inpatient medical care and outpatient psychiatric care use increased post-supportive housing, the large increase was concentrated during the first 6 months after the supportive housing intervention. After those 6 months of stabilization, the use of inpatient care reduced dramatically. The use of Inpatient/Acute Medicaid services decreased 82 percent
Healthcare: Outpatient As expected, use of health stabilizing services such as pharmacy, home health care, and dental care increased. While use of Medicaid-funded outpatient medical care increased 26 percent during the post supportive housing time period, there was virtually no cost increase
Mental Health Medicaid-reimbursed inpatient psychiatric care users decreased almost 20 percent and use decreased over 66 percent from pre- to post-supportive housing. The number of users and uses of mental health hospitals decreased 90 percent from pre- to post-supportive housing.
Criminal Justice 100% decrease in time spent in state prison over program length 86% decrease in overnight jail stays 68% decrease in jail costs
14
Please note that some text is copied directly from source material in order to most accurately capture results conveyed. Please check the source materials and cite appropriately.
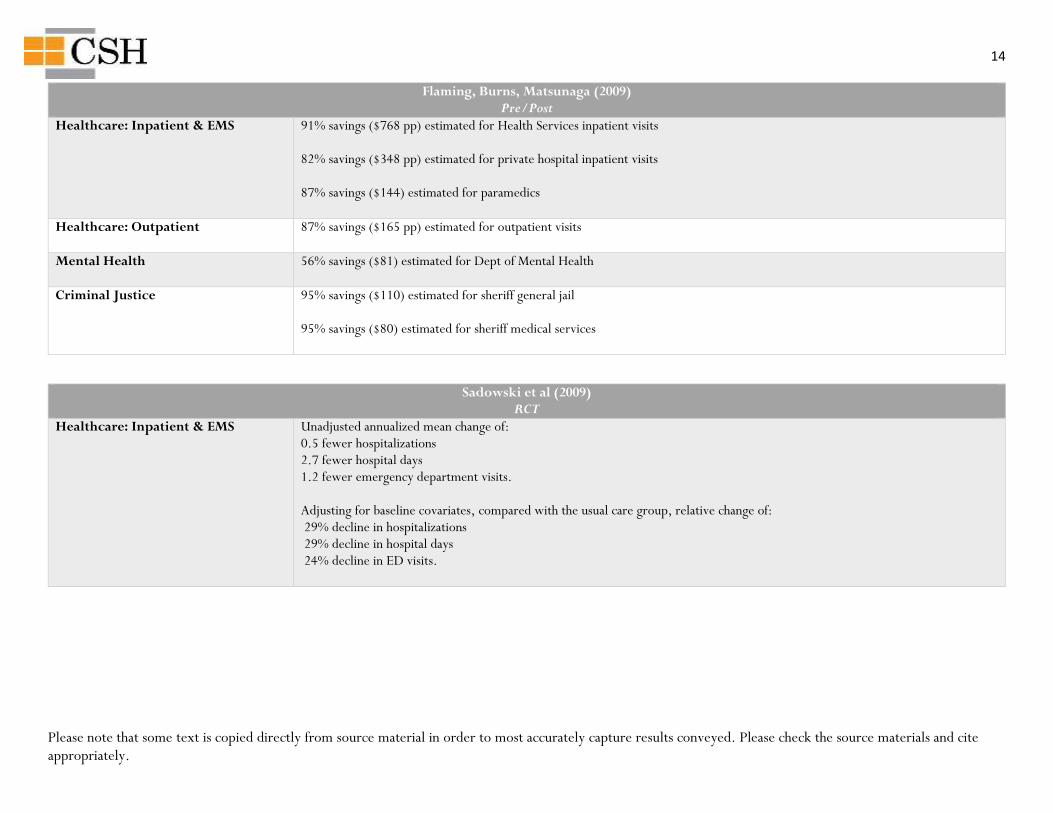
Flaming, Burns, Matsunaga (2009) Pre/Post
Healthcare: Inpatient & EMS 91% savings ($768 pp) estimated for Health Services inpatient visits 82% savings ($348 pp) estimated for private hospital inpatient visits 87% savings ($144) estimated for paramedics
Healthcare: Outpatient 87% savings ($165 pp) estimated for outpatient visits
Mental Health 56% savings ($81) estimated for Dept of Mental Health
Criminal Justice 95% savings ($110) estimated for sheriff general jail 95% savings ($80) estimated for sheriff medical services
Sadowski et al (2009) RCT
Healthcare: Inpatient & EMS Unadjusted annualized mean change of: 0.5 fewer hospitalizations 2.7 fewer hospital days 1.2 fewer emergency department visits. Adjusting for baseline covariates, compared with the usual care group, relative change of: 29% decline in hospitalizations 29% decline in hospital days 24% decline in ED visits.
15
Please note that some text is copied directly from source material in order to most accurately capture results conveyed. Please check the source materials and cite appropriately.
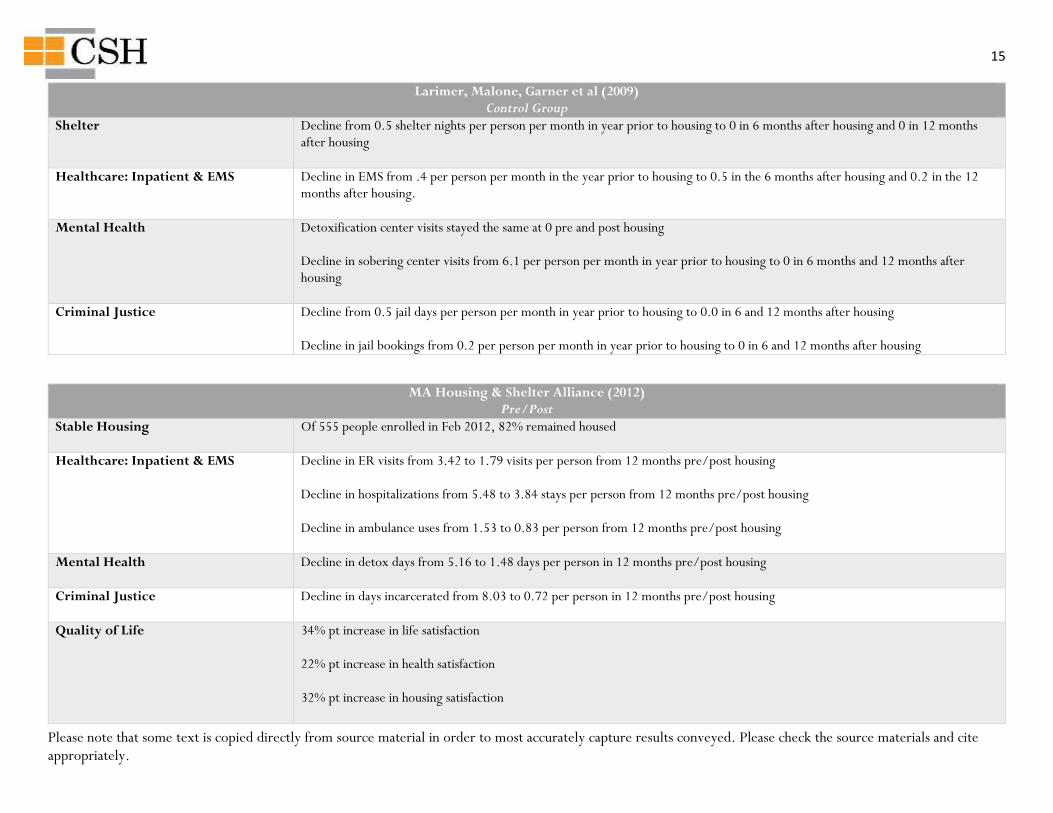
Larimer, Malone, Garner et al (2009) Control Group
Shelter Decline from 0.5 shelter nights per person per month in year prior to housing to 0 in 6 months after housing and 0 in 12 months after housing
Healthcare: Inpatient & EMS Decline in EMS from .4 per person per month in the year prior to housing to 0.5 in the 6 months after housing and 0.2 in the 12 months after housing.
Mental Health Detoxification center visits stayed the same at 0 pre and post housing Decline in sobering center visits from 6.1 per person per month in year prior to housing to 0 in 6 months and 12 months after housing
Criminal Justice Decline from 0.5 jail days per person per month in year prior to housing to 0.0 in 6 and 12 months after housing Decline in jail bookings from 0.2 per person per month in year prior to housing to 0 in 6 and 12 months after housing
MA Housing & Shelter Alliance (2012) Pre/Post
Stable Housing Of 555 people enrolled in Feb 2012, 82% remained housed
Healthcare: Inpatient & EMS Decline in ER visits from 3.42 to 1.79 visits per person from 12 months pre/post housing Decline in hospitalizations from 5.48 to 3.84 stays per person from 12 months pre/post housing Decline in ambulance uses from 1.53 to 0.83 per person from 12 months pre/post housing
Mental Health Decline in detox days from 5.16 to 1.48 days per person in 12 months pre/post housing
Criminal Justice Decline in days incarcerated from 8.03 to 0.72 per person in 12 months pre/post housing
Quality of Life 34% pt increase in life satisfaction 22% pt increase in health satisfaction 32% pt increase in housing satisfaction
16
Please note that some text is copied directly from source material in order to most accurately capture results conveyed. Please check the source materials and cite appropriately.
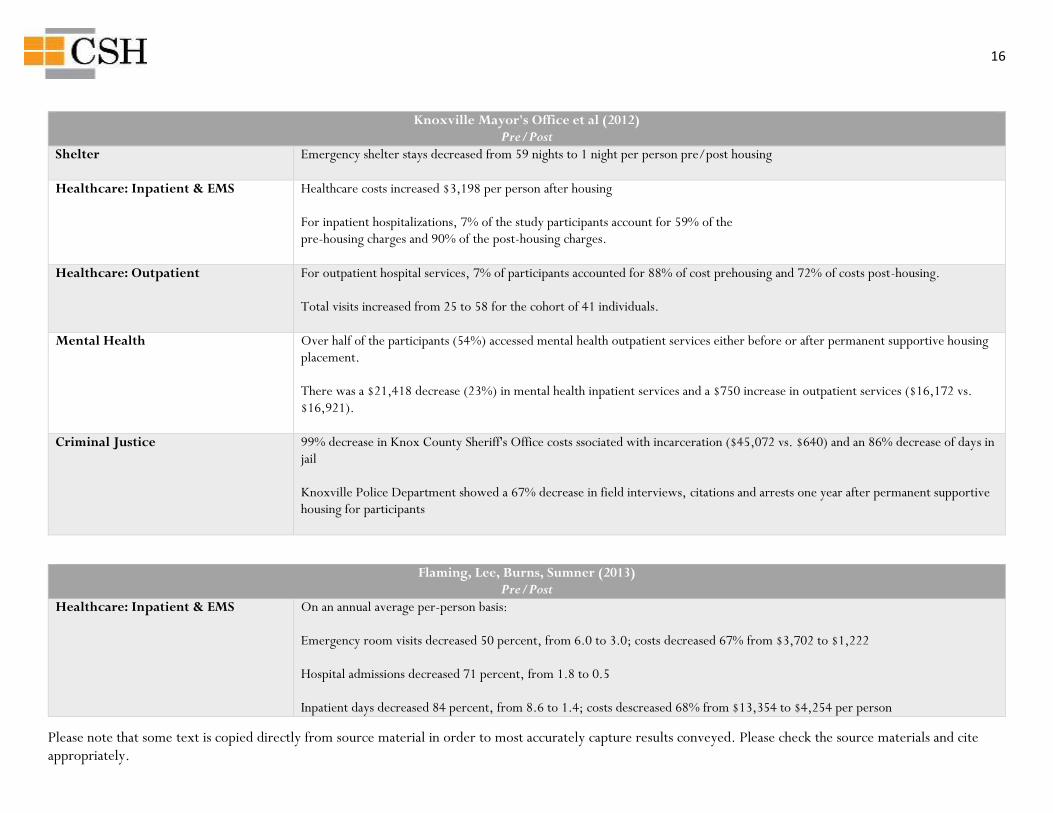
Knoxville Mayor's Office et al (2012) Pre/Post
Shelter Emergency shelter stays decreased from 59 nights to 1 night per person pre/post housing
Healthcare: Inpatient & EMS Healthcare costs increased $3,198 per person after housing For inpatient hospitalizations, 7% of the study participants account for 59% of the pre-housing charges and 90% of the post-housing charges.
Healthcare: Outpatient For outpatient hospital services, 7% of participants accounted for 88% of cost prehousing and 72% of costs post-housing. Total visits increased from 25 to 58 for the cohort of 41 individuals.
Mental Health Over half of the participants (54%) accessed mental health outpatient services either before or after permanent supportive housing placement. There was a $21,418 decrease (23%) in mental health inpatient services and a $750 increase in outpatient services ($16,172 vs. $16,921).
Criminal Justice 99% decrease in Knox County Sheriff's Office costs ssociated with incarceration ($45,072 vs. $640) and an 86% decrease of days in jail Knoxville Police Department showed a 67% decrease in field interviews, citations and arrests one year after permanent supportive housing for participants
Flaming, Lee, Burns, Sumner (2013) Pre/Post
Healthcare: Inpatient & EMS On an annual average per-person basis: Emergency room visits decreased 50 percent, from 6.0 to 3.0; costs decreased 67% from $3,702 to $1,222 Hospital admissions decreased 71 percent, from 1.8 to 0.5 Inpatient days decreased 84 percent, from 8.6 to 1.4; costs descreased 68% from $13,354 to $4,254 per person
17
Please note that some text is copied directly from source material in order to most accurately capture results conveyed. Please check the source materials and cite appropriately.
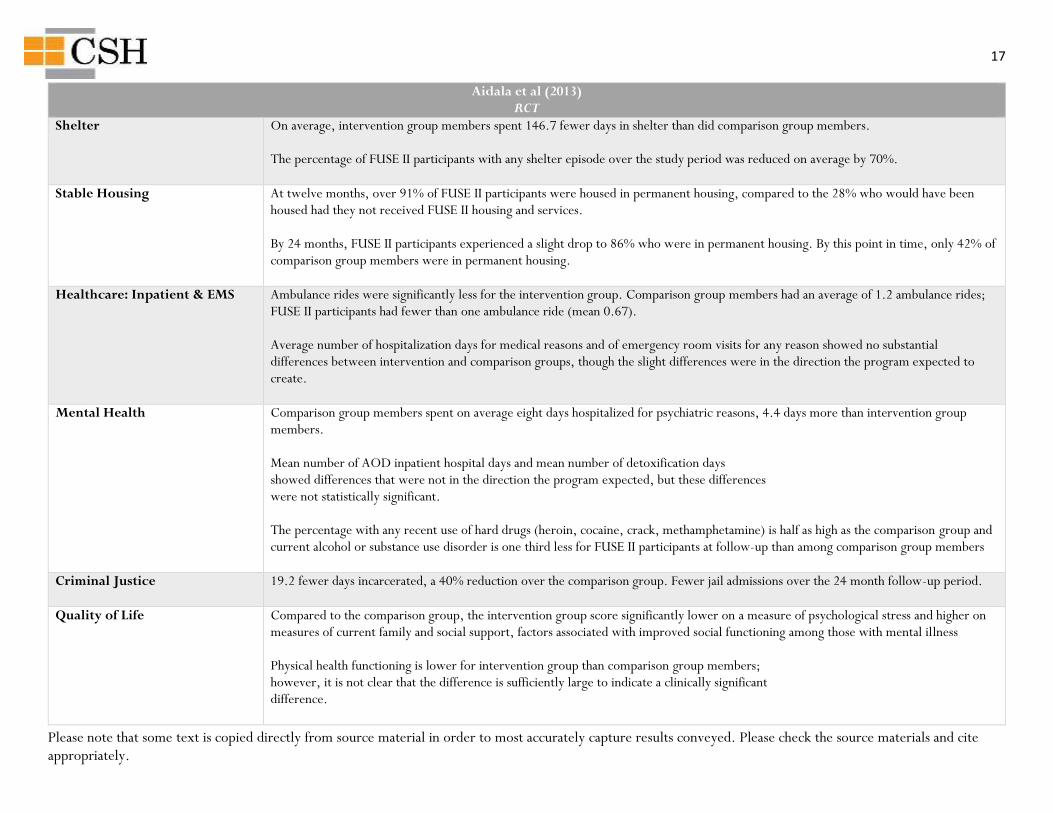
Aidala et al (2013) RCT
Shelter On average, intervention group members spent 146.7 fewer days in shelter than did comparison group members. The percentage of FUSE II participants with any shelter episode over the study period was reduced on average by 70%.
Stable Housing At twelve months, over 91% of FUSE II participants were housed in permanent housing, compared to the 28% who would have been housed had they not received FUSE II housing and services. By 24 months, FUSE II participants experienced a slight drop to 86% who were in permanent housing. By this point in time, only 42% of comparison group members were in permanent housing.
Healthcare: Inpatient & EMS Ambulance rides were significantly less for the intervention group. Comparison group members had an average of 1.2 ambulance rides; FUSE II participants had fewer than one ambulance ride (mean 0.67). Average number of hospitalization days for medical reasons and of emergency room visits for any reason showed no substantial differences between intervention and comparison groups, though the slight differences were in the direction the program expected to create.
Mental Health Comparison group members spent on average eight days hospitalized for psychiatric reasons, 4.4 days more than intervention group members. Mean number of AOD inpatient hospital days and mean number of detoxification days showed differences that were not in the direction the program expected, but these differences were not statistically significant. The percentage with any recent use of hard drugs (heroin, cocaine, crack, methamphetamine) is half as high as the comparison group and current alcohol or substance use disorder is one third less for FUSE II participants at follow-up than among comparison group members
Criminal Justice 19.2 fewer days incarcerated, a 40% reduction over the comparison group. Fewer jail admissions over the 24 month follow-up period.
Quality of Life Compared to the comparison group, the intervention group score significantly lower on a measure of psychological stress and higher on measures of current family and social support, factors associated with improved social functioning among those with mental illness Physical health functioning is lower for intervention group than comparison group members; however, it is not clear that the difference is sufficiently large to indicate a clinically significant difference.
18
Please note that some text is copied directly from source material in order to most accurately capture results conveyed. Please check the source materials and cite appropriately.
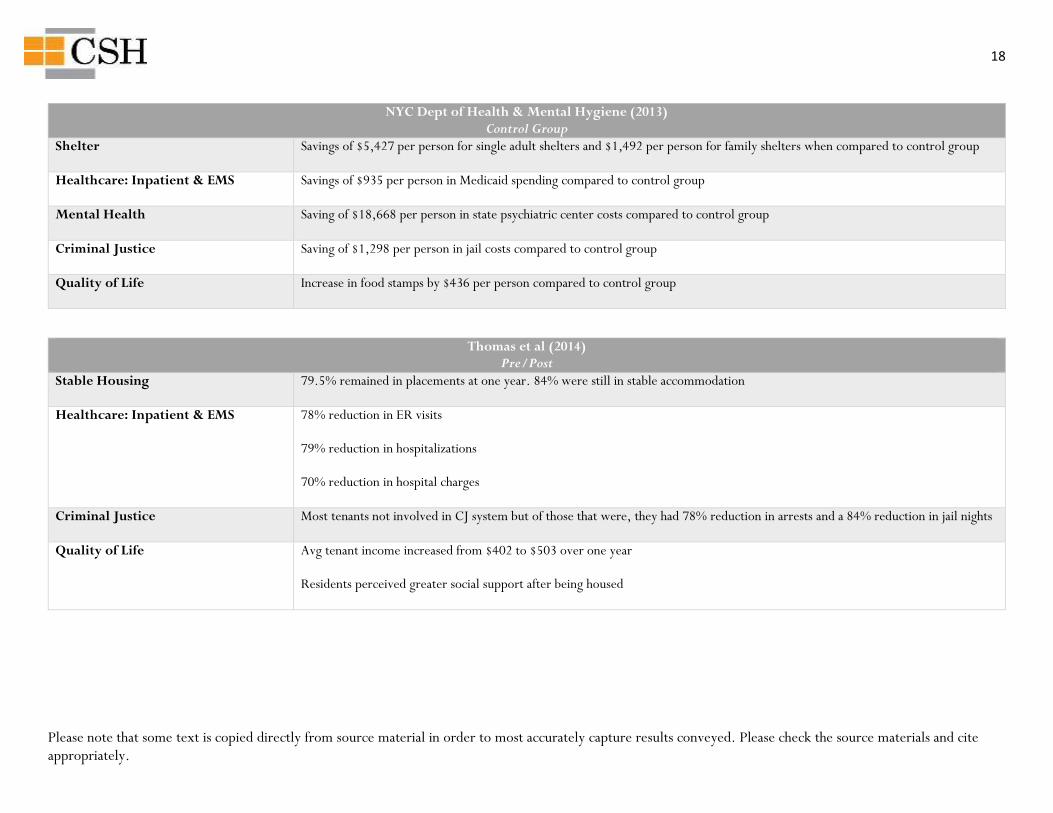
NYC Dept of Health & Mental Hygiene (2013) Control Group
Shelter Savings of $5,427 per person for single adult shelters and $1,492 per person for family shelters when compared to control group
Healthcare: Inpatient & EMS Savings of $935 per person in Medicaid spending compared to control group
Mental Health Saving of $18,668 per person in state psychiatric center costs compared to control group
Criminal Justice Saving of $1,298 per person in jail costs compared to control group
Quality of Life Increase in food stamps by $436 per person compared to control group
Thomas et al (2014) Pre/Post
Stable Housing 79.5% remained in placements at one year. 84% were still in stable accommodation
Healthcare: Inpatient & EMS 78% reduction in ER visits 79% reduction in hospitalizations 70% reduction in hospital charges
Criminal Justice Most tenants not involved in CJ system but of those that were, they had 78% reduction in arrests and a 84% reduction in jail nights
Quality of Life Avg tenant income increased from $402 to $503 over one year Residents perceived greater social support after being housed
19
Please note that some text is copied directly from source material in order to most accurately capture results conveyed. Please check the source materials and cite appropriately.
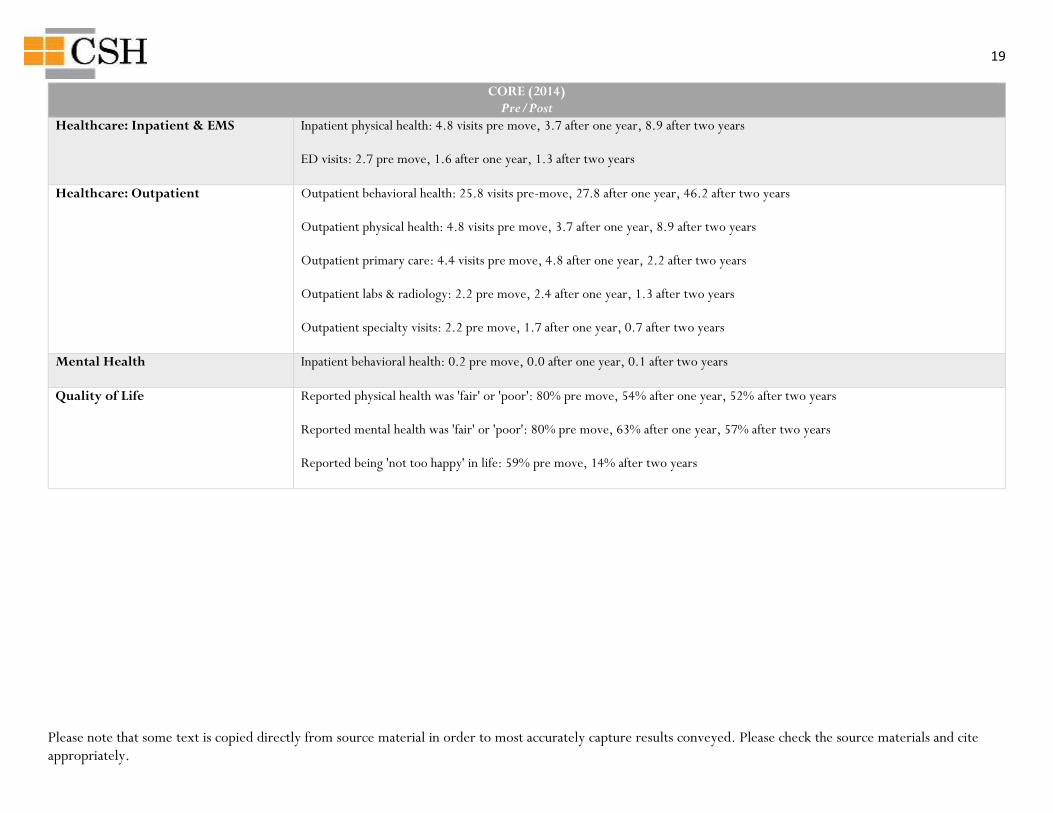
CORE (2014) Pre/Post
Healthcare: Inpatient & EMS Inpatient physical health: 4.8 visits pre move, 3.7 after one year, 8.9 after two years ED visits: 2.7 pre move, 1.6 after one year, 1.3 after two years
Healthcare: Outpatient Outpatient behavioral health: 25.8 visits pre-move, 27.8 after one year, 46.2 after two years Outpatient physical health: 4.8 visits pre move, 3.7 after one year, 8.9 after two years Outpatient primary care: 4.4 visits pre move, 4.8 after one year, 2.2 after two years Outpatient labs & radiology: 2.2 pre move, 2.4 after one year, 1.3 after two years Outpatient specialty visits: 2.2 pre move, 1.7 after one year, 0.7 after two years
Mental Health Inpatient behavioral health: 0.2 pre move, 0.0 after one year, 0.1 after two years
Quality of Life Reported physical health was 'fair' or 'poor': 80% pre move, 54% after one year, 52% after two years Reported mental health was 'fair' or 'poor': 80% pre move, 63% after one year, 57% after two years Reported being 'not too happy' in life: 59% pre move, 14% after two years
20
Please note that some text is copied directly from source material in order to most accurately capture results conveyed. Please check the source materials and cite appropriately.
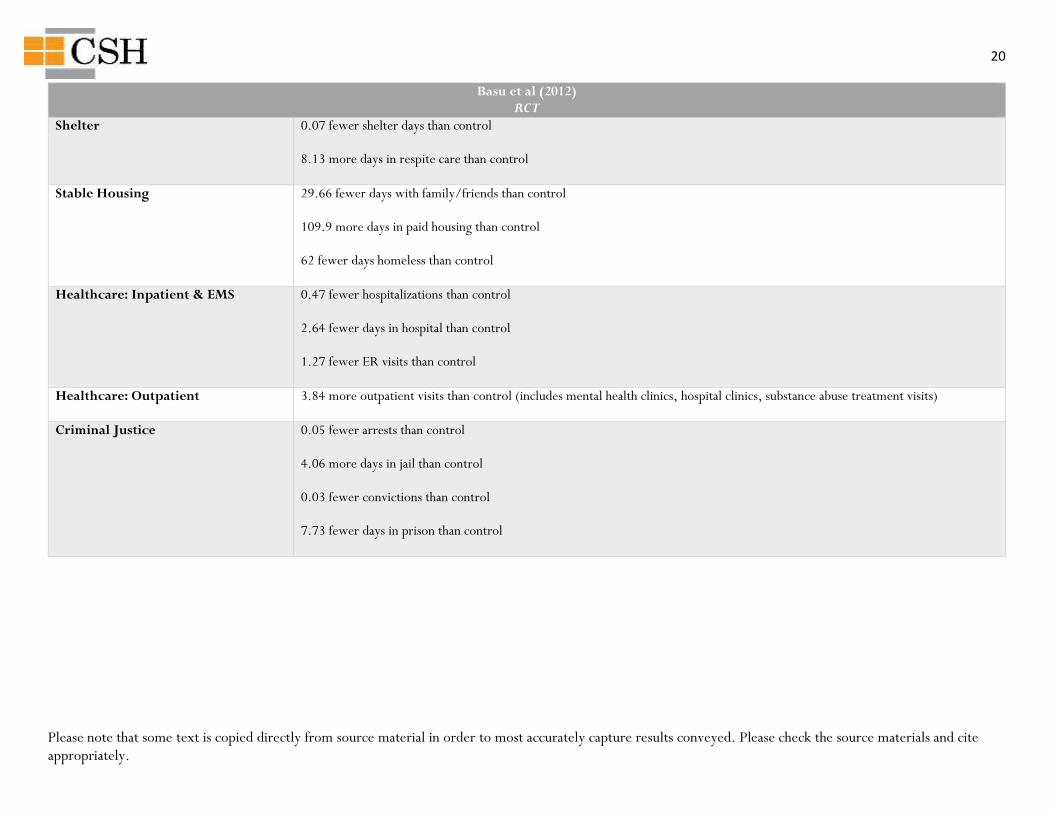
Basu et al (2012) RCT
Shelter 0.07 fewer shelter days than control 8.13 more days in respite care than control
Stable Housing 29.66 fewer days with family/friends than control 109.9 more days in paid housing than control 62 fewer days homeless than control
Healthcare: Inpatient & EMS 0.47 fewer hospitalizations than control 2.64 fewer days in hospital than control 1.27 fewer ER visits than control
Healthcare: Outpatient 3.84 more outpatient visits than control (includes mental health clinics, hospital clinics, substance abuse treatment visits)
Criminal Justice 0.05 fewer arrests than control 4.06 more days in jail than control 0.03 fewer convictions than control 7.73 fewer days in prison than control
21
Please note that some text is copied directly from source material in order to most accurately capture results conveyed. Please check the source materials and cite appropriately.
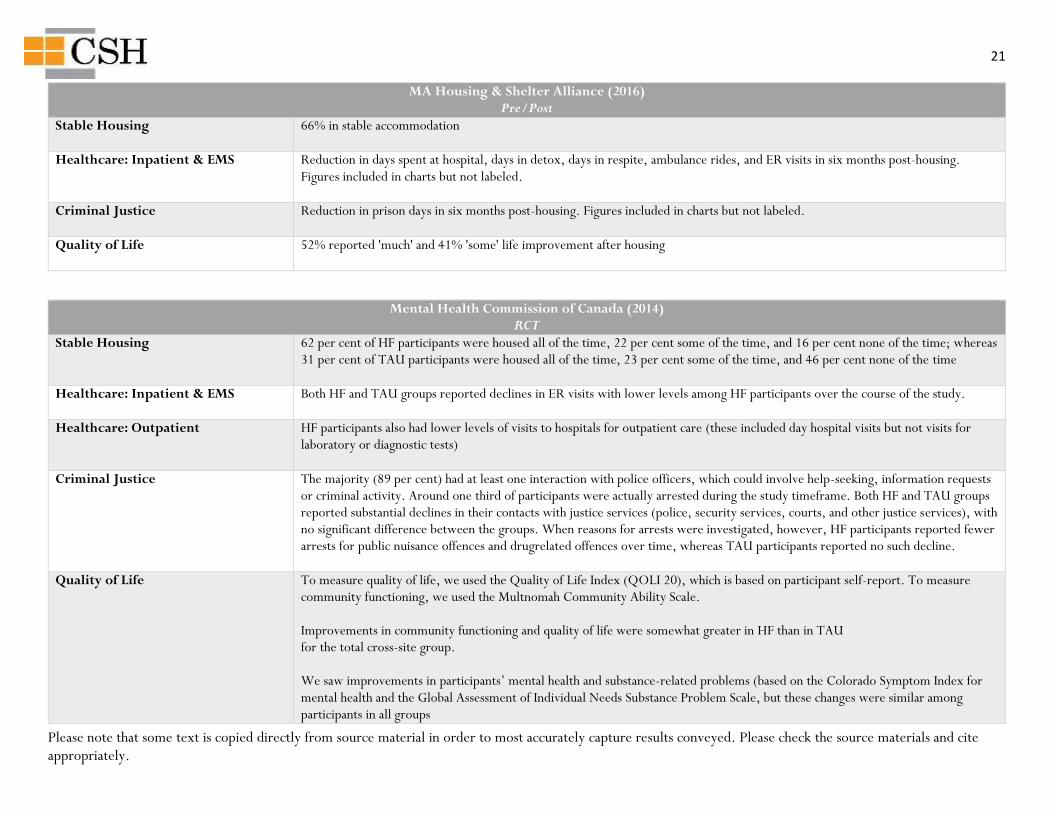
MA Housing & Shelter Alliance (2016) Pre/Post
Stable Housing 66% in stable accommodation
Healthcare: Inpatient & EMS Reduction in days spent at hospital, days in detox, days in respite, ambulance rides, and ER visits in six months post-housing. Figures included in charts but not labeled.
Criminal Justice Reduction in prison days in six months post-housing. Figures included in charts but not labeled.
Quality of Life 52% reported 'much' and 41% 'some' life improvement after housing
Mental Health Commission of Canada (2014) RCT
Stable Housing 62 per cent of HF participants were housed all of the time, 22 per cent some of the time, and 16 per cent none of the time; whereas 31 per cent of TAU participants were housed all of the time, 23 per cent some of the time, and 46 per cent none of the time
Healthcare: Inpatient & EMS Both HF and TAU groups reported declines in ER visits with lower levels among HF participants over the course of the study.
Healthcare: Outpatient HF participants also had lower levels of visits to hospitals for outpatient care (these included day hospital visits but not visits for laboratory or diagnostic tests)
Criminal Justice The majority (89 per cent) had at least one interaction with police officers, which could involve help-seeking, information requests or criminal activity. Around one third of participants were actually arrested during the study timeframe. Both HF and TAU groups reported substantial declines in their contacts with justice services (police, security services, courts, and other justice services), with no significant difference between the groups. When reasons for arrests were investigated, however, HF participants reported fewer arrests for public nuisance offences and drugrelated offences over time, whereas TAU participants reported no such decline.
Quality of Life To measure quality of life, we used the Quality of Life Index (QOLI 20), which is based on participant self-report. To measure community functioning, we used the Multnomah Community Ability Scale. Improvements in community functioning and quality of life were somewhat greater in HF than in TAU for the total cross-site group. We saw improvements in participants’ mental health and substance-related problems (based on the Colorado Symptom Index for mental health and the Global Assessment of Individual Needs Substance Problem Scale, but these changes were similar among participants in all groups
22
Please note that some text is copied directly from source material in order to most accurately capture results conveyed. Please check the source materials and cite appropriately.
If you notice any corrections or have other comments, please direct these to [email protected].