cross-border funding of microfinance - cgap · cross-border funding represents the lion’s share...
TRANSCRIPT
As of December 2009, cross-border funders
reported commitments to microfinance1 of
US$21.3 billion, reflecting a 17 percent increase (US$3
billion) over 2008 commitments.2 Although this rate
of increase is lower than the prior year’s 30 percent
growth rate, cross-border funding is expected to
continue growing.3 Of cross-border funders, public
funders provide a larger share of commitments,
though private funders are growing their commitments
at a higher rate, with 2009 commitments one-third
higher than 2008 commitments. In some markets,
cross-border funding represents the lion’s share of
microfinance institutions’ (MFIs’) funding base. Yet,
where institutions can mobilize deposits and where
local capital markets exist, cross-border flows are likely
to represent a small part of the picture (see Box 1).
This Focus Note draws on data from CGAP’s annual
surveys on cross-border funding (2009, 2010) to
provide an overview of the microfinance funding
landscape and trends in cross-border funding.
Who is funding microfinance and how?
The US$21.3 billion in commitments to microfinance
includes funding from more than 61 funders and 90
microfinance investment intermediaries (MIIs) that
reported to the CGAP survey. Funders’ commitments
represent all active investments and projects supporting
microfinance. As the typical project length is around
three to five years, commitments include funds
already disbursed as well as funds not yet disbursed.
While commitments do not tell us how much funding
reaches the microfinance sector within a given year,
it is currently the most reliable indicator available for
analyzing overall trends in microfinance funding.4
A broad range of cross-border funders—public
(multilateral and bilateral donors, United Nations
[UN] agencies, and development finance institutions
[DFIs]) and private (foundations and institutional and
individual investors)—contribute to microfinance in
different ways. Most public funders use microfinance as
a tool to achieve development goals, such as poverty
reduction, economic and social development, and
financial inclusion. In contrast, for private investors,
microfinance presents an opportunity to diversify
their investment portfolios, while also doing good.
Public funders are largely funded by government
budgets, though some also raise money in capital
markets. Private funders, in contrast, include individual
investors, institutional investors, and foundations.
With private interests driving their activities, private
funders do not have political pressure, nor are they
publicly accountable for the uses of their funds.
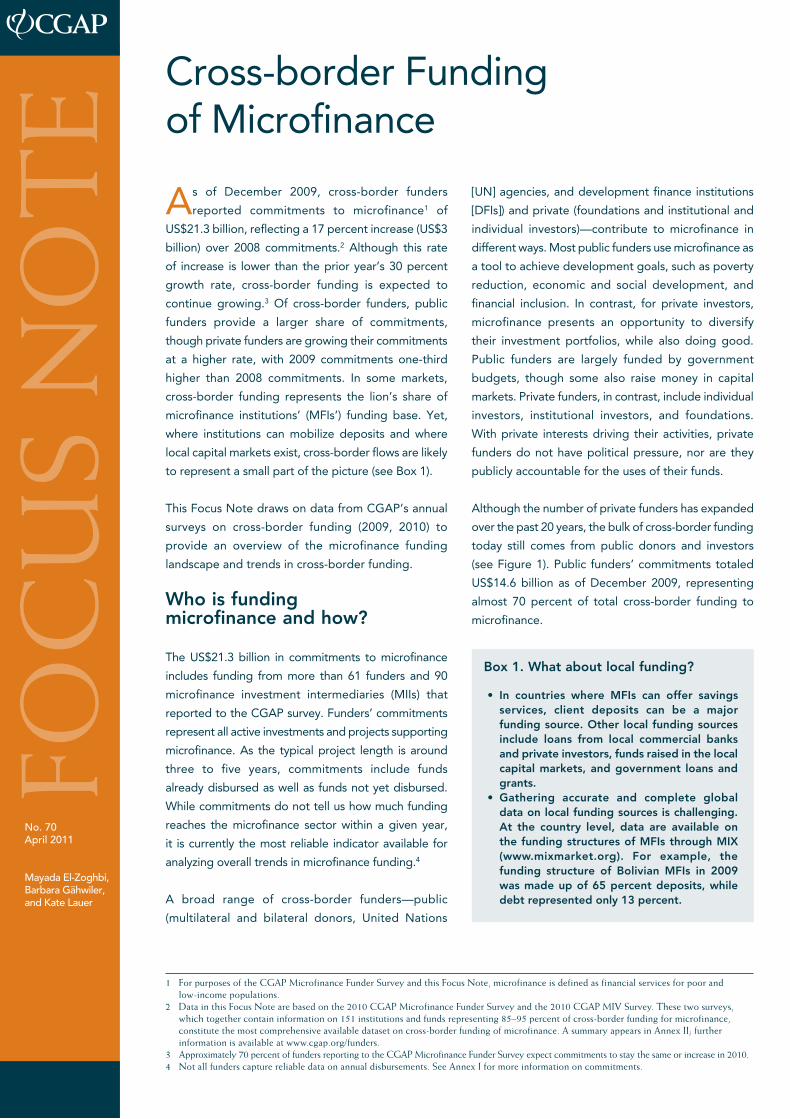
Although the number of private funders has expanded
over the past 20 years, the bulk of cross-border funding
today still comes from public donors and investors
(see Figure 1). Public funders’ commitments totaled
US$14.6 billion as of December 2009, representing
almost 70 percent of total cross-border funding to
microfinance.
Cross-border Funding of Microfinance
1 ForpurposesoftheCGAPMicrofinanceFunderSurveyandthisFocusNote,microfinanceisdefinedasfinancialservicesforpoorandlow-incomepopulations.
2 DatainthisFocusNotearebasedonthe2010CGAPMicrofinanceFunderSurveyandthe2010CGAPMIVSurvey.Thesetwosurveys,whichtogethercontaininformationon151institutionsandfundsrepresenting85–95percentofcross-borderfundingformicrofinance,constitutethemostcomprehensiveavailabledatasetoncross-borderfundingofmicrofinance.AsummaryappearsinAnnexII;furtherinformationisavailableatwww.cgap.org/funders.
3 Approximately70percentoffundersreportingtotheCGAPMicrofinanceFunderSurveyexpectcommitmentstostaythesameorincreasein2010.4 Notallfunderscapturereliabledataonannualdisbursements.SeeAnnexIformoreinformationoncommitments.
No. 70April 2011
Mayada El-Zoghbi, Barbara Gähwiler, and Kate Lauer
FoC
uS
No
Te
Box 1. What about local funding?
• In countries where MFIs can offer savings services, client deposits can be a major funding source. Other local funding sources include loans from local commercial banks and private investors, funds raised in the local capital markets, and government loans and grants.
• Gathering accurate and complete global data on local funding sources is challenging. At the country level, data are available on the funding structures of MFIs through MIX (www.mixmarket.org). For example, the funding structure of Bolivian MFIs in 2009 was made up of 65 percent deposits, while debt represented only 13 percent.
2
As of December 2009, private funders had US$6.7
billion committed to microfinance, representing around
30 percent of total commitments to microfinance.
Institutional investors, such as commercial banks,
pension funds, insurance companies, private equity
firms, and other corporate investors, have become
a major source of funding. Demand from individual
investors—both high-net-worth individuals and
retail investors—to invest in microfinance has also
significantly increased over the past few years following
a general trend toward socially responsible investment
(SRI). Sustainable and responsible investments, which
combine investors’ financial objectives with their
concerns about environmental, social, and governance
issues, are gaining popularity in the United States and
in Europe. Between 2007 and 2009, the European SRI
market increased by an annual compound growth rate
of 37 percent, and total assets under management
reached EUR 5 trillion by the end of 2009. Eurosif,
a pan-European network promoting sustainable and
responsible investment, forecasts that microfinance
will be of significant interest to European investors in
the coming years, with growth coming mostly from
institutional investors (Eurosif 2010).
Microfinance also receives funding from private
donors, mostly in the form of grants. Commitments
from foundations and international nongovermental
organizations (NGOs) totaled approximately US$1.1
billion. CGAP has identified over 400 foundations
with some activities in microfinance, but only a
few reach significant scale. Having increased their
commitments to microfinance significantly over the
past three years, the Bill & Melinda Gates Foundation
is now among the 10 largest cross-border funders.
Intermediaries play a significant role in channeling funding to microfinance
Almost half of total cross-border funding is channeled
through MIIs and local wholesale facilities (also called
apexes). The other half is provided directly to retail
providers, such as MFIs and banks; meso-level actors,
such as training centers, rating agencies, and credit
bureaus; and government programs and agencies in
the policy space.
Growing interest from individual and institutional
investors to invest in microfinance has led to the
emergence of over 100 intermediaries, including
microfinance investment vehicles (MIVs), holding
companies (such as ProCredit), and peer-to-peer
lending platforms (such as Kiva and Babyloan).
These intermediaries combined managed over US$8.1
$14.6 billion $6.7 billion
Microfinance
$1.2 blnApexes and
otherIntermediaries
Nodata
$0.1 bln
Public Donors andInvestors
(Multilaterals, Bilaterals, DFIs)
(Support for microfinance at all levels of the financial system: retail, market infrastructure, and policy)
Private Donors andInvestors
(Foundations, Institutional andIndividual Investors)
a Amounts based on data submitted by 61 funders and 90 MIIs. b Includes funding through governments.
MicrofinanceInvestment
Intermediaries(MIIs)
$5.7 bln$0.9blnb
$11blnb
$8.1bln
$2.4 bln
Total Commitments to Microfinance as of December 2009: $21.3 billiona
Figure 1: Cross-border funding landscape
3
billion as of December 2009 (CGAP 2010e). Some MIVs
are open to retail investors, including Dexia Microcredit
Fund, responsAbility, Microfinanzfonds, and Triodos
SICAV. Other funds are open only for private placements
by qualified investors; they typically receive a majority of
funding from development banks and other DFIs. Some
MIVs are set up as cooperatives or NGOs, for example,
Incofin, Oikocredit, and Consorzio Etimos.
Another type of intermediary is the local apex.
While apexes are funded with public money (often
including government funding), they can take various
institutional forms, such as development banks,
NGOs, or donor or government programs; some are
housed within private commercial banks. The top 15
apexes in the world had an outstanding portfolio of
US$3 billion in 2009.5
Majority of money destined to refinance a range of retail providers
Cross-border funders support a diverse range of
institutions that provide financial services for poor
people, including NGOs, greenfield banks, postal
and savings banks, commercial banks, cooperatives,
and self-help groups. Many other private firms are
also recipients of funding for microfinance, including
rating agencies, accounting firms, training centers,
telecommunications firms, payment platforms, and
others. Cross-border funding also goes to public
sector agencies, including government agencies,
ministries, state-owned banks, and wholesale entities.
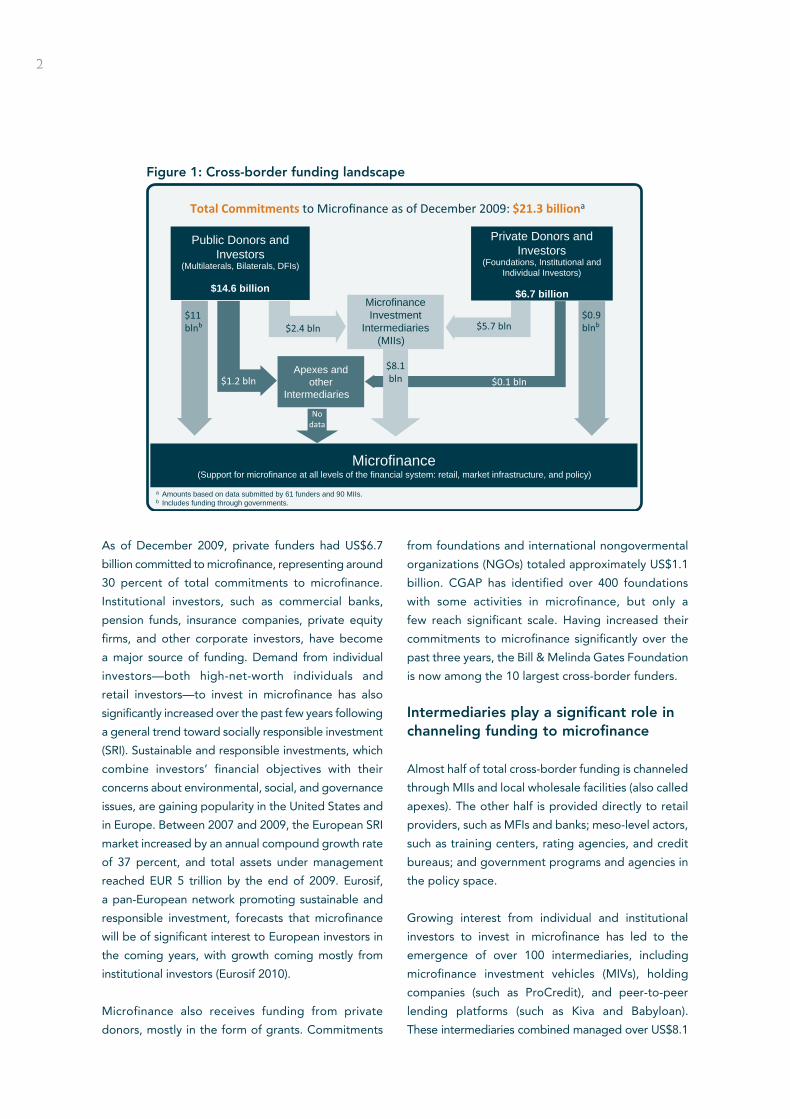
As of December 2009, 88 percent of total commit-
ments for microfinance were intended to finance the
loan portfolios of MFIs (see Figure 2). Only 8 percent
of funds were used to build the capacity of retail MFIs.
A small amount of commitments, 4 percent of the
total amount, was used to strengthen the market
infrastructure and legal and regulatory environment.
Debt dominates the picture
Cross-border funding for microfinance usually takes the
form of debt (whether at market rates or concessional
rates). DFIs and MIIs are the main providers of debt
funding for financial service providers, which use these
funds to finance their loan portfolios. UN agencies and
multilateral organizations, such as the World Bank,
the Asian Development Bank, and International Fund
for Agricultural Development (IFAD), provide loans to
governments. Governments then use the funds to on-
lend to MFIs and to support capacity-building initiatives
at the retail, market infrastructure, and policy levels.
DFIs, and increasingly MIIs, also invest in the equity of
financial services providers, which strengthens their
capital structure and can help them access additional
debt funding. DFIs also use guarantees to help
financial service providers access funding from local
commercial banks.
Bilateral agencies, foundations, and NGOs predom-
inantly use grants to fund financial service providers
so that they can grow and increase the quality and
scope of services offered. Grants are also used for
capacity building at the market infrastructure level
and to strengthen the regulatory environment and
build the capacity of policy makers, central banks,
and supervisory authorities.
5 ThisisbasedonresearchthatCGAPconductedin2010.ForpriorCGAPresearchonapexesseeCGAP(2010d).
Figure 2: The purpose of funding (% of total commitments as of December 2009)
8%
2%
2%
Capacity Building12%
On-lending
Retail Capacity Building
Capacity Building at the Market Infrastructure Level
Capacity Building at the Policy Level
On-lending88%
Figure 2: The purpose of funding (% of total commitments as of December 2009)
4
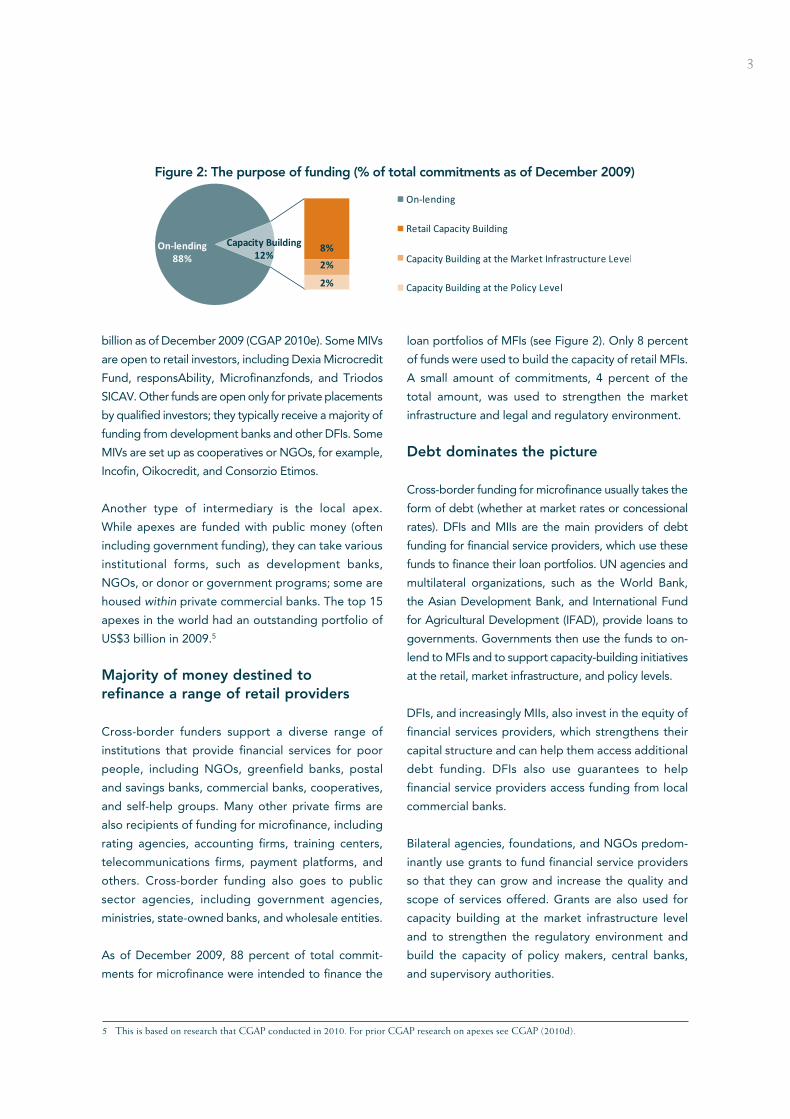
Figure 3 shows the variety of funding instruments
used by different types of funders to support
microfinance.6 The US$21.3 billion total committed
combines all of these instruments, whether funds
have to be repaid or not (loans versus grants),
whether they are disbursed or not (e.g., guarantees),
and whether they respond to immediate funding
needs of MFIs (debt funding) or help build the sector
in the long term (e.g., grants for capacity building).
Trends in cross-border funding
Commitments growing; disbursements lower in 2009
Despite fears that funding for financial services for
the poor would decline as a result of the 2008–
2009 financial crisis and strained national budgets
in the developed world, cross-border funding to
microfinance has continued to increase, albeit at a
slower rate. As noted, total commitments increased by
17 percent from 2008 to 2009, compared to around
30 percent in the previous year. However, at US$3.2
billion, disbursements in 2009 were on average 10
percent lower than in 2008.
DFIs drive growth in commitments
With commitments of more than US$8.8 billion as of
December 2009, DFIs accounted for 42 percent of
total commitments to microfinance.7 While other public
funders decreased their commitments in 2009 (bilateral
agencies by 9 percent and multilateral and UN agencies
by 7 percent), DFIs increased their commitments by
28 percent.8 This growth can also be attributed in part
to DFIs’ anticipation of liquidity shortages due to the
financial crisis. The International Finance Corporation
(IFC) and KfW committed US$150 million each to launch
the Microfinance Enhancement Facility, which also
attracted funding from other DFIs. This facility provided
sustainable MFIs with liquidity when commercial lending
was scarce. In general, emergency liquidity facilities
were used in Europe and Central Asia (ECA) and Central
America, the regions most affected by the crisis.
6 Thefigureshowswhatfundinginstrumentsareusedbytheprimaryfunder;itdoesnottranslateintohowfundingsourceswouldappearonthebalancesheetsofrecipients.First,fundingforinfrastructure(creditbureaus,associations)orforenablingenvironmentwouldnotbeonthebooksofMFIs.Second,fundingoftengoesthroughseveralchannelsbeforeitlandsonthebooksofMFIs,dependingontheintermediarychannelsused.Aloantoagovernment,forexample,mayultimatelyresultinequity,grants,ordebtontheMFI’sbooks.Forindividualandinstitutionalinvestorsthatfundmicrofinancemostlyviaintermediaries,equityinvestmentscapturedinthesurveyrepresenttheinvestmentsinintermediaries(i.e.,MIIs)andnotinMFIs.
7 Today,DFIsarethemainprovidersofMFIs’loancapital,followedbyindividualandinstitutionalinvestors.DFIs(aswellasprivateinvestors)canfundMFIseitherdirectlyorthroughMIIs.
8 outofthe18DFIsthatreportedportfolioinformationtoCGAP,onlythreedidnotshowanysignificantpositivegrowthin2009.
12%
11%
86%
2%
60%
30%
0.5%
1%
21%
14%
78%
8% 0.5%2%
17%
6%
All Funders Mul�lateral andUN Agencies
Bilateral Agencies DFIs Founda�ons and NGOs
Debt Grant Equity
Ins�tu�onal and Individual Investors
Guarantee & other
$5,594 mln$1,116 mln$8,852 mln$1,585 mln$4,166 mln$21,313 mln
Figure 3: Funding instruments by type of funder (based on commitments)
50% 88% 11% 60% 20% 22%
Figure 3: Funding instruments by type of funder (based on commitments)
5
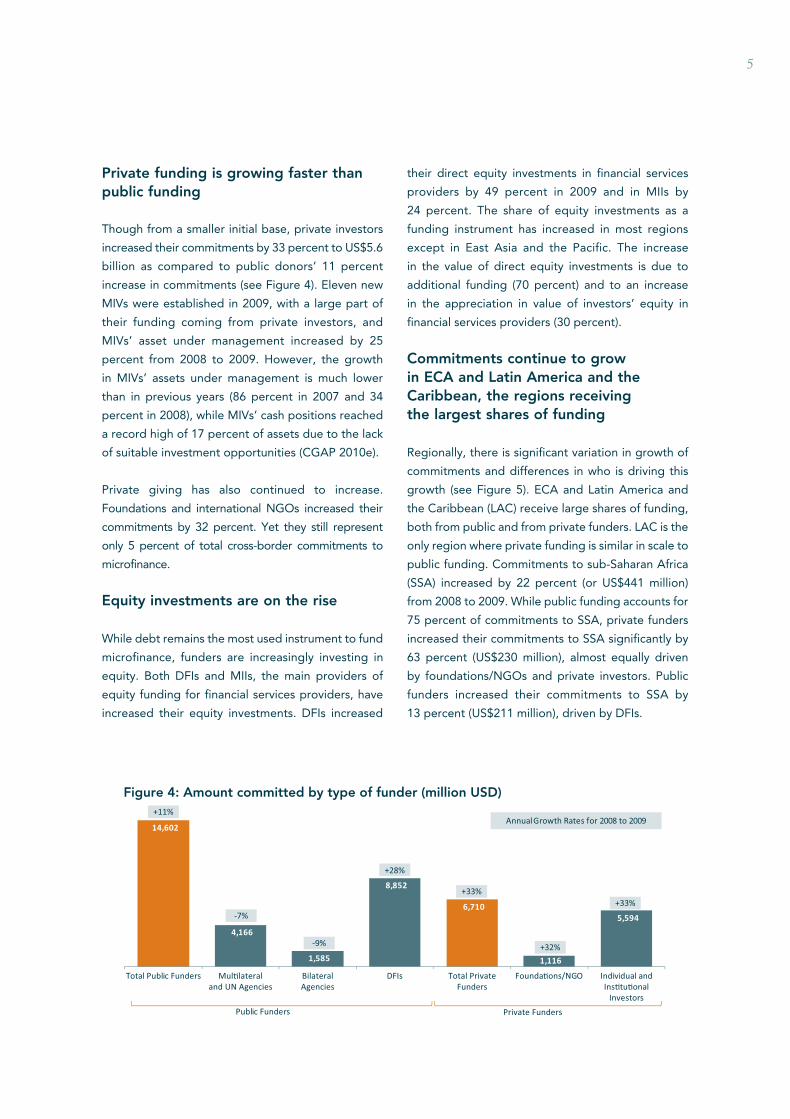
Private funding is growing faster than public funding
Though from a smaller initial base, private investors
increased their commitments by 33 percent to US$5.6
billion as compared to public donors’ 11 percent
increase in commitments (see Figure 4). Eleven new
MIVs were established in 2009, with a large part of
their funding coming from private investors, and
MIVs’ asset under management increased by 25
percent from 2008 to 2009. However, the growth
in MIVs’ assets under management is much lower
than in previous years (86 percent in 2007 and 34
percent in 2008), while MIVs’ cash positions reached
a record high of 17 percent of assets due to the lack
of suitable investment opportunities (CGAP 2010e).
Private giving has also continued to increase.
Foundations and international NGOs increased their
commitments by 32 percent. Yet they still represent
only 5 percent of total cross-border commitments to
microfinance.
Equity investments are on the rise
While debt remains the most used instrument to fund
microfinance, funders are increasingly investing in
equity. Both DFIs and MIIs, the main providers of
equity funding for financial services providers, have
increased their equity investments. DFIs increased
their direct equity investments in financial services
providers by 49 percent in 2009 and in MIIs by
24 percent. The share of equity investments as a
funding instrument has increased in most regions
except in East Asia and the Pacific. The increase
in the value of direct equity investments is due to
additional funding (70 percent) and to an increase
in the appreciation in value of investors’ equity in
financial services providers (30 percent).
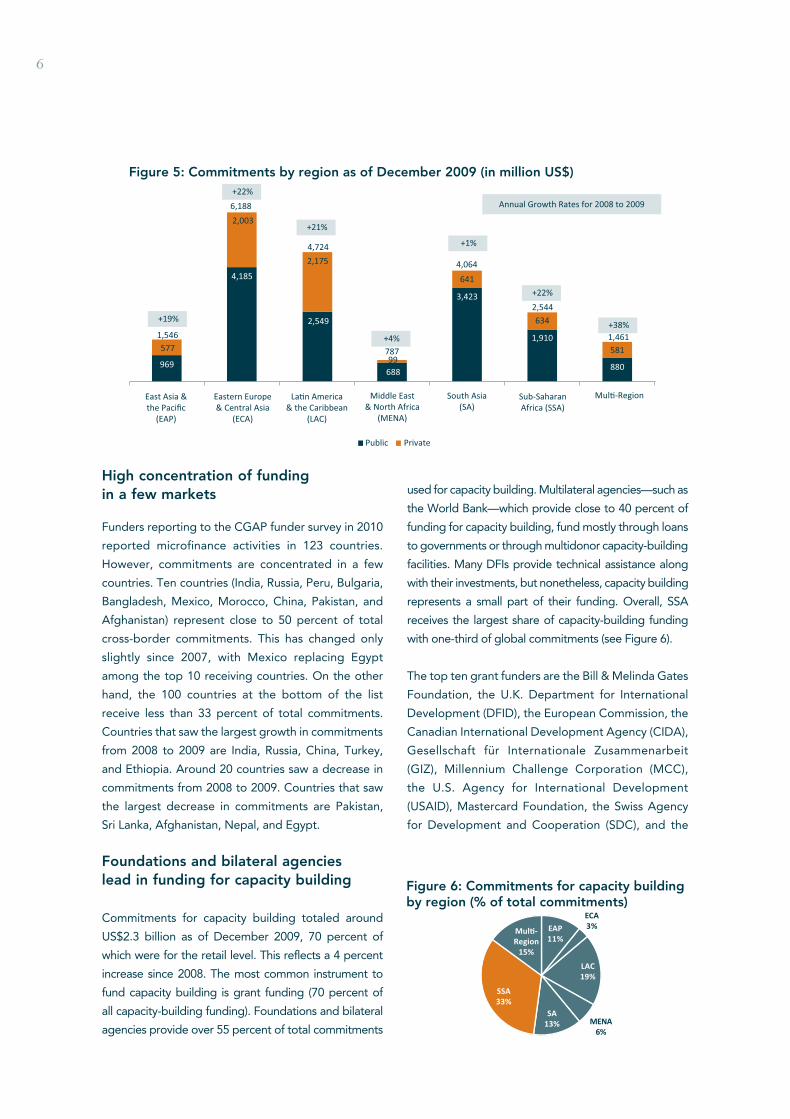
Commitments continue to grow in ECA and Latin America and the Caribbean, the regions receiving the largest shares of funding
Regionally, there is significant variation in growth of
commitments and differences in who is driving this
growth (see Figure 5). ECA and Latin America and
the Caribbean (LAC) receive large shares of funding,
both from public and from private funders. LAC is the
only region where private funding is similar in scale to
public funding. Commitments to sub-Saharan Africa
(SSA) increased by 22 percent (or US$441 million)
from 2008 to 2009. While public funding accounts for
75 percent of commitments to SSA, private funders
increased their commitments to SSA significantly by
63 percent (US$230 million), almost equally driven
by foundations/NGOs and private investors. Public
funders increased their commitments to SSA by
13 percent (US$211 million), driven by DFIs.
14,602
4,166
1,585
8,852
6,710
1,116
5,594
BilateralAgencies
DFIs
Public Funders Private Funders
Figure 4: Commied amount by type of funder (million USD)
Foundaons/NGO Individual andInstuonal
Investors
Total PrivateFunders
Total Public Funders Mullateraland UN Agencies
+11%
+33%
+28%
-9%
-7%+33%
+32%
AnnualGrowth Rates for 2008 to 2009
Figure 4: Amount committed by type of funder (million USD)
6
High concentration of funding in a few markets
Funders reporting to the CGAP funder survey in 2010
reported microfinance activities in 123 countries.
However, commitments are concentrated in a few
countries. Ten countries (India, Russia, Peru, Bulgaria,
Bangladesh, Mexico, Morocco, China, Pakistan, and
Afghanistan) represent close to 50 percent of total
cross-border commitments. This has changed only
slightly since 2007, with Mexico replacing Egypt
among the top 10 receiving countries. On the other
hand, the 100 countries at the bottom of the list
receive less than 33 percent of total commitments.
Countries that saw the largest growth in commitments
from 2008 to 2009 are India, Russia, China, Turkey,
and Ethiopia. Around 20 countries saw a decrease in
commitments from 2008 to 2009. Countries that saw
the largest decrease in commitments are Pakistan,
Sri Lanka, Afghanistan, Nepal, and Egypt.
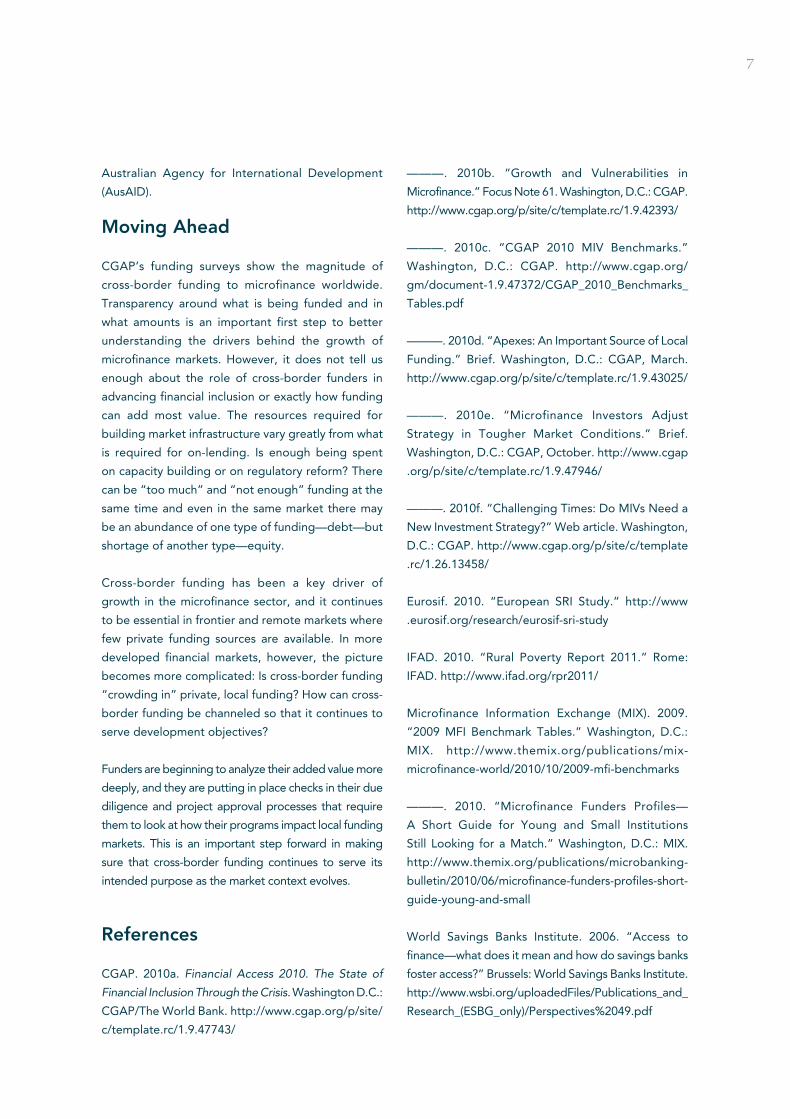
Foundations and bilateral agencies lead in funding for capacity building
Commitments for capacity building totaled around
US$2.3 billion as of December 2009, 70 percent of
which were for the retail level. This reflects a 4 percent
increase since 2008. The most common instrument to
fund capacity building is grant funding (70 percent of
all capacity-building funding). Foundations and bilateral
agencies provide over 55 percent of total commitments
used for capacity building. Multilateral agencies—such as
the World Bank—which provide close to 40 percent of
funding for capacity building, fund mostly through loans
to governments or through multidonor capacity-building
facilities. Many DFIs provide technical assistance along
with their investments, but nonetheless, capacity building
represents a small part of their funding. Overall, SSA
receives the largest share of capacity-building funding
with one-third of global commitments (see Figure 6).
The top ten grant funders are the Bill & Melinda Gates
Foundation, the U.K. Department for International
Development (DFID), the European Commission, the
Canadian International Development Agency (CIDA),
Gesellschaft für Internationale Zusammenarbeit
(GIZ), Millennium Challenge Corporation (MCC),
the U.S. Agency for International Development
(USAID), Mastercard Foundation, the Swiss Agency
for Development and Cooperation (SDC), and the
Figure 5: Commitments by region as of December 2009 (in million US$)
+19%
577
969
+22%
+21%
+4%
641
3,423
99688
2,549
2,175
4,185
2,003
+1%
Annual Growth Rates for 2008 to 2009
+22%
634
1,910+38%
581
880
1,546
6,188
4,724
787
4,064
2,544
1,461
East Asia &the Pacific
(EAP)
Eastern Europe& Central Asia
(ECA)
La�n America& the Caribbean
(LAC)
Middle East& North Africa
(MENA)
South Asia(SA)
Sub-SaharanAfrica (SSA)
Mul�-Region
Public Private
Figure 5: Commitments by region as of December 2009 (in million US$)
Figure 6: Commitments for capacitybuilding by region (% of totalcommitments)
EAP11%
ECA3%
LAC19%
MENA6%
SA13%
SSA33%
Mul�-Region
15%
Figure 6: Commitments for capacity building by region (% of total commitments)
7
Australian Agency for International Development
(AusAID).
Moving Ahead
CGAP’s funding surveys show the magnitude of
cross-border funding to microfinance worldwide.
Transparency around what is being funded and in
what amounts is an important first step to better
understanding the drivers behind the growth of
microfinance markets. However, it does not tell us
enough about the role of cross-border funders in
advancing financial inclusion or exactly how funding
can add most value. The resources required for
building market infrastructure vary greatly from what
is required for on-lending. Is enough being spent
on capacity building or on regulatory reform? There
can be “too much” and “not enough” funding at the
same time and even in the same market there may
be an abundance of one type of funding—debt—but
shortage of another type—equity.
Cross-border funding has been a key driver of
growth in the microfinance sector, and it continues
to be essential in frontier and remote markets where
few private funding sources are available. In more
developed financial markets, however, the picture
becomes more complicated: Is cross-border funding
“crowding in” private, local funding? How can cross-
border funding be channeled so that it continues to
serve development objectives?
Funders are beginning to analyze their added value more
deeply, and they are putting in place checks in their due
diligence and project approval processes that require
them to look at how their programs impact local funding
markets. This is an important step forward in making
sure that cross-border funding continues to serve its
intended purpose as the market context evolves.
References
CGAP. 2010a. Financial Access 2010. The State of
Financial Inclusion Through the Crisis. Washington D.C.:
CGAP/The World Bank. http://www.cgap.org/p/site/
c/template.rc/1.9.47743/
———. 2010b. “Growth and Vulnerabilities in
Microfinance.” Focus Note 61. Washington, D.C.: CGAP.
http://www.cgap.org/p/site/c/template.rc/1.9.42393/
———. 2010c. “CGAP 2010 MIV Benchmarks.”
Washington, D.C.: CGAP. http://www.cgap.org/
gm/document-1.9.47372/CGAP_2010_Benchmarks_
Tables.pdf
———. 2010d. “Apexes: An Important Source of Local
Funding.” Brief. Washington, D.C.: CGAP, March.
http://www.cgap.org/p/site/c/template.rc/1.9.43025/
———. 2010e. “Microfinance Investors Adjust
Strategy in Tougher Market Conditions.” Brief.
Washington, D.C.: CGAP, October. http://www.cgap
.org/p/site/c/template.rc/1.9.47946/
———. 2010f. “Challenging Times: Do MIVs Need a
New Investment Strategy?” Web article. Washington,
D.C.: CGAP. http://www.cgap.org/p/site/c/template
.rc/1.26.13458/
Eurosif. 2010. “European SRI Study.” http://www
.eurosif.org/research/eurosif-sri-study
IFAD. 2010. “Rural Poverty Report 2011.” Rome:
IFAD. http://www.ifad.org/rpr2011/
Microfinance Information Exchange (MIX). 2009.
“2009 MFI Benchmark Tables.” Washington, D.C.:
MIX. http://www.themix.org/publications/mix-
microfinance-world/2010/10/2009-mfi-benchmarks
———. 2010. “Microfinance Funders Profiles—
A Short Guide for Young and Small Institutions
Still Looking for a Match.” Washington, D.C.: MIX.
http://www.themix.org/publications/microbanking-
bulletin/2010/06/microfinance-funders-profiles-short-
guide-young-and-small
World Savings Banks Institute. 2006. “Access to
finance—what does it mean and how do savings banks
foster access?” Brussels: World Savings Banks Institute.
http://www.wsbi.org/uploadedFiles/Publications_and_
Research_(ESBG_only)/Perspectives%2049.pdf
8
9 Commitmentsareusedtoestimatebothcurrentandfuturefundingofmicrofinance(asopposedtoincludingfiguresforactualinvestmentamounts)duetotherelativeavailabilityofthedataascomparedtodataonfundedamounts.However,itisimportanttokeepinmindthedrawbacksofusingcommitmentfigures,includingthemixoffundedandnotyetfundedamounts;themixofdebt,grants,andequity;andtheabsenceofaminimumormaximumtimeperiodforlookingbackwardorforward.
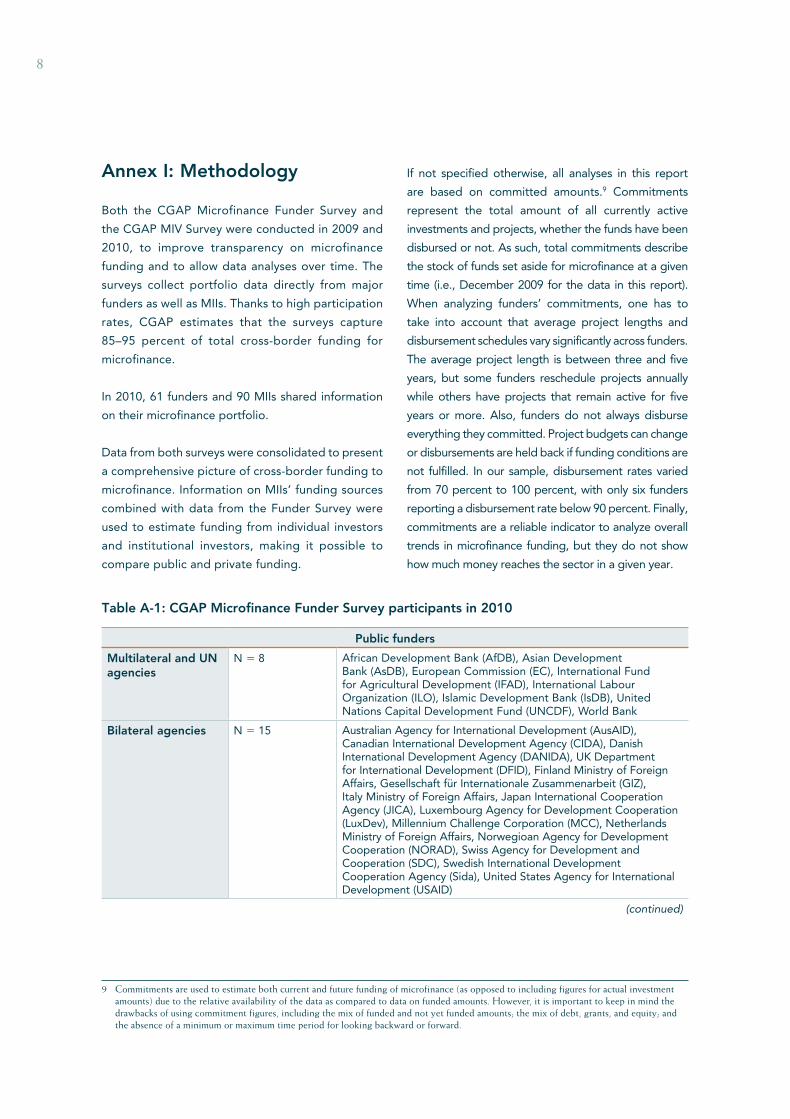
Annex I: Methodology
Both the CGAP Microfinance Funder Survey and
the CGAP MIV Survey were conducted in 2009 and
2010, to improve transparency on microfinance
funding and to allow data analyses over time. The
surveys collect portfolio data directly from major
funders as well as MIIs. Thanks to high participation
rates, CGAP estimates that the surveys capture
85–95 percent of total cross-border funding for
microfinance.
In 2010, 61 funders and 90 MIIs shared information
on their microfinance portfolio.
Data from both surveys were consolidated to present
a comprehensive picture of cross-border funding to
microfinance. Information on MIIs’ funding sources
combined with data from the Funder Survey were
used to estimate funding from individual investors
and institutional investors, making it possible to
compare public and private funding.
If not specified otherwise, all analyses in this report
are based on committed amounts.9 Commitments
represent the total amount of all currently active
investments and projects, whether the funds have been
disbursed or not. As such, total commitments describe
the stock of funds set aside for microfinance at a given
time (i.e., December 2009 for the data in this report).
When analyzing funders’ commitments, one has to
take into account that average project lengths and
disbursement schedules vary significantly across funders.
The average project length is between three and five
years, but some funders reschedule projects annually
while others have projects that remain active for five
years or more. Also, funders do not always disburse
everything they committed. Project budgets can change
or disbursements are held back if funding conditions are
not fulfilled. In our sample, disbursement rates varied
from 70 percent to 100 percent, with only six funders
reporting a disbursement rate below 90 percent. Finally,
commitments are a reliable indicator to analyze overall
trends in microfinance funding, but they do not show
how much money reaches the sector in a given year.
Table A-1: CGAP Microfinance Funder Survey participants in 2010
Public funders
Multilateral and UN agencies
N 5 8 African Development Bank (AfDB), Asian Development Bank (AsDB), European Commission (EC), International Fund for Agricultural Development (IFAD), International Labour Organization (ILO), Islamic Development Bank (IsDB), United Nations Capital Development Fund (UNCDF), World Bank
Bilateral agencies N 5 15 Australian Agency for International Development (AusAID), Canadian International Development Agency (CIDA), Danish International Development Agency (DANIDA), UK Department for International Development (DFID), Finland Ministry of Foreign Affairs, Gesellschaft für Internationale Zusammenarbeit (GIZ), Italy Ministry of Foreign Affairs, Japan International Cooperation Agency (JICA), Luxembourg Agency for Development Cooperation (LuxDev), Millennium Challenge Corporation (MCC), Netherlands Ministry of Foreign Affairs, Norwegioan Agency for Development Cooperation (NORAD), Swiss Agency for Development and Cooperation (SDC), Swedish International Development Cooperation Agency (Sida), United States Agency for International Development (USAID)
(continued)
9
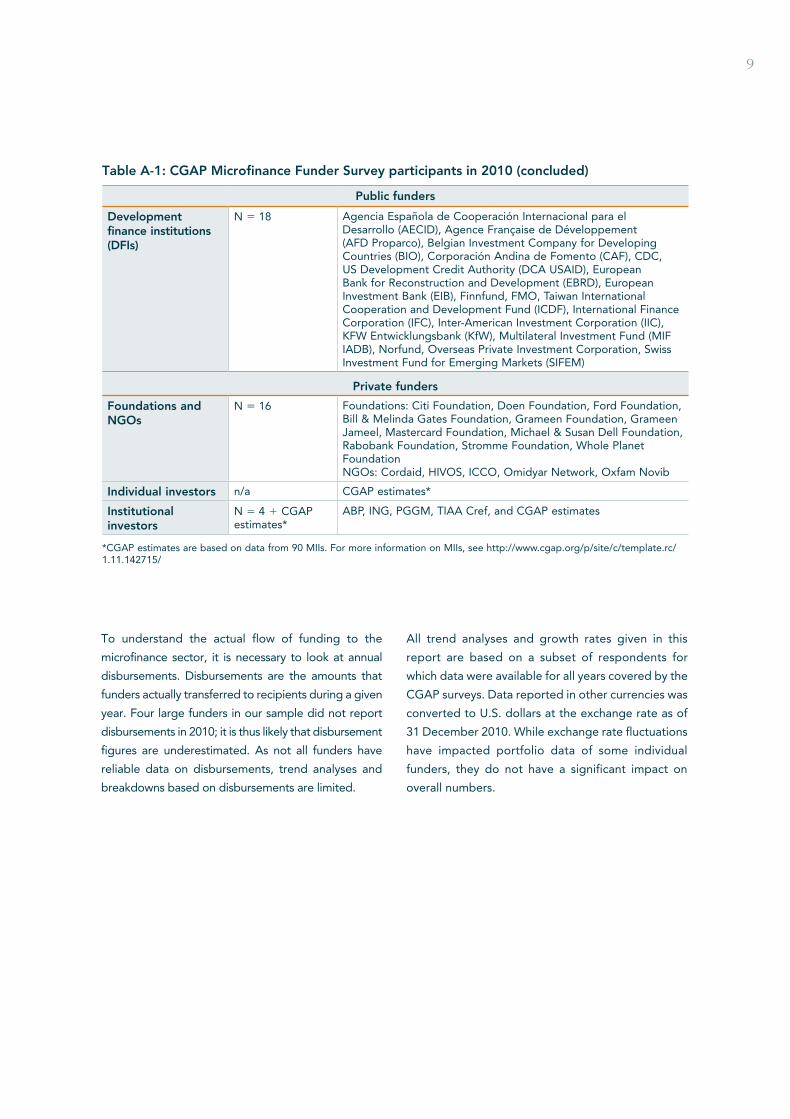
To understand the actual flow of funding to the
microfinance sector, it is necessary to look at annual
disbursements. Disbursements are the amounts that
funders actually transferred to recipients during a given
year. Four large funders in our sample did not report
disbursements in 2010; it is thus likely that disbursement
figures are underestimated. As not all funders have
reliable data on disbursements, trend analyses and
breakdowns based on disbursements are limited.
All trend analyses and growth rates given in this
report are based on a subset of respondents for
which data were available for all years covered by the
CGAP surveys. Data reported in other currencies was
converted to U.S. dollars at the exchange rate as of
31 December 2010. While exchange rate fluctuations
have impacted portfolio data of some individual
funders, they do not have a significant impact on
overall numbers.
Table A-1: CGAP Microfinance Funder Survey participants in 2010 (concluded)
Public funders
Development finance institutions (DFIs)
N 5 18 Agencia Española de Cooperación Internacional para el Desarrollo (AECID), Agence Française de Développement (AFD Proparco), Belgian Investment Company for Developing Countries (BIO), Corporación Andina de Fomento (CAF), CDC, US Development Credit Authority (DCA USAID), European Bank for Reconstruction and Development (EBRD), European Investment Bank (EIB), Finnfund, FMO, Taiwan International Cooperation and Development Fund (ICDF), International Finance Corporation (IFC), Inter-American Investment Corporation (IIC), KFW Entwicklungsbank (KfW), Multilateral Investment Fund (MIF IADB), Norfund, Overseas Private Investment Corporation, Swiss Investment Fund for Emerging Markets (SIFEM)
Private funders
Foundations and NGOs
N 5 16 Foundations: Citi Foundation, Doen Foundation, Ford Foundation, Bill & Melinda Gates Foundation, Grameen Foundation, Grameen Jameel, Mastercard Foundation, Michael & Susan Dell Foundation, Rabobank Foundation, Stromme Foundation, Whole Planet FoundationNGOs: Cordaid, HIVOS, ICCO, Omidyar Network, Oxfam Novib
Individual investors n/a CGAP estimates*
Institutional investors
N 5 4 1 CGAP estimates*
ABP, ING, PGGM, TIAA Cref, and CGAP estimates
*CGAP estimates are based on data from 90 MIIs. For more information on MIIs, see http://www.cgap.org/p/site/c/template.rc/ 1.11.142715/
10
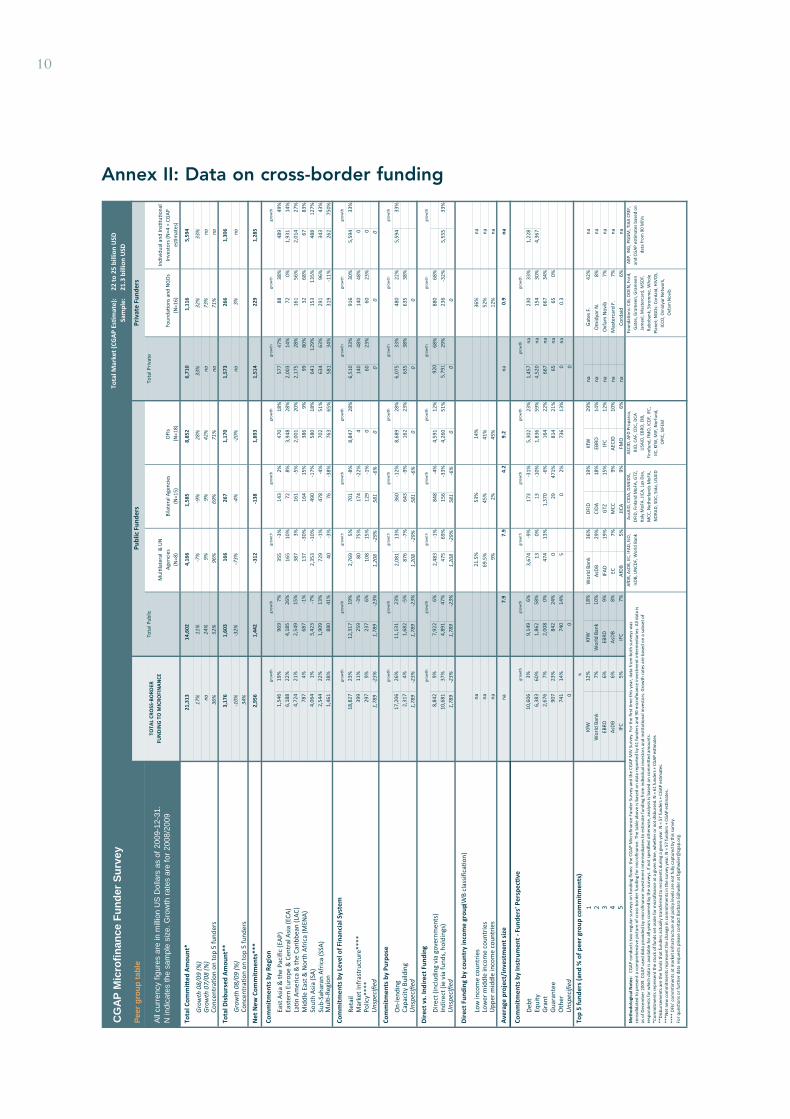
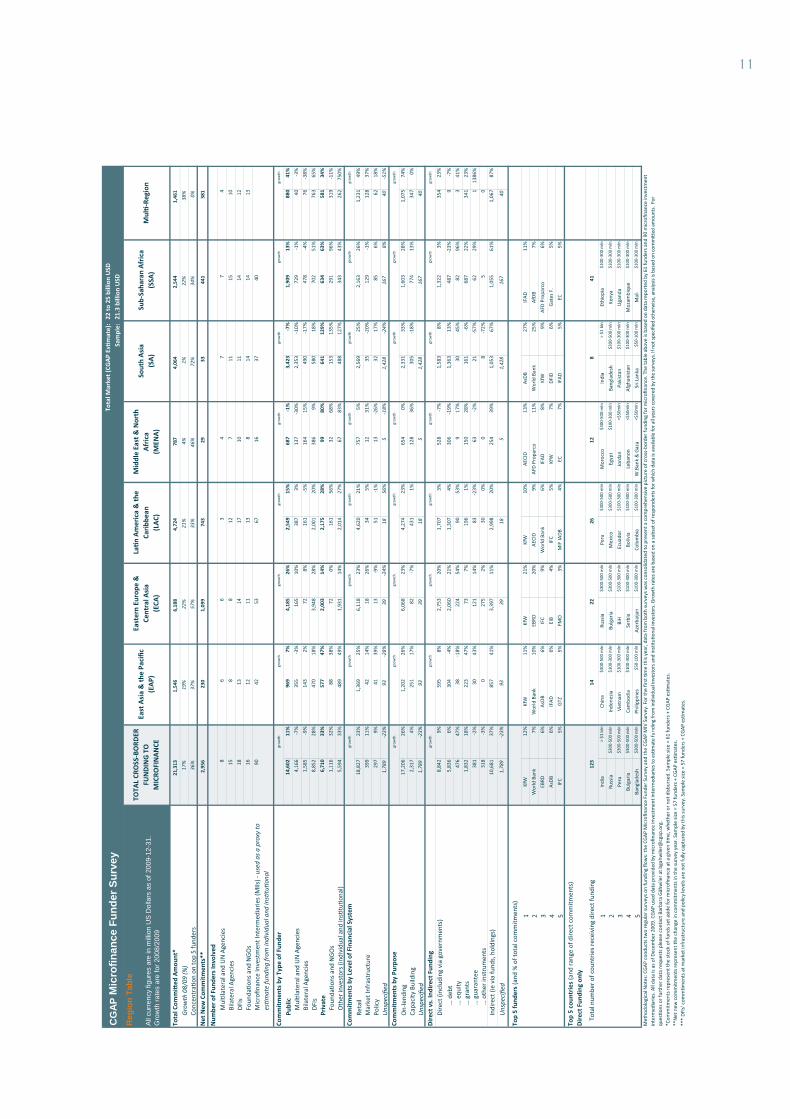
Annex II: Data on cross-border funding
Tota
l Mar
ket
(CG
AP
Es�
mat
e):
22 to
25
billi
on U
SDSa
mpl
e:
21.3
bill
ion
USD
Tota
l Pri
vate
Tota
l Com
mi�
ed A
mou
nt*
21,3
1314
,602
4,16
61,
585
8,85
26,
710
1,11
65,
594
17%
11%
-7%
-9%
28%
33%
32%
33%
na24
%9%
9%42
%na
73%
na
36%
52%
96%
69%
71%
na71
%na
Tota
l Dis
burs
ed A
mou
nt**
3,17
61,
603
166
267
1,17
01,
573
266
1,30
6
-10%
-32%
-73%
-4%
-20%
na3%
na
34%
Net
New
Com
mit
men
ts**
*2,
956
1,44
2-3
12-1
381,
893
1,51
422
91,
285
Com
mit
men
ts b
y Re
gion
grow
thgr
owth
grow
thgr
owth
grow
thgr
owth
grow
thgr
owth
East
Asi
a &
the
Paci
fic (E
AP)
1,54
619
%96
97%
355
-3%
143
2%47
018
%57
747
%88
38%
489
49%
East
ern
Euro
pe &
Cen
tral
Asi
a (E
CA)
6,18
822
%4,
185
26%
165
10%
728%
3,94
828
%2,
003
14%
720%
1,93
114
%
Lan
Am
eric
a &
the
Cari
bbea
n (L
AC)
4,72
421
%2,
549
15%
387
3%16
1-5
%2,
001
20%
2,17
528
%16
156
%2,
014
27%
Mid
dle
East
& N
orth
Afr
ica
(MEN
A)
787
4%68
7-1
%13
7-3
0%16
415
%38
69%
9980
%32
68%
6783
%
Sout
h A
sia
(SA
)4,
064
1%3,
423
-7%
2,35
3-1
0%49
0-1
7%58
018
%64
112
9%15
313
5%48
812
7%
Sub-
Saha
ran
Afr
ica
(SSA
)2,
544
22%
1,90
913
%72
9-1
%47
8-4
%70
251
%63
463
%29
196
%34
343
%M
ul-
Regi
on1,
461
38%
880
41%
40-3
%76
-38%
763
65%
581
34%
319
-11%
262
750%
Com
mit
men
ts b
y Le
vel o
f Fin
anci
al S
yste
mgr
owth
grow
thgr
owth
grow
thgr
owth
grow
thgr
owth
grow
th
Reta
il18
,827
23%
12,3
1719
%2,
769
5%70
1-8
%8,
847
28%
6,51
033
%91
630
%5,
594
33%
Mar
ket I
nfra
stru
ctur
e***
*39
911
%25
9-3
%80
75%
174
-22%
414
048
%14
048
%0
Polic
y***
*29
79%
237
6%10
815
%12
9-1
%0
6023
%60
23%
0U
nspe
cifie
d1,
789
-23%
1,78
9-2
3%1,
208
-29%
581
-6%
00
00
Com
mit
men
ts b
y Pu
rpos
egr
owth
grow
thgr
owth
grow
thgr
owth
grow
thgr
owth
grow
th
On-
lend
ing
17,2
0626
%11
,131
23%
2,08
113
%36
0-1
2%8,
689
28%
6,07
533
%48
022
%5,
594
33%
Capa
city
Bui
ldin
g2,
317
4%1,
682
-5%
876
-7%
643
-9%
162
23%
635
38%
635
38%
Uns
peci
fied
1,78
9-2
3%1,
789
-23%
1,20
8-2
9%58
1-6
%0
00
Dir
ect
vs. I
ndir
ect
Fund
ing
grow
thgr
owth
grow
thgr
owth
grow
thgr
owth
grow
thgr
owth
Dir
ect (
incl
udin
g vi
a go
vern
men
ts)
8,84
29%
7,92
26%
2,48
3-1
%84
8-4
%4,
591
12%
920
68%
880
68%
Indi
rect
(ie
via
fund
s, h
oldi
ngs)
10,6
8137
%4,
891
47%
475
69%
156
-33%
4,26
051
%5,
791
29%
236
-32%
5,55
533
%U
nspe
cifie
d1,
789
-23%
1,78
9-2
3%1,
208
-29%
581
-6%
00
0
Dir
ect
Fund
ing
by c
ount
ry in
com
e gr
oup (
WB
clas
sific
aon
)
Low
inco
me
coun
trie
sna
21.5
%53
%14
%36
%na
Low
er m
iddl
e in
com
e co
untr
ies
na69
.5%
45%
41%
52%
naU
pper
mid
dle
inco
me
coun
trie
sna
9%2%
45%
12%
na
Ave
rage
pro
ject
/inv
estm
ent
size
nana
0.9
na
Com
mit
men
ts b
y In
stru
men
t - F
unde
rs' P
ersp
ec�
vegr
owth
grow
thgr
owth
grow
thgr
owth
grow
thgr
owth
Deb
t10
,606
3%9,
149
6%3,
674
-9%
173
-31%
5,30
223
%1,
457
na23
033
%1,
228
Equi
ty6,
383
60%
1,86
258
%13
0%13
-10%
1,83
659
%4,
520
na15
430
%4,
367
Gra
nt2,
676
7%2,
008
0%47
413
%1,
370
-6%
164
22%
667
na66
734
%
Gua
rant
ee90
723
%84
224
%0
2947
1%81
421
%65
na65
0%O
ther
741
14%
740
14%
50
2%73
613
%0
na0.
3U
nspe
cifie
d0
00
Top
5 fu
nder
s (a
nd %
of p
eer
grou
p co
mm
itm
ents
)%
1Kf
W12
%Kf
W18
%W
orld
Ban
k36
%D
FID
19%
KfW
29%
naG
ates
F.
42%
na
2W
orld
Ban
k7%
Wor
ld B
ank
10%
AsD
B29
%CI
DA
18%
EBRD
14%
naO
mid
yar N
.8%
na
3EB
RD6%
EBRD
9%IF
AD
19%
GTZ
15%
IFC
12%
naO
xfam
Nov
ib7%
na
4A
sDB
6%A
sDB
8%EC
7%M
CC9%
AEC
ID10
%na
Mas
terc
ard
F.7%
na5
IFC
5%IF
C7%
AfD
B5%
JICA
9%FM
O6%
naCo
rdai
d6%
na
Priv
ate
Fund
ers
Tota
l Pub
lic
Mul
�lat
eral
& U
N
Age
ncie
s(N
=8)
Bila
tera
l Age
ncie
s(N
=15)
DFI
s (N
=18)
Foun
da�o
ns a
nd N
GO
s(N
=16)
Pee
r g
rou
p t
able
All
curr
ency
fig
ures
are
in m
illio
n U
S D
olla
rs a
s of
200
9-12
-31.
N
indi
cate
s th
e sa
mpl
e si
ze. G
row
th r
ates
are
for
200
8/20
09
TOTA
L CR
OSS
-BO
RDER
FU
ND
ING
TO
MIC
ROFI
NA
NCE
Publ
ic F
unde
rs
7.9
7.9
4.2
9.2
Foun
da�o
ns: C
i�, D
OEN
, For
d,
Gat
es, G
ram
een,
Gra
mee
n Ja
mee
l, M
aste
rcar
d, M
SDF,
Ra
boba
nk, S
trom
me,
Who
le
Plan
et; N
GO
s: C
orda
id, H
IVO
S,
ICCO
, Om
idya
r Net
wor
k,
Oxf
am N
ovib
ABP
, IN
G, P
GG
M, T
IAA
CRE
F,
and
CGA
P es
�mat
es b
ased
on
data
from
90
MIV
s
Indi
vidu
al a
nd In
s�tu
�ona
l In
vest
ors
(N=4
+ C
GA
P es
�mat
es)
AfD
B, A
sDB,
EC,
IFA
D, I
LO,
IsD
B, U
NCD
F, W
orld
Ban
kA
usA
ID, C
IDA
, DA
NID
A,
DFI
D, F
inla
nd M
oFA
, GTZ
, It
aly
MoF
A, J
ICA
, Lux
Dev
, M
CC, N
ethe
rland
s M
oFA
, N
ORA
D, S
DC,
Sid
a, U
SAID
AEC
ID, A
FD P
ropa
rco,
BI
O, C
AF,
CD
C, D
CA
USA
ID, E
BRD
, EIB
, Fi
nnfu
nd, F
MO
, ICD
F, IF
C,
IIC, K
fW, M
IF, N
orfu
nd,
OPI
C, S
IFEM
CG
AP
Mic
rofi
nan
ce F
un
der
Su
rvey
Gro
wth
08/
09 (%
)G
row
th 0
7/08
(%)
Conc
entr
a�on
on
top
5 fu
nder
s
Gro
wth
08/
09 (%
)Co
ncen
tra�
on o
n to
p 5
fund
ers
Met
hodo
logi
cal N
otes
: C
GA
P co
nduc
ts tw
o re
gula
r su
rvey
s on
fund
ing
flow
s: th
e CG
AP
Mic
rofin
ance
Fun
der
Surv
ey a
nd th
e CG
AP
MIV
Sur
vey.
For
the
first
�m
e th
is y
ear,
dat
a fr
om b
oth
surv
eys
was
co
nsol
idat
ed to
pre
sent
a c
ompr
ehen
sive
pic
ture
of c
ross
-bor
der
fund
ing
for
mic
rofin
ance
. The
tabl
e ab
ove
is b
ased
on
data
rep
orte
d by
61
fund
ers
and
90 m
icro
finan
ce in
vest
men
t int
erm
edia
ries
. All
data
is
as o
f Dec
embe
r 20
09. C
GA
P us
ed d
ata
prov
ided
by
mic
rofin
ance
inve
stm
ent i
nter
med
iari
es to
es�
mat
e fu
ndin
g fr
om in
divi
dual
inve
stor
s an
d in
s�tu
�ona
l inv
esto
rs. G
row
th r
ates
are
bas
ed o
n a
subs
et o
f re
spon
dent
s fo
r w
hich
dat
a is
ava
ilabl
e fo
r al
l yea
rs c
over
ed b
y th
e su
rvey
s. If
not
spe
cifie
d ot
herw
ise,
ana
lysi
s is
bas
ed o
n co
mm
i§ed
am
ount
s.*C
omm
itmen
ts re
pres
ent t
he s
tock
of f
unds
set
asi
de fo
r mic
rofin
ance
at a
giv
en �
me,
whe
ther
or n
ot d
isbu
rsed
. N =
61
fund
ers
+ CG
AP e
s�m
ates
**D
isbu
rsem
ents
are
the
fund
s th
at fu
nder
s ac
tual
ly tr
ansf
erre
d to
reci
pien
ts d
urin
g a
give
n ye
ar. N
= 5
7 fu
nder
s +
CGAP
es�
mat
es.
***N
et n
ew c
omm
itmen
ts re
pres
ent t
he c
hang
e in
com
mitm
ents
in th
e su
rvey
yea
r. N
= 5
7 fu
nder
s +
CGAP
es�
mat
es.
****
DFI
s' c
omm
�men
ts a
t mar
ket i
nfra
stru
ctur
e an
d po
licy
leve
ls a
re n
ot fu
lly c
aptu
red
by th
is s
urve
y.Fo
r qu
es�o
ns o
r fur
ther
dat
a re
ques
ts p
leas
e co
ntac
t Bar
bara
Gäh
wile
r at b
gahw
iler@
cgap
.org
.
11
Tota
l Mar
ket
(CG
AP
Es�
mat
e):
22 to
25
billi
on U
SDSa
mpl
e:
21.3
bill
ion
USD
Tota
l Com
mi�
ed A
mou
nt*
21,3
131,
546
6,18
84,
724
787
4,06
42,
544
1,46
1
Gro
wth
08/
09 (%
)17
%19
%22
%21
%4%
1%22
%38
%
Conc
entr
a�on
on
top
5 fu
nder
s36
%37
%57
%33
%46
%72
%34
%0%
Net
New
Com
mit
men
ts**
2,95
623
01,
099
743
2933
441
381
Num
ber
of F
unde
rs In
volv
edM
ul�l
ater
al a
nd U
N A
genc
ies
86
63
47
74
Bila
tera
l Age
ncie
s15
88
127
1115
10
DFI
s18
1314
1710
1114
12
Foun
da�o
ns a
nd N
GO
s16
1211
138
1414
13
Mic
rofin
ance
Inve
stm
ent I
nter
med
iari
es (M
IIs) -
use
d as
a p
roxy
to
es�m
ate
fund
ing
from
indi
vidu
al a
nd in
s�tu
�ona
l
9042
5367
1637
40
Com
mit
men
ts b
y Ty
pe o
f Fun
der
grow
thgr
owth
grow
thgr
owth
grow
thgr
owth
grow
thgr
owth
Publ
ic14
,602
11%
969
7%4,
185
26%
2,54
915
%68
7-1
%3,
423
-7%
1,90
913
%88
041
%
Mul
�lat
eral
and
UN
Age
ncie
s4,
166
-7%
355
-3%
165
10%
387
3%13
7-3
0%2,
353
-10%
729
-1%
40-3
%
Bila
tera
l Age
ncie
s1,
585
-9%
143
2%72
8%16
1-5
%16
415
%49
0-1
7%47
8-4
%76
-38%
DFI
s8,
852
28%
470
18%
3,94
828
%2,
001
20%
386
9%58
018
%70
251
%76
365
%
Priv
ate
6,71
033
%57
747
%2,
003
14%
2,17
528
%99
80%
641
129%
634
63%
581
34%
Foun
dao
ns a
nd N
GO
s1,
116
32%
8838
%72
0%16
156
%32
68%
153
135%
291
96%
319
-11%
Oth
er in
vest
ors
(indi
vidu
al a
nd in
stu
ona
l)5,
594
33%
489
49%
1,93
114
%2,
014
27%
6783
%48
812
7%34
343
%26
275
0%
Com
mit
men
ts b
y Le
vel o
f Fin
anci
al S
yste
mgr
owth
grow
thgr
owth
grow
thgr
owth
grow
thgr
owth
grow
th
Reta
il18
,827
23%
1,36
925
%6,
118
23%
4,62
021
%75
75%
2,56
925
%2,
163
26%
1,23
149
%
Mar
ket I
nfra
stru
ctur
e39
911
%42
14%
1826
%34
5%12
31%
35-2
0%12
9-1
%12
837
%
Polic
y29
79%
4139
%13
-9%
51-1
%13
-26%
3217
%85
6%62
18%
Uns
peci
fied
1,78
9-2
3%93
-28%
39-2
4%18
56%
5-1
8%1,
428
-24%
167
8%40
-51%
Com
mit
men
ts b
y Pu
rpos
egr
owth
grow
thgr
owth
grow
thgr
owth
grow
thgr
owth
grow
th
On-
lend
ing
17,2
0626
%1,
202
26%
6,06
823
%4,
274
23%
654
0%2,
331
33%
1,60
328
%1,
075
74%
Capa
city
Bui
ldin
g2,
317
4%25
117
%82
-7%
431
1%12
836
%30
5-1
8%77
413
%34
70%
Uns
peci
fied
1,78
9-2
3%93
3918
51,
428
167
40
Dir
ect
vs. I
ndir
ect
Fund
ing
grow
thgr
owth
grow
thgr
owth
grow
thgr
owth
grow
thgr
owth
Dir
ect (
incl
udin
g vi
a go
vern
men
ts)
8,84
29%
595
8%2,
753
20%
1,70
73%
528
-7%
1,58
38%
1,32
23%
354
23%
… d
ebt
5,83
66%
304
-4%
2,06
021
%1,
307
4%30
6-1
9%1,
363
13%
487
-23%
9-7
%
… e
quity
476
47%
38-1
8%22
454
%90
53%
917
%30
45%
8296
%3
41%
… g
rant
s1,
832
18%
223
47%
737%
196
1%15
028
%16
1-6
%68
722
%34
123
%
… g
uara
ntee
381
-2%
3043
%12
114
%83
-23%
63-2
%21
-57%
6229
%1
1386
%
… o
ther
inst
rum
ents
318
-3%
027
52%
300%
08
-72%
50
Indi
rect
(ie
via
fund
s, h
oldi
ngs)
10,6
8137
%85
741
%3,
397
11%
2,99
820
%25
439
%1,
053
67%
1,05
561
%1,
067
87%
Uns
peci
fied
1,78
9-2
3%93
3918
51,
428
167
40
Top
5 fu
nder
s (a
nd %
of t
otal
com
mitm
ents
)
1Kf
W12
%Kf
W11
%Kf
W21
%Kf
W10
%A
ECID
13%
AsD
B27
%IF
AD
11%
2W
orld
Ban
k7%
Wor
ld B
ank
10%
EBRD
20%
AEC
ID9%
AFD
Pro
parc
o11
%W
orld
Ban
k25
%A
fDB
7%
3EB
RD6%
AsD
B6%
IFC
9%W
orld
Ban
k6%
IFA
D8%
KfW
9%A
FD P
ropa
rco
6%
4A
sDB
6%IF
AD
6%EI
B4%
IFC
5%Kf
W7%
DFI
D6%
Gat
es F
. 5%
5IF
C5%
GTZ
5%FM
O3%
MIF
IAD
B4%
EC7%
IFA
D5%
EC5%
Top
5 co
untr
ies
(and
ran
ge o
f dir
ect c
omm
itmen
ts)
Dir
ect
Fund
ing
only
Tota
l num
ber
of c
ount
ries
rec
eivi
ng d
irec
t fun
ding
123
1422
2612
841
1In
dia
> $1
bln
Chin
a$3
00-5
00 m
lnRu
ssia
$300
-500
mln
Peru
$300
-500
mln
Mor
occo
$300
-500
mln
Indi
a>
$1 b
lnEt
hiop
ia$1
00-3
00 m
ln
2Ru
ssia
$300
-500
mln
Indo
nesi
a$1
00-3
00 m
lnBu
lgar
ia$3
00-5
00 m
lnM
exic
o$3
00-5
00 m
lnEg
ypt
$100
-300
mln
Bang
lade
sh$3
00-5
00 m
lnKe
nya
$100
-300
mln
3Pe
ru$3
00-5
00 m
lnVi
etna
m$1
00-3
00 m
lnBi
H$1
00-3
00 m
lnEc
uado
r$1
00-3
00 m
lnJo
rdan
<$50
mln
Paki
stan
$100
-300
mln
Uga
nda
$100
-300
mln
4Bu
lgar
ia$3
00-5
00 m
lnCa
mbo
dia
$100
-300
mln
Serb
ia$1
00-3
00 m
lnBo
livia
$100
-300
mln
Leba
non
<$50
mln
Afg
hani
stan
$100
-300
mln
Moz
ambi
que
$100
-300
mln
5Ba
ngla
desh
$300
-500
mln
Phili
ppin
es$5
0-10
0 m
lnA
zerb
aija
n$1
00-3
00 m
lnCo
lom
bia
$100
-300
mln
W.B
ank
& G
aza
<$50
mln
Sri L
anka
$50-
100
mln
Mal
i$1
00-3
00 m
ln
Met
hodo
logi
cal N
otes
: CG
AP
cond
ucts
two
regu
lar s
urve
ys o
n fu
ndin
g flo
ws:
the
CGA
P M
icro
finan
ce F
unde
r Sur
vey
and
the
CGA
P M
IV S
urve
y. F
or th
e fir
st
me
this
yea
r, d
ata
from
bot
h su
rvey
s w
as c
onso
lidat
ed to
pre
sent
a c
ompr
ehen
sive
pic
ture
of c
ross
-bor
der f
undi
ng fo
r mic
rofin
ance
. The
tabl
e ab
ove
is b
ased
on
data
repo
rted
by
61 fu
nder
s an
d 90
mic
rofin
ance
inve
stm
ent
inte
rmed
iarie
s. A
ll da
ta is
as
of D
ecem
ber 2
009.
CG
AP u
sed
data
pro
vide
d by
mic
rofin
ance
inve
stm
ent i
nter
med
iarie
s to
es
mat
e fu
ndin
g fr
om in
divi
dual
inve
stor
s an
d in
stu
ona
l inv
esto
rs. G
row
th ra
tes
are
base
d on
a s
ubse
t of r
espo
nden
ts fo
r whi
ch d
ata
is a
vaila
ble
for a
ll ye
ars
cove
red
by th
e su
rvey
s. If
not
spe
cifie
d ot
herw
ise,
ana
lysi
s is
bas
ed o
n co
mm
iªed
am
ount
s. F
or
ques
ons
or f
urth
er d
ata
requ
ests
ple
ase
cont
act B
arba
ra G
ähw
iler a
t bga
hwile
r@cg
ap.o
rg.
*Com
mitm
ents
repr
esen
t the
sto
ck o
f fun
ds s
et a
side
for m
icro
finan
ce a
t a g
iven
m
e, w
heth
er o
r not
dis
burs
ed. S
ampl
e si
ze =
61
fund
ers
+ CG
AP
esm
ates
.**
Net
new
com
mitm
ents
repr
esen
t the
cha
nge
in c
omm
itmen
ts in
the
surv
ey y
ear.
Sam
ple
size
= 5
7 fu
nder
s +
CGA
P es
mat
es.
***
DFI
s' c
omm
men
ts a
t mar
ket i
nfra
stru
ctur
e an
d po
licy
leve
ls a
re n
ot fu
lly c
aptu
red
by th
is s
urve
y. S
ampl
e si
ze =
57
fund
ers
+ CG
AP e
sm
ates
.
La�
n A
mer
ica
& t
he
Cari
bbea
n (L
AC)
CG
AP
Mic
rofi
nan
ce F
un
der
Su
rvey
Reg
ion
Tab
le
All
curr
ency
fig
ures
are
in m
illio
n U
S D
olla
rs a
s of
200
9-12
-31.
G
row
th r
ates
are
for
200
8/20
09
TOTA
L CR
OSS
-BO
RDER
FU
ND
ING
TO
M
ICRO
FIN
AN
CE
East
Asi
a &
the
Pac
ific
(EA
P)
East
ern
Euro
pe &
Ce
ntra
l Asi
a(E
CA)
Mid
dle
East
& N
orth
A
fric
a (M
ENA
)
Sout
h A
sia
(SA
)Su
b-Sa
hara
n A
fric
a (S
SA)
Mul
�-R
egio
n
12
The authors of this Focus Note are Mayada El-Zoghbi, CGAP senior microfinance specialist, Barbara Gähwiler, CGAP microfinance analyst, and Kate Lauer, CGAP consultant. The authors thank Jasmina
Glisovic, Alice Nègre, and Xavier Reille for their contributions to this Focus Note.
The suggested citation for this Focus Note is as follows:El-Zoghbi, Mayada, Barbara Gähwiler, and Kate Lauer. 2011. “Cross-Border Funding of Microfinance.” Focus Note 70. Washington, D.C., April.
No. 70April 2011
Please share thisFocus Note with yourcolleagues or request
extra copies of thispaper or others in
this series.
CGAP welcomesyour comments on
this paper.
All CGAP publicationsare available on the
CGAP Web site atwww.cgap.org.
CGAP1818 H Street, NW
MSN P3-300Washington, DC
20433 USA
Tel: 202-473-9594Fax: 202-522-3744
Email:[email protected]
© CGAP, 2011